measuring the un-measurable - unu collections
TRANSCRIPT

No. 5/2006
Measuring the Un-MeasurableThe Challenge of Vulnerability
Jörn Birkmann & Ben Wisner

UNU Institute for Environment and Human Security (UNU-EHS)UN CampusHermann-Ehlers-Str. 10D-53113 Bonn, Germany
Copyright UNU-EHS 2006
Cover design by Gerd ZschäbitzCopy editors: Ilona Roberts, Carlota SchneiderPrinted at Paffenholz, Bornheim, Germany
The views expressed in this publication are those of the author(s).Publication does not imply endorsement by the UNU-EHS or the United Nations University of any of the views expressed.
ISBN: 3-9810582-6-7 (printed version)ISBN: 3-9810582-7-5 (electronic version)ISSN: 1816-1154

SOURCE‘Studies of the University:Research, Counsel, Education’
Publication Series of UNU-EHS
No. 5/2006
1

2
About the Authors
Dr.-Ing. Jörn Birkmann is Academic Officer at the UNITED NATIONSUNIVERSITY Institute for Environment and Human Security.He holds aPhD in Spatial Planning from the Dortmund University as well as alicense as urban planner. He has broad expertise in the field of vulner-ability, sustainable development and environmental assessment. AtUNU-EHS he is responsible for the area of vulnerability assessment.His research area encompasses the development of methodologiesto identify and measure vulnerability and coping capacity of so-cieties, economies and the environment to hazards of natural origin.His work experience also encompasses research activities and lecturesaround the globe, for example in London and Mexico.
Prof. Dr. Ben Wisner is a geographer (environmental social scientist)and philosopher/ethicist of world wide reputation in disaster reduc-tion. He currently commutes between continents as visiting professorand researcher, working also as Senior Consultant for UNU-EHS since2005. By virtue of his wealth of experience, B. Wisner’s contributionsinclude, but are not limited to, the provision of expert counsel to theInstitute’s Academic Officers on field-related research and publica-tions. He holds honorary & visiting appointments in DevelopmentStudies, London School of Economics, Benfield Hazard Research Cen-tre, University College London, Institute for Disaster and Public Securi-ty, Beijing Normal University, and Environmental Studies Program,Oberlin College.Among other activities,Wisner is a founding memberof COGSS (Coalition for Global School Safety), advisor to Reuters Alert-Net, and consultant to the ProVention Consortium.

Measuring the Un-Measurable
The Challenge of Vulnerability
Jörn Birkmann & Ben Wisner
Report of the Second Meeting of the UNU-EHS Expert Working Group onMeasuring Vulnerability
12-14 October 2005, Bonn, Germany
3
Acknowledgements
Of course, putting this publication together would not have been possible without the immenseamount of behind-the-scenes work done. We are extremely grateful to N. Gebert, M. Garschagen and C. Ergler for their support in the transcription of the discussions and presentations, as well as for thenotes taken by D. Alexander and others, which allowed us to focus and reflect on major points of thediscourse.
Many thanks also to all the contributors from the 24 countries involved in the second Expert WorkingGroup meeting. Furthermore, we would like to express our deep gratitude to the organizers and supporters of the UNU-EHS Expert Working Group, particularly U. Kastrup and J. Bogardi, C. Schneider,I. Roberts, V. Liaukonyte, and S. Zimmermann for their organizational and logistical support. Finally, wewant to thank C. Schneider and I. Roberts for their copy editing work for this report.
4

Foreword
Measuring the Un-Measurable – is a short and succinct title as well as an indication of the challengesand difficulties in deriving appropriate methodologies, indicators and criteria to identify, measure andassess vulnerabilities of societies at risk.The most recent mega-events, the 2004 Indian Ocean tsunamiand hurricane Katrina in 2005 certainly revealed the vulnerability of societies – in developing anddeveloped countries – to the impact of natural hazards. Improving risk reduction and disaster preparedness requires first and foremost the identification and assessment of various vulnerabilities ofsocieties, their economy, environmental resource base, and their institutional structures. Thus for effective preparedness strategies and sustainable recovery the development of tools to measure vulnerability is a prerequisite. It is important to note that this requirement formulated and agreed uponby professionals received strong political endorsement. Following the World Conference for DisasterReduction in Kobe 2005, the intergovernmental, negotiated Hyogo Framework for Action (UN 2005)identifies the development of indicators to measure vulnerability and risk and their reduction as majorchallenges for the future.Thus being piece and parcel of the Hyogo Framework of Action vulnerabilityassessment became a major task for the UN System and consequently an obligation for UNU-EHS toconcentrate its research activities in this area.
One of the contributions of the UNITED NATIONS UNIVERSITY Institute for Environment and HumanSecurity (UNU-EHS) to the implementation of the Hyogo Framework of Action is to call upon the inter-national community of scholars and professionals to form an international Expert Working Group onMeasuring Vulnerability (EWG). The main focus of the international EWG is to provide a platform forexchange of different concepts on how to measure and assess vulnerability in its various dimensionsand at different scales in different regions of the world. EWG serves as a think tank and forum fordifferent schools of thought on the topic. EWG was literally launched with a first meeting in Kobe inJanuary 2005, immediately after the World Conference on Disaster Reduction (WCDR). A second meetingof the EWG was held in Bonn within the framework of the IHDP Open meeting (International HumanDimensions Programme on Global Environmental Change) in October 2005. Papers discussed duringthe second meeting of EWG plus a number of invited contributions have been edited into a state-of-the-art book on “Measuring Vulnerability to Natural Hazards – Towards Disaster Resilient Societies”which was published by UNU-Press in October 2006. The present issue of SOURCE summarizes themain lines of the discussion and documents the second meeting of the EWG. While it refrains formbecoming a traditional proceeding, it fully captures the quintessence of discussions and the spirit ofthe meeting experienced and shaped by 52 participants and over the 100 head strong audience of theopen presentation part of the first day.
This SOURCE publication is an essential reading for those interested in vulnerability research and theassessment and measurement of it.The publication by J. Birkmann and B.Wisner leads us through thethematic areas which were discussed, outlines the different scales of the assessment approachespresented, and analyses the nature of vulnerability measurement. In this context the term “measuringvulnerability”does not solely encompass quantitative approaches. It also seeks to discuss and developall types of methods able to translate the abstract concept of vulnerability into practical tools, classifi-cations and comparative judgments to be applied in the field. Therefore, the publication is wellbalanced in this discussion of quantitative and qualitative approaches. Case studies gave particularemphasis to current disasters and the respective vulnerabilities, such as the vulnerabilities disclosed intsunami devastated in Sri Lanka, the vulnerability of coastal communities in the US Gulf Coast revealedthrough the passage of hurricane Katrina, the recent floods in Russia in the Volga region, and thevulnerability assessment undertaken in Tanzania covering multiple hazards.Vivid discussions emerged– and reported – around the novel topics like how to capture institutional and environmental vulner-ability – issues which have not been investigated in depth in the past. Conclusions summarize urgent
5

6
research needs. The recommendations provide a valuable source of ideas for future research projectsand particular aspects to be considered when aiming to measure the un-measurable.
I am particularly indebted to the authors of this volume. Dr. Jörn Birkmann, Academic Officer of UNU-EHS does not only serve as the able “secretary general” of the EWG since its conception but hasrepeatedly proven his ability to address major research challenges, to capture debates, summarize findings, and to document workshops, thus making the experience of a privileged few to the informa-tion and knowledge of many. Prof. Ben Wisner is both a well-known scholar and practitioner in thesubject areas addressed in this publication. He is a member of the UNU-EHS College of AssociatedScientists and Advisors (CASA), thus helping our young Institute in its efforts in vulnerability research.His trademark enthusiasm, analysing and debating spirit, and dedication to bring vulnerability scienceforward gave a great deal of authenticity to this unique issue of SOURCE.Without his contributions thetext might have reflected but not tell the story of the second meeting of the EWG in October 2005.
Janos J. BogardiDirector UNU-EHS

7
Summary
This publication covers the main findings and discussions from the second UNU-EHS Expert WorkingGroup (EWG II) meeting on Measuring Vulnerability. It provides an overview of concepts, methods, anddebates.Discussion of the term vulnerability and its meaning from social,economic,environmental andinstitutional points of view was a major part of the scientific debate.
To paraphrase Charles Dickens,“this is the best of times and the worse of times” for interdisciplinary,policy relevant research on vulnerability. On the one hand, the term “vulnerability” appears frequentlyin applied research on areas as diverse as development and poverty studies (academically in anthro-pology and sociology), public health, climate studies, engineering, geography, political ecology, and, ofcourse, among disaster researchers. The bad news is that researchers from such diverse backgroundsseldom sit together and share working definitions of “vulnerability,”what methods they use to measureor assess it, and their successes and failures in communicating their research to decision makers. Suchdiverse researchers come from very different backgrounds and field experiences.They may hold diffe-rent assumptions about fundamental things like the nature of science and what constitutes an explana-tion.While these differences can – as in the case of this EWG II meeting – lead to creative tensions andnew insights, the resulting debate might appear to outsiders – especially practical people in decisionmaking positions – to be, at best, a wasteful circus of ideas or, at worst, an unruly bar room brawl. Thegentle reader should be reassured that the meeting reported herein was quite civilized and productive.In part, this is because it was the second in a series. It is also because in preparing the second meeting,everyone was aware of the very broad range of methods and views we were intentionally inviting –hence the somewhat ironic title:“Measuring the Un-Measurable.”
The term “measuring vulnerability” does not solely encompass quantitative approaches, which is whatfirst comes to mind. It also seeks to discuss and develop all types of methods able to translate theabstract concept of vulnerability into practical tools to be applied in the field. If one takes the barebones, simple definition as “subject to harm”, then the question rapidly proliferates and becomeconcrete and situational:“what kind of harm?”,“harm from what?”,“how often?”,“recoverable or treatableharm?”,“avoidable harm?”, and above all,“under what economic, social, and political conditions?”
There are many different ways to answer such questions at different scales (from household and localcommunity to the national and supra-national to global levels) using a variety of methods includingquantitative indicators, qualitative criteria as well as broader assessment approaches. Ordinal and car-dinal numbers, models, proxies, narratives, maps, chronologies, and profiles all have their place depend-ing on the purpose of vulnerability assessment / measurement.
Key questions that help to clarify the choice of methods are:
• Who and what is vulnerable?
• Vulnerable to what?
• Who wants to know and why?
• What circumstances and context shape the daily life of the affected?
This report also gives an overview of case studies in which vulnerability assessment was applied.Thesecase studies were another reason why the EWG II avoided becoming yet another non-stop philosophi-cal seminar with tea breaks. Case studies from Sri Lanka (tsunami), Russia (Volga River flooding),Tanza-nia (multiple hazards including drought), and the U.S. (hurricane Katrina) – as well as occasional refe-rences to other ongoing work in Central America, Southern Africa, and elsewhere – enlivened the dis-cussion by making it concrete.The case studies showed that MEASURING VULNERABILITY requires dif-ferent approaches depending on the hazard in question and the socio-economic and cultural context.

8
Participants of the EWG II came from 24 different countries, thus representing a variety of differentsocio-economic and cultural areas. Based on the diverse and rich discussion major poles of the scien-tific debate as well as challenges for future vulnerability research emerged and will be presentedbelow. Among other subjects the discussion focused on the issues of “Complexity versus simplicity”,“Understanding versus action/implementation” and “Natural science versus social science episte-mology”.Thus this report underlines the different standpoints and methodological, as well as practicaldecisions that need to be taken into consideration when dealing with the set up of tools to measurethe multifaceted nature of vulnerability.

Table of Contents
I. Introduction . . . . . . . . . . . . . . . . . . . . . . . . . . . . . . . . . . . . . . . . . . . . . . . . . . . . . . . . . . . . . . . . . . . . . . . . . . . . . . . . 10
II. Constituencies . . . . . . . . . . . . . . . . . . . . . . . . . . . . . . . . . . . . . . . . . . . . . . . . . . . . . . . . . . . . . . . . . . . . . . . . . . . . . . 13
2.1 The Participants . . . . . . . . . . . . . . . . . . . . . . . . . . . . . . . . . . . . . . . . . . . . . . . . . . . . . . . . . . . . . . . . . . . . . . . . 13
2.2 Scale . . . . . . . . . . . . . . . . . . . . . . . . . . . . . . . . . . . . . . . . . . . . . . . . . . . . . . . . . . . . . . . . . . . . . . . . . . . . . . . . . . . 13
2.3 Creative Tension and Debates . . . . . . . . . . . . . . . . . . . . . . . . . . . . . . . . . . . . . . . . . . . . . . . . . . . . . . . . . . . 14
2.4 Nature of Measurement . . . . . . . . . . . . . . . . . . . . . . . . . . . . . . . . . . . . . . . . . . . . . . . . . . . . . . . . . . . . . . . . . 16
2.5 Thematic Areas . . . . . . . . . . . . . . . . . . . . . . . . . . . . . . . . . . . . . . . . . . . . . . . . . . . . . . . . . . . . . . . . . . . . . . . . . 16
III. Case Studies . . . . . . . . . . . . . . . . . . . . . . . . . . . . . . . . . . . . . . . . . . . . . . . . . . . . . . . . . . . . . . . . . . . . . . . . . . . . . . . . 21
3.1 Sri Lanka:Tsunami Vulnerability . . . . . . . . . . . . . . . . . . . . . . . . . . . . . . . . . . . . . . . . . . . . . . . . . . . . . . . . . 21
3.2 US Gulf Coast: Hurricane Katrina . . . . . . . . . . . . . . . . . . . . . . . . . . . . . . . . . . . . . . . . . . . . . . . . . . . . . . . . . 25
3.3 Russia: Flood Vulnerability . . . . . . . . . . . . . . . . . . . . . . . . . . . . . . . . . . . . . . . . . . . . . . . . . . . . . . . . . . . . . . . 27
3.4 Tanzania:Vulnerability Assessment at Sub-national Level . . . . . . . . . . . . . . . . . . . . . . . . . . . . . . . . . 28
IV. Specific Foci . . . . . . . . . . . . . . . . . . . . . . . . . . . . . . . . . . . . . . . . . . . . . . . . . . . . . . . . . . . . . . . . . . . . . . . . . . . . . . . . . 31
4.1 Vulnerability and Spatial Planning . . . . . . . . . . . . . . . . . . . . . . . . . . . . . . . . . . . . . . . . . . . . . . . . . . . . . . . 31
4.2 Remote Sensing and Vulnerability Assessment . . . . . . . . . . . . . . . . . . . . . . . . . . . . . . . . . . . . . . . . . . . 32
4.3 Institutional Vulnerability . . . . . . . . . . . . . . . . . . . . . . . . . . . . . . . . . . . . . . . . . . . . . . . . . . . . . . . . . . . . . . . 35
4.4 Environmental Vulnerability . . . . . . . . . . . . . . . . . . . . . . . . . . . . . . . . . . . . . . . . . . . . . . . . . . . . . . . . . . . . . 37
V. Vulnerability: A Topic in the Political Arena? . . . . . . . . . . . . . . . . . . . . . . . . . . . . . . . . . . . . . . . . . . . . . . . . . . . 40
VI. Conclusions & Recommendations . . . . . . . . . . . . . . . . . . . . . . . . . . . . . . . . . . . . . . . . . . . . . . . . . . . . . . . . . . . . 43
6.1 Progress Since the First EWG Meeting . . . . . . . . . . . . . . . . . . . . . . . . . . . . . . . . . . . . . . . . . . . . . . . . . . . . 43
6.2 Creative Tensions and Conclusions . . . . . . . . . . . . . . . . . . . . . . . . . . . . . . . . . . . . . . . . . . . . . . . . . . . . . . 43
6.3 Recommendetions . . . . . . . . . . . . . . . . . . . . . . . . . . . . . . . . . . . . . . . . . . . . . . . . . . . . . . . . . . . . . . . . . . . . . 45
List of Abbreviations . . . . . . . . . . . . . . . . . . . . . . . . . . . . . . . . . . . . . . . . . . . . . . . . . . . . . . . . . . . . . . . . . . . . . . . . . . . . 47
References . . . . . . . . . . . . . . . . . . . . . . . . . . . . . . . . . . . . . . . . . . . . . . . . . . . . . . . . . . . . . . . . . . . . . . . . . . . . . . . . . . . . . 48
Annex I: List of Participants . . . . . . . . . . . . . . . . . . . . . . . . . . . . . . . . . . . . . . . . . . . . . . . . . . . . . . . . . . . . . . . . . . . . . . 52
Annex II: Programme of the Workshop . . . . . . . . . . . . . . . . . . . . . . . . . . . . . . . . . . . . . . . . . . . . . . . . . . . . . . . . . . . 57
Annex III: List of Graphics . . . . . . . . . . . . . . . . . . . . . . . . . . . . . . . . . . . . . . . . . . . . . . . . . . . . . . . . . . . . . . . . . . . . . . . 58
9

I. Introduction
The term “vulnerability” has different meanings and interpretations for different people. On the onehand, the various definitions and meanings of vulnerability hamper a common understanding of howto measure vulnerability. On the other hand, perhaps it is not a bad thing if vulnerability has manymeanings, each useful within specialized applications. Also, it is possible that some social aspects ofvulnerability in particular are beyond quantification. But even if they are, this does not mean theyescape measurement, or at least assessment and systematization altogether.
Such were the issues tackled by a series of Expert Working Group (EWG) meetings convened by theUNITED NATIONS UNIVERSITY Institute for Environment and Human Security (UNU-EHS).The first wasin Kobe, Japan, in January 2005, just following the World Conference on Disaster Reduction (WCDR) andwas supported by the Asian Disaster Reduction Centre (ADRC) (see in detail Birkmann 2005).
The purpose of both meetings, and, indeed, athird in the series scheduled for October 2006, isto promote research and the exchange of scien-tific concepts and approaches dealing with themeasurement and assessment of vulnerabilityof people and social groups (at many scales), ofeconomic sectors and of environmental servicesat risk to natural hazards.The broader context ofthe meeting was “human security”; the EWG dealtwith violence and war as well as technologicalhazards only as boundary processes (see for exam-ple, the case study from Sri Lanka; Chapter III).
As suggested by the questions in the summary,the term measuring vulnerability does not solely encompass quantitative approaches, but also seeks to discuss and develop all types of methods able to translate the abstract concept of vulnerability intopractical tools to be applied in the field.
The need to develop indicators and measures to identify and assess vulnerability has been emphasizedin various international declarations, particularly in the Hyogo Framework for Action, the final outcomeof the WCDR mentioned above, which points out that:
The starting point for reducing disaster risk and for promoting a culture of disaster resilience lies inthe knowledge of the hazards and the physical, social, economic and environmental vulnerabilitiesto disasters that most societies face, and of the ways in which hazards and vulnerabilities are chang-ing in the short and long term, followed by action taken on the basis of that knowledge. (UnitedNations 2005)
In this context the UNU-EHS Expert Working Group on Measuring Vulnerability sees itself as a groupcontributing to the implementation of the Hyogo Framework by enhancing the knowledge regardingvulnerability.
Measuring vulnerability requires as a starting point a shared minimum agreement concerning whatvulnerability is. Although there are different schools of vulnerability research, such as the disaster riskcommunity, the food security research or global environmental change research communities, a con-sensus can be seen in the fact that nearly everyone views vulnerability as an “internal side of risk”(UN/ISDR 2004). In this context vulnerability is an intrinsic characteristic of a system. That means theconditions of the exposed element or community at risk are seen as core characteristics of vulnerabili-ty (UN/ISDR 2004; Cardona 2004: 37; Wisner 2002: 12/7; Thywissen 2006). These intrinsic (though not
10
“Susceptibility to harm from external shocks”
“Degree of loss or harm likely if and when an extreme event occurs”
“Disruption of normal functioning likely due to hazard event.”
“Characteristics of a person or group in terms of their capacityto anticipate, cope with, resist, and recover fromthe impact of a natural hazard”
(EWG II 2005)
BOX 1: Working Definitions of Vulnerability

necessarily permanent or unchanging) characteristics or conditions of the exposed element or systemis often called its “susceptibility.”Thus in this broader context vulnerability is composed of “exposure”and “susceptibility.” However, this is only the first inner sphere and various extensions of the conceptscan be observed depending on the scale, theme and disciplinary focus, and purpose of the definition.
This range is shown in figure 1 as spheres of vulnerability. In this context an extension of this definitioncan be seen in definitions such as Wisner’s (2002; also Wisner et al., 2004: 11), which defines vulnerabilityas the likelihood of injury, death, loss and disruption of livelihood in an extreme event, and/or unusual diffi-culties in recovering from negative impacts of hazardous events – primarily related to people (Wisner2002: pp. 12/7) (second sphere).
Moreover, this definition is widened by viewing vulnerability as a dualistic approach of susceptibility onthe one hand and the unusual difficulties in coping and recovery on the other (third sphere), which canbe observed in the definitions by Wisner (2002) and also partially by Bohle (2001).Bohle´s double struc-ture of vulnerability refers to vulnerability features which are external to an exposed element or unit atrisk and those factors that are internal.
Figure 1: Key Spheres of the Concept of Vulnerability (Birkmann 2006)
Furthermore, the capacity to cope is the other side of vulnerability (positive definition/ capacities).An additional extension of the concept of vulnerability can be seen in the shift from a double structureto a multi-structure, encompassing not only susceptibility (negative definition of vulnerability) andcoping capacity, but also adaptive capacity, exposure, and the interaction with perturbations and
11
Wid
enin
gof t
heco
ncept
Multi-dimensional vulnerabilityencompassing physical, social,economic, environmental and
institutional features
Vulnerability as a multiplestructure: susceptibility,
coping capacity, exposure,adaptive capacity
Vulnerability as a dualisticapproach of susceptibility
and coping capacity
Vulnerability as thelikehood to experience
ham(hum an centred)
Vulnerability as an internal risk
factor(intrinsic
vulnerability)

stresses (see e.g. Turner et al. 2003). This implies a fourth sphere, by widening further the concept ofvulnerability. Lastly, also the thematic dimensions can be broadened within the discourse of vulnerabi-lity. While formerly – mainly engineering based approaches and earthquake research – vulnerabilitywas primarily associated with physical aspects (likelihood of a building to collapse), the current debateclearly shows that vulnerability captures various thematic dimensions, such as physical, economic,social, environmental and institutional aspects (fifth sphere, see Figure 1). A more in-depth analysis ofthis discussion can be found in Birkmann (2006). Overall, it is evident that vulnerability – including co-ping capacity – depends not only on the natural hazard in question – such as floods, droughts, hurri-canes, tsunamis, etc. Schematically, risk (R) is a function of vulnerability (V) and hazard (H), that means [R = ?(V, H)].This inseparable pair of concepts – vulnerability and hazard – is also shaped by the socio-economic development context as well as the cultural and institutional aspects of daily life.
BOX 2: Main Goals of the UNU-EHS Expert Working Group are:
Primarily, the Expert Working Group aims at examining current ideas, methods and concepts for mea-suring vulnerability and coping capacity with regard to hazards of natural origin. Some attempt is alsobeing made to learn parallel methodological lessons from research into violence (e.g. civil war situa-tions) as an additional hazard in regions at risk of natural hazards, such as Sri Lanka. Additionally, somevaluable lessons have been drawn from analyses of vulnerability to environmental hazards such as air,water pollution and land degradation.This analysis and the comparison of different approaches aim todetermine to what extent current indicator and assessment concepts contribute to enhanced humansecurity as well as to policy relevant information.
An unique feature of UNU-EHS is to conceptualize vulnerability to natural hazards in the broader contextof human security and sustainable human development. Few, if any, programs of disaster or hazardsresearch attempt to bridge between work on civil war, displacement and violence, climate change,chronic and acute anthropogenic environmental threats, and natural hazards, such as sudden-onsethazards (tsunami, floods, hurricanes) and creeping hazards (drought, landdegradation, changing socio-physical conditions like climate variability). In this context Bogardi and Brauch (2005) suggestedextending the human security concept by introducing a third “dimension” – “freedom from hazardimpacts”– to the two existing ones:“freedom from fear”and “freedom from want”.
12
• Strengthening the interdisciplinary dialogue and exchange on vulnerability research;
• Identification of different theories and frameworks used to conceptualize vulnerability;
• Discussion of different dimensions of vulnerability (like social, economic, environmental and insti-tutional vulnerability);
• Review of current approaches used to measure vulnerability at different scales and for differentdimensions;
• Identification of coping capacities (coping strategies) and potential intervention tools to reducevulnerability;
• Testing of indicators and analysis of their applicability in selected planning and decision makingprocesses;
• Compilation of the different approaches and publishing innovative research results
More information about the Expert Working Group on MEASURING VULNERABILITY can be found at:www.ehs.unu.edu; or directly by contacting the responsible Academic Officer Dr. Joern Birkmann,E-Mail: [email protected]

II. Constituencies
2.1 The Participants
The participants represented natural and social sciences, engineering and came from 24 countries.There were policy makers and NGO practitioners present at EWG II, together with researchers and uni-
versity lecturers. In other words, there wasa span of disciplinary background reachingfrom systems and civil engineering andsoil science and hydrology to economics,political science, and anthropology. Thework situations and locations in relation toinstitutions and points of leverage alsovaried considerably. Some had experiencein national level governmental institutions(e.g. Tanzania, South Africa, Guatemala,Germany), others in universities, quasi-governmental or regional research institu-tions, while yet others were active inNGOs.Each of these “locations”carries withit power of one kind or another, and/oraccess to other levels of power.
Fortunate timing meant that the EWGcould meet immediately after a large conference on “Global Environmental Change, Globalization andInternational Security: New Challenges for the 21st Century” of the International Human DimensionsProgramme on Global Environmental Change (IHDP) at the University of Bonn (IHDP 2005). This meantthat a number of researchers whose work centres on climate change, global environmental change,and development – not in the first instance directly focused on disaster risk reduction or naturalhazards – were able to attend.This circumstance enriched the debate.Young scientists from UNU-EHS,ZEF and the University of Bonn also attended the second meeting of EWG. As well as the young scien-tists awarded by the so called Young Scientists Award of UNU-EHS.
BOX 4: UNU-EHS Young Scientists Award & Programme
Depending on the disciplinary background of each participant and the kind of problems they con-fronted in their work situations and institutional locations, they brought with them different notions ofmeasurement and of vulnerability.
2.2 Scale
One of the big challenges of the EWG meeting were the different scales in regard to measuring/assessing vulnerability. Some participants mentioned the household level or community scale theywork at, sometimes in collaboration with local government (towns, cities); others pointed out thenational, regional or even international scale including work dealing with issues like risk mitigation,
13
The young scientist programme of UNU-EHS targets individuals from developing countries who, itis hoped, will use their newly acquired knowledge and skills either back home or in institutionsdevoted to disaster risk reduction or sustainable development. It is also open to individuals fromdeveloped countries who are interested in working on global issues professionally.
Box 3: Nationalities Represented at EWGII
Hungary Germany Sri Lanka Russia Tanzania
Colombia USA United Kingdom
India Australia
AustR. Mexico Italy Finland Guatemala
South Africa Netherlands France Belgium Japan
Philippines Norway Romania China

Figure 2:Tsunami Affected Squatters in Galle, Sri Lanka (Birkmann et al. 2006)
response, recovery, or preparedness.They all pointed out their typical need for measurement or assess-ment of vulnerability which varied considerably depending on the scale at which they work.
2.3 Creative Tension and Debates
Given the different professional situations and scientific formations of the EWG II participants, it is notsurprising that there was creative tension and debate in the meeting. One might summarize thisdynamic as follows:
BOX 5: Creative Tensions and Debates over Vulnerability
14
Complexity versus simplicity:• Cultural, livelihood, situational, institutional/ political complexity vs. desire for mathematical parsimony• Complex, dynamic, even chaotic process vs. product
Understanding versus implementation:• Utility/ necessity of basic starting points: e.g.exposure maps in Sri Lanka; e.g.district/ village surveys in
Tanzania;• But how does one get from basic description to understanding?
Natural science versus social science epistemology:• Are controlled experiments possible when groups of people are involved?• When local people themselves are researching their own hazards and vulnerabilities/ capacities and
implementing action plans, does this constitute an experiment?
Nomothetic versus ideographic goals:• Are we trying to establish law-like statements and the ability to predict outcomes or are we providing
narratives and descriptions of situations that raise consciousness of risks and mobilize local and out-side action, vigilance, and preparedness?
Ethical issues:• Are people research objects or subjects?• Are there not winners and losers in any intervention into the risk-scape of a locality?
Cacophony versus polyphony:• Full understanding of vulnerability may involve a large team, but can they speak with one voice when
a common language or metric of vulnerability may not exist?• Decision makers want clear options, not nuanced understandings.

Complexity vs.simplicity emerged as two principal poles of attraction.Participants were aware that vul-nerability is influenced by many things, some of which may have their origins decades or even cen-turies ago in distant, non-local places (thinking about patterns of access to resources, for instance).Also,the many components or aspects of vulnerability – social, economic, environmental, institutional – arehard to separate in a tidy manner.They interact and overlap. Despite the resulting complexity in under-standing vulnerability, most participants agreed that decision makers want simple explanations andclear cut categories. Most of the other poles of creative tension listed above derive from this principalantinomy. Pelling introduced the subject well during the initial debate, using a single, elegantly simplepower point slide (Figure 3).
Pelling, Bohle, Oliver-Smith andothers argued that vulnerability isnot an object or phenomenonthat is given independently ofweb of perception, discourse, andpower that constructs (and overtime re-constructs) it. 1
Concerning the tension betweeninduction and deduction, mostparticipants, if not all, utilizedmethods that depend on induc-tion as cases are analysed. Someeconomists and engineers wouldrely to some degree on the for-mal logic of their specialities toreveal underlying structure(through mathematics and mo-delling). Finally, as regards theusefulness of modelling and the
feasibility of top down planning, the tension between naturalism versus control was seen to be relevant.Returning to the fundamental notion of complexity,some participants believed that society-environmentsystems are dynamic and chaotic, and that notions of equilibrium and normality simply do not apply.
BOX 6: EWG’s Knee-Jerk Definitions
15
1 In fact, some forms of constructivism have been applied as well to the natural sciences, and argue – against conventio-nal realism – that no object of scientific study is independent of its observer. While this is certainly true at sub-atomic,quantum scales, it is harder to believe of rocks and geologists.
Qualitative and Quantitative Approaches
Three Tensions
• Constructivism versus realism
• Induction versus deduction
• Naturalism versus control
Challenges:
Incommensurability
Misrepresentation
Opportunities:
Nesting studies by scale
Up-scaling
Figure 3: Three Tensions Between Qualitative and Quanti-tative Approaches (Pelling 2005)
On the last day, participants were asked to write down on a slip of paper a single word that the notion ofvulnerability evoked and to do it quickly without much thought.The results break down into four groups (N=36):
Definitions (11)(Index, part of risk, unsafe, resilience, disturbance, etc.)
Lamentations (11)(Confusion, keep it simple! jargon, never ending story, etc.)
Qualitative/ Humanistic Reflections (8)(People, diversity, poverty, structural, social)
Action-oriented Invocations (6)(Communication, empowerment, response, action)

2.4 Nature of Measurement
Common agreement can be reached concerning a hierarchy of knowing. Data (such as signals from aland resources satellite or tallies of age and gender in a household) are not yet information. Databecomes information when interpreted according to definitions, taxonomies, and scales. Data must beprocessed and interpreted to become information. Informa-tion becomes knowledge when it is systematically orga-nized in relation to questions. Knowledge becomes wisdomwhen it is set along-side prior knowledge and the results ofapplication of knowledge are critically appreciated (IFRC,2005: 13).
If the aim of common efforts in disaster risk reduction ishuman security and sustainable human development, thenwisdom would result from the critical assessment of out-comes when one tries to implement policy at international,national, or local scale or when people in a locality attemptto act on behalf of their own to improve self protection.Thelast mentioned assessments are simple because they areplace and situation specific, like this village in relation to thatflood hazard or landslide hazard, etc.
Assessments can be narrative, qualitative and quantitative.Data and information are automatically given in the form oflocal experience and the elicitation of local knowledge.However, local, national and international assessments can require one to step back from such richdetail and to simplify. One needs indicators or even more distant proxies. Indicators are nominally-countable or ordinally-scaleable characteristics or properties that bear a functional relationship to thehazard, exposure of people or property or livelihoods, or the impacts of exposure.Thus numbers of live-stock lost in past floods might be an indicator of possible future vulnerability to flood. A proxy is like-wise countable or scaleable, but does not bear a functional relationship to hazard, exposure or impact.Thus income per capita or infant mortality rate might turn out to be a good proxy for vulnerability to arange of extreme events.
2.5 Thematic Areas
In the course of panel debates, presentations of various methods, and case studies from a number ofcountries, four thematic areas emerged:
• Social;
• Economic;
• Environmental;
• Institutional.
SOCIAL
Social relations and the historically rooted patterns of discrimination, inequity in access to resources,and power are important determinants of vulnerability. In the discussion of hurricane Katrina and NewOrleans, Oliver-Smith touched on social relations, as did Bohle and Brauch, in the context of violentconflict. Social capital (networks) were seen to change under the influence of daily violence in Bohle’sresearch sites in Sri Lanka.This, in turn, changed the coping options people had in the face of extremeevents.
16
Figure 4: Hierarchy of Knowing(IFRC, 2005: 13)
Data
Information
Knowledge
Wisdom

History and the layers of identity that peoplecarry (gender, race,age, ethnicity,and religion)need to be analysed and assessed (e.g. workof Oswald Spring). Is it possible to do this in arapid, standardized manner? This may or maynot be possible. Wisner mentioned tech-niques of Community Based Risk Assessment(CRA) that have been collected by theProVention Consortium on their website as a “tool box” (ProVention Consortium 2006).To some extent groups of people can beguided to assess such differences and theirimpacts on exposure and possible losses (vul-nerability) in relation to specific hazards insitu as part of focus groups. Nevertheless, asHandmer emphasized, economic and social
vulnerability are often hard to distinguish, and some aspects of vulnerability are likely to remain hiddenand only understandable more deeply “from within” as, for example, through participant observationon the long run. Where a large proportion of economic activity is informal and hidden from officialview, it is hard to quantify and less likely to be mentioned even in focus groups. Complications are evengreater when some of the social relations and economic activity are linked to criminality and chronicviolence.
More optimistic were Bohle and Bilia who suggested, respectively, that the livelihood approach (see e.g.DFID 1999; Wisner et al., 2004: Chapter 3) bridges the social and economic and gives one considerableinsight into vulnerability.They also expressed the view that social vulnerability can be addressed on alarge scale by tying assessment and action planning to a decentralized national planning system. Het-tige, Fernando, and Amarasinghe reported on work in Sri Lanka after the Asian tsunami that conductedvulnerability assessment on the basis of a series of demographic characteristics (household size, occu-pation, etc.) and that also dealt with the question of how to measure coping capacities and the reco-very potential of different households to the primary and secondary impacts of the tsunami. In the caseof Tanzania, nationwide surveys at district level provided planners with an overview of hazards andavailable social infrastructure for preparedness and mitigation. As a starting point, it is very useful toknow, for example, that 41% of district teams reported having some first aid training and 26% havingsearch and rescue capacity, or that 80% of the population listens to Radio Tanzania.
ECONOMIC
There was considerable overlap between social and economic vul-nerability issues. More focused technical accounts of economicvulnerability were also presented to the EWG, differentiated byscale. Dutta from WIDER, a sister UNU center, shared econometricanalysis based in micro economics that he believes can isolatedeterminants of vulnerability in the economic behavior of indivi-duals. From this point of view one can define and measure vulner-ability as the likelihood of falling below the poverty line at a time ofstress such as a tsunami or drought and the depth of that poverty.Indeed, Dutta said that 200,000 people fell below the poverty line in El Salvador after the 2001 earth-quake and that unemployment in Sri Lanka increased from 14 to 21% after the Indian Ocean tsunami.A corollary of Dutta’s definition of vulnerability is that capacity benefits from building up diversity ofincome sources, family health status, savings, and social networks (available loans, etc.).
17
Figure 5: Displaced People After Hurricane Katri-na (Oliver-Smith, Button 2005)
“200,000 people fell below the poverty line in El Salvador afterthe 2001 earthquake and unemployment in Sri Lankaincreased from 14 to 21% after the Indian Ocean tsunami.”
Dutta (EWG II 2005)
Gregory Button, University of Michigan

At the macro scale, indicators of the fragility of whole economic systems have been suggested (e.g. Lin-nerooth-Bayer and Mechler EWG II 2005); while others commented on measurement at both micro andmacro scale (Mechler and Schneiderbauer EWG II 2005). As a tool for decisions about making invest-ments in reducing vulnerability to natural hazards, Hidajat and Jaeger suggested a time-tested (thoughcontroversial) tool: cost-benefit analysis.
Losses incurred by municipal, sub-national and national governments when hazards events destroyinfrastructure and housing can be enormous (e.g.$1 billion for the Bam earthquake; $4.5 billion for hur-ricane Mitch in Honduras and Nicaragua combined; $12 billion for the Asian tsunami). In many coun-tries roads, bridges, port facilities, schools and hospitals, water and sewage plants, and energy facilitiesare uninsured. Cardona and colleagues have developed a measure of the financial exposure, govern-ments face in relation to a variety of extreme events in Latin America (National University of Colombia2006). The Disaster Deficit Index (DDI) outlines the percentage of loss that would not be able to becovered by national sources in such an event. Linnerooth-Bayer and Mechler are working on ways tobuffer such impacts at the national scale and reduce the knock on effects on economic growth and itsvolatility.
INSTITUTIONAL
Institutions play an important role regarding vulnerability. Firstly, institutions like governments,businesses, markets, health systems, etc. – may have more or less capacity to cope with extreme eventsand shocks and ability to carry on with their normal functions or at least to re-establish them quickly(Nikitina; Greiving; Ivanov EWG II 2005). Also one can develop ways of characterizing the approach of anational or other scale governmental or non-governmental institution towards risk reduction and disastermanagement. Thus lvanov has developed a method of scaling institutions in Russia along severaldimensions: e.g. education and training, structural mitigation, non-structural mitigation, emergencyresponse, etc. Using this approach he reported that Russia’s flag-ship national disaster managementinstitution, EMERCOM, does little strategic planning or non-structural mitigation but concentrates onstructures and emergency response. Pelling described a new research looking at institutions as sets of rules and relationships and attempting to map the impact of such rules and relations on flow ofinformation and decision making about risk in UK based institutions. It uses key interviews aboutclimate change with decision makers in institutions at various scales: DEFRA & Environmental Agency
(national scale); Welsh Association (regional scale); dairy coopera-tive (local scale).
Trust and informality emerged as major themes in presentationson institutional vulnerability and the discussions that followed.Organizations structured along military lines have great difficultycommunicating with marginal groups of people in society. Theculture of different kinds of institutions can make inter-organiza-tional flows of information more difficult or easier, as Greivingsuggested. Mistrust is often well-founded in what is now docu-mented internationally as corruption at many levels of most so-cieties (Transparency International 2005).
Secondly, the way that various institutions impact people’s livesmay make them more or less vulnerable. For example, a marketthat systematically exploits poor farmers through unequalexchange or pays migrants below the cost of reproduction(because it counts on an ability of women remaining in the coun-tryside to feed the next generation of the workforce) may be seenas creating and reproducing vulnerability. A corrupt and inatten-
18
Figure 6: Global CorruptionReport 2005 (TransparencyInternational 2005)

tive government is not simply neutral as regards social protection but may do things through taxationor arbitrary land seizure that increases the vulnerability of the poor. By contrast, good governance maystrengthen both the self protection and coping ability of its citizens and also provide social protection(Pelling; Oliver-Smith; Alexander EWG II 2005).
ENVIRONMENTAL
Several presentations touched on environmental issues.There were some presentations of vulnerabili-ty assessment applied to pollution hazards such as those produced by release of dioxin and petroleuminto the air or water. In a more systemic and conceptual manner, several presenters mentioned thenecessity of linking up with those who study climate change and also use the term vulnerability (e.g.Downing and Renaud). Slow onset, or pervasive hazards such as soil erosion, desertification, decline inbiodiversity, and other environmental changes commonly play a role in vulnerability unlike the contri-bution of baseline nutritional status and health do in the case of individuals and households(Jayasingam). Finally, Billing from the European Commission emphasized the need for strengtheningthe cooperation between disaster management and environmental management.
Kok provided an overarching view of how disaster risk reduction could be seen in the context of effortsto bridge between development and environment such as the Millennium Ecosystem Assessment(2006) and one of its underlying conceptual models of vulnerability put forward a few years ago byTurner and colleagues (Turner et al. 2003).
Figure 7: Vulnerability Framework (Turner et al. 2003)
It is one thing to provide cases and examples of how, for example, healthy mangroves protected someSri Lanka fishing villages from the full impact of the Asian tsunami (e.g. Bohle’s comment), but it is quiteanother to pursue policy that fully integrates environmental sustainability and human well being with
19
Variability & change in
environmental
conditions
Env ironmental influences outside the place
State of biosphere, state of nature
Global environmental changes
Human influences outside the place
Macro political economy, institutions,global trends and transitions
Drivers / causes Consequences
Human
conditions
Env ironmental
conditions
Interactions of hazards
(perturbations, stresses,stressors)
Variability & change in
human conditions
Impact /
responses
Coping /
response
Characteristics& components
of exposure
Impact /
response
System operates at multiple
spatial, functional and temporal scalesDynamics
cross-scale
in place
beyond place
World
Region
Place
Adjustment &
adaptation /
response
Exposure ResilienceSensitivity
Vulnerability
Adjustment &
adaptation /
response

disaster risk reduction in a systematic way. The latter remains a challenge, and would also imply mea-surements or assessments of vulnerability that would contain local environmental quality variables.
An aspect of the challenge is the difficulty of spelling out in detail exactly how social and ecologicalsystems are coupled and how they interact (Bohle EWG II 2005). In a later review of the concept ofresilience in ecology and social science, Oliver-Smith (2006) returned to these concerns. The danger,both Bohle and Oliver-Smith see, is taking uncritically on board concepts such as equilibrium andresilience as the ability to bounce back to former function. It may well be that human-environmentsystems are chaotic and non-equilibrating (Handmer et al. 2001).
20

III. Case Studies
3.1 Sri Lanka: Tsunami Vulnerability
Hettige, Fernando, Amarasinghe and Jayasingam presented first research results regarding the identifi-cation and measurement of pre-existing and emergent vulnerabilities to tsunami in Sri Lanka, pilotingvulnerability assessment methods at the local level during a period of eight months.The study, fundedby UN/ISDR-PPEW, is ongoing and conducted jointly with the University of Colombo, University ofRuhuna, Eastern University and UNU-EHS.
The assessment approach that was developed and tested in this project aimed to explore various cha-racteristics of vulnerability of different social groups, critical infrastructure and economic sectors totsunamis and other coastal hazards.As a conceptual basis of vulnerability, the approach is based on theBBC framework (see Figure 8), which stresses the fact that vulnerability is defined through exposed andsusceptible elements on one hand, and the coping capacities of the affected entities (for example socialgroups) on the other.
BOX 7: Pre-existing, Baseline and Emergent Vulnerability
The BBC-conceptual framework shows that it is also important to address the potential interventiontools that could help to reduce vulnerability in the social, economic and environmental spheres (Birk-mann 2006).The framework integrates social, economic and environmental aspects into the vulnerabi-lity assessment, thus reflecting the “three pillars”of sustainable development.
The BBC-framework was used especially to design the assessment ofthe vulnerability of different social groups to tsunamis using question-naires as a data-gathering tool. Altogether, the research encompassedfour main techniques to identify and measure vulnerabilities, copingcapacities and appropriate intervention tools, focusing on different datasources and different characteristics of vulnerability (see Box 8).
21
The terms pre-existing and baseline vulnerability are understood as those vulnerabilities which existbefore a disaster and are revealed within disaster situations. Some of these vulnerability characteristicsare chronic (though dynamic and changing) such as malnutrition and poor access to clean water.
In contrast the term emergent vulnerability emphasizes that new vulnerabilities, for example within thedynamics of the recovery process, are formed and created. These emergent vulnerabilities are oftensolely visible within a disaster or the recovery process.
Birkmann underlined that in terms of the Sri Lankan case study “emergent vulnerabilities”were particu-larly generated by the procedures and rules of the recovery and reconstruction process, for example thefact that squatter households did not receive any financial support for the reconstruction of theirhouses which were heavily impacted.
Another example foremerging insecurity:
“More than half of the population in developing countries consists of highly vulnerable children.There is a need to re-think how can we assist this highly vulnerable group.”
Oswald Spring (EWG II 2005)

Figure 8: The BBC-conceptual Framework
(Birkmann 2006, based on Bogardi/Birkmann (2004) and Cardona (1999/2001))
This research was primarily conducted in Galle and an additional assessment was also carried out inBatticaloa.While Galle in the southern coastal belt of Sri Lanka is primarily inhabited by Singhalese po-pulation, Batticaloa in the east coast is home to a primarily Tamil population (and some Muslims). It is
22
e.g.
Emission
control
e.g.
Insurances
e.g. Land use changes
Social
sphere
VULNERABILITY
Exposed and
vulnerableelements Coping
capacity
Economic risk
Environmental
risk
Social risk
Vulnerability reduction (t=0)
Preparedness
Disaster/emergency
management
Vulnerability reduction (t=1)
RISK
FEEDBACK
e.g.
Early
warning
Event
HAZARD
Economic
sphere
Environmental
sphere
Risk
reduction
INTERVENTION
SYSTEM
Natural phenomena
1) Assessment of the built environment with remote sensing Estimation of vulnerability of different urban areas
2) Critical infrastructure and sector vulnerabilityGround survey of the exposure and susceptibility of basic infrastructure services and their facilities,e.g. hospitals and schools
3) Vulnerability of different social groups – questionnaire-basedInterviews with households in selected locations to identify and assess the different vulnerabilitiesof various social groups to tsunami risk. Focus group discussions, in-depth interviews with selectedfamilies and key informant interviews were also conducted
4) Vulnerability of social groups and local communitiesCensus data-based assessment of vulnerability using general indicators
BOX 8: Overview of the Four Main Methods Used to Assess Vulnerabilities

constantly facing civil and military strife between the Government of Sri Lanka and the LTTE (LiberationTigers of Tamil Eelam).
The presentation of Hettige, Fernando, Amarasinghe and Jayasingam encompassed first results of thestudy based on six sample communities in Galle (see Figure 9). A representative sample of 502 familieswithin these six GN Divisions (Grama Niladari divisions, the smallest statistical unit in Sri Lanka) wasselected.
Figure 9: Overview of Selected Sites in Galle for Questionnaire-based Research (Birkmann et al., 2006)
The structure and content of the questionnaire take into account both the “BBC-framework”(see Figure9) as well as aspects of the sustainable livelihood framework (DFID, 1999;Wisner et al., 2004, chapter 3),thus measuring susceptibility,the degree of exposure, copingcapacities and intervention mea-sures to reduce vulnerability(Figure 9).
Regarding the interventiontools – emphasis was given tothe politically defined 100metre buffer zone from the seaand the establishment of anearly warning system.
Within the discussion ensuingthe EWG meeting the useful-ness of the buffer zone wasquestioned. However, withoutneglecting the conflict and con-fusion the establishment andamendment of the 100 metre
23
Vulnerability Susceptibility and degree of exposure1) Impact of the tsunami on household members and their assets;2) Structure of household;3) Housing conditions and impact of the tsunami;4) Direct loss of possessions;5) Activity and occupation of household members.
Coping capacities6) Social networks;7) Knowledge of coastal hazards and tsunami;8) Financial support from formal and informal organisations;9) Access to information, e.g. radio.
Intervention tools10) Relocation of housing and infrastructure to inland;11) Early-warning system;12) 100m ‘buffer zone’ (implemented by Government).
BOX 9: Structure of the Questionnaire

zone generated, the study shows that the likelihood of being killed by the tsunami in the 100m zonewas twice as high as in the 200m and 300m zones away from the sea in Galle. In addition, data ondemographic characteristics of dead and missing people showed that the youngest age group, 0-9years (25 percent), and the age groups over 40 years (44 percent), elderly people in particular, werehighly vulnerable to the tsunami. Additionally, gender played an important role with regard to the like-lihood of being killed by the tsunami: nearly twice as many females (65 percent) as males (35 percent)were dead or missing in Galle (see Figure 10), a result also observed by Nishikiori et al. (2006) for theAmpara district in Sri Lanka in Tamil Nadu India by Guha-Sapir et al. (2006)
Besides vulnerability, also coping and reco-very were studied. This was undertaken byanalyzing changes in activities and unem-ployment, as well as the capacity of differenthouseholds to recover (Birkmann, Fernando2007). According to Fernando´s report itturned out that households living in the 100metre zone who did not own their land wereparticularly ill-prepared to recover from thetsunami’s impact.Based on a simulation modeldeveloped by UNU-EHS, households whoowned land would theoretically need aroundseven months to replace their housing losses,while in contrast the group of squatters (or“encroachers”) who had no legal title to landwould need on average around 44 months toreplace housing losses. The difference is dueto a number of factors including higher in-
come and different occupational patterns among land owning households and their access to loans.Moreover, landless households are not allowed to rebuild their houses in the same place; nor do theyget financial support from the government for rebuilding inside the buffer zone.The problem of reducingvulnerability by decreasing the exposure of people (buffer zone), whilst creating at the same timeconfusion and conflicts for those who were living there and are now displaced is also addressed byMadhavi Ariyabandu in the South Asian Disaster Report (Duryog Nivaran 2006).
Lastly, the study showed that when looking at how tsunami-affected people cope, assets such as accessto social networks, memberships in community-based organizations, mutual trust and reciprocity insociety play an important role. Interestingly, a significant proportion of household members inter-viewed were not members of local organizations. As a result, only 6 percent of community membersreceived financial assistance from local organizations to recover from the tsunami. In contrast, nearly 98percent of respondents received different types of aid in cash and kind from various UN agencies suchas UNDP, UN-Habitat and other government and non-governmental organisations to recover from thetsunami. This underlines the important role of international support. On the other hand the studyshows that when the tsunami first hit it was neighbours (55 percent), friends (10 percent), other familymembers and relatives (18 percent) who first came to help the affected people before other authorities– which shows the close relationship with social and family net-works.
During discussion, Bohle and Wisner underlined that the studyundertaken in Sri Lanka is an excellent example of linking a con-ceptual framework – the BBC-framework – with empirical workconducted in the field based on questionnaires. However, theyquestioned whether the study should also focus on the broader
24
Figure 10: Dead and Missing According to Genderin Galle (Birkmann et al. 2006)
“In some cases the crisis after thetsunami can also be an engine ofdevelopment and transformation– if properly managed (window ofopportunity).”
Bohle (EWG II 2005)

picture, for example, on how the conflict influenced the vulnerability of people before the tsunami.Thediscussion of base-line vulnerability emerged. That means the crisis might turn out to offer new win-dows of opportunity. In this context Wisner suggested that one should integrate the conflict dimension(civil war in Sri Lanka) and examine the root causes of vulnerability, e.g. based on the history of deve-lopment and on theoretical approaches, such as the political economy.The South Asian Disaster Report2005 (Duryog Nivaran 2006) outlined important developments in the past that contributed to the highvulnerability of coastal communities in Sri Lanka such as the construction of critical infrastructure alongthe coast and also economic activities such as illegal coral and sand mining as well as encroachment ofhighly exposed areas. In addition, protective mangroves had been removed for strategic reasons by theSri Lankan military (to deny the Liberation Tigers of Tamil Eelam (LTTE) places to hide). Furthermore,Bohle pointed out that disasters are a tragedy and mega disasters even more so, however, in somecases, the crisis after the tsunami can be also an engine of development and transformation – if properlymanaged.
3.2 US Gulf Coast: Hurricane Katrina
Oliver-Smith, from the University of Florida, reviewed the hurricane Katrina disaster. He emphasizedthat understanding forced migration and vulnerability requires seeing the totality of relationships inthe social situation that produced a disaster in combination with the atmospheric trigger event. Heused the Pressure and Release Model by Wisner and his co-authors (2004) in which a disaster is under-stood as the product of vulnerability (composed of root causes, dynamic pressures and unsafe condi-tions) and natural hazards (Figure 11).
Figure 11: The Pressure and Release (PAR) Model: the Progression of Vulnerability (Wisner et al. 2004: 51)
25
The final report of the “Rapid and Multidimensional Vulnerability Assessment in Sri Lanka – CaseStudies Galle and Batticaloa”can be obtained soon from UNU-EHS and the University of Colombo andEastern University.
THE PROGRESSION OF VULNERABILITY
1 2 3
ROOT CAUSES DYNAMIC PRESSURES
UNSAFE CONDITIONS
Limited access to • Power • Structures • Resources
Ideologies • Political systems • Economic systems
Lack of • Local institutions • Training • Appropriate skills • Local investments • Local markets • Press freedom • Ethical standards in public life
Macro-forces • Rapid population change • Rapid urbanization • Arms expenditure • Dept repayment schedules • Deforestation • Decline in soil productivity
Physical Environment • Dangerous locations • Unprotected buildings and infrastructure
Localeconomy • Livelihoods at risk • Low income levels
Social relations • Special groups at risk • Lack of local institutions
Public actions and institutions • Lack of disaster preparedness • Prevalence of endemic disease
Earthquake
Highwinds (cyclone/ hurricane/ typhoon)
Flooding
Volcanic eruption
Landslide
Drought
Virus and pests
DISASTER HAZARD
Risk=Hazard x
Vulnerability
R=HxV
Against the background of this multifaceted understanding of vulnerability and disaster, the connec-tions between disaster and forced migration involve a complex chain of causes and effects.That meansdisaster outcomes are rarely the result of a single agent (e.g. a hurricane), but by multiple and inter-secting forces acting together in a specific social context that is complex in its own right, as it becomesvery clear in the case of hurricane Katrina. In this regard Oliver-Smith explained the potential continuumof migration types. It can range from
• voluntary to forced;
• permanent to temporary;
• proactive to reactive;
• administrated to non-administrated.
In New Orleans the lack of appropriate and prompt support from official agencies became obvious.Oliver-Smith pointed out that many hurricanes in the last 150 years passed near or even hit the NewOrleans region (as in 1965). Hence, hurricane Katrina did not appear from nowhere and coping mea-sures could (and should) have been in place. In the terms used in the Pressure and Release Model (Figure11), public actions and institutions as well as social relations were insufficient to meet the demands ofsocial protection under the stress of this hurricane hazard. Some 120,000 people without access totransportation could not evacuate before the storm.
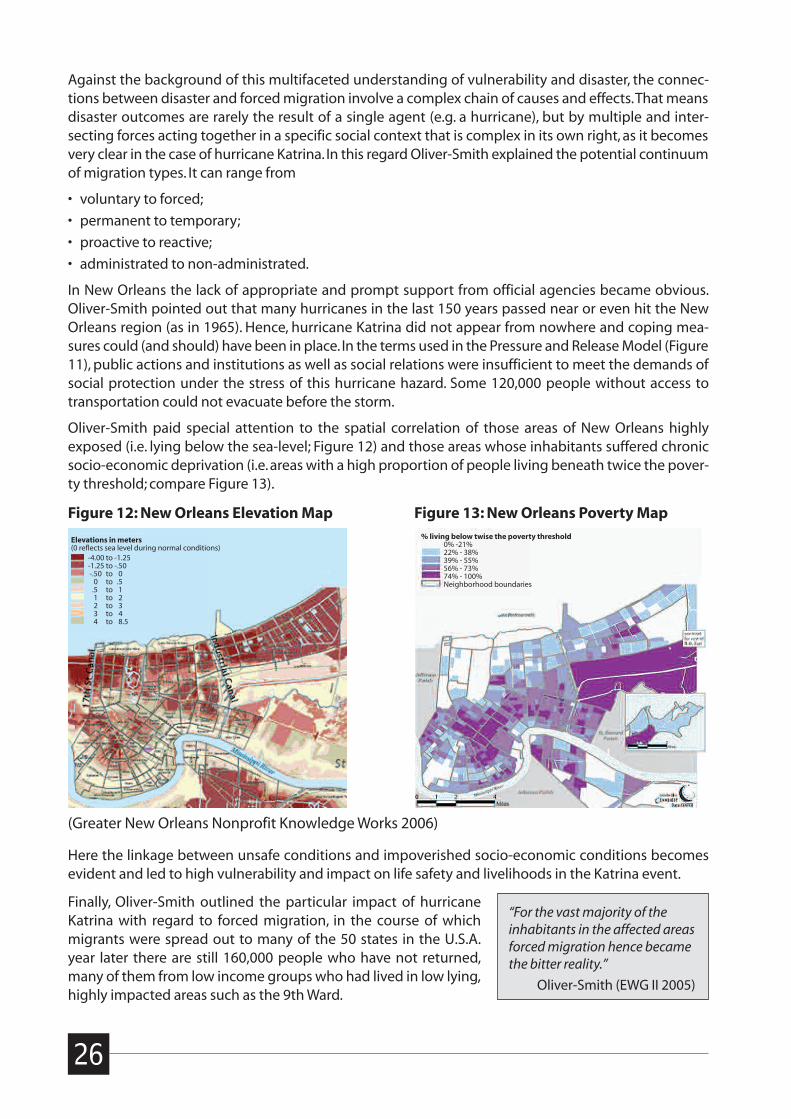
Oliver-Smith paid special attention to the spatial correlation of those areas of New Orleans highlyexposed (i.e. lying below the sea-level; Figure 12) and those areas whose inhabitants suffered chronicsocio-economic deprivation (i.e.areas with a high proportion of people living beneath twice the pover-ty threshold; compare Figure 13).
Figure 12: New Orleans Elevation Map Figure 13: New Orleans Poverty Map
(Greater New Orleans Nonprofit Knowledge Works 2006)
Here the linkage between unsafe conditions and impoverished socio-economic conditions becomesevident and led to high vulnerability and impact on life safety and livelihoods in the Katrina event.
Finally, Oliver-Smith outlined the particular impact of hurricaneKatrina with regard to forced migration, in the course of whichmigrants were spread out to many of the 50 states in the U.S.A.year later there are still 160,000 people who have not returned,many of them from low income groups who had lived in low lying,highly impacted areas such as the 9th Ward.
26
“For the vast majority of theinhabitants in the affected areasforced migration hence becamethe bitter reality.”
Oliver-Smith (EWG II 2005)
% living below twise the poverty threshold0% -21%22% - 38%39% - 55%56% - 73%74% - 100%Neighborhood boundaries
Elevations in meters(0 reflects sea level during normal conditions)
-4.00 to -1.25-1.25 to -.50-.50 to 0
0 to .5.5 to 11 to 22 to 33 to 44 to 8.5

3.3 Russia: Flood Vulnerability
Ivanov, researcher at the Nizhny Novgorod State University of Architecture and Civil Engineering,Russia, outlined research on vulnerability to flood of cities and villages in the Volga region experiencingeconomic, social and institutional transformation in Russia.An important goal of the study is to supportthe effort of the Civil Protection, Emergency Response and Disaster Management Agency (EMERCOM) todevelop vulnerability reduction policies for communities and settlements being affected by floods in the Volga Basin in the Province of Nizhny Novgorod. Ivanov believes Russia has an urgent need to develop tools that enable policy makers and disaster managers to evaluate short and long termdisaster management approaches and interventions (including, but not exclusively, cost-benefit of thedifferent strategies).
In this context Ivanov outlined the differences between short and long-term strategies to mitigateflood losses. In a first phase the research focused on the development and testing of indicators to mea-sure vulnerability to floods in the Volga Basin. The goal was to develop indicators that are useful fordecision makers,particularly EMERCOM.Financial and conceptual support has been provided by UNU-EHS.
The case study comprises seven settlements in the Volga Basin, where overall 300 to 1000 householdsare regularly affected by the spring floods, yielding a flood frequency of 0.2 events per year.The analy-sis in the Volga basin deals with small and medium size floods leading to small and medium size da-mages of property, infrastructure and agricultural assets usually without human losses. This contrastswith the case study discussed earlier of the tsunami in Sri Lanka as a mega-disaster. Those peopleexposed to floods in the Volga River area are chronically stressed through their daily struggle to main-tain their livelihoods in the post-Soviet economic and political environment as well as due to exposureto flood risk over the past ten years. Many live below the poverty line. These communities are oftencharacterized by subsistence farming based mainly on growingpotatoes (the cheapest staple food in the region).
Due to their chronic poverty and daily struggles, most people inthese villages do not invest income in flood protection or insurance.2
They also manifest a deep mistrust in government institutions.
Conceptual Framework
The first phase developed three sets of quanti-tative vulnerability indicators.The first investi-gates experienced losses (financial, human,natural resources) and calculates actual costsof preparedness (e.g. actions and projects toreduce losses) as well as costs and losses pre-vented during disasters. The reference timeperiod of the indicator is one year.
The second set comprises integral indicators,such as modelled expected losses and poten-tial capacity to overcome disasters within a100 year period. Looking at expected losses toflood hazards, vulnerability will be measuredaccording to the classification of economic,social and environmental vulnerability. Poten-tial capacity to overcome disasters is mea-
27
2 On the use of insurance as a tool for reducing the vulnerability of the poor, see Mechler et al. (2006).
“People´s mentality in theserural flood affected villages ischaracterized also by the deepmistrust in government institutions.”
Ivanov (EWG II 2005)
Figure 14: States and Scenarios for Transition(Ivanov 2005)

sured through focusing on institutional activity, such as long-term civil, legislative, and administrativedecisions to reduce potential losses as well as on facilities and structures that contribute to vulnerabili-ty reduction.This aspect of the study compliments the work of Nikitina, Greiving, and Pelling discussedlater in this report.
The nature of the third set of indicators is differential, meaning the calculation of annual changes ofpotential losses per year on the one side and the growth rate of strategic prevention measures on theother. Sub-indicators related to potential losses include those caused by climate change, by the growthof external threats (socio-economic development), and the annual growth rate of prevention costs.Strategic prevention growth rates are to be estimated by calculating the cost of relocation of assetsfrom hazardous areas to safe areas and construction of dykes and dams measured as a percentage ofthe value of saved assets.
Overall, Ivanov concluded that the study is still in its first phaseand that it is much more difficult than expected to obtain thedata needed.
First findings underline the fact that governmental institutionssuch as EMERCOM have no long term strategy for disaster miti-gation. Instead, priority is given to operational disaster manage-ment (e.g. evacuation plans).
Next steps in the assessment will be the testing of the indicatorsfor urban agglomerations and the development of sub-indicators to measure social, economic, andenvironmental dimensions.This will be done in close cooperation with relevant decision makers.
3.4 Tanzania: Vulnerability Assessment at Sub-national Level
In recognition of the various threats that Tanzania faces (flood, drought, pests, famine, cyclones, fire), thegovernment has made various efforts to strengthen its capacity for disaster management by introdu-cing policies, legislation, and operational guidelines. However, these efforts confront obstacles due tolack of reliable data on vulnerability in communities that are exposed to hazards.Therefore, as stated byBilia, a national and sub-national vulnerability assessment was considered a precondition for takingevidence based decisions in disaster management. Thus a study of sub-national vulnerability assess-ment was conducted jointly by the Tanzanian Disaster Management Department in the Prime Minister’soffice and the University College of Lands and Architectural Studies (UCLASS).
Specific objectives of the study were to:
• determine the type, location and frequency of the disasters at the household, village, district andnational level;
• identify the current capacity and coping systems (organizational arrangement) at household, village,district and national level;
• identify causes of vulnerability of major hazards in Tanzania;
• develop a national vulnerability index;
• map vulnerability specific hazards at national level;
• develop a national vulnerability analysis report.
Four main parameters were used to calculate vulnerability indexes at various scales for Tanzania proneto a series of hazards. These parameters were hazard occurrence, effects of the last disaster occurred,hazard manageability and coping strategies. Following UNDP (1992), the following formula was used:
Vulnerability = (Hazard * Risk) / (Manageability)
28
“Also, the socio-economic andinstitutional transformation inRussia hampers data monitoringin many governmental institutions, thus the official census and ministry data is oftenof poor quality.”
Ivanov (EWG II 2005)

The analysis was based on agro-ecological zones as a spatial division of the country.These zones directlyreflect the physical and sometimes also indirectly the socio-economic conditions of the differentcommunities in the country. This is because more than 75% of the population in Tanzania live in ruralareas and depend heavily on farming to sustain their livelihoods.3 Areas with reliable rainfall and goodsoils are likely to be economically and socially better off than areas exposed to drought and with poorsoils.The scale of the study was set up to yield a country-wide vulnerability index. By using a multistagesampling method, the sample size was determined to be 2,040 households living in 84 villages to befound in 42 out of 113 Tanzanian districts. The main tools used for this study include questionnaire-based interviews at household, village, and district level, checklists, GIS (Geographical Information Sys-tems), and statistical analysis. For each level specific questions were used to capture vulnerability andmanageability.For example, at the household level, the question on manageability was meant to deter-mine levels of awareness, while at the village and district level it was meant to determine the level ofpreparedness.
Results
Hazard Occurrence
The results of the interview and household data were used to aggregate hazard and disaster occur-rence for the whole country according to agro-ecological zones. The study revealed that among themost occurring hazards are pests, drought and disease outbreaks.
Coping Strategies
Coping strategies for the three most frequently-mentioned hazards were generated for each zone bymatching and summarizing the captured coping strategies at all levels.With respect to coping capaci-ty, the three main methods identified to cope with drought are selling of assets (33%), seeking employ-ment elsewhere (29%), and growing drought resistant crops (22%).Also here, comparable values for thethree most common hazards according to agro-ecological zones were calculated.
Risk Levels
Moreover, a risk index was calculated for specific disasters by fitting the response variables of thehousehold questionnaire linked to the impacts of the last disaster (e.g. loss of life, property and loss ofincome) into a statistical model that meets the Hosmer and Lemeshow criteria (Neter et al., 1996: 347)(i.e. all variables with a p-value of at least 0.25 in a univariate logistic regression analysis were consi-dered for further analysis). In the case of the impact variable “loss of income”, hazards with significantimpact were drought and floods. Also a single estimate encompassing all effects (see above) for eachagro-ecological zone has been calculated.
Vulnerability Index
Finally, a series of vulnerability indices were developed by using the UNDP formula. Consequently, thevulnerability index was calculated by multiplying the value for hazard occurrence by the value for risk,divided by manageability. A vulnerability index for each zone for each hazard was produced, as well asan aggregate vulnerability index for each agro-ecological zone (Table 1).
29
3 Recalling discussion of economic and social thematic areas earlier, one will not be surprised that throughout rural Tan-zania to varying degrees of informal income and activities also make up a part of people’s livelihood strategies (seeBryceson et al, 2000).

Table 1: Vulnerability Index Parameters for Drought by Agro-ecological Zone (Kiunsi and Meshack 2006)
Parameters Zones
1 2 3 4 5 6 7
Manageability 67.78 76.47 75.99 74.72 68.57 76.80 71.02
Hazard occurrence 31.06 38.94 30.00 78.91 57.69 43.04 40.21(drought)
Risk 0.16 0.31 0.38 0.31 0.42 0.53 0.15
Vulnerability Index 0.06 0.16 0.15 0.33 0.35 0.30 0.08
Legend: Zones 1 = Coastal; 2 = Eastern plateau and mountain blocks; 3 = Southern highlands; 4= Northern rift valley andvolcanic highlands; 5 = Central plateau; 6 = Rukwa-Ruaha rift zone; 7 = Inland sedimentary, Ufipa plateau and westernhighlands.
Using drought as an explanatory example, the central plateau (Zone 5) is the most vulnerable (0.35),closely followed by the northern rift and volcanic highlands (Zone 4) (0.33) and the Rukwa-Ruaha riftzone (Zone 6). Even though drought occurrence is highest in the northern rift and volcanic highlands(Zone 4), its vulnerability is the second highest because this zone has a relatively low risk factor com-pared to the central plateau (Zone 5), due to higher drought manageability capacities. The Rukwa-Ruhaha rift zone (Zone 6), which is the third most vulnerable area, has the highest risk factor comparedto the other zones, but has relatively low drought occurrence and the highest manageability capacities.The other zones have essentially low drought vulnerability because they have low drought occurrenceand high manageability capacities.
During the discussion Wisner made a point that relates to the way infrastructure was conceptualized.Hospitals, dispensaries and open spaces were addressed in the study, but not schools. Wisner recom-mended future research that also considers the exposure of other community infrastructure, especiallyschools. School children in Tanzania may be exposed to such hazards as earthquake, lightning strikes,high wind, fires, and landslides. In addition, schools are often used as community shelters and rallyingpoints following disasters, so they should be resilient and safely located. As disaster managementdepartments may often be relatively weak in the many countries, Wisner recommended trying toestablish an intensive cooperation with the Ministry of Education in order to be able to accomplish sucha study – focusing on the exposure and vulnerability of schools and children.
30

IV. Specific Foci
Attention was paid to specific methods of vulnerability assessment that have been relatively neglectedby most researchers.Those foci can be subsumed under four categories:
• vulnerability and spatial planning;
• vulnerability assessment using remote sensing;
• institutional vulnerability; and
• environmental vulnerability.
4.1 Vulnerability and Spatial Planning
Borchard, President of the Academy of Spatial Research and Planning in Germany, discussed the linkagesbetween spatial planning and vulnerability assessment. The Academy for Spatial Research and Planning(ARL) is a research institute for the spatial sciences performing service functions in both fundamental andapplied areas of research.The ARL was founded in 1946 and is a self-governing body and its performanceis of supra-regional as well as national importance for Germany and beyond.The ARL’s research interest ishow to foster sustainable spatial development that includes social structures, private and public infra-structure as well as regional economies.Moreover,the ARL assists governments with spatial planning andis involved in European spatial development as well as in other cross-border planning ventures.
With regard to the necessity of risk assessment within spatial planning, Borchard stated that althoughnatural and technological risks have long been subject of a great deal of attention within spatial plan-ning in Germany, there is still a substantial lack of risk assessment capable of looking beyond naturalhazards. In other words, there are shortcomings in the way spatial planning deals with natural and tech-nological risks.
Furthermore, the integration of risk assessment results into cross-sectoral spatial planning being conducted in Germany at federal,provincial, regional, and municipal levels is less than satisfactory.There is an urgent need for integrating risk assessment into spatialplanning, but so far there is no comprehensive risk-informationsystem available to serve spatial planning. Hence, the spatial plan-ning community has strong interests in fostering the developmentof sound risk and vulnerability assessment methods.
One of the biggest problems in bringing together risk managementand spatial planning in Germany lies in the difficulty of drawing a clear distinction between the conceptsof “hazard”and “risk”.The main issues of concern in this area are the different administrative responsibilitiesresulting from this distinction.While technological risks fall under the responsibility of the users of thesetechnological systems, hazards of natural origin cannot be accounted to anyone’s responsibility in theoriginal sense of the word.
In the discussion, some participants underlined, that also a landowner who cuts down the forest and indoing so causes increased rain water run off may exacerbate flood risk for downstream residents andwill therefore surely be considered “responsible”.
Again, according to Borchard, spatial planning in most cases has to deal with risks which cannot beclearly attributed to just one source – natural hazards and technological hazards sometimes with com-plex inter-relations (the so-called Natech hazards that combine natural and technological – as in thechemical and oil spills that followed hurricane Katrina in New Orleans; CDC 2006).Moreover, to allow for
31
“There is an urgent need forintegrating risk assessment intospatial planning; however, sofar, there is no comprehensiverisk information system avai-lable to serve the needs ofspatial planning information onrisk, hazard and vulnerability.”
Borchard (EWG II 2005)

sound spatial planning based on detailed consideration and weighing of (minimum) risk and (greatest)benefits, clear planning competences must be assigned to assure spatial planners have access to all theinformation they need.
For the development of spatially-oriented risk management, Borchard proposed a number of steps.
The first should be to identify the assets at risk from proposed developments or measures and to classi-fy these assets within an assessment procedure using indicators.This step should be undertaken in col-laboration with sectoral planning authorities, which is particularly important because of its preventiveeffect. Assets that are affected by hazard impacts may – through their destruction or malfunction –themselves become a source of new risk (e.g. loss of a water or electrical distribution system). Planningcan help to prevent such loss or malfunction.
In the second step all data collected should be aggregated into an expression of a total “risk load”affecting a particular area.
The third step should then be to define specific “risk-area categories”based on the aggregated risk loadexamined in the second step. Those categories which then call for special attention are the ones thatrequire a specific response on the part of spatial planning.The approach presented here could benefitfrom the methodology used within the framework of European Spatial Planning Observation Network(ESPON) hazard project.
Linking spatial planning to risk and vulnerability assessment is necessary for good spatial planning.Thecase of flood protection can serve as an example. In Germany there is a long tradition of settlement infloodplains of rivers, which by definition are areas at high risk of flooding. Furthermore, we see thatpublic funds are primarily used for the construction of technical flood protection rather than makingavailable the land which would be needed for retention areas. Even today, there is a certain resistanceto measures aiming to secure such land for flood protection or at least to restrict development in thoseareas.
4.2 Remote Sensing and Vulnerability Assessment
Recent projects have been trying to incorporate remote sen-sing into the field of vulnerability assessment. One of suchprojects was the testing of approaches for satellite based vul-nerability mapping in Sri Lanka conducted in cooperationwith the German Aerospace Center (DLR) and UNU-EHS. Thiswork was financially supported by the UN-Flash Appeal andthe United Nations International Strategy for Disaster Reduc-tion (UN/ISDR). Voigt from the DLR explained that a majorsubcomponent of the project “Rapid and multi-dimensionalvulnerability assessment in Sri Lanka” was a satellite basedvulnerability mapping.The idea behind using remote sensingto estimate vulnerability was that vulnerability is linked topeople who mostly live in houses and use certain infrastruc-ture which can be assessed with satellite imagery.
Additionally, the proximity to the sea and to earthquakehotspots can be easily examined with the help of satelliteimagery.
32
Figure 15: Report on Rapid Vul-nerability Assessment in Sri Lanka (Birkmann et al. 2006)

In a second step vulnerability proxies using remote sensing could be compared to ground truth data inorder to check the reliability of the satellite data and to assist in interpreting data.
The analysis of vulnerability in this project used Earth Observation (EO) and GIS data structured accor-ding to the following steps (Nassel and Voigt 2006):
• thematic classification and zonation;
• analysis of settlement structure (settlement structure types);
• derivation of vulnerability indicators (estimation of physical vulnerability of specific buildings basedon their roof, height, and density)
• scenario computation;
• derivation of vulnerability estimations based on EO and GIS.
The project showed that ex post comparisons, e.g. of the alteration of the coast line caused by thetsunami (see Figure 17), could be conducted quite accurately even though minor difficulties in definingthe exact run of the coastline occurred, e.g. at places were overgrown parts alternate with openbeaches or in areas of heavy tidal influence (see Figure 17).
Figure 16: Ex Post Tsunami Hazards and Impact Mapping Comparing the Coast Line Beforeand After the Event in Banda Aceh, Indonesia (Voigt 2005)
33

Figure 17: Difficulties in Defining the Exact Run of the Coast Line in Galle, Sri Lanka (Voigt 2005)
The analysis also showed that the computing and aggregation of features like vegetation density,homogeneous settlement types or settlement structures is much more complicated, and comparisonwith ground truth data revealed some substantial inaccuracies. However, the overall analysis showedthat remote sensing can be a great help for impact and rapid vulnerability assessment particularly interms of the physical dimension and the revealed losses.
Of course, EO and GIS data do not constitute assessment of vulnerability on their own because aggre-gated data derived from different remote sensing methods has to be checked against, and combinedwith, ground truth data. Such checking is evident in a project aimed at estimating vulnerability toearthquakes in Istanbul with the help of IKONOS imagery combined with ground data covering build-ing material and structure, etc. – see Figure 18)
Figure 18: Zonation of Istanbul using IKONOS imagery (Taubenböck and Roth 2006)
34
Attributes from EO undGIS:
Structural Type
Inhabitants/Area
Height of houses
Slope
……
Attributes from none-EO
Ground data
Building material
……____________________
=> VulnerabilityEstimates

4.3 Institutional Vulnerability
Many presentations touched on institutional vulnerability.
The presentation of Greiving from the University of Dortmund, Germany, approached the topic by defin-ing institutional vulnerability as being determined by the arrangements which organize risk assess-ment, management and communication. The term “Institutions” wasdefined as all public agencies dealing with risks on a collective level.4
For example, as seen in the Katrina case study, institutional arrange-ments from local through state to federal seem to have increased ratherthan decreased the vulnerability of most people to the hazards presen-ted by the hurricane and its aftermath (flood, chemical spills, etc.).Hence, vulnerability assessment is first and above all meant for publicinstitutions aiming at better decision making. In order to do so theyneed to enhance their understanding of how institutional systems atissue work – one fundamental component of vulnerability assessment.
In Greiving’s view, increased institutional vulnerability can arise in two ways. Firstly, there can be mis-matches in the interplay among different institutions involved in risk assessment, communication, andmanagement. Secondly, there can be mismatches between institutions and stakeholders. In order tocapture both dimensions institutional vulnerability has to be assessed by measuring both, institutionalsettings (existing instruments, measures, procedures, responsibilities) as well as their performance inpractice (decisionmaking in emergency situations at sub-national and local levels).
Coordination between institutions responsible for two basic social protection functions – prepared-ness and mitigation – is seldom optimal.Even considering just mitigation plans and programmes, theseare carried out by different actors (spatial planning, water management, geological survey, etc.) eachpromoting different mitigation actions which are often not well coordinated. In other cases hazard andvulnerability related information is simply not available or does not satisfy the needs of different end-users (scale, content, etc).
In order to track potential mismatches, indicators could include whether shared risk assessment stan-dards (e. g. hazard risk maps) have been established within a jurisdiction or whether there are workinggroups aiming to coordinate risk management activities. By the same token, possible improvementsmight include the development of guidelines for harmonized risk assessment (such as the forthcomingEU directives on flood risk management and hazard mapping; EU 2006). Additionally, funding policycould be readjusted, setting protection goals to be guaranteed on a comprehensive, regional basis(with representatives of all actors involved) instead of granting single projects.
Concerning emergency response, poor coordination is alsoobserved. Greiving reported that actors frequently only havecontact with people from their own organization but not with“external” actors. Moreover, in many cases substantial disagree-ment exists concerning the scale of event that should triggerresponse, and this leads to delay in response. Concerning indi-cators of this problem, Greiving suggested some possible crite-ria. Firstly, the existence of standard national organisational re-gulations for disasters (although care should be taken to diffe-rentiate between paper plans such as existed in the case of Ka-
35
4 M. Pelling (see below) defined institutions differently as sets of rules both within and among institutions, a conceptthat includes informal and tacit expectations in addition to formal “arrangements.”
“Measuring institutional vulnerability has to assessinstitutional settings(existing instruments,measures, procedures andresponsibilities) as well astheir performance in practice.”
Greiving (EWG II 2005)
“Hazard and vulnerability information is often not availableor does not fulfil the needs of thedifferent end-users.Thus one possible response could be thedevelopment of guidelines for harmonizing risk and vulnerabilityassessment.”
Greiving (EWG II 2005)

trina in the U.S. and actual implementation and execution of the plan). Secondly, one might investigatethe existence of common overall goals for disaster protection and their implementation in practice.Thirdly, the existence of complementary equipment and qualifications should be checked (“inter-oper-ability”).Fourthly, one can inquire whether or not simulations of emergency situations are conducted inorder to test readiness for disaster preparedness and response.
In order to reduce mismatches, response actions can be improved and fostered.To do so, it is necessaryto define common overall goals of disaster protection, e.g. by means of protection objectives for diffe-rent protection goods (people, infrastructure, private property). Additionally, a clear definition isrequired and an investment policy that rules out overlapping tasks and distributes resources accordingto protection requirements. Moreover, the training in the so-called “soft”capabilities and skills (motiva-tion, social and communicative competence, discipline, etc.) is essential, particularly for task forces andmanagement staff. Finally, it is crucial to communicate the goals to the local stakeholders and, as somementioned in discussion, intensive listening to what local stakeholders have to say in response.
Nikitina from the EcoPolicy Research and Consulting from Russia presented a study similar to the one byIvanov. Institutional capacities and incapacities with regard to floods in Asia were assessed. This workarose because of the paradox that even though there are many institutions in place, the number ofpeople affected by floods in Asia has doubled within the last decade. This paradox raises many ques-tions.Which institutional failures occur and why? What possible measures are there to improve the si-tuation? In order to answer these questions the researchers chose an approach that distinguishesbetween “design”and “action”(i.e. plan vs. implementation or invention vs. performance).This approachallows identification of success and failures in the performance of institutions and promises clarity con-cerning those shortcomings rooted in the institutional design or set up and those successes andfailures that stem from insufficient implementation (action).
In order to allow for an even more specific analysis, the approach analysed management of floodevents according to the stages of preparedness, emergency, response, and rehabilitation.
The study presented was carried out in cooperation with researchers from Japan, Russia,Thailand, andVietnam. In all these countries floods are at the top of the national disaster reduction agendas with aparticular focus of linking science and practice. Similarly to the study presented by Greiving, institutio-nal capacities and incapacities were assessed in light of the complex of intertwining administrativearrangements, the appointment of vertical and horizontal responsibilities including overlapping andconflicting mandates and missions among national, provincial, and regional agencies. It also took intoconsideration the fabric of legislation, the existence of programmes, strategies, and action plans relatedto the allocation of financial resources as well as insurance and availability of policy tools.
The study revealed some positive trends taking place over the last few years.The last decade witnessedseveral attempts to modernize institutional settings coming along with an enhanced awareness for thenecessity to combine emergency efforts with sound prevention and planning.
Moreover, there is a trend towards broader involvement of capacities at the local level as well fosteringof community based participation.Concerning state participation, the study revealed that its role is for-mally very large. This is because the state in most systems of political theory is the provider of publicgoods including the performance of emergency actions and, to some extent, the improvement of so-cietal and economic resilience (Wisner 2005)
However, the study also revealed problems. The external fac-tors explaining shortcomings are relatively easy to identifysince they have existed and been subject of study for a longtime.Typical examples are the impoverishment of the popula-tion, financial shortages, corruption, and weak legislation or atleast weak enforcement of legislation. Internal factors, how-
36
“Although an intensive coordinationbetween stakeholders and authorities is envisioned by most ofthe institutional designs, implemen-tation can not be observed widely.”
Nikitina (EWG II 2005)

ever, are more complicated and cause to return to the question whether one is dealing with defects indesign of risk reduction institutions or simply poor performance. For example, intensive consultationbetween stakeholders and authorities is envisioned by most of the institutional designs reviewed bythis study; however, implementation was generally observed to be weak. By the same token, bureau-cratic barriers of all kinds were found to be still very high and non-compliance with existing legislation,particularly in weak states, was widespread.
Plenary discussion achieved consensus that the management of risks has become increasingly politi-cized and contentious in recent years. Defining risk is an exercise in power. Who in society shoulddecide what an “acceptable”or “real”risk is? Hence, trust, or better the lack of it, has to be understood ascentral for the question of how disparities between "real" and "perceived" risk might engender publicdiscourse. Moreover, more public participation in both risk assessment and risk decisionmaking isneeded for more legitimacy and public acceptance of the resulting decisions.
4.4 Environmental Vulnerability
Another area of vulnerability research discussed was the role of the environment in two ways – withrespect to hazard impact (intensity), vulnerability, and human well-being as well as regarding humanimpact on natural systems. Presentations by Kok, Renaud and Jayasingam reviewed how researchersconceptualize environmental vulnerability and what methods and tools can be used to identify andassess environmental concerns in the context of hazards of natural origin.
Kok introduced the approach of archetypes of vulnerability that have been generalized from differentparts of the world – for example, the semi-arid tropics or sub-tropical mountainous environments.Suchmodelling has been advanced as a way that planners can anticipate negative interactions betweenland use and livelihood and long run sustainability in the face of recurrent natural hazards. (UNEP 2007)
Renaud and Jayasingam presented examples of applied indicators to measure environmental vulnera-bility after the Indian Ocean Tsunami in Sri Lanka at the local level. In this context interesting and con-troversial questions emerged such as whether there is a unique “environmental vulnerability”separatefrom human activities and how far human vulnerability should encompass environmental vulnerabili-ty thus implying coupled human-environment systems.Therefore, the term “environmental vulnerabi-lity”brings about a two-fold perspective and created vivid debate.
The first point of view focuses on the susceptibility and fragility of ecosystems and environmental com-ponents themselves (implying philosophically a bio-centric vs. anthropocentric perspective).
Figure 19: Mangroves in Sri Lanka Figure 20: Water Supply After the Tsunami
(UNU-EHS, Renaud)
37

This view was represented by Jayasingam, who underlined the importance of focusing on the impact ofthe tsunami wave on the coastal landscape as well as on how human induced threats increase the vul-nerability of environmental systems, for example through civil war, mining and fish-farming as ob-servable in Sri Lanka.Thus according to this first view “environmental vulnerability” is a function of thefragility of environmental systems and their continuous change over time, implying impacts forhumans only as secondary consequences.
The second point of view regards “environmental vulnerability” as a disruption of environmental servi-ces which are essential for human well-being,such as clean drinking water, fertile and non-toxic soils forproductive agriculture, etc. From this perspective the impacts of hazards are analysed in terms of theinterlinkages between environmental or ecosystem services and human activities and needs.This kindof analytical approach was adopted by the Millennium Ecosystem Assessment (2006) and also by GEO-4(UNEP 2002, p.303). This second view is philosophically anthropocentric as opposed to bio-centric,and has become the dominant departure point of international research (e.g. notions of “sustainablehuman development” and “environment and development.”) The Hyogo Framework for DisasterReduction contains this set of assumptions as well to the extent that it prioritized “mainstreaming”disaster risk reduction into development.
Against this background Renaud formulated key questions which have to be answered in order to setup indicators to measure environmental vulnerability in coastal areas to tsunami and other coastal ha-zards.
• What role and value do the different environmental components in terms of protection (exposure) have?
• What services are provided by an ecosystem for a human community (vulnerability)?
• What is the state of the resource: quality, quantity and reliability?
• To which extent are environmental services accessible to human communities and the differentsocial groups?
• What are the capacities to cope and to adapt possessed by both the environmental and eco-systemcomponents and the human community (and constituent groups – e.g. to climate change orincreased climate variability)?
Regarding the first question, the situation in Sri Lanka after the tsunami indicated some intact man-grove stocks had buffering effects on the waves, which means they mitigated the impact of the tsuna-mi (protection) on coastal communities. By contrast, where these natural buffers were replaced byurban infrastructure major fatalities and destruction occurred.
The impact of the tsunami on environmental services can also be examined in Sri Lanka by looking atwave action on agricultural fields and the water resources (e.g. wells) that are essential for a communityin every day life.The tsunami caused a contamination (salinisation) of wells. Overall, the contaminationand salinization of wells increased the level of vulnerability of rural coastal communities in Sri Lanka.Some communities now depend solely on one source of water, usually a source provided as relief assis-tance. In this case, the resulting increase in vulnerability is intuitively clear since this single new sourcecould be disrupted by a future extreme event leaving community members without a back-up source.
Since the dependency of communities on environmental services is highly diverse and locally specific,the use of general statistics at the national level is not sufficient to assess environmental vulnerability.Information needs to be collected locally that allows understanding of likely hazards as well as spatial-ly specific data on the fragility and vulnerability of environmental services and how human livelihoodsand basic needs are dependent on them.
An interesting discussion followed about how to capture such place-based features of environmentalvulnerability and how to scale up local information to the district or to the sub-national level for plan-ning and policy making purposes.
38

In contrast to such a detailed, place-based (and often participatory) process of assessment, UNEP’sannual GEO report attempts to portray different aspects of vulnerability to environmental change inone composite indicator in order to be able to compare countries and regions. Global comparisons areuseful for other purposes than community based action planning and the building up of communityresilience.World wide and regional trends may be revealed with sufficient clarity by the latter to call forinvestment and political will at the national and international level.
UNEP´s report is structured according to a state-pressure-impact-response type of model common inglobal change research (e.g. the Millennium Ecosystem Assessment). Its conceptual basis lies in the vul-nerability framework of Turner et al. (2003), which includes a sophisticated way of thinking about thecoupling of human and environmental vulnerabilities (Figure 7).
Returning to the work presented by Kok, a special local-global up-scaling methodology has beendeveloped – the archetype approach (see BOX 10).
This approach identifies envi-ronmental – human well beingcorridors or pathways that areexposed to stressors at thelocal level but can be observedto occur in other parts of theworld – thus desertification, forexample, brings into play localstressors that are very similar inRajasthan, Northeast Brazil,and the Sahelian zone of WestAfrica. That means the arche-type approach focuses on aspecific, representative patternof the interactions betweenenvironmental change andhuman wellbeing.
Referring to this archetypeapproach, Wisner pointed outthat one has to be carefulwhen constructing the archetypes of vulnerability. He warned against researchers’ possible strongEuro-centric perceptions of what an archetype of vulnerability might be, while a local African commu-nity might view the same processes differently. Therefore, he suggested integrating local stakeholderknowledge within the development of archetypes.
39
BOX 10: Example for an Archetype Approach (Kok 2005)

V. Vulnerability: A Topic in the Political Arena?
Being institutionally located at the interface of science and policy making, UNU-EHS pays special atten-tion to the identification of areas of vulnerability research that enable the scientific community tomainstream research outcomes into decision making processes of governments and other entities (private sector, NGOs, foundations, international organizations, etc.).Therefore the Expert Working Group IIput special emphasis on the question how scientifically-based vulnerability assessments should be setup in order to be appropriately integrated into decision making.This was part of the panel discussionon the first day and ongoing debates in the second and third day of the meeting.
Bohle suggested that some basic questions arise when designing policy relevant indicators for theassessment of vulnerability. Among other questions one has to take the following into consideration:
• Vulnerability of what?
• Vulnerability to what?
• Vulnerability assessment for whom?
• Vulnerability assessment of whom?
• Vulnerability assessment for what purpose?
These questions imply the recognition of the horizontal and vertical multi-dimensionality and com-plexity of vulnerability and the diversity of stakeholders, decision-makers and interest groups at diffe-rent levels who act according to their political mandate and material interests.That means for examplethat the Social Protection Unit of the World Bank or a governmental institution of a developing countryor a local environmental justice movement looks at vulnerability from different perspectives. Somefocus more on the coping or the exposure side, for example. Diverse groups of decision makers see vul-nerability reduction in a specific context such as spatial planning, poverty alleviation, disaster pre-paredness, or political empowerment.
The last three of Bohle’s questions also clearly suggest there is power dynamics at work. Interests are atstake in any assessment of vulnerability. Although the Hyogo Framework of Action and other consen-sual documents such as the Manizales Declaration (UNDP 2004) emphasize “community participation”and co-responsibility for the creation of a “culture of prevention,” in fact, in most places empowermentof communities to protect themselves and to demand social protection from government is seldom abyproduct of vulnerability assessment.
Leaving to one side the previous knotty problem, EWG participants asked,“What do decision makersneed to know about vulnerability”?
This question is sensitive and can even be a dangerous one inBohle’s opinion. Politicians usually take what they want from anyreport or assessment. It might be futile to debate whether it is suffi-cient to provide decision makers with aggregated overview infor-mation or better to try to communicate in-depth assessments anddetailed research outcomes.The latter might enable political deci-sion makers to make better judgments, but such a desirable out-come depends on the entire political system, not on whether a cer-tain key political figure has more or less information available. Evenworse, sometimes politicians instrumentalize the information theyget for their own purposes.
In this context it is important to lay open the assumptions constituting aggregated data or any assess-ment tool for measuring vulnerability. Thus, special attention needs to be paid to the process of thedevelopment of knowledge-based vulnerability indicators and how to smoothly translate them into
40
“Special attention needs to be paid to the process of thedevelopment of knowledgebased vulnerability indicatorsand how to smoothly translatethem into politically applicable assessment toolswithout being misused bydecision-makers.”
Bohle (EWG II 2005)

politically applicable assessment tools.To ensure that this is understood by the general public and notjust by political decision makers, a simple language should be used, including the local vernacular.
Considering also the many dedicated and honest government officials that are in evidence all over theworld, care needs to be taken in “packaging” assessment tools and results in ways that are compatiblewith their work situation – time and resource limits as well as technical capacities.Careful give-and-takebetween researcher and end user is the key to developing products that fit into the average workloadof someone making routine decisions in a government ministry or agency.
BOX 11: Horses for Courses
Figure 21: Participants at EWG II Public Panel Discussion on the First Day
(UNU-EHS, Garschagen)
This important, cross-cutting discussion touched on the area of institutional vulnerability since theoverlapping issue of “good governance” was emphasized by Nikitina, Wisner, Pelling, Cardona andBohle.They argued in discussion that institutional capacities, decision and investment frameworks, andbehavioural roles matter when trying to measure vulnerability. In line with this argumentation Nikitinacalled for better tools to assess institutional capacities. Cardona pointed out the need for governmentsto manage multidimensional vulnerability concerns, implying that national and local administrativelevels need different information and different tools to measure vulnerability. Bohle stressed the needfor a coherent, vertically integrated measurement of vulnerability that links bottom-up and top-downapproaches, leading to more successful balances and transparency in decision making.
41
Vulnerability assessment can be very simple if the purpose is clear and the institutional conditions aregood. For example, in Cuba there are frequent hurricanes. Given the purpose of protecting lives from ahurricane and given that there are a great deal of institutional resources available to support theneighbourhood community it is possible for neighbourhood level assessment to take place beforeeach hurricane season to identify risk and vulnerability. There are certain circumstances the neigh-bourhood community actually identifies via neighbourhood committees before the hurricane comes.They may, for example, identify the presence of pregnant and nursing women or a disabled person.Thus when it comes to evacuation, this can be done precisely in relation to these pre-assessed vulner-ability conditions, including special shelters for pregnant and nursing women. In this way Cuba lostonly 18 lives to hurricanes between 1996 and 2004. So I think assessment can be very simple, but itrequires specific preconditions in governance and political will.
Wisner (EWG II 2005)

Overall one can conclude that both more and less developed countries lack innovative, cross-cuttingand transparent decision making procedures conducive to facilitate reconciliation of risk reduction,safety and resilience interests of diverse stakeholders at different administrative levels. Vulnerabilityassessment, starting with the development of goals, definition of “acceptable risk,”use of indicators forassessment, action planning on the basis of assessments and evaluation of action call for newapproaches to governance.
This brought up the question which direction vulnerability assess-ment research should take in future. In this regard, Bogardi raisedthe question whether it is possible and useful to engage with theinternational political process and to mainstream the issue of vul-nerability and vulnerability reduction by organizing an internatio-nal conference on vulnerability assessment. By referring to the science-policy links between United Nations Framework Conventionon Climate Change (UNFCCC) and Intergovernmental Panel onClimate Change (IPCC) the question was raised whether similarscientific structures were needed for land degradation and for vul-nerability to mainstream scientific assessment and concepts intothe political process.
42
“Is it possible and useful toengage with the internationalpolitical process and to mainstream the issue of vulnerability and vulnerabilityreduction by organizing aninternational conference onvulnerability assessment?”
Bogardi
VI. Conclusions and Recommendations
6.1 Progress Since the First EWG Meeting
The EWG II meeting included more participants and disciplinary backgrounds than the first ExpertWorking Group meeting, a facet that complemented the aims of EWG II. Engineers, practitioners, socialscientists, and natural scientists came together, speaking different professional languages,coming fromdifferent institutions and cultures. This diversity made it possible to share new methods and expe-riences in developing tools to measure vulnerability. There were also new debates. These debatesimproved the participants´ ability to provide “ground truth” and apply similar reality checks to theirwork.
These improvements were also made possible by the inclusion of partners from specific study areasUNU-EHS is involved with (Sri Lanka, Russia and Tanzania), and by the field work background that par-ticipants brought from other countries, aired in discussions as well as formal presentations (Colombia,Central America, South Africa, Germany).The inclusion of young scientists in the meeting and its nest-ing in the context of the larger conference of the IHDP open meeting (IHDP 2005) provided furtherenrichment.
6.2 Creative Tensions and Conclusions
COMPLEXITY VERSUS SIMPLICITY
In measuring and assessing vulnerability, there is a tension between complexity (cultural and micro-economic – especially as regards livelihood and survival strategies, institutional and political) versusmathematical parsimony.The creative tension is between the need in some cases for a single numberthat expresses vulnerability and in others for the need for “thick descriptions” (Geertz 1973) or othernarratives that capture the dynamism and specificity of the processes in daily life that make a groupvulnerable.
Conclusion: One should ask what the measurement or assessment is for, whose interests it serves,speak with the stakeholder and listen to them.Tools and methods should suit the researcher´s / institu-tion’s purpose and constraints.
PROCESS VERSUS PRODUCT
At one extreme, methods such as those that include the vulnerable groups as active participants or co-investigators in research tend to privilege the process of the research itself over the outcome.For exam-ple, some NGOs use community based risk assessment as a method of empowerment of local people.The benefits of such approaches are that locals understand their own ability to cope with risks and canarticulate their needs vis-à-vis government and donors, and local elites (landowners, factory owners,etc.). Such methods focus on the process of investigation rather than a concrete deliverable such as areport, hazard map, etc.At the other extreme, governments and donors focus on products or outcomes.They often are quite unaware of the social impact of decisions they make about method or process.Forexample, at the moment – particularly in the current reconstruction phase – Sri Lanka needs variousproxies and indicators of vulnerability, maps, etc. to help them pursue immediate tsunami recovery. Insuch a circumstance, it is important to provide the appropriate products, including approximate onesthat are useful for rapid appraisal, emergency and evacuation planning and mid- and long-term reco-very efforts. Later, however, a more participatory and process-conscious approach will likely be neces-sary if the majority of tsunami affected people are to accept measures such as the controversial bufferzone.
43

Conclusion: Process and product are both important in different ways. Researchers should keep bothexplicitly in mind in the various stages of work during which the balance between the two may change.Moreover, in rushed and dynamic conditions (e.g. recovery process), it is necessary to work in incremen-tal and iterative terms: to build an indicator set, test it, see its status, improve it, and continue using themodified approach.
UNDERSTANDING VERSUS IMPLEMENTATION
Partners in some disaster affected places reported that there is a tension between fully understandingthe complexities of vulnerability, coping, and recovery versus business-as-usual human developmentplanning, service delivery, and finance. Despite years of discussion of the “disaster-development con-tinuum,“ (UN 2006) governments, international organizations, and donors still find it difficult to transi-tion from a post-disaster situation to “routine” governance and social life without losing many of the“lessons” of the prior disaster.Will these lessons be learned in Sri Lanka? In Tanzania? In Russia? Are themethods and tools for vulnerability assessment presented to the EWG II adequate to ensure “main-streaming” and incorporation of lessons from the tsunami, from drought, or from flood into “routine”decision making?
Conclusion: Use of remote sensing (as in Sri Lanka) and large scale questionnaire surveys (as in Tanza-nia and Sri Lanka) are important first steps toward understanding vulnerability but do not yet accom-plish the task. More is needed to provide in depth understanding of the coupled human-environmentsystems at the local level and how political and economic power at the national and international le-vels affects locally experienced vulnerability. However, since government and agency professionals aremore used to information of the kind that remote sensing and questionnaire surveys present, thesefirst steps are also excellent ways to engage with such professionals and begin a discussion that canthen extend to more detailed examination of local reality and driving forces that shape local condi-tions.
DEVELOPMENTAL VERSUS ENVIRONMENTAL CONTEXT
The emerging notion of environmental vulnerability is anthropocentric, and focuses on the relationswithin coupled human-environment systems. The approach focuses our attention on the impactextreme events have on ecosystems and ecosystem services. Additionally, the notion underlines theimpact of human economic and social development on ecosystems, including, for example, land degra-dation and deforestation. The concept of environmental vulnerability also reminds us that economicactivity impacts ecosystems as well and that in the past common socio-economic development strate-gies proved to be inappropriate to achieve a balance between socio-economic demands and the envi-ronmental capacities of various ecosystems.
Conclusion: There is no contradiction between developmental human need and welfare focusedapproaches to vulnerability assessment and methods that focus on the environment. However, work in
44
• Are decision makers interested in this subject?
• How can we learn about the wishes and needs of the policy makers?
• Should we have a three-day workshop where half of the people would be real policy makers in exe-cutive, legislative and their constitutive branches of government?
• Are we ready to assist them?
• How to proceed to be policy relevant?
Bogardi (EWG II 2005)
BOX 12: Challenges Ahead

this area can be enriched by more dialogue with the climate change community and others concernedwith global environmental change, where discourse about risk, vulnerability, resilience, and adaptationparallels the concerns of the EWG.
6.3 Recommendations
Exhortations are easy. What is harder are the systematic changes in governance and in the practice ofscience that would bring the two together in building a culture of prevention.Certainly from the side ofscience, one only has to consider the difficult birth of such interdisciplinary (even trans-disciplinary)endeavours as Earth System Science – from the early notion of multi-disciplinary cooperation at thebeginning of UNESCO’s Man and the Biosphere Program [early 70ies] to the publication of the Millen-nium Ecosystem Assessment in 2005 to realize how long and difficult it is to accept new methods of work.Therefore, the recommendations below are short-term and address the next steps in building the inter-disciplinarity and inter-positionality required not only to choose or develop approaches of measuringvulnerability but also to put them to work in practice.They take the form of four clusters of related re-commendations.
Recommendation Cluster 1: Systematic meta-review is needed
A systematic meta-review is needed of precisely what kinds of end users and stakeholders need whatkind of assessments and measurements of vulnerability for what kinds of purposes.The work of EWG Iand II shows clearly that no “one size fits all” definition or way of “capturing” vulnerability will serve theplanning, decision making, and evaluation needs of all end users at international,national, sub-national,and local levels.
Having established, essentially, the answers to Bohle’s questions (“for whom”, etc.), this research shouldcanvass the existing methods and metrics available, objectively evaluate limits of their accuracy, pre-requisites, cost (in financial and human resources), and past (observed) benefits. Attention should bepaid to non-state as well as state actors (Wisner & Haghebaert, 2006) in carrying out this research.
Recommendation Cluster 2: Link methods to capacity building
Process and product are both important in different ways in the course of measurement and assess-ment. We should keep both explicitly in mind at various stages of our work during which the balancebetween the two may change. In concrete terms, introduction of methods for measuring and assessingvulnerability to institutions should be accompanied by in depth capacity building.
Ideally, the methods themselves will be user-friendly and dynamic enough to “surprise”the user and re-awaken awareness of the scope and seriousness of the decisions under consideration.
The problem is that extreme events that may trigger disasters are uncommon relative to other factorsthat affect decision making.There may be long months and even years of “routine” planning and deci-sion making between them. How, then, do civil servants and other end users maintain their alertnessand critical edge? This is a challenge for researchers, trainers, and software developers. While some
45
5 “Positionality” is the situation that a professional or decision maker (no matter what disciplinary background) inhabitsas defined by the total cultural and political context of her or his work – type of institutional setting (government,NGO, business, etc.), job description and responsibilities, work load, human and financial resources available to do her/his job, seniority/ gender/ ethnicity, informal networks and access to “short cuts” with the bureaucracy. Hence, “inter-positionality” refers to development of networks of people who make decisions about risk reduction from a broadcross section of such “positions” who are able to communicate their diverse needs for different kinds of vulnerabilitymeasurements and act as a “focus group” to evaluate tools and methods that may be available “off the shelf.”

innovative methods have been developed,6 they generally do not include enough follow up and in-service refresher training. As there is considerable attention at the moment to South-South exchangeand co-learning, attempts should be made to link introduction of vulnerability assessment methods toemerging South-South dialogues.
Recommendation Cluster 3: Balance approaches to characterize vulnerability
Without pre-judging the result of the systematic review recommended above, the results of EWGs I andII strongly suggest that in most cases at all scales, some adequate mix of quantitative and qualitative aswell as macro and micro data is required to characterize vulnerability.
Better quality and longer data series are also required. The practical recommendation implied is thatmore effort is required in cross-training and team formation/ maintenance so that full advantage is ta-ken of earth observation data, socio-economic data, institutional and community profiles, narrativesand oral histories. Optimism that this can happen comes, from among other developments, theexistence of a well-established worldwide network using participatory GIS for many purposes inclu-ding disaster risk reduction (PGIS Net, 2006).
Use of remote sensing (as in Sri Lanka) and large scale questionnaire surveys (as in Tanzania and Sri Lan-ka) are important steps towards measuring and understanding vulnerability. However, more is neededto provide in depth understanding of the coupled human-environment systems at the local level aswell as how political and economic power at the national and international levels affects locally expe-rienced vulnerability.
Recommendation Cluster 4: Dialogue between different research communities
Although vulnerability research has progressed significantly in recent years, it is evident that furtherresearch is needed to address the intersection and interactions between human and environmentalsystems and their dynamics, and their significance for vulnerability.
Dialogue and cooperation among those engaged in disaster risk, vulnerability research, climate changeresearch, the sustainable development policy and practice should be strengthened.This conversationwill enrich interdisciplinary research on human security.Vulnerability, resilience, coping and adaptationare – although differently defined – common concerns.
46
6 Among others, see the simulation methods developed by Crowding the Rim used by a cross section of state and non-state actors from Pacific Rim countries during a “summit” meeting at Stanford University in California, USA in 2001.Three tools were developed: Rim Sim, a simulation for setting priorities in post-disaster reconstruction; HazPac, GIS-based hazard maps to facilitate risk assessment and decision making; and the Education Module, which gives studentsan appreciation of natural hazards risk. Unfortunately its web site is now, five years later, disconnected and thereseems to be no continuing use of these innovative tools (See on CTR Purpose: USGS 2006; on CTR tools: ADPC 2006; foroverview of CTR approach: UNCLOS 2006).

List of Abbreviations
ADRC Asian Disaster Reduction Centre
ARL Academy for Spatial Research and Planning [Akademie für Raumforschung und Landesplanung]
BBC Bogardi-Birkmann-Cardona
BRCP Bureau for Crisis Prevention and Recovery
CASA College of Assiciated Scientists and Advisors
COGSS Coalition for Global School Safety
CRA Community Based Risk Assessment
CRED Centre for the Research on the Epidemiology of Disasters
DDI Disaster Deficit Index
DEFRA Department for Environment Food and Rural Affairs
DFID Department for International Development
DLR German Aerospace Agency [Deutsches Zentrum für Luft- und Raumfahrt]
EMERCOM Ministry of Russian Federation for Civil Defence, Emergencies and Elimination of Consequences of Natural Disasters
EO Earth Observation
ESPON European Spatial Planning Observation Network
EU European Union
EWG Expert Working Group
GEO Global Environmental Outlook
GIS Geographical Information System
IFRC International Federation of Red Cross
IHDP International Human Dimensions Programme on Global Environmental Change
IKONOS Name of a high resolution imagery satellite
IPCC Intergovernmental Panel on Climate Change
LTTE Liberation Tigers of Tamil Eelam
NGO Non-Governmental Organization
PGIS Participatory GIS
PPEW Platform for the Promotion of Early Warning
UCLASS University College of Lands and Architectual Studies
UNCCD United Nations Convention to Combat Desertification
UNDP United Nations Development Programme
UNEP United Nations Environment Programme
UNESCO United Nations Educational, Scientific and Cultural Organization
UNFCCC United Nations Framework Convention on Climate Change
UN/ISDR United Nations International Strategy for Disaster Reduction
UNU-EHS United Nations University – Institute for Environment and Human Security
WCDR World Conference on Disaster Reduction
WIDER World Institute for Development Economics Research
ZEF Center for Development Research [Zentrum für Entwicklungsforschung]
47

References
ADPC (2006): Asian Disaster Management News. <http://www.adpc.net/Infores/newsletter/2001/ADPC-2.html>
Birkmann, J. (2005): Measuring Vulnerability. UNU-EHS WORKING PAPER No. 1 <http://www.ehs.unu.edu/index.php/article:174?menu=18>, 12 September 2006.
Birkmann, J., (Ed.) (2006): Measuring Vulnerability to Natural Hazards.Towards Disaster Resilient Societies.UNU-Press,Tokyo, New York, Paris.
Birkmann, J.; Fernando, N.; Hettige, S.; Amarasinghe, S.; Jayasingam,T.; Paranagama, D.; Nandana, M. D. A.;Nassel, M.;Voigt, S.; Grote, U.; Engel, S.; Schraven, B.;Wolferts, J. (2006): Rapid and Multidimensional Vul-nerability Assessment in Sri Lanka. UNU-EHS, Bonn, Colombo.
Birkmann, J.; Fernando, N. (2007): Measuring Revealed and Emergent Vulnerabilities of Coastal Commu-nities to Tsunami in Sri Lanka. In: Disasters. (accepted for publishing).
Bogardi, J.; Brauch, H.G. (2005): Global Environmental Change: A Challenge for Human Security – Defin-ing and Conceptualising the Environmental Dimension of Human Security. In: Rechkemmer, A. (Ed.),UNEO – Towards an International Environmental Organization – Approaches to a Sustainable Reform ofGlobal Environmental Governance. Nomos, Baden-Baden, pp. 85–109.
Bohle, H.-G. (2001): Vulnerability and Criticality: Perspectives from Social Geography. In: IHDP Update2/2001. Newsletter of the International Human Dimensions Programme on Global EnvironmentalChange. pp.1-7. <http://www.ihdp.uni-bonn.de/html/publications/update/update01_02/IHDPUp-date01_02_bohle.html>, 12 September 2006.
Bryceson, D.; Kay, C.; Mooij, J. (Eds.) (2000): Disappearing Peasantries. ITDG Publishing, London.
Cardona, O.D. (1999): Environmental Management and Disaster Prevention: Two Related Topics:A Holistic Risk Assessment and Management Approach. In: Ingleton (Ed.): Natural Disaster Mana-gement. Tudor Rose. London.
Cardona, O.D. (2001): Estimation Holistica del Riesgo Sismico. Utilizando Sistemas Dinamicos Complejos.Technical University of Catalonia. <http://www.desenredando.org/public/varios/2001/ehrisusd/index.html>12 Oktober 2006.
Cardona, O.D. (2004): The Need for Rethinking the Concepts of Vulnerability and Risk from a HolisticPerspective: A Necessary Review and Criticism for Effective Risk Management. In Bankoff, G.;Frerks, G.; Hilhorst, D. (Eds.), Mapping Vulnerability: Disasters, Development and People. Earthscan Publishers, London.<http://www.desenredando.org/public/articulos/2003/nrcvrfhp/nrcvrfhp_ago-04-2003.pdf#search=%22cardona%20need%20for%20rethinking%20bankoff%22>, 12 September2006.
Cardona, O.D. (2005): Indicators of Disaster Risk and Risk Management. Program for Latin America and the Caribbean. Summary Report. Inter-American Development Bank. Sustainable DevelopmentDepartment.Washington, D.C., pp. 43.
CDC (2006): Protect Yourself From Chemicals Released During a Natural Disaster. <http://www.bt.cdc.gov/disasters/chemicals.asp> 12 September 2006.
Christoplos, I.; Mitchell, J.; Liljelund, A. (2001): Re-framing risk: the changing context of disaster mitiga-tion and preparedness. In: Disasters. vol. 25, no. 3, pp. 185-98.
DFID (Department for International Development) (1999): Sustainable Livelihood Guidance Sheets. DFID,London. <http://www.livelihoods.org/info/info_guidancesheets.html>, 12 September 2006.
48

Duryog Nivaran (2006): Tackling the Tides and Tremors. In: South Asia Disaster Report 2005. DuryogNivaran Secretariat, Islamabad. <www.duryognivaran.org>, 12 September 2006.
ESPON (2006): <http://www.espon.eu> 29 September 2006.
EWG II (2005): Live Recording of the Second Expert Meeting on Measuring Vulnerability. UNU-EHS, Bonn.(unpublished).
Geertz, C. (1973):Thick Description.Toward an Interpretation of Culture. In: The Interpretation of Cultures.Basic Books, New York.
Greater New Orleans Nonprofit Knowledge Works (2006), <http://www.gnonkw.org/>, 12 September2006.
Guha-Sapir, D.; Parry, L.V.; Degomme, O.; Joshi. P.C.; Saulina Arnold, J.P. (2006): Risk Factors for Mortalityand Injury. In: Nadu, T. (Ed.), Post-Tsunami Epidemiological Findings from Tamil Nadu (Draft Report).Centre for Research on the Epidemiology of Disasters (CRED), Brussels.
Handmer, J.W.; Norton,T.W.; Dovers, S.R. (2001): Ecology, Uncertainty and Policy. In: Managing Ecosystemsfor Sustainability. Prentice Hall, Harlow.
IFRC (International Federation of Red Cross and Red Crescent Societies) (2005): Data or Dialogue? TheRole of Information in Disasters. In: World Disaster Report 2005. IFRC, Geneva.
IHDP (International Human Dimensions Programme on Global Environmental Change) (2005): Confer-ence Book for the 6th Open Meeting of the Human Dimensions of Global Environmental ChangeResearch Community. IHDP, Bonn.
Interamerican Conference on Disaster Risk Reduction (2004): The Manizales Declaration: Reflections andproposals for improving the effectiveness of risk management. <http://www.unisdr.org/wcdr/preparatory-process/inputs/Declaration-Manizales-eng.pdf#search=%22manizales%20declaration%20unisdr%22>, 12 September 2006.
Ivanov. A. (2005): Qualitative and Quantitative Vulnerability Assessment of Floods in the Volga Basin.Presentation for the UNU-EHS Expert Working Group II, Measuring the Un-measurable. October (unpub-lished).
Kiunsi, R.; Meshack, M.V. (2006): Disaster vulnerability assessment, the Tanzania experience. In: MeasuringVulnerability to Natural Hazards,Towards Disaster Resilient Societies. UNU-Press,Tokyo, New York, Paris.
Kok, M. (2005): A vulnerability approach for UNEPs Global Environment Outlook (GEO) – 4. Presentationfor the UNU-EHS Expert Working Group II, Measuring the Un-measurable. October (unpublished).
Mapping for Change (2005): Mapping for Change: International Conference on Participatory SpatialInformation Management and Communication, PGIS '05 – KCCT, Nairobi, Kenya, 7-10 Sept 2005.<http://www.iapad.org/pgis2005/ & http://www.iapad.org/>, 12 September 2006.
Mechler, R.; Linnerrooth-Bayer, J.; Peppiatt, D. (2006): Disaster Insurance for the Poor? A review of microinsurance for natural disaster risks in developing countries. ProVention Consortium and IIASA, Geneva.<http://www.proventionconsortium.org/themes/default/pdfs/Microinsurance_study_July06.pdf>,July 2006.
Millennium Ecosystem Assessment (2005) <http://www.millenniumassessment.org/en/index.aspx>,12 September 2006.
Nassel, M.; Voigt, S. (2006): Vulnerability Assessment of the Built Environment. In Birkmann et al. (2006):Rapid and multidimensional vulnerability Assessment Sri Lanka. UNU-EHS, Colombo, Bonn, pp. 10-22.
National University of Colombia (2006): Programa de Indicadores de Riesgo de Desastre y de Gestión deRiesgos, BID-IDEA. <http://idea.manizales.unal.edu.co/ProyectosEspeciales/BID/desc_gta.asp?IdAc-tividadAcademica=32&despInfo=FI>, 1 October 2006.
49

Neter, J.; Kutner, M.H.; Nachtshein, C.J.; Wassermann, W. (1996): Applied Linear Statistical Models: Regres-sion, Analysis of Variance, and Experimental Designs. McGraw-Hill, Boston.
Nishikiori, N.; Abe,T.; Costa, D.; Dharmaratne, S.; Kunii, O.; Moji, K. (2006):Timing of mortality among inter-nally displaced persons due to the tsunami in Sri Lanka. Cross sectional household survey. In: BritishMedical Journal. vol. 332, no. 11, pp. 334-335; <http://bmj.bmjjournals.com/cgi/content/full/332/7537/334?maxtoshow=&HITS=10&hits=10&RESULTFORMAT=&searchid=1139586523248_11500&FIRSTINDEX=0&minscore/>, 12 September 2006.
Oliver-Smith, A.; Button, G. (2005): Forced Migration as an Index of Vulnerability in Hurricane Katrina.Pre-sentation for the UNU-EHS Expert Working Group II, Measuring the Un-measurable. October (unpub-lished).
Oliver-Smith, A. (2006): Rethinking the Concepts of Nature and Environment in Vulnerability Research.Keynote for UNU EHS/ Munich Re Summer Academy, Global Water Hotspots: Water-related social vul-nerabilities and resilience-building. 23-26 July 2006. Hohenkammer, Germany (unpublished).
Pelling, M. (2005):Tensions between qualitative and quantitative approaches. Presentation for the UNU-EHS Expert Working Group II, Measuring the Un-measurable. October (unpublished).
Open Forum on Participatory Geographic Information Systems and Technologies (PGIS Net) (2006)<http://ppgis.iapad.org/>, 12 September 2006.
ProVention Consortium (2006):Community Risk Assessment Tool-Kit.<http://www.proventionconsortium.org/?pageid=39>, 12 September 2006.
Taubenböck, H.; Roth, A. (2006): Assessment of urban location factors with remote sensing. In: UrbanData Management Symposium – Proceedings, 25th Urban Data Management Symposium. Aalborg,Denmark.
Thywissen, K. (2006): Components of Risk – A Comparative Glossary. SOURCE No. 2/2006. UNU-EHS, Bonn;und <http://www.ehs.unu.edu/print.php/category:17?menu=36>, 12 September 2006.
Transparency International (2006): Global Corruption Report. <http://www.transparency.org/publica-tions/gcr>, 12 September 2006.
Turner, B.L.; Kasperson, R.E.; Matson, P.A.; McCarthy, J.J.; Corell, R.W.; Christensen, L.; Eckley, N; Kasperson,J.X.; Luers, A.; Martello, M.L.; Polsky, C.; Pulsipher, A.; Schiller. A. (2003): A framework for vulnerabilityanalysis in sustainability science. In: Proceedings of the National Academy of Sciences. vol. 100, no. 14,pp. 8074-8079. <http://yaquivalley.stanford.edu/pdf/turner_matson_2003.pdf#search=%22turn-er%20et%20al%20vulnerability%20pnas%22>, 12 September 2006.
UNDP (2004): The Interamerican Conference On Disaster Risk Reduction. Reflections and proposals for improving the effectiveness of risk management November 17, 18, 19, Manizales, Colombia. THE MANIZALES DECLARATION. <http://www.undp.org/bcpr/disred/documents/regions/america/2004/manizales_nov04_eng.pdf>, 12 October 2006.
United Nations Development Programme (UNDP) (1992): An Overview of Disaster Management, 2nd edn.UNDP,Washington.
United Nations Development Programme – Bureau for Crisis Prevention and Recovery (BRCP) (2004):Reducing Disaster Risk. A Challenge for Development. A Global Report. <http://www.undp.org/bcpr/disred/rdr.htm>, 12 September 2006.
UNCLOS (2006): Crowding the Rim. <http://www.unclos.com/papers/crowding_the_rim.pdf#search=%22crowding%20the%20rim%20disaster%22>, 12 October 2006.
UNEP (United Nations Environment Programme) (2002): Global Environmental Outlook 3: Past, Presentand Future Perspectives. Earthscan, London.
50
UNEP (2007): Global Environmental Outlook. <http://www.unep.org/GEO/>, 12 October 2006. (in print).
United Nations (2005): Hyogo Framework for Action 2005-2015. Building the Resilience of Nations andCommunities to Disasters. World Conference on Disaster Reduction, 18-22 January 2005, Kobe,Hyogo. <http://www.unisdr.org/wcdr/intergover/official-doc/L-docs/Hyogo-framework-for-action-english.pdf>, 12 September 2006.
UN (2006): Agenda for Development.Section G.1: Continuum from relief to rehabilitation and development,para 159-163. <http://www.un.org/Docs/SG/human.htm> , 12 October 2006.
United Nations / International Strategy for Disaster Reduction (UN/ISDR) (2004): Living with Risk,A global review of disaster reduction initiatives. United Nations, Geneva. <http://www.adrc.or.jp/publications/LWR/LWR_pdf/index.pdf#search=%22living%20with%20risk%20isdr%22>, 12 Septem-ber 2006.
USGS (2006): Statement: Crowding the Rim. <http://geopubs.wr.usgs.gov/docs/ctr/download/pdf/ctrstatement.pdf>, 12 October 2006.
Voigt, S. (2005): Approaches for Satellite based Vulnerability Mapping in Sri Lanka. Presentation for theUNU-EHS Expert Working Group II, Measuring the Un-measurable. October (unpublished).
Wisner, B. (2002):Who? What? Where? When? in an Emergency: Notes on Possible Indicators of Vulnera-bility and Resilience: By Phase of the Disaster Management Cycle and Social Actor. In: Plate, E. (Ed.),Environment and Human Security: Contributions to a workshop in Bonn, 23-25 October 2002, Germany,pp. 12/7-12/14.
Wisner, B. (2005): Isn’t It All Politics? The Politics of Policy Formation. In: Gerber, R.; Salter, J. (Eds.),Civil Careand Security Studies. Kardoorair Press, Armidale.
Wisner, B.; Blaikie, P.; Cannon, T.; Davis, I. (2004): At Risk: Natural hazards, People's Vulnerability and Disas-ters. 2nd edn, Routledge, London. <http://www.unisdr.org/eng/library/lib-select-literature.htm>, 12September 2006.
Wisner, B.; Haghebaert, B. (2006): Fierce Friends/ Friendly Enemies: State/ Civil Society Relations in Disaster Risk Reduction. Discussion Paper 4, prepared for ProVention Consortium Forum 2006:Strengthening global collaboration in disaster risk reduction. Bangkok, February 2-3 2006. <http://www.proventionconsortium.org/themes/default/pdfs/Forum06/Forum06_Session4_State-CommunityAction. pdf#search=%22wisner%20haghebaert%20state%20non-state%20ProVention%22>, 12 Sep-tember 2006.
51

Annex I: List of Participants
1. Prof. David Alexander University of FlorenceBorgo Sarchiani 1950026 San Casciano in Val di Pesa,Firenze, [email protected]: +39 055 822 9423
2. Prof. Sarath Amarasinghe University of Ruhuna - Department of SociologyN°495B Ruwanpura Road, AggonaAngoda, Sri [email protected]: +94 41 2792202Fax: +94 41 2223133
3. Ms Maria Arkhipova UNU-EHS "Young Scientists Award" Institute of Environmental Geosciences,russian Academy of SciencesUlansky pereulok 13, Building 2101000 Moscow, [email protected]: +7 095 924 7257/923 31 11Fax: +7 095 923 18 86
4. Ms Maria Bilia Prime Minister's OfficeP.O Box 3021 - Magogoni StreetDar-Es Salaam,[email protected], [email protected]: +255 222 1172 49/50Fax: +255 222 1172 66
5. Dr. Peter BillingEuropean Commission Civil Protection UnitRue de la Loi 2001049 [email protected]. +32 2 2968671
6. Dr. Jörn Birkmann United Nations University Institute for Environment and Human SecurityUNU-EHSUN CampusHermann-Ehlers-Str. 1053113 Bonn, [email protected]: +49 228 422 8150208Fax: +49 228 422 8150299
7. Prof. Janos Bogardi United Nations University Institute for Environment and Human SecurityUNU-EHSUN CampusHermann-Ehlers-Str. 1053113 Bonn, [email protected]: +49 228 422 8150202Fax: +49 228 422 8150299
8. Prof. Hans-Georg Bohle University of BonnInstitute of GeographyMeckenheimer Allee 16653115 Bonn, [email protected]: +49 228 73 7232Fax: +49 228 73 9657
9. Prof. Klaus Borchard Academy for Spatial Research and Planning (ARL)Hohenzollernstr.1130161 Hannover, [email protected]: +49 511 34842 37Fax: +49 511 34842 41
10. PD. Dr. habil Hans Günter Brauch UNU-EHS, CASA fellowFree University of Berlin,AFES-PRESSAlte Bergsteige 47D-74821 [email protected]: + 49 6261 12912 Fax: + 49 6261 15695
52

11. Prof. Dr. Omar D. Cardona Universidad Nacional de Colombia ManizalesCarrera 27 64-60Manizales, [email protected]: +57 1 5300828Fax: +57 1 5300827
12. Geoffrey D. DabelkoEnvironmental Change and Security ProgramWoodrow Wilson International Center for Scholars1300 Pennsylvania Ave., NWWashington, DC [email protected]: 202 691-4178Fax: 202 691-4184
13. Dr.Thomas E. DowningStockholm Environment Institute266 BanburyRoad, Suite 193Oxford OX2 7DL, United [email protected]: +44 1865 426316Fax: +44 1865 421898
14. Dr. Indranil DuttaUnited Nations University - World Institute for Development Economics ResearchKatajanokanlaituri 6 B00160 Helsinki, [email protected]: +358 9 61599212Fax: +358 9 615 99333
15. Mr. Nishara Fernando Department of Sociology,University of Colombo, Reid Avenu,Colombo -3, Sri [email protected]@[email protected]: +94 1 2500452Fax: +94 1 2500452
53
16. Ms Zsuzsanna Flachner RISSAC- Hungarian Academy of Sciences Academy of SciencesHerman O. Street 151022 Budapest, [email protected]: +36 1 2253201
17. Mr. Oscar Frausto Universidad Autonomía de YucatánAv. Andrés Quintana Roo S/N077600 México, Mé[email protected]: +52 987 8729108Fax: +52 987 879112
18. Prof. Roland Fuchs International START Secretariat2000 Florida Avenue, NM Suite 200Washington, DC 20009, [email protected]: +1 202 462 2213Fax: +1 202 457 5859
19. PD Dr. Stefan Greiving University of Dortmund - Faculty of Spatial PlanningAugust-Schmidt Str. 644221 Dortmund, [email protected]: +49 231 755 2213Fax: +49 231 755 3424
20. Prof. John Handmer Geospatial & Mathematical SciencesCentre for Risk and Community SafetyRMIT GPO - Box 2476V Melbourne Vic 3001, Australia [email protected] Tel: +61 3 9925 2307 Fax: +61 3 9663 2517
21. Dr.-Ing. Dirk Heinrichs Centre for Environmental Research - UFZPermoserstr.1504319 Leipzig, [email protected]: +49 341 235 2686

22. Prof. Sitti Hettige University of Colombo, Social Policy Analysisand Research Centre - SPARCN°9/11 First Lane, PagodaNugegoda, Sri [email protected]: +94 1 2811484 or 2553188
23. Ria HidajatAdvisory Project "Disaster Risk Management in Development Cooperation"German Technical Cooperation (GTZ) GmbHDag-Hammarskjöld-Weg 1-565760 [email protected]: +49 (0) 61 96 79 74 30Fax: +49 (0) 61 96 79 80 7430
24. Dr. Alexander Ivanov UNESCO Chair, University of Architecture and Civil EngineeringIlinskaya str. 65603950 Nizhniy Novgorod, [email protected]: +78312301877Fax: +79027869172
25. Dr. Stefan Jägergeomer GmbHIm Breitspiel 11 B69126 [email protected].: +49 (0)6221/89458-40Fax: +49 (0)6221/89458-79
26. Prof. Roger Kasperson The George Perkins Marsh Institute, Clark University950 Main StreetWorcester, MA 01610-1477, [email protected]: +1 508 751 4607Fax: +1 508 751 4600
27. Dr. Ulrike Kastrup Benfield Hazard Research CentreUniversity College LondonUnited [email protected]
28. Marcel T.J. KokNetherlands Environmental Assessment Agency (MNP)PO-box 3033720 AH BilthovenThe [email protected]: +31 30 2743717Tel secr: +31 30 2743425/3728Fax: +31 30 2744464
29. Mr. Ferenc Kovács UNU-EHS "Young Scientists Award" – University of Szeged, Department of Physical Geography and GeoinformaticsEgyetem utca 2-66722, Pf653 Szeged, [email protected]: +36 62 546 485Fax: +36 62 544 158
30. Dr. Joanne Linnerooth-Bayer International Institute for Applied Systems Analysis, IIASA - Risk, Modeling and SocietySchlossplatz 12361 Laxenburg, [email protected]: +43 2236 807 308Fax: +43 2236 807 466
31. Mr. Jessie Manuta College of Arts and Sciences - Ateneo de Davao UniversityE. Jacinto StreetDavao City 8016,The [email protected] [email protected]: +6382 221 2411 Tel: +6382 226 4116Fax: +6382 221 2413
32. Dr. Elena Marakova UNU-EHS "Young Scientists Award" -Volghskaya Street 49, kv.51Astrakhan, 514045, [email protected]: +8512 33 40 68 +8512 593277
54

33. Ms Monika Naßl Mobile: +49 173 15 36 [email protected]
34. Dr. Elena Nikitina EcoPolicy Research & ConsultingPiluigina, 14-1-182Moscow, 117393, [email protected]: +7 095 9468581Tel: +7095 77 33 687Fax: +7 095 9468581
35. Dr. Karen O´BrienDepartment of Sociology and Human GeographyUniversity of OsloP.O. Box 1096 Blindern0317 Oslo, [email protected]: +47 22 85 84 80
36. Prof. Anthony Oliver-Smith University of Florida - Department of Anthoropology1112 Turlington HallGainesville, Florida 32611, [email protected]: +1 352 392 2253 251Fax: +1 352 392 6929
37. Prof. Ursula Oswald-Spring National University of MexicoCentro Regional de Investigaciones Multidisciplinarias, CRIM-UNAMPriv. Ró Bravo Num. 1 Col.Vistahermosa62290 Cuernavaca, [email protected]: +52 7773 291 833Fax: +52 7773 175981
38. Mark Pelling PhDReader in Human GeographyDepartment of GeographyKing's CollegeThe StrandLondon WC2R 2LS [email protected]: +44 (0)20 7848 2462Fax: +44 (0)20 7848 2287
55
39. Prof. Erich Plate University of KarlsruheAm Kirchberg 4976229 Karlsruhe, [email protected]: +49 721 468752Fax: +49 721 9463984
40. Dr. Ulrich Ranke Federal Institute for Geosciences and Natural Resources (BGR)Stilleweg 230655 Hannover, [email protected]: +49 511 643 2371Fax: +49 511 643 2304
41. Dr. Fabrice Renaud United Nations University Institute for Environment and Human SecurityUNU-EHSUN CampusHermann-Ehlers-Str. 1053113 Bonn, [email protected]: +49 228 422 8150211Fax: +49 228 422 8150299
42. Stefan SchneiderbauerJoint Research Centre / European Commission - Institute for the Protectionand Security of the Citizen (IPSC)Via E. Fermi, 1 - PT 267Ispra 21020 (VA), [email protected]: +39 0332 785967Fax: +39 0332 785154
43. Ms Michaela Serban UNU-EHS "Young Scientists Award" – Institute of Geography,Romania AcademyDimitrie Racovita, Sector 2Bucharest 70307, [email protected]

44. Prof. Pál Támas Hungarian Academy of SciencesInstitute of SociologyUri Utca 491014 Budapest, [email protected]: +361 2246740Fax: +361 2246741
45. Dr. Jayasingam Thangamuthu Eastern UniversityDepartment of BotanyChenkaladi, Sri [email protected]: +94 5 22 40490 ext.204Fax: +94 5 22 40758Mobile: +94 773 059 927
46. Mr. Zhan Tian UNU-EHS "Young Scientists Award"Institute of Geographical Sciences and Nature Resources Research,Chinese Academy of Sciences11A Datun road AnwaiBeijing, 100101, [email protected]: +86 10 62944575
47. Prof. Anna Vári Hungarian Academy of SciencesInstitute of SociologyUri Utca 491014 Budapest, [email protected]: +36 1 224 6743Fax: +36 1 224 6741
48. Dr. Juan Carlos Villagrán de LeonUnited Nations University Institute for Environment and Human SecurityUNU-EHSUN CampusHermann-Ehlers-Str. 1053113 Bonn, [email protected]: +49 228 422 8150210Fax: +49 228 422 8150299
56
49. Ms Evgeniya Vinogradova UNU-EHS "Young Scientists Award" Moscow State UniversitySmolensky blvd., 24 build 1, office 37119002 Moscow, [email protected]: +7 095 246 81 59Fax: +7 095 589 65 22
50. Dr. Stefan Voigt Deutsches Fernerkundungsdatenzentrum (DFD) - Deutsches Zentrum für Luft- und Raumfahrt (DLR)Oberpfaffenhofen82234 Wessling, [email protected]: +49 8153 28 3678Fax: +49 8153 28 1445
51. Prof. Ben Wisner Oberlin College, Environmental Studies373 Edgemeer PlaceOberlin, OH 44074, [email protected]: +1 440 775 1390Fax: +1 440 775 8898
52. Dr. Peter Zeil Centre for GeoInformatics Salzburg University - Paris.Lodron University SalzburgHellbrunnerstr. 345020 Salzburg, [email protected]: +43 662 8044 5264 / 5210Fax: +43 662 8044 5260
53. Dr. Natalia Davydova Environmental Projects Consulting InstituteSmolensky blvd., 24 build 1, office 37119002 Moscow, [email protected]: +7 095 246 81 59Fax: +7 095 589 65 22

Annex II: Programme of the Experts Workshop “Measuring Vulnerability”
57
An
nex
II:P
RO
GR
AM
ME
OF
TH
EE
XP
ER
TW
OR
KS
HO
P“M
EA
SU
RIN
GV
UL
NE
RA
BIL
ITY
”

Annex III: List of Graphics
List of Boxes
BOX 1: Working Definitions of Vulnerability
BOX 2: Main Goals of the UNU-EHS Expert Working Group
BOX 3: Nationalities Represented at EWGII
BOX 4: Young Scientists
BOX 5: Creative Tensions and Debates over Vulnerability
BOX 6: EWG’s Knee-Jerk Definitions
BOX 7: Pre-existing, Baseline and Emergent Vulnerability
BOX 8: Overview of the Four Main Methods Used to Assess Vulnerabilities
BOX 9: Structure of the Questionnaire
BOX 10: Example for an Archetype Approach
BOX 11: Horses for Courses
BOX 12: Challenges Ahead
List of Figures
Figure 1: Key Spheres of the Concept of Vulnerability
Figure 2: Tsunami Affected Squatters in Galle, Sri Lanka
Figure 3: Three Tensions Between Qualitative and Quantitative Approaches
Figure 4: Hierarchy of Knowing
Figure 5: Displaced People after Hurricane Katrina
Figure 6: Global Corruption Report 2006
Figure 7: Vulnerability Framework by Turner et al. (2003)
Figure 8: The BBC-conceptual Framework
Figure 9: Overview of Selected Sites in Galle for Questionnaire-based Research
Figure 10: Dead and Missing According to Gender in Galle
Figure 11: The Pressure and Release (PAR) model: the progression of vulnerability
Figure 12: New Orleans Elevation Map
Figure 13: New Orleans Poverty Map
Figure 14: States and Scenarios for Transition
Figure 15: Report on Rapid Vulnerability Assessment in Sri Lanka
Figure 16: Ex Post Tsunami Hazard and Impact Mapping Comparing the Coast Line Before and Afterthe Event in Banda Aceh, Indonesia
Figure 17: Difficulties in Defining the Exact Run of the Coast Line in Galle, Sri Lanka
Figure 18: Zonation of Instanbul using IKONOS imagery
58

Figure 19: Mangroves Sri Lanka
Figure 20: Water Supply after the Tsunami
Figure 21: Participants at EWG II Public Panel Discussion on the First Day
List of Tables
Table 1: Vulnerability Index Parameters for Drought by Agro-ecological Zone
59

60
SOURCE
ISSN: 1816-1154
No. 1/2005 Threats, Challenges,Vulnerabilities and Risks in Environmental and Human Security,by Hans Günter Brauch, September 2005.ISBN: 3-9810200-4-9 (printed version);ISBN: 3-9810200-5-7 (electronic version)
No. 2/2006 Components of Risk. A Comparative Glossary,by Katharina Thywissen, March 2006.ISBN: 3-9810582-0-8 (printed version);ISBN: 3-9810582-1-6 (electronic version)
No. 3/2006 International Environmental Governance. Issues,Achievements and Perspektives,by Andreas Rechkemmer, June 2006.ISBN: 3-9810582-2-4 (printed version);ISBN: 3-9810582-3-2 (electronic version)1. edition, 2000 copies
No. 4/2006 Vulnerability: A Conceptual and MethodologicalReview,by Juan Carlos Villagrán de León ISBN: 3-9810582-4-0 (printed version);ISBN: 3-9810582-5-9 (electronic version) 1. edition, 2000 copies; August 2006
No. 5/2006 Measuring the Un-Measurable.The Challenge of Vulnerability.by Joern Birkmann & Ben WisnerISBN: 3-9810582-6-7 (printed version);ISBN: 3-9810582-7-5 (electronic version) 1. edition, 1000 copies; October 2006
“SOURCE”are distributed free of charge.Please address orders and inquires by fax and email only.
UNU-EHS PublicationsUN CampusHermann-Ehlers-Str. 1053113 BonnGermany
Tel.: ++49 (0)228 815-0202Fax: ++49 (0)228 815-0299E-Mail: [email protected]

UNITED NATIONS UNIVERSITYInstitute for Environment and Human Security (UNU-EHS)
UNU-EHS reflects the overall mission of UNU: ‘Advancing
Knowledge for Human Security and Development’. UNU-EHS
explores threats to human security from environmental degra-
dation, unsustainable land use practices, and from natural and
human-induced hazards. The Institute spearheads UNU’s
research and capacity building activities in the broad interdis-
ciplinary field of ‘risk and vulnerability’.
Within this framework UNU-EHS aims to:
• Foster better understanding of forces and processes of environmental degradations and their influence on hazard magnitude and frequency and subsequent disasters;
• Explore links between different hazard events as well as creeping processes such as climate change, soil erosion and their impact on the inherent risk and vulnerability;
• Contribute to development, testing and verification of vulnerability indicators, and investigate relationships between risks, vulnerability and coping capacity.
• Investigate the relationship between risk, vulnerabilityand coping capacity, and devise strategies and measuresto improve the coping capacity of affected communities.
Its activities focus on:
• Generating knowledge;
• Building capacity, with focus on young professionals andinstitutions in developing countries;
• Disseminating knowledge to decision makers.
