measurable parameters of ecosystem health: introduction ... · measurable parameters of ecosystem...
TRANSCRIPT

Sustainable Watershed Planning in Ohio
Measurable Parameters of Ecosystem Health:Introduction and Concepts
Measurable Parameters of Watershed Health: Introduction & Concepts
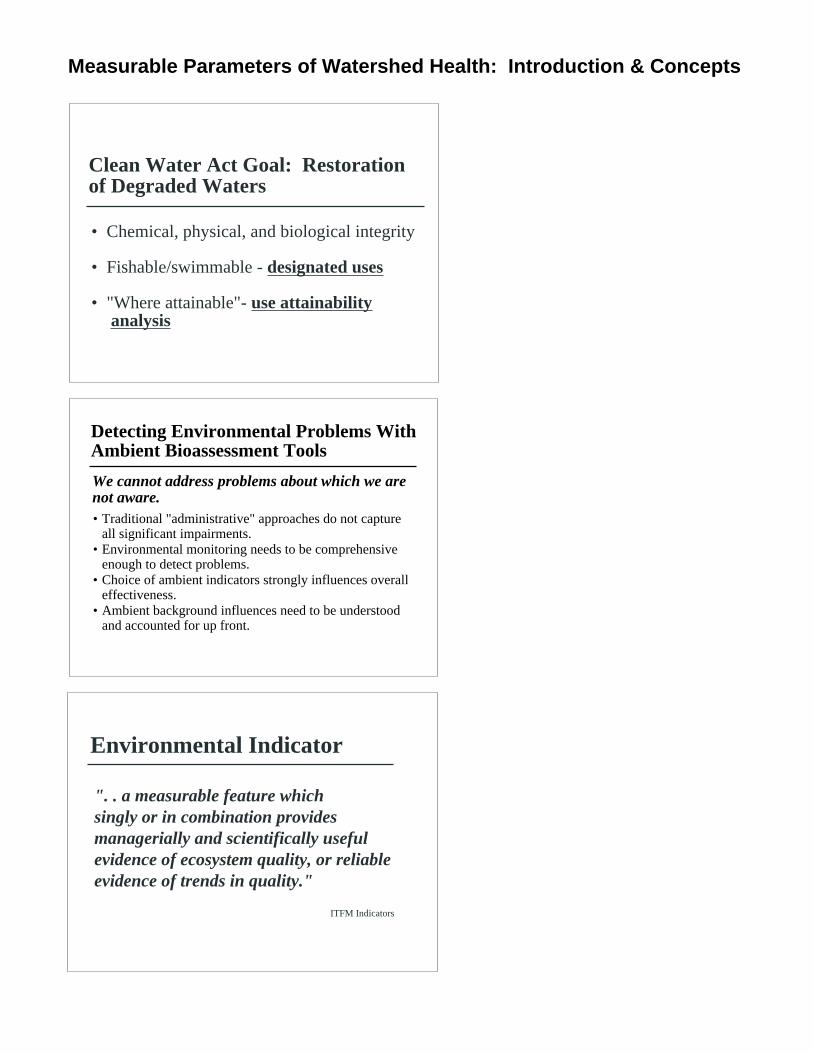
Clean Water Act Goal: Restorationof Degraded Waters
• Chemical, physical, and biological integrity
• Fishable/swimmable - designated uses
• "Where attainable"- use attainability analysis
Detecting Environmental Problems WithAmbient Bioassessment Tools
• Traditional "administrative" approaches do not captureall significant impairments.
• Environmental monitoring needs to be comprehensiveenough to detect problems.
• Choice of ambient indicators strongly influences overalleffectiveness.
• Ambient background influences need to be understoodand accounted for up front.
We cannot address problems about which we arenot aware.
Environmental Indicator
". . a measurable feature whichsingly or in combination providesmanagerially and scientifically usefulevidence of ecosystem quality, or reliableevidence of trends in quality."
ITFM Indicators

Measurable Parameters of Watershed Health: Introduction & Concepts
Major Classes and Types of Environment-al Indicators: Problem Statement
The problem nationally has been with the in-appropriate use of stressor and exposureindicators as response indicators.
1. Stressor Indicators (e.g., loadings, land use,habitat)
2. Exposure Indicators (e.g., chemical-specific,biomarkers, toxicity)
3. Response Indicators (e.g., biological communitycondition)
ChemicalImpairment ONLY
Agreement
Chemical vs. Biological Indicatorsof Aquatic Life Impairment:
BiocriteriaImpairment ONLY
Relative performance of chemical water quality criteriacompared with biological criteria in detecting aquatic lifeimpairments:
41.1% 52.2%
6.7%
2543 Sampling Sites(1994 Ohio 305b Report)

Measurable Parameters of Watershed Health: Introduction & Concepts
An Integrated Approach to WaterQuality Management
Water Quality Based Bioassessment Based• Parameter specific criteria • Biological criteria• Surrogate assessment • Direct assessment• Pollutant focused • Resource focused• Partial coverage • Complete coverage• Bottom up approach • Top down approach• Individual effects • Cumulative effects• Stress/exposure indicator • Response indicator• Design criteria • Impact assessment
criteria
FlowRegime
High/LowExtremes
Precipitation &Runoff
Velocity
Land Use
GroundWater
ChemicalVariables
BioticFactors
EnergySource
HabitatStructure
Hardness
Turbidity
pH
D.O.
TemperatureAlkalinity
Solubilities
Adsorption
Nutrients
Organics
Reproduction
DiseaseParasitism
Feeding
Predation
Competition
Nutrients
Sunlight
Organic MatterInputs 1 and 2
Production
o o
SeasonalCycles
RiparianVegetation
Siltation
Current
Substrate
Sinuosity
Canopy InstreamCover
Gradient
ChannelMorphology
Bank Stability
Width/Depth
INTEGRITY OF THEWATER RESOURCE
“Principal Goal of theCleanWater Act”
Integrated andcomplimentary use ofbioassessment,chemical/physicalassessment, andattendant tools, eachwithin their mostappropriate roles, isneeded to successfullyrestore and protect waterresources.
Making Ambient Indicators Relevant toWater Quality Management
• Indicators must measure or extend to the key elementsof the 5 factors that influence water resource integrity.
• Indicators fundamentals - stressor, exposure, response -each used within the most appropritate role.
• National inconsistency results from using indicatorsoutside of their most appropriate role.
• Using the indicators hierarchy framework will lead to awell-rounded WQ management program.
• Integration of programmatic needs (e.g., tiered uses)with logistical and structural needs must occur.

Measurable Parameters of Watershed Health: Introduction & Concepts
Monitoring & Assessment Should Be aDeterminant in How WQ is Managed
• Problem identification and characterization.• Policy/program and legislation development.• Criteria development and application.• Demonstrate WQ management program effectiveness,
i.e., manage for environmental results.
Develop monitoring & assessment as an overallfunction of WQ management, not on a piecemealbasis.
The Relationship Between WQ Management andthe Purposes of Monitoring & Assessment
DefineWater
ResourceConditions
Awarenessof Problems/
Issues AnalyzeManagement
Options
ChooseCourse
of Action Design &ImplementPrograms
EvaluateProgramEffective-
ness
MakeAdjustmentsto Programs& Priorities
CharacterizeExisting/EmergingProblems
ProvideInformation
Base inSupport
of WQ Mgmt.
ProvideInformation
Base toEvaluate
Effectiveness
RevealTrends
in WaterResource
Quality
Water Quality Management Activities
Monitoring & Assessment Purposes
Source: ITFM (1995)
• Indicators and methods • Data quality & management • Assessment techniques • Variability • Regional stratfication • Levels of protection & restoration • Design considerations • Reporting • Role in management & policy
Important Considerations for Using Monitoring andAssessment to Support WQ Management
Measurable Parameters of Watershed Health: Introduction & Concepts
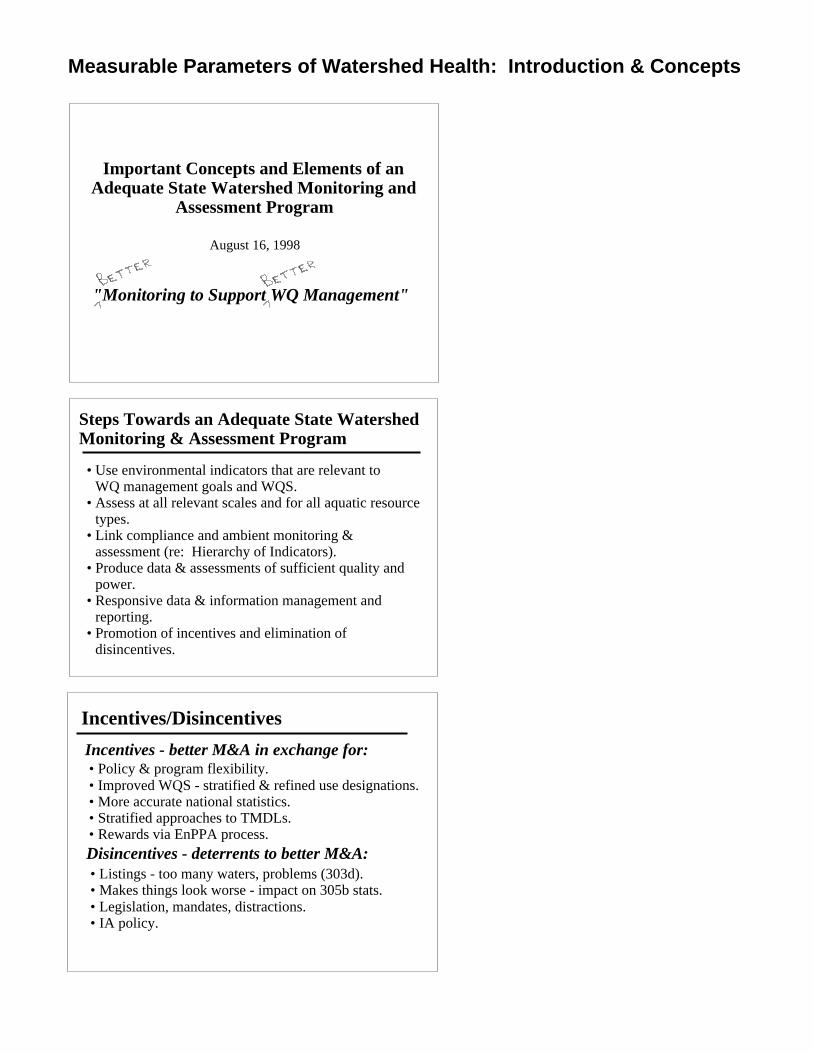
Important Concepts and Elements of anAdequate State Watershed Monitoring and
Assessment Program
August 16, 1998
"Monitoring to Support WQ Management"
Steps Towards an Adequate State WatershedMonitoring & Assessment Program
• Use environmental indicators that are relevant toWQ management goals and WQS.
• Assess at all relevant scales and for all aquatic resourcetypes.
• Link compliance and ambient monitoring &assessment (re: Hierarchy of Indicators).
• Produce data & assessments of sufficient quality andpower.
• Responsive data & information management andreporting.
• Promotion of incentives and elimination ofdisincentives.
Incentives/Disincentives
• Policy & program flexibility.• Improved WQS - stratified & refined use designations.• More accurate national statistics.• Stratified approaches to TMDLs.• Rewards via EnPPA process.
Incentives - better M&A in exchange for:
• Listings - too many waters, problems (303d).• Makes things look worse - impact on 305b stats.• Legislation, mandates, distractions.• IA policy.
Disincentives - deterrents to better M&A:

Measurable Parameters of Watershed Health: Introduction & Concepts
Five-Year Basin MonitoringWhere
• Historical emphasis on inland rivers & streams• Extended to Lake Erie nearshore• Developmental work in the Ohio R. mainstem
What• Watershed scale, synoptic design• Fish, macroinvertebrates, physical habitat• Sediments, water quality, fish contaminants• Biomarkers at selected sites
Why• Support all water quality management programs• Integrate traditional water quality management
tools with real world measures• Determine status of Ohio's aquatic resources in
relation to agency mission and objectives
CORE INDICATORS• Fish Assemblage • Macroinvertebrates • Periphyton
(Use Community Level Data From At Least Two)
Physical Habitat Indicators• Channel morphology • Flow• Substrate Quality • Riparian
Chemical Quality Indicators• pH • Temperature• Conductivity • Dissolved O2
For Specific Designated Uses Add the Following:
AQUATIC LIFEBase List:• Ionic strength• Nutrients, sedimentSupplemental List:• Metals (water/sediment)• Organics (water/sediment)
RECREATIONALBase List:• Fecal bacteria• Ionic strengthSupplemental List:• Other pathogens• Organics (water/sediment)
WATER SUPPLYBase List:• Fecal bacteria• Ionic strength• Nutrients, sedimentSupplemental List:• Metals (water/sediment)• Organics (water/sediment)• Other pathogens
HUMAN/WILDLIFE CONSUMPTIONBase List:• Metals (in tissues)• Organics (in tissues)

Measurable Parameters of Watershed Health: Introduction & Concepts
Why Use Fish & Invertebrates?
• Inhabit the receiving waters continuously.• Integrate past events, both long and short-term.• Reasonable response and recovery rates.• Many species have long life-spans (>3-10 yrs.).• Not directly dependent on dilution dynamics.• Portray program results in direct terms.• Minimal use of adjustment or uncertainty factors.
Fish Assemblage Assessment: Ohio EPAApproach• Standardized & Representative Sampling - stratified pulsed
D.C. electrofishing methods, mid-June to mid-October.• Relative Abundance - numbers and weight (biomass) per unit
distance (effort).
• Data Quality Objectives - genus/species based on regionalichthyology keys and AFS nomenclature.
• Key Component of Biocriteria - IBI, MIwb, and componentmetrics.
• Basin/Sub-basin Sampling Design - longitudinal and watershedscale interpretation of results.
• Watershed Scale Considerations - headwaters, wading, andboat sites; metric calibration accomplished for each strata.
• Experienced Biologists - regional fauna, natural history,response signatures, impact types.
Macroinvertebrate Assemblage Assessment:Ohio EPA Approach• Standardized & Representative Sampling - artificial substrates &
qualitative dip-net/handpick methods, mid-June to late-September.
• Taxa Richness & Relative Abundance - counts and numbers perunit area (sq. ft.).
• Data Quality Objectives - lowest taxonomic level practicable forcommon orders/families (genus or species), standard keys.
• Key Component of Biocriteria - ICI and component metrics
• Basin/Sub-basin Sampling Design - longitudinal and watershedscale interpretation of results.
• Watershed Scale Considerations - ICI metrics are calibratedagainst stream and river size.
• Experienced Biologists - detailed familiarity with regional fauna,natural history, response signatures, impact types.

Measureable Parameters of Watershed Health: Introduction & Concepts
Fundamental Objectives of AdequateMonitoring and Assessment Approaches
• Collect and analyze baseline information.• Establish cause/effect (causal associations).• Compare results to criteria and goals (use attainment).• Publish results - statewide, regional, site-specific.
Function: Surface Water Assessment
• Attainability analyses and criteria development (maintain WQS).• Formulate and revise abatement strategies (TMDL development).• Assess effectiveness of programs (WQ Management).
Function: WQ Management/Pollution Abatement
• Monitor to determine compliance.• Monitor to support enforcement.
Function: Compliance Evaluation
after 40CFR Part 35 (deleted in 1990?)
Essential Principles of AdequateMonitoring and Assessment Approaches• Data Quality Objectives: need to produce data and
information at a sufficient level of resolution so as toassure accuracy and precision.
• Watershed Scale Assessment: essential to encompassthe full gradient of response and exposure to multiplestressors and influences.
• Comprehensive Assessments: integrated and carefulanalysis of multiple indicators adhering to a disciplinedapproach (Hierarchy of Indicators).
• Learn by Doing: gain new knowledge and insights byiterative assessment and observing responses tomanagement actions (what works?).

State of OhioEnvironmental Protection Agency
BIOCRITERIA TRAINING/ CERTIFICATION
Voluntary Action Program(VAP)
Fish
PhysicalHabitat
Macroinvertebrates
August 28 -September 1,2000

Sustainable Watershed Planning in Ohio
Measurable Parameters of Ecosystem Health:Five-Year Basin Monitoring and Assessment

Measurable Parameters of Watershed Health: 5-Year Basin Approach
NWDO NEDO
SEDO
SWDO
CDO
1994
1994
1994
1994
1991
1991
1991
1991
1990
1990
1990
1993
1993 1992
1992
1990
19911992
Ohio EPA 5-YearBasin Approach forMonitoring &Assessment
• Rotating basin approachfor determining annualmonitoring activities.
• Correlated with NPDESpermit schedule.
• Supports annual WQSuse designation rule-making.
• Aligned with 15 yearTMDL schedule.
20012003
1999
2001
19991999
20031999
20002004
2000
2001
20012000
2003
2002
2003
2000
1999
1999
Five-Year Basin Project Selection Criteria& Priorities
• Previously sampled areas with new controls.• Watersheds targeted for TMDL development.**• Areas that have remaining "high profile" problems.• Inadequately or unassessed areas.• Priority NPS project or problem areas.• Use designation issues (priority for non-WWH uses).• Segments requiring re-evaluation under antidegradation rule.• Complex urban/industrial areas.• Rapidly developing or changing watersheds.• Areas with chronic spills, kills, exceedences.• Coordination with remedial activities.** - new in 1998.

Measurable Parameters of Watershed Health: 5-Year Basin Approach
TMDL DEVELOPMENT SCHEDULE: 1999 - 2013
199920002001200220032004200520062007200820092010201120122013Status Unknown
Fiat
Baltic
Ragersville
Walnut Creek
ColumbiaLoudon
Dover
NewPhiladelphia
Strasburg
Dundee
Winesburg
Sugar Creek
Mount Hope
Millers Corners
WilmontBeach City
Brewster
Elton
JustusMt. Eaton
Riceland
East Union
OrrvilleWeilersville
Smithville
Winfield
Barrs Mills
Farmerstown
Parral
KidronStanwood
West Lebanon
AUBURNBUCKS
CLARK
SUGAR CREEK
WAYNE
DOVER
FRANKLIN
GREEN
Wayne County
w
f
.
N
Sugar Creek
Symbols: Approximate location andsize (mi2) of geometricallyselected sites.
178
89
22
44
5.6
2.8
357
357
178
89
89
44
44
44
44
22
22
22
22
22
11
11
11
11
11
11
11
11
11
11
11
5.6
5.6
5.6
5.6
5.6
5.6
5.6
5.6
5.6
5.6
5.6
5.6
5.6
5.6
2.8
2.8
2.8
2.8
2.8
2.8
2.82.8
2.8 2.8
2.8
2.8
2.8
2.8
2.8
2.8
2.8
2.8
2.8
2.8
2.8
2.8
2.8
Geometric Site SelectionSequential subdivision by halves of the entire 357 mi2 basinyeilds subbasin areas of 178 mi2, 89 mi2, 44 mi2, 22 mi2,11 mi 2, 5.6 mi2 and 2.8 mi2. Sites which most closelymatched these stratifications were selected for inclusion inthe Ohio EPA 1998 Sugar Creek watershed study.
Sugar Creek Subbasin:Example of GeometricSite Selection Process
• Used in TMDL development and five-yearbasin watersheds
• Increased miles of assessed streams andrivers annually
• Resolve undesignated streams• Close 305b/303d listing gaps• Generate broader database for develop-
ment of improved tools and criteria• Part of 15 yr. TMDL development schedule
beginning in 1998• Augmented by five -year basin approach
process (1980-1997)• Standardized biological, chemical, physical
tools and indicators

Measurable Parameters of Watershed Health: 5-Year Basin Approach
Five-Year BasinApproach to Monitoring
& Assessment
Ohio EPA Assessment& Reporting Process:Five-Year Basin Approach
AMBIENT SAMPLING(Biological, Chemical/
Physical, Habitat, Sediment)
DATA ANALYSIS(Incorporating field, effluent,
GIS, spills, kills, othersource information)
OtherUseableData**
Planning & Prioritzation(Identify Information Needs)
TECHNICALASSESSMENT (Detailed
analysis & summary ofstatus/trends throughout
watershed)
** - Must meet Data Quality Objectives per Ohio EPA 5-Year Monitoring Strategy
Five Year Basin Monitoring & Assessment:Water Quality Management Support
5-Year BasinAssessments
Hazardous WasteSites (NRDA/CERCLA)
NPDES Permits(PSD Support,
Permits to Install)
WQS/Criteria &Use Designations
401Certification
(Habitat)
Status/TrendsReporting (305b;Ohio 2000 Goals)
NonpointSource
Assessment
Wet WeatherDischarges (CSOs,
StormwaterEnforcement/Litigation
Support
ComparativeRisk (State ofEnvironment
Rept.)
Watersheds/TMDLs (303d
Listings)
Source WaterProtection
Measurable Parameters of Watershed Health: 5-Year Basin Approach
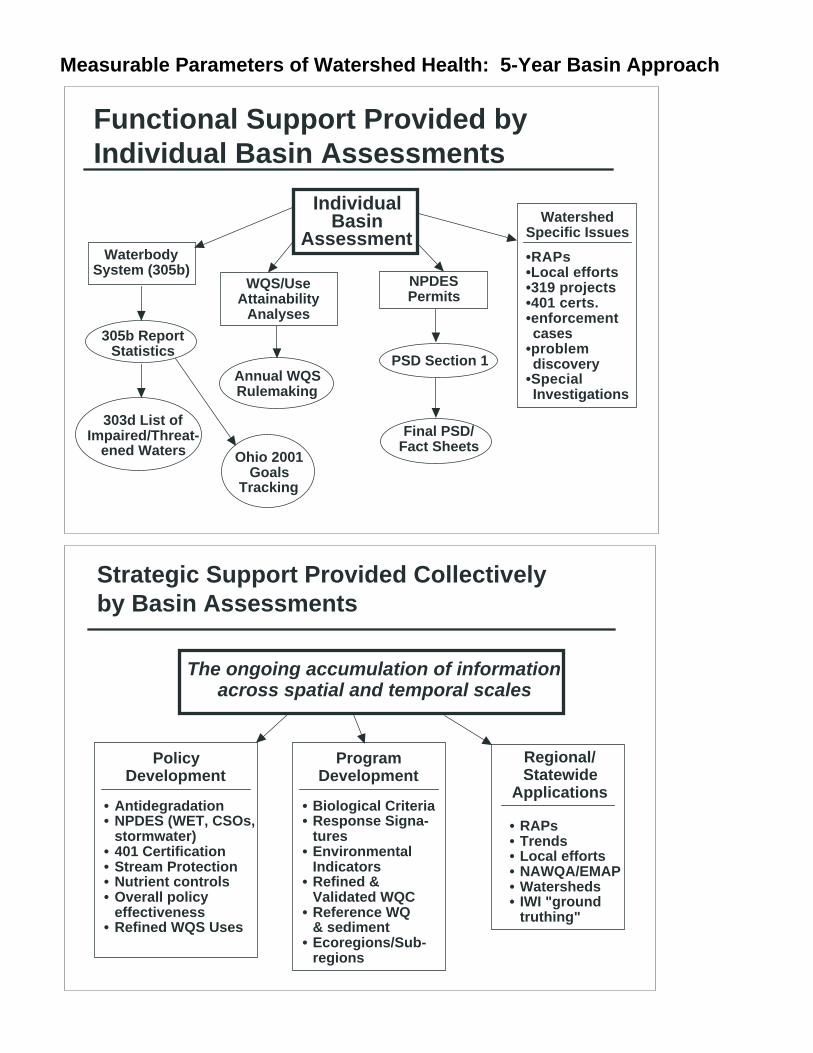
Functional Support Provided byIndividual Basin Assessments
IndividualBasin
AssessmentWatershed
Specific Issues
PSD Section 1
WaterbodySystem (305b)
WQS/UseAttainability
Analyses
NPDESPermits
305b ReportStatistics
303d List ofImpaired/Threat-
ened Waters
Annual WQSRulemaking
Final PSD/Fact Sheets
•RAPs•Local efforts•319 projects•401 certs.•enforcementcases
•problemdiscovery
•SpecialInvestigations
Ohio 2001Goals
Tracking
Strategic Support Provided Collectivelyby Basin Assessments
ProgramDevelopment
Regional/Statewide
Applications
• RAPs• Trends• Local efforts• NAWQA/EMAP• Watersheds• IWI "ground
truthing"
• Biological Criteria• Response Signa-
tures• Environmental
Indicators• Refined &
Validated WQC• Reference WQ
& sediment• Ecoregions/Sub-
regions
PolicyDevelopment
• Antidegradation• NPDES (WET, CSOs,
stormwater)• 401 Certification• Stream Protection• Nutrient controls• Overall policy
effectiveness• Refined WQS Uses
The ongoing accumulation of informationacross spatial and temporal scales
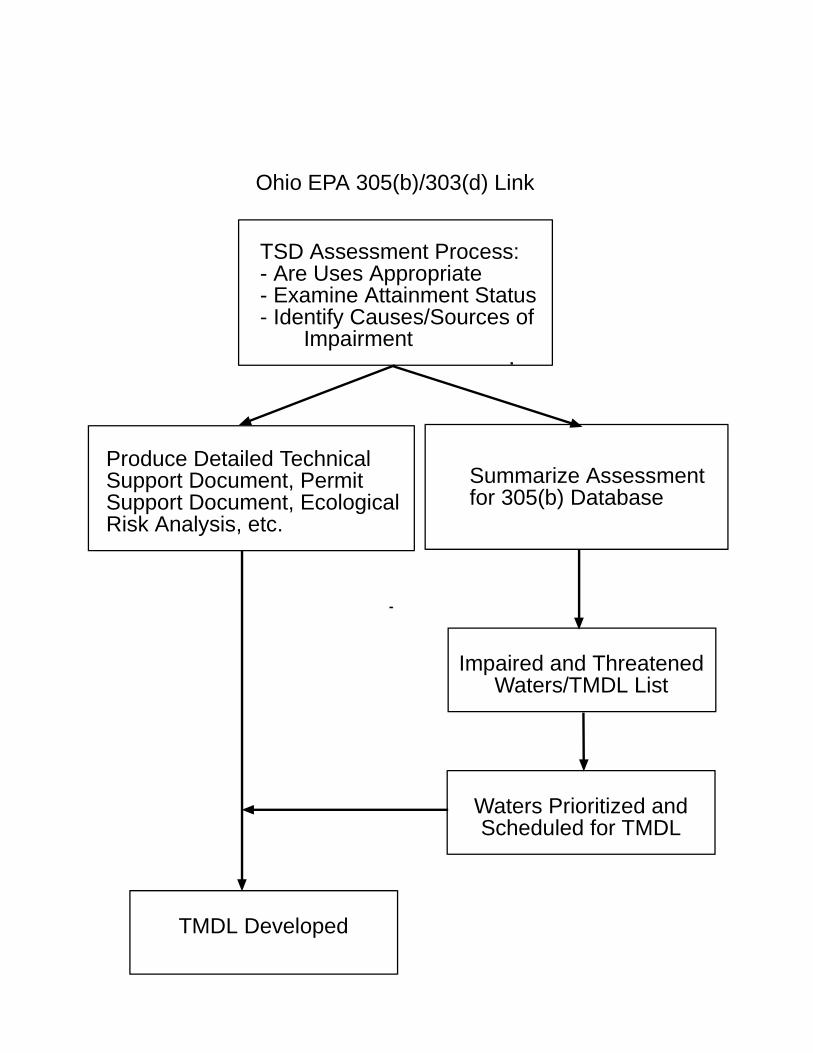
Ohio EPA 305(b)/303(d) Link
Summarize Assessmentfor 305(b) Database
TSD Assessment Process:- Are Uses Appropriate- Examine Attainment Status- Identify Causes/Sources of
Impairment
Produce Detailed TechnicalSupport Document, PermitSupport Document, EcologicalRisk Analysis, etc.
Impaired and ThreatenedWaters/TMDL List
Waters Prioritized andScheduled for TMDL
TMDL Developed

Measurable Parameters of Watershed Health: 5-Year Basin Approach
The Role of Biocriteria & Biosurveysin NPDES Permits
Use Designations:• Use designation determines which chemical critetia apply
Mixing Zones/WET Requirements:• Near and far-field impacts help determine WET category
Characterization of Impact:• Descibes extent and severity of impacts• Biological response signatures
Compliance Success/Failure:• Determine adequacy & success of abatement efforts
Enforcement Support:• Basic information about extent of environmental damage
NPDES PermitReissuance
2. REVISIONS TO WQS (Usedesignations, site-specific criteria)
WATER QUALITY PERMITSUPPORT DOCUMENT (WQPSD;Summary of impact assessment &
wasteload allocation)
OtherUseableData**WASTELOAD
ALLOCATION PROCESS(Chemical-specific, WET,
Anti-degradation)
TECHNICAL ASSESSMENT(Detailed summary of analysis &
status/trends throughoutwatershed)
Ohio EPA Assessment& Reporting Process:NPDES Permit Support
1. USE ATTAINMENT STATUS(Miles & severity of impairment;associated causes, sources)
PERMITSTAFF
3. OTHER RECOMMENDATIONS(Problem discovery, actionsneeded, follow-up investigations)
** - Must meet Data Quality Objectives per Ohio EPA 5-Year Monitoring Strategy

Sustainable Watershed Planning in Ohio
Measurable Parameters of Ecosystem Health:Water Quality Standards/Designated Uses

Measurable Parameters of Watershed Health: Water Quality Standards
Water Quality Standards: The Basisfor Water Quality Management
• Basis for implementing controls under CWA• Consist of uses and criteria• Focus of water quality planning/implementation• Benchmarks for evaluating effectiveness of
controls, funding, permits, BMPS, etc.
States are the principal custodians of WQSand associated use designations and criteria
Ohio WQS: Use Designations
• Tiered system of use classifications.• Principal uses: EWH, WWH, CWH, SSH, MWH, LRW.• Chemical criteria: pollutant specific.• Whole toxicity criteria: lab bioassay end-points.• Biological criteria: indigenous community based.
Aquatic Life Use Designations
Non-aquatic Life Use Designations• Recreation uses: primarily bacteriological criteria.• Consumption based uses: water supply uses.
Measurable Parameters of Watershed Health: Water Quality Standards
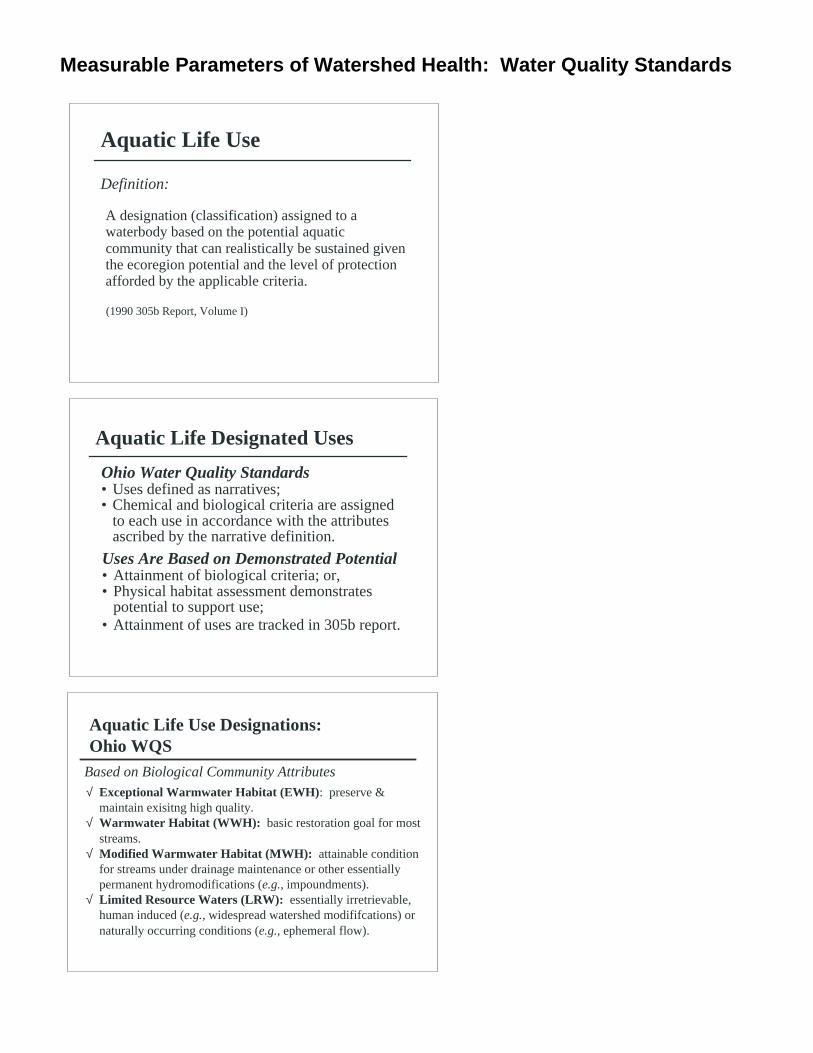
Aquatic Life Use
A designation (classification) assigned to awaterbody based on the potential aquaticcommunity that can realistically be sustained giventhe ecoregion potential and the level of protectionafforded by the applicable criteria.
Definition:
(1990 305b Report, Volume I)
Aquatic Life Designated Uses
Uses Are Based on Demonstrated Potential• Attainment of biological criteria; or,• Physical habitat assessment demonstrates
potential to support use;• Attainment of uses are tracked in 305b report.
Ohio Water Quality Standards• Uses defined as narratives;• Chemical and biological criteria are assigned
to each use in accordance with the attributesascribed by the narrative definition.
Aquatic Life Use Designations:Ohio WQS
√ Exceptional Warmwater Habitat (EWH): preserve &maintain exisitng high quality.
√ Warmwater Habitat (WWH): basic restoration goal for moststreams.
√ Modified Warmwater Habitat (MWH): attainable conditionfor streams under drainage maintenance or other essentiallypermanent hydromodifications (e.g., impoundments).
√ Limited Resource Waters (LRW): essentially irretrievable,human induced (e.g., widespread watershed modififcations) ornaturally occurring conditions (e.g., ephemeral flow).
Based on Biological Community Attributes

Measurable Parameters of Watershed Health: Water Quality Standards
Warmwater Habitat (WWH)
Characterized by aquatic communities with adiversity and functional organization comparableto the typical habitats of the region; such habitatsrepresent the "least disturbed" conditions typicalof an ecoregion.
Exceptional Warmwater Habitat(EWH)
Characterized by aquatic communities ofexceptional diversity and biotic integrity; suchcommunities usually have high species richness,often support significant populations of rare,threatened, endangered, or declining species and/orsupport exceptional sport fisheries.

Measurable Parameters of Watershed Health: Water Quality Standards
Modified Warmwater Habitat(MWH)
Aquatic life use assigned to streams subjected toessentially irretrievable, extensive, anthropogenicmodifications that preclude attainment of theWarmwater Habitat (WWH) use; such streamsare characterized by species that are tolerant ofpoor chemical quality (e.g. low D.O.) and habitatconditions (silt, habitat simplification).
Limited Resource Waters (LRW)
An aquatic life use assigned to streams with a verylimited aquatic life potential due to irretrievable,human-induced conditions; usually restricted tovery small streams (<3 sq. mi. drainage area) withsevere habitat restrictions and/or no or limitedwater during the summer, or severe acid minedrainage affected streams (pH < 4 S.U.).

Sustainable Watershed Planning in Ohio
Measurable Parameters of Ecosystem Health:Biological Criteria Concepts & Derivation
Measurable Parameters of Watershed Health: Biological Criteria
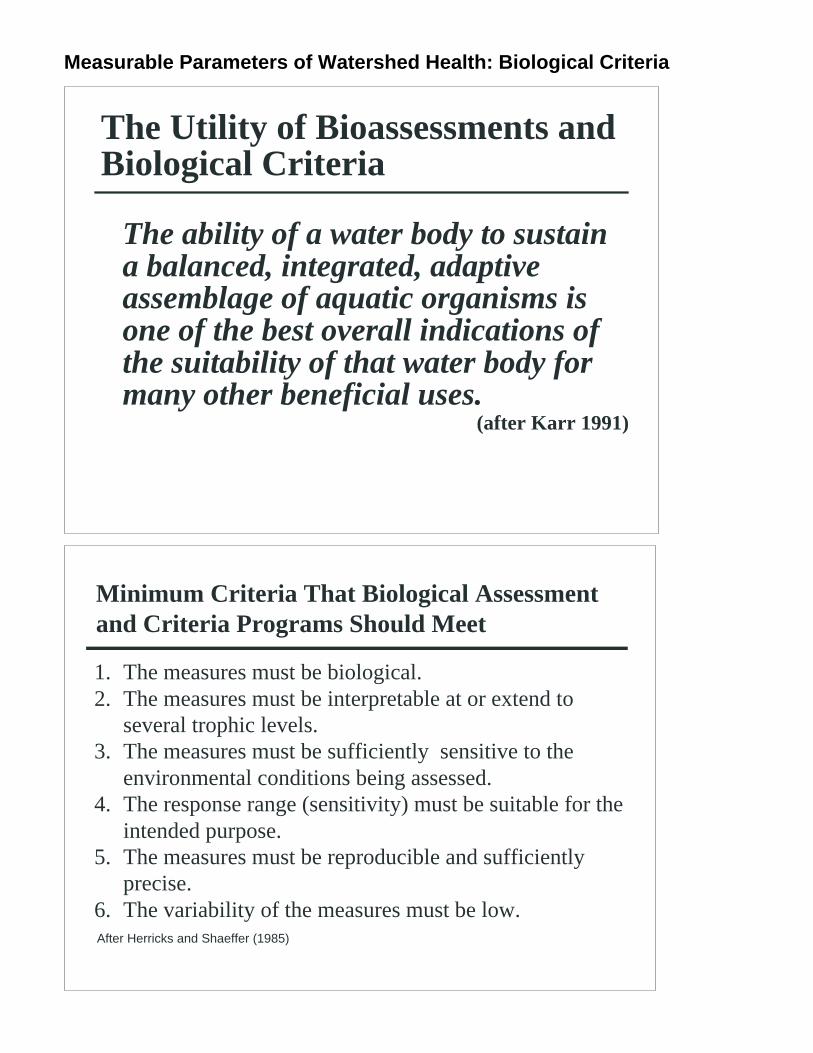
The Utility of Bioassessments andBiological Criteria
The ability of a water body to sustaina balanced, integrated, adaptiveassemblage of aquatic organisms isone of the best overall indications ofthe suitability of that water body formany other beneficial uses.
(after Karr 1991)
Minimum Criteria That Biological Assessmentand Criteria Programs Should Meet
1. The measures must be biological.2. The measures must be interpretable at or extend to
several trophic levels.3. The measures must be sufficiently sensitive to the
environmental conditions being assessed.4. The response range (sensitivity) must be suitable for the
intended purpose.5. The measures must be reproducible and sufficiently
precise.6. The variability of the measures must be low.After Herricks and Shaeffer (1985)

Measurable Paraneters of Watershed Health: Biological Criteria
Biological Criteria: I
• Narrative ratings or numerical values whichare based on the numbers and kinds ofaquatic organisms (i.e., assemblage) whichare found to inhabit a particular stream orriver sampling location.
Biological Criteria: II
• Biological criteria are indexed to thereference assemblage of aquatic organismswithin a particular geographical region (i.e.,ecoregion) and with respect to stream andriver size.
Biological Criteria: III
• Biological criteria represent a calibratedassessment tool which fosters an organizedgoal setting process in an effort to reconcilehuman impacts and guide restoration efforts.

Measurable Parameters of Watershed Health: Biological Criteria
Biological Integrity:Operational Definition
"The ability of an aquatic community to supportand maintain a structural and functional perform-ance comparable to the natural habitats of aregion."
paraphrased from Karr and Dudley (1981)
(Core of each aquatic life designation definition in the Ohio WQS)
Biological Integrity:Putting Theory Into Practice
• Biological Performance - need ways to measure (e.g.IBI, ICI, MIwb, BI, etc.).
• Natural Habitats - come to grips with the attainabilityissue (e.g. "least impacted" reference sites).
• Region - need to stratify and account for naturalvariability (e.g. ecoregions and tiered uses).
• Reference site "re-sampling" to account for broad scale,long-term changes in attainable conditions.
Essential Elements of the Regional ReferenceSite Approach
Measurable Parameters of Watershed Health: Biological Criteria
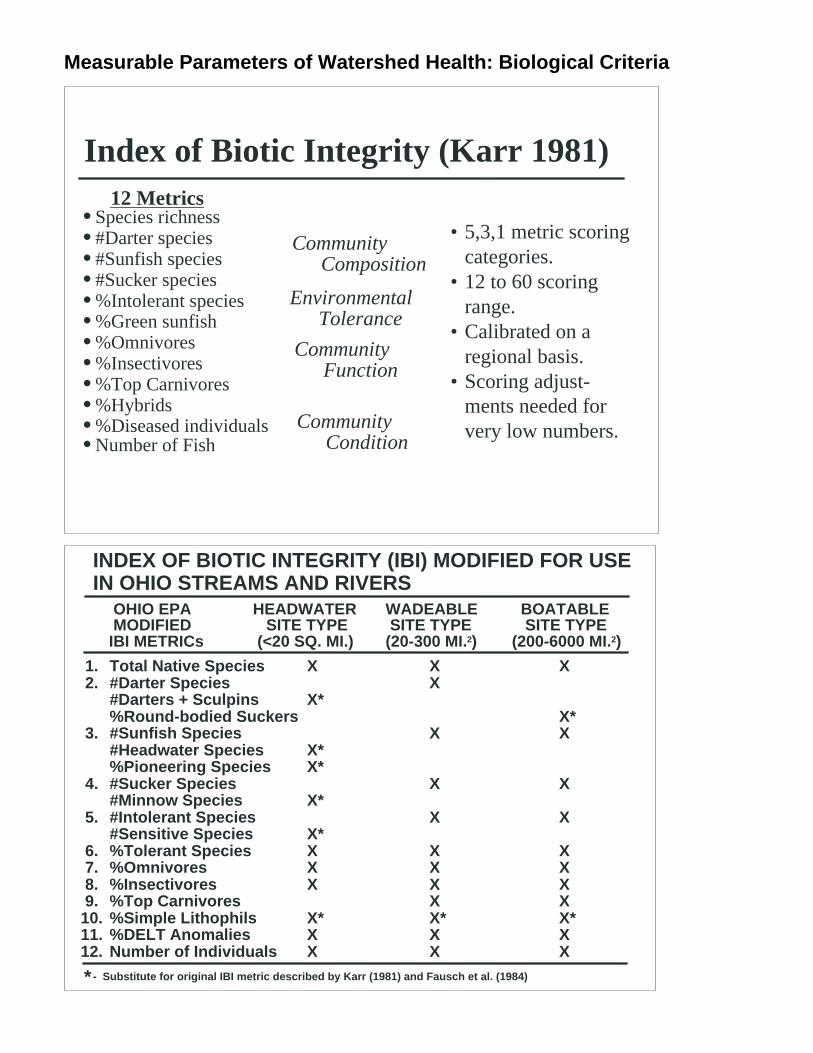
Index of Biotic Integrity (Karr 1981)
• Species richness• #Darter species• #Sunfish species• #Sucker species• %Intolerant species• %Green sunfish• %Omnivores• %Insectivores• %Top Carnivores• %Hybrids• %Diseased individuals• Number of Fish
12 Metrics
CommunityComposition
EnvironmentalTolerance
CommunityFunction
CommunityCondition
• 5,3,1 metric scoringcategories.
• 12 to 60 scoringrange.
• Calibrated on aregional basis.
• Scoring adjust-ments needed forvery low numbers.
OHIO EPA HEADWATER WADEABLE BOATABLE MODIFIED SITE TYPE SITE TYPE SITE TYPEIBI METRICs (<20 SQ. MI.) (20-300 MI.2) (200-6000 MI.2)
1. Total Native Species X X X 2. #Darter Species X
#Darters + Sculpins X*%Round-bodied Suckers X*
3. #Sunfish Species X X#Headwater Species X*%Pioneering Species X*
4. #Sucker Species X X#Minnow Species X*
5. #Intolerant Species X X#Sensitive Species X*
6. %Tolerant Species X X X 7. %Omnivores X X X 8. %Insectivores X X X 9. %Top Carnivores X X10. %Simple Lithophils X* X* X*11. %DELT Anomalies X X X12. Number of Individuals X X X
- Substitute for original IBI metric described by Karr (1981) and Fausch et al. (1984)*
INDEX OF BIOTIC INTEGRITY (IBI) MODIFIED FOR USEIN OHIO STREAMS AND RIVERS

Measurable Parameters of Watershed Health: Biological Criteria
Invertebrate Community Index(Ohio EPA 1987; DeShon 1995)
• Taxa Richness• #Mayfly taxa• #Caddisfly taxa• #Dipteran taxa• %Mayflies• %Caddisflies• %Tanytarsini Midges• %Other Diptera/Non-Insects• %Tolerant taxa• Qualitative EPT taxa
• 6,4,2,0 metric scoringcategories.
• 0 to 60 scoring range.• Calibrated on regional basis.• Scoring adjustments needed
for very low numbers ofspecific taxa.
Modified Index of Well-Being(MIwb): Computational Formula
Modified Index of Well-Being (MIwb)
MIwb = 0.5Ln N + 0.5Ln B + H (no.) + H (wt.)where:N = relative numbers of all species except Hybrids,
exotics, and those designated as highly tolerant.B = relative weight (kg) of all species except Hybrids,
exotics, and those designated as highly tolerant.H = Shannon diversity index based on numbers1
H = Shannon diversity index based on numbers1
1 based on loge version; all species including tolerants and exotics are included in
the calculation of H.
_
Measurable Parameters of Watershed Health: Biological Criteria
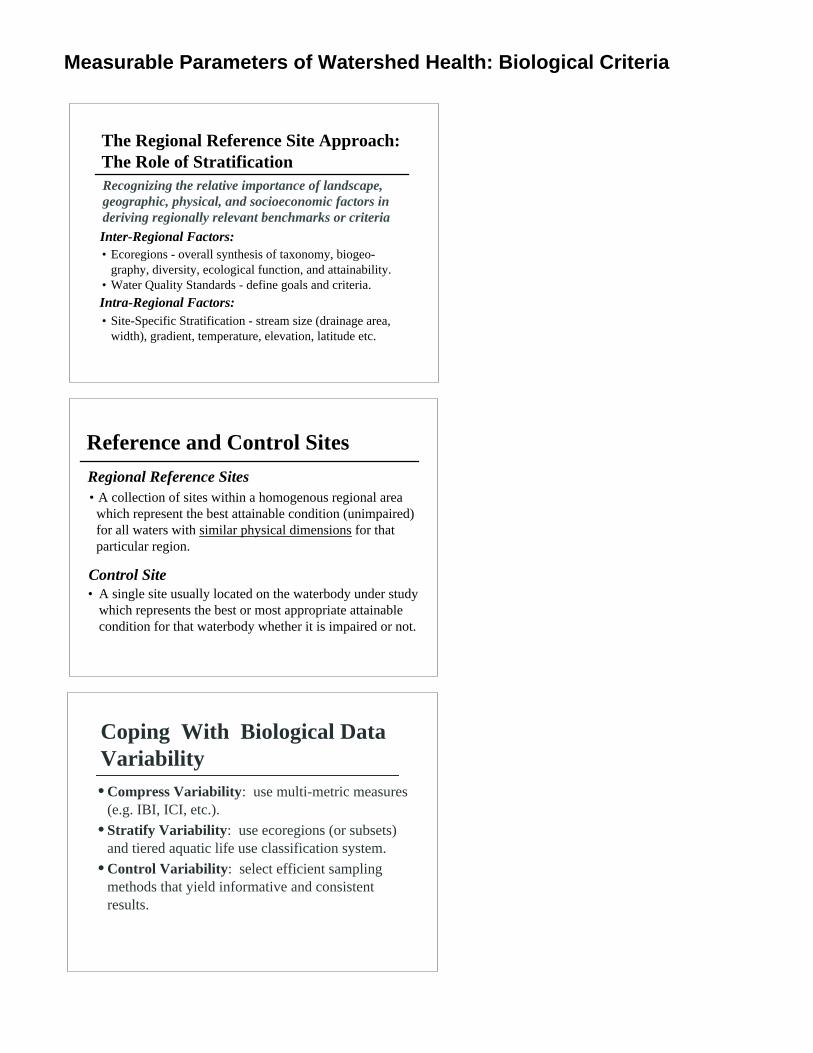
The Regional Reference Site Approach:The Role of Stratification
• Ecoregions - overall synthesis of taxonomy, biogeo-graphy, diversity, ecological function, and attainability.
• Water Quality Standards - define goals and criteria.
Recognizing the relative importance of landscape,geographic, physical, and socioeconomic factors inderiving regionally relevant benchmarks or criteria
Inter-Regional Factors:
Intra-Regional Factors:• Site-Specific Stratification - stream size (drainage area,
width), gradient, temperature, elevation, latitude etc.
Reference and Control Sites
• A collection of sites within a homogenous regional areawhich represent the best attainable condition (unimpaired)for all waters with similar physical dimensions for thatparticular region.
• A single site usually located on the waterbody under studywhich represents the best or most appropriate attainablecondition for that waterbody whether it is impaired or not.
Regional Reference Sites
Control Site
Coping With Biological DataVariability
• Compress Variability: use multi-metric measures(e.g. IBI, ICI, etc.).
• Stratify Variability: use ecoregions (or subsets)and tiered aquatic life use classification system.
• Control Variability: select efficient samplingmethods that yield informative and consistentresults.

Measurable Parameters of Watershed Health: Biological Criteria
Ecoregion Definition and Delineation
• Within region variability < between regionvariability
• Ecoregion driving factors:land surface formsoil typeland usepotential natural vegetation
• Regionalization helps organize and present ambientinformation and enhances communication
A more or less homogeneous area that differs fromother areas.
Ecoregions and Subregions: Policy& Program Uses
• Ecosystem Characteristics - stratified biological,physical, and chemical assessment end-points forrivers and streams.
• Water Quality Management Objectives -stratify background conditions across landscapesand watersheds (e.g., biological criteria, nutrients).
• Stream Protection Efforts - use ecoregions andsubregions to stratify policy applications.
• Best Management Practices - provides a readyframework to determine where specific BMPs aremost effective.
Measurable Parameters of Watershed Health: Biological Criteria
50/9.4
Fish — Wading SitesFish — Boat Sites
Fish — Headwater Sites Macroinvertebrates
34/8.6 40/8.7
42/8.5 40/8.6
38/8.7
32/7.3 38/7.9
40/8.3 44/8.4
40/8.1
28 40
40
40
44
34
30
34
36 36
Huron Erie Lake Plain - HELP
Interior Plateau - IP
Eastern-Ontario Lake Plain - EOLP
Western Allegheny Plateau - WAPEastern Corn Belt Plains - ECBP
50 46
48/9.6
EWH
IBI/Iwb IBI/Iwb
IBI ICI
EWH
EWH
EWH
10001001010
10
20
30
40
DRAINAGE AREA (SQ MI)T
OT
AL
SP
EC
IES
Wading & Headwater Sites
1
3
5
0
10
20
30
40
50
60
Uni
ts
IBI
I B I
IP(n = 50)
EOLP(n = 64)
HELP(n = 20)
WAP(n = 105)
ECBP(n = 155)
ECOREGION
REGIONAL REFERENCE SITES:IBI (Wading Site Type)
____________________________________________
Metric 5 3 1____________________________________________
Number of Species Varies x Drainage AreaNo. of Darter Spp. Varies x Drainage AreaNo. of Sunfish Spp. >3 2-3 <2No. of Sucker Spp. Varies x Drainage AreaIntolerant Species >100 sq. mi. >5 3-5 <3 <100 sq. mi. Varies x Drainage Area%Tolerant Species Varies x Drainage Area%Omnivores <19 19-34 >34%Insectivores <30 sq. mi. Varies x Drainage Area >30 sq. mi. >55 26-55 <26%Top Carnivores >5 1-5 <1%Simple Lithophils Varies x Drainage Area%DELT Anomalies >1.3 0.5-1.3 <0.5Relative Abundance >750 200-750<200____________________________________________
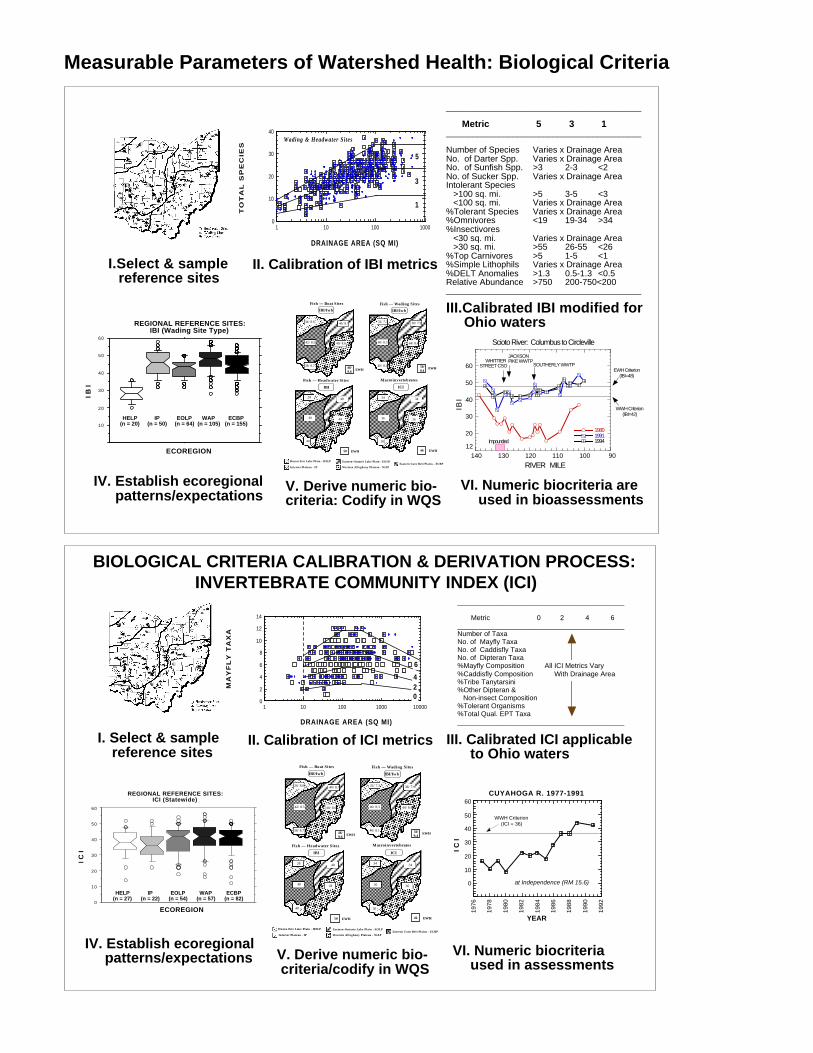
I.Select & samplereference sites
II. Calibration of IBI metrics
III.Calibrated IBI modified forOhio waters
IV. Establish ecoregionalpatterns/expectations
V. Derive numeric bio-criteria: Codify in WQS
VI. Numeric biocriteria areused in bioassessments
20
30
40
50
60
90100110120130140
198019911994
EWH Criterion(IBI=48)
RIVER MILE
WWH Criterion(IBI=42)
WHITTIERSTREET CSO SOUTHERLY WWTP
12
JACKSONPIKE WWTP
I B I
Impounded
Scioto River: Columbus to Circleville
50/9.4
Fish — Wading SitesFish — Boat Sites
Fish — Headwater Sites Macroinvertebrates
34/8.6 40/8.7
42/8.5 40/8.6
38/8.7
32/7.3 38/7.9
40/8.3 44/8.4
40/8.1
28 40
40
40
44
34
30
34
36 36
Huron Erie Lake Plain - HELP
Interior Plateau - IP
Eastern-Ontario Lake Plain - EOLP
Western Allegheny Plateau - WAPEastern Corn Belt Plains - ECBP
50 46
48/9.6
EWH
IBI/Iwb IBI/Iwb
IBI ICI
EWH
EWH
EWH
___________________________________________
Metric 0 2 4 6___________________________________________Number of TaxaNo. of Mayfly TaxaNo. of Caddisfly TaxaNo. of Dipteran Taxa%Mayfly Composition All ICI Metrics Vary%Caddisfly Composition With Drainage Area%Tribe Tanytarsini%Other Dipteran & Non-insect Composition%Tolerant Organisms%Total Qual. EPT Taxa___________________________________________
0
10
20
30
40
50
60
Uni
ts
ICI
I C I
REGIONAL REFERENCE SITES:ICI (Statewide)
HELP(n = 27)
IP(n = 22)
EOLP(n = 54)
WAP(n = 57)
ECBP(n = 82)
ECOREGION
WWH Criterion(ICI = 36)
0
10
20
30
40
50
60
1976
1978
1980
1982
1984
1986
at Independence (RM 15.6)
YEAR
CUYAHOGA R. 1977-1991
1988
I C I
1990
1992
1000010001001010
2
4
6
8
10
12
14
DRAINAGE AREA (SQ MI)
MA
YF
LY
TA
XA
6
420
I. Select & samplereference sites
II. Calibration of ICI metrics III. Calibrated ICI applicable to Ohio waters
IV. Establish ecoregional patterns/expectations V. Derive numeric bio-
criteria/codify in WQSVI. Numeric biocriteria
used in assessments
BIOLOGICAL CRITERIA CALIBRATION & DERIVATION PROCESS:INVERTEBRATE COMMUNITY INDEX (ICI)

Measurable Parameters of Watershed Health: Biological Criteria
Biocriteria in the Ohio Water Quality Standards(OAC 3745-1-07; Table 7-14)INDEX Modified Warmwater Habitat ExceptionalSite Type Channel Mine Warmwater WarmwaterECOREGION Modified Affected Impounded Habitat Habitat
I. INDEX OF BIOTIC INTEGRITY (IBI)A. Wading Sites
HELP 22 -- -- 32 50IP 24 -- -- 40 50EOLP 24 -- -- 38 50WAP 24 24 -- 44 50ECBP 24 -- -- 40 50
II. INVERTEBRATE COMMUNIY INDEX (ICI)A. Artificial Substrate Samplers (Statewide)
HELP 22 -- -- 34 46IP 22 -- -- 30 46EOLP 22 -- -- 34 46WAP 22 30 -- 36 46ECBP 22 -- -- 36 46
50/9.4
Fish — Wading SitesFish — Boat Sites
Fish — Headwater Sites Macroinvertebrates
34/8.6 40/8.7
42/8.5 40/8.6
38/8.7
32/7.3 38/7.9
40/8.3 44/8.4
40/8.1
28 40
40
40
44
34
30
34
36 36
Huron Erie Lake Plain - HELP
Interior Plateau - IP
Eastern-Ontario Lake Plain - EOLP
Western Allegheny Plateau - WAPEastern Corn Belt Plains - ECBP
50 46
48/9.6
EWH
IBI/Iwb IBI/Iwb
IBI ICI
EWH
EWH
EWH
Ohio NumericalBiological Criteria
• Two organism groups -fish & invertebrates
• Three indices - IBI, MIwb,ICI
• Three site types - head-water, wadable, boat
• Three use designations- WWH, EWH, MWH
• Reference sites number400 (sampled 1981- 1989);10% are resampled eachyear
• Codified in WQS in 1990(OAC 3745-1-07; Table7-14)

Huron-ErieLake Plain
(HELP)
EasternCorn Belt
Plain(ECBP)
InteriorPlateau
(IP)
Erie-OntarioLake Plain
(EOLP)
WesternAlleghenyPlateau(WAP)
ECBP
Huron Erie Lake Plain (HELP)Use Size IBI MIwb ICIWWH H 28 NA 34
W 32 7.3 34B 34 8.6 34
MWH-C H 20 NA 22W 22 5.6 22B 20 5.7 22
MWH-I B 30 5.7 NA
Erie Ontario Lake Plain (EOLP)Use Size IBI MIwb ICIWWH H 40 NA 34
W 38 7.9 34B 40 8.7 34
MWH-C H 24 NA 22W 24 6.2 22B 24 5.8 22
MWH-I B 30 6.6 NA
Western Allegheny Plateau (WAP)Use Size IBI MIwb ICIWWH H 44 NA 36
W 44 8.4 36B 40 8.6 36
MWH-C H 24 NA 22W 24 6.2 22B 24 5.8 22
MWH-A H 24 NA 30W 24 5.5 30B 24 5.5 30
MWH-I B 30 6.6 NA
Eastern Corn Belt Plains (ECBP)Use Size IBI MIwb ICIWWH H 40 NA 36
W 40 8.3 36B 42 8.5 36
MWH-C H 24 NA 22W 24 6.2 22B 24 5.8 22
MWH-I B 30 6.6 NA
Interior Plateau (IP)Use Size IBI MIwb ICIWWH H 40 NA 30
W 40 8.1 30B 38 8.7 30
MWH-C H 24 NA 22W 24 6.2 22B 24 5.8 22
MWH-I B 30 6.6 NA
Statewide Exceptional CriteriaUse Size IBI MIwb ICIEWH H 50 NA 46
W 50 9.4 46B 48 9.6 46
Numerical Biological Criteria:Ohio Water Quality Standards(OAC 3745-1-07; Table 7-14)
Adopted May, 1990
Measurable Parameters of Watershed Health: Biological Criteria
Biological IntegrityLOW HIGH
Measure-mentValue
Maximum
Minimum
"Exceptional"
"Good"
"Very Poor"
"Fair"
"Poor"
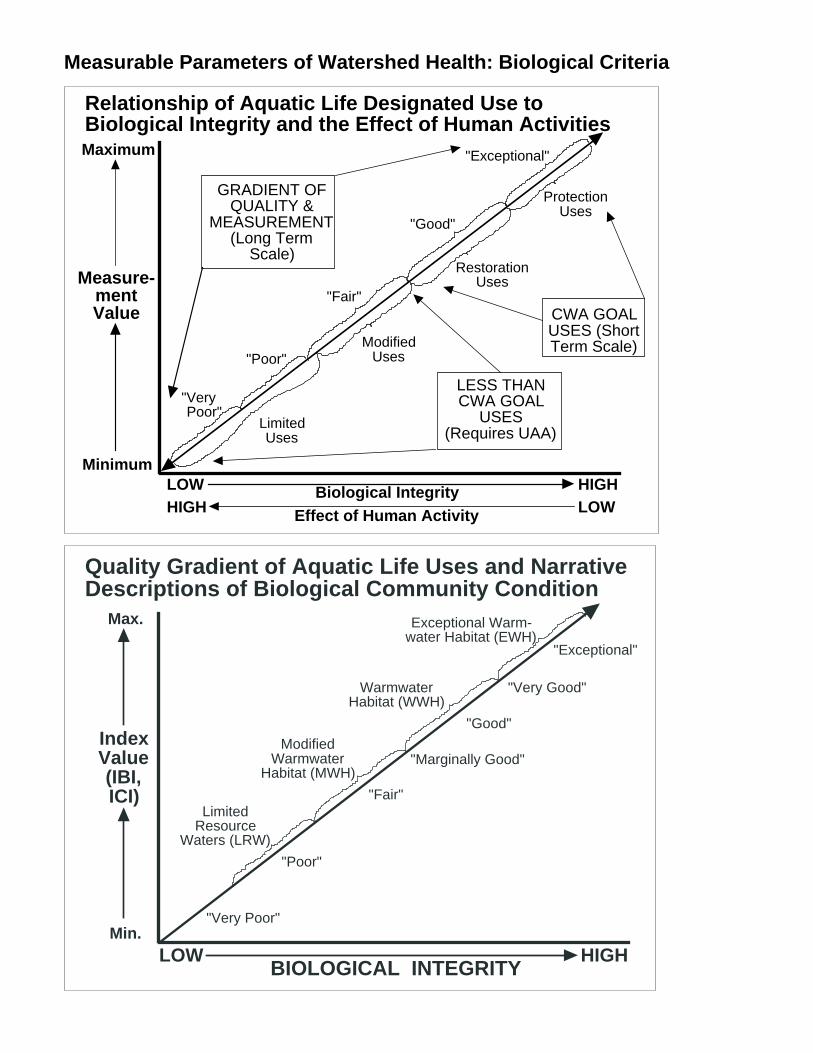
Relationship of Aquatic Life Designated Use toBiological Integrity and the Effect of Human Activities
ProtectionUses
RestorationUses
LESS THANCWA GOAL
USES(Requires UAA)
CWA GOALUSES (ShortTerm Scale)Modified
Uses
LimitedUses
GRADIENT OFQUALITY &
MEASUREMENT(Long Term
Scale)
Effect of Human ActivityHIGH LOW
BIOLOGICAL INTEGRITYLOW HIGH
IndexValue(IBI,ICI)
Max.
Min.
Exceptional Warm-water Habitat (EWH)
WarmwaterHabitat (WWH)
ModifiedWarmwater
Habitat (MWH)
LimitedResource
Waters (LRW)
"Exceptional"
"Good"
"Very Poor"
"Marginally Good"
"Fair"
"Poor"
Quality Gradient of Aquatic Life Uses and NarrativeDescriptions of Biological Community Condition
"Very Good"

Measurable Parameters of Watershed Health: Biological Criteria
BIOLOGICAL INTEGRITYLOW HIGH
Measure-ment Scale
Max.
Min.
"LeastImpacted"
"Pristine"
"SubstantiallyAltered"
"HighlyDegraded"
"Dead"
"SeverelyDegraded"
"Preservation"
"Restoration"
"Enhancement"
"Irretriev-able"
ManagementResponses/
Options
Quality StateGradient &Descriptors
Designated Uses: Principal WaterQuality Management Objectives
• Restoration - applies to most 303d listed waters inOhio (i.e., do not attain baseline CWA goals); mostcommon for WWH.
• Preservation - applies to high quality waters aboveCWA baselines; most common for EWH and higherantidegradation tiers.
• Enhancement - the best we can do where CWArestoration is precluded; applies to less than CWAuses (MWH, LRW).

Measurable Parameters of Watershed Health: Biological Criteria
0
2
4
6
8
10
12
12-19 20-29 30-39 40-49 50-60
10th Percentile D.O. Values
DIS
SO
LVE
D O
XY
GE
N (M
G/L
)
INDEX OF BIOTIC INTEGRITY
Proposed EWHMin. D.O. Criterion
WWH MinimumD.O. Criterion
Correspondence of Biocriteria toEnvironmental Gradients: Dissolved O
2
TO
TA
L R
EC
OV
ER
AB
LE
CO
PP
ER
(ug
/l)
IBI Range
99.5th %ile= 520 ug/l
EXCEPT.GOODFAIRPOORVERY POOR
99.5th %ile= 123 ug/l
ProposedGLI Criterion
CurrentOhio EPACriterion
@300 mg/lCaCO
3 Hardness
0
20
40
60
80
100
50-6040-4930-3920-2912-19
TO
TA
L R
EC
OV
ER
AB
LE
CA
DM
IUM
(ug
/l)
IBI Range
Maximum: 12 ug/l 99.5th Percentile: 27 ug/l
ProposedGLI Criterion
CurrentOhio EPACriterion
EXCEPT.GOODFAIRPOORVERY POOR
@300 mg/l CaCO3 Hardness
0
2
4
6
8
10
12-19 20-29 30-39 40-49 50-60
Biocriteria Can Be Usedto Validate the Accuracyof Chemical WaterQuality Criteria: Metals
•The Ohio EPA statewidedatabase was used tocorrelate ranges of biologicalquality with heavy metalsconcentrations.
•Proposed criteria changesfor copper, cadium, zinc, andlead were evaluated.
•The results were used todevelop biologically-basedapplication guidelines for theuse of dissolved metals incalculating wasteloadallocations for point sources.
Measurable Parameters of Watershed Health: Biological Criteria
-10
0
10
20
30
40
50
60
%DELT
1 2 3 4 5 6 7 8
IMPACT TYPES
ECBP/HELP Ecoregions
%D
EL
T
TOXICPS
CONV.WWTP
CONV.CSO
CHANNELIZ
ED
AGRIC.NPS
FLOWREG.
IMPOUNDED
TOXICCSO
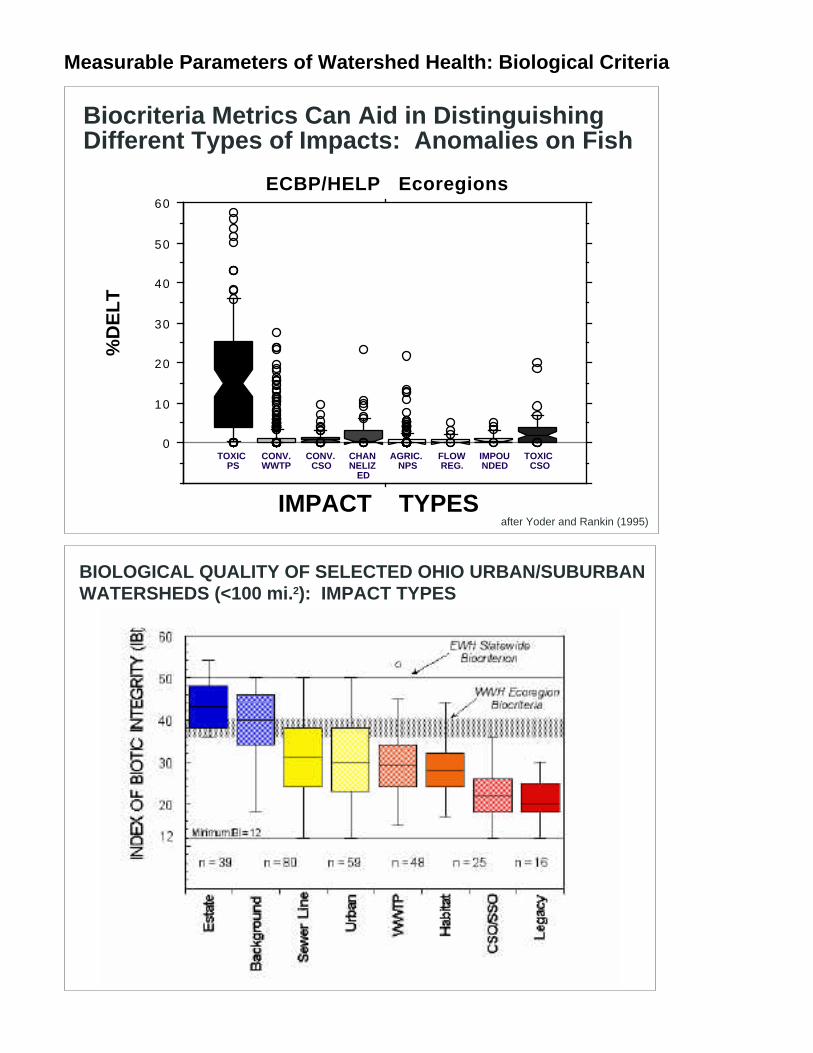
Biocriteria Metrics Can Aid in DistinguishingDifferent Types of Impacts: Anomalies on Fish
after Yoder and Rankin (1995)
BIOLOGICAL QUALITY OF SELECTED OHIO URBAN/SUBURBANWATERSHEDS (<100 mi.2): IMPACT TYPES

Sustainable Watershed Planning in Ohio
Measurable Parameters of Ecosystem Health:Biological Assessment Concepts and Uses
Measurable Parameters of Watershed Health: Biological Assessment
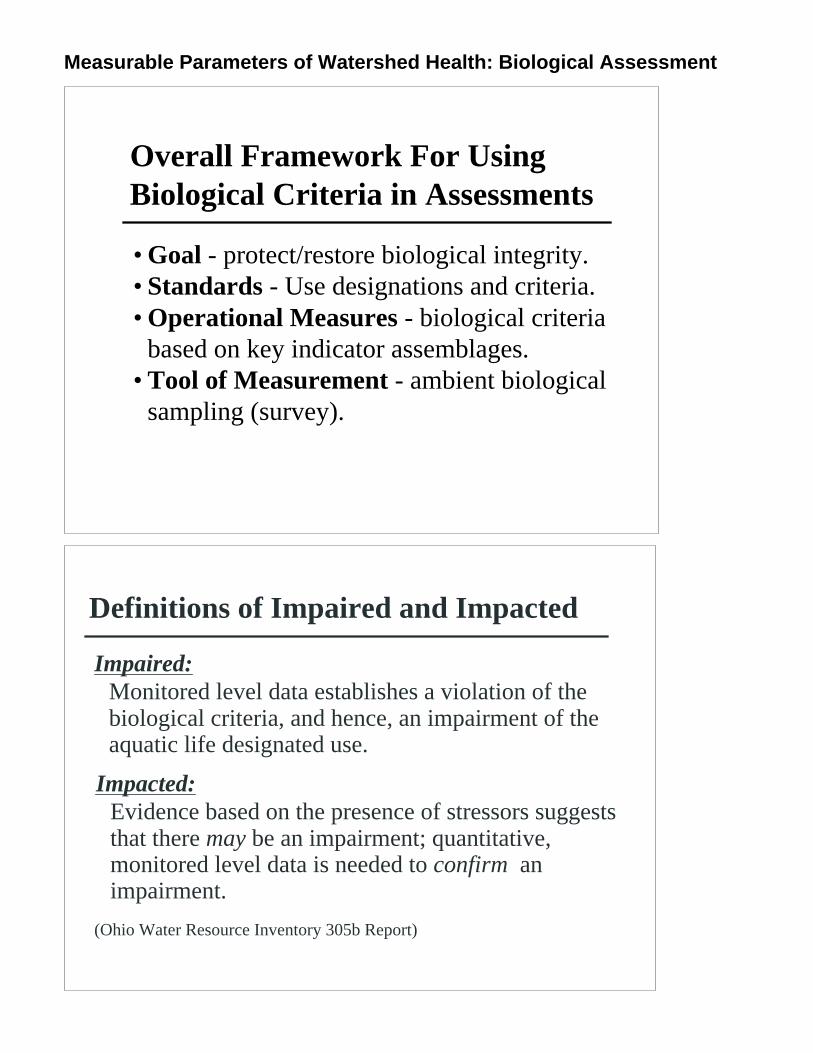
Overall Framework For UsingBiological Criteria in Assessments
• Goal - protect/restore biological integrity.• Standards - Use designations and criteria.• Operational Measures - biological criteria
based on key indicator assemblages.• Tool of Measurement - ambient biological
sampling (survey).
Definitions of Impaired and Impacted
Impaired:Monitored level data establishes a violation of thebiological criteria, and hence, an impairment of theaquatic life designated use.
Impacted:Evidence based on the presence of stressors suggeststhat there may be an impairment; quantitative,monitored level data is needed to confirm animpairment.
(Ohio Water Resource Inventory 305b Report)

Measurable Parameters of Watershed Health: Biological Assessment
Aquatic Life Use Attainment
Definition:
The condition when a waterbody has demonstrat-ed, through use of ambient biological and/orchemical data, that it does not significantly violatebiological or water quality criteria for that use.
(1990 305b Report, Volume I)
Determining Use Attainment StatusWith BiocriteriaFULL ATTAINMENT• ALL biological indices are at or within non- significant
departure of the applicable biocriterion
PARTIAL ATTAINMENT• A MIX of biological index scores at or within non-
significant departure and below the applicable biocriterion
NON-ATTAINMENT• NONE of the biological indices are at or within non-
significant departure of the applicable biocriterion OR oneorganism group reflect poor or very poor quality
Determining Aquatic Life Use AttainmentStatus With Biocriteria
Aquatic Life Use Attainment Table Format:
AttainmentRiver Mile IBI MIwb ICI QHEI Status-WWH Comment 20.2/20.0 44 8.9 40 68 FULL Ust. Anyplace WWTP 19.5/19.7 30* 8.0ns 34ns 60 PARTIAL WWTP Mixing Zone 17.0/16.8 22* 6.3* 8* 62 NON Dst. Anyplace WWTP 12.6/12.3 36ns 8.4 32* 70 PARTIAL Recovery zone 9.5/9.0 40 8.8 42 56 FULL Full Recovery 5.2/5.7 42 9.2 44 75 FULL 0.5/ - 32* 7.6* -- 45 [NON] Impoundment effect
* - significant departure from ecoregion biocriteria; poor and very poor performing values are underlined.ns- insignificant departure from ecoregion biocriteria (4 IBI or ICI units; 0.5 MIwb units).

Measurable Parameters of Watershed Health: Biological Assessment
1. Free-flowing river(WWH use designation):Upstream from urbanarea ECBP Ecoregion -Wading site type:
IBI = 40MIwb = 8.3ICI = 36
2. Impounded river (MWH usedesignation):Within urban area ECBPEcoregion - Boat site type:
IBI = 30MIwb = 6.6ICI = N/A
Limiting Factors:• chemical water quality• energy/flow dynamics• physical habitat
Limiting Factors:• physical habitat• energy/flow dynamics• chemical water quality
Flow Direction
Application of Biocriteria in Complex Settings
Limiting Factors:• chemical water quality• physical habitat• flow/energy dynamics
3. Free-flowing river (WWHuse designation):Downstream from urbanareaECBP Ecoregion - Boat sitetype:
IBI = 42MIwb = 8.5ICI = 36
CSOs WWTP
USING BIOLOGICAL CRITERIA & ASSESSMENT TOEVALUATE TRENDS IN QUALITY: SCIOTO RIVER

Measurable Parameters of Watershed Health: Biological Assessment
Actions byEPA andStates
Responsesby theRegulatedCommunitiy
Changes inDischargeQuantities
Changes inAmbientConditions
Changes inUptake and/orAssimilation
Changes inHealth andEcology, orOther Effects
• NPDES Permit Issuance• Compliance/Enforcement• Pretreatment Program• Actual Funding• CSO Requirements• Storm Water Permits• 319 NPS Projects• 404/401 Certification• Stream/Riparian Protection
• POTW Construction• Local Limits• Storm Water Controls• BMPs for NPS Control• Pollution Prevention Measures
• Point Source Loadings -Effluent & Influent
• Whole Effluent Toxicity (WET)• NPDES Violations• Toxic Release Inventory• Spills & Other Releases• Fish Kills
• Water Column Chemistry• Sediment Chemistry• Habitat Quality• Flow Regime
• Assimilative Capacity -TMDL/WLA
• Biomarkers• Tissue Contamination
• Biota (Biocriteria)• Bacterial Contamination• Target Assemblages
(RT&E, Declining Species)
LEVEL 4
LEVEL 5
LEVEL 6
LEVEL 3
LEVEL 2
LEVEL 1Hierarchy ofEnvironmentalIndicators forSurface Waters
•Pilot indicators projecttested hierarchy andselected indicators.
•Each indicator was usedwithin the most appropriaterole.
•Two case studies: SciotoR. (Columbus, OH) andOttawa R. (Lima, OH).
0
100
200
300
400
500Piqua WWTP 001 Effluent
Annual Loadings 50th percentile
95th percentile
1976
1977
1978
1979
1980
1981
1982
1983
1984
1985
1986
1987
1988
1989
1990
1991
1992
1993
1994
Am
monia
-N (kg
/day)
Current PermitLoad (30 day avg.)
Upper Great Miami River: Piqua WWTP EffluentLoadings 1976-1994 (Level 3 Indicator)

Measurable Parameters of Watershed Health: Biological Assessment
20
30
40
50
60
1980
1991
1994
WHITTIERSTREET CSO SOUTHERLY WWTP
12
JACKSONPIKE WWTP
I B I
Impounded
Scioto River: Columbus to Circleville
EWH Criterion(IBI=48)
WWH Criterion(IBI=42)
LEVEL 1:Ohio EPA issues WQ basedpermits & awards funds forColumbus WWTPs
LEVEL 2:Columbus constructs AWTby July 1, 1988; permitconditions attained
LEVEL 3: Loadings of ammonia,BOD, etc. are reduced
LEVELS 4&5: Reduced instreampollutant levels; enhanced assimilation
LEVEL 6: Biological recovery evidenced inbiocriteria; 3 yrs. post AWT
ADMINISTRATIVEINDICATORS
EXPOSURERESPONSE
STRESSORS
WWTP
$$$$NPDES
0
1000
2000
3000
4000
5000
6000
7000
8000
1975
1976
1977
1978
1979
1980
1981
1982
1983
1984
1985
1986
1987
1988
1989
1990
1991
1992
1993
1994
Am
mon
ia L
oadi
ng (
kg/d
ay)
N=143 148 151 134 152 153 151 153152 153121
YEAR
153153153153153153153153 153
30 Days Average Permit LimitWeekly Average Permit Limit
BO
D_C
O30
S
Columbus Southerly WWTP
Am
mon
ia-N
(m
g/l)
No
Dat
a
Summer: Data CollectedJune through October
N = 18 36 54 104
No
Dat
a
66 7134 105108 104
30-Day Average Criteria*
Maximum Criteria*
0
2
4
6
8
10
12
14
16
1971
-72
1973
-74
1975
-76
1977
-78
1979
-80
1981
-82
1983
-84
1985
-86
1987
-88
1989
-91
1992
-93
1994
-95
Scioto River Near Commercial Point (RM 115.3)
Demonstrating Linkages Between Indicators: Scioto River Case Study
Measurable Parameters of Watershed Health: Biological Assessment
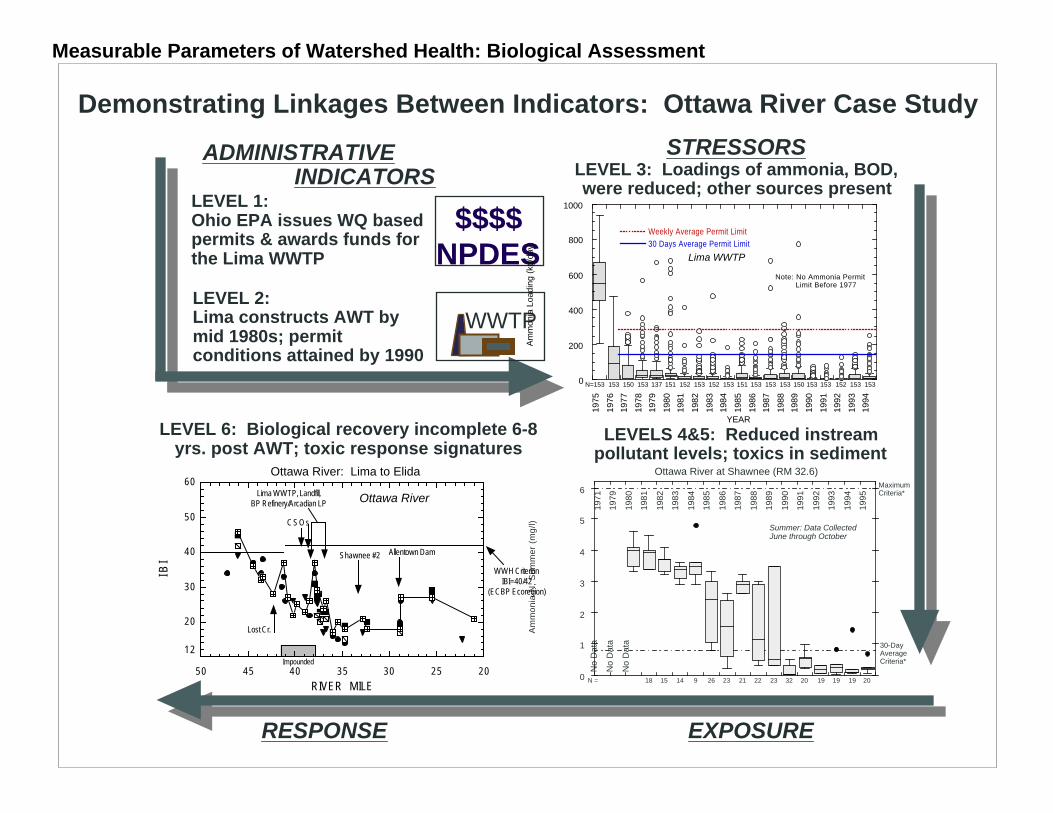
LEVEL 1:Ohio EPA issues WQ basedpermits & awards funds forthe Lima WWTP
LEVEL 2:Lima constructs AWT bymid 1980s; permitconditions attained by 1990
LEVEL 3: Loadings of ammonia, BOD,were reduced; other sources present
LEVELS 4&5: Reduced instreampollutant levels; toxics in sediment
LEVEL 6: Biological recovery incomplete 6-8yrs. post AWT; toxic response signatures
ADMINISTRATIVEINDICATORS
EXPOSURERESPONSE
STRESSORS
WWTP
$$$$NPDES
0
200
400
600
800
1000
1975
1976
1977
1978
1979
1980
1981
1982
1983
1984
1985
1986
1987
1988
1989
1990
1991
1992
1993
1994
Am
mon
ia L
oadi
ng (
kg/d
ay)
N=153 153 153 137 153152 152 153 153 153150 152150153151 153 153 153 153151
YEAR
Note: No Ammonia Permit Limit Before 1977
Weekly Average Permit Limit30 Days Average Permit Limit
Lima WWTP
Am
mo
nia
-N,
Su
mm
er
(mg
/l)
No
Dat
a
N =
No
Dat
a
No
Dat
a
MaximumCriteria*
30-DayAverageCriteria*
21 22 19 201920322323269141518 19
Ottawa River at Shawnee (RM 32.6)
Summer: Data CollectedJune through October
0
1
2
3
4
5
6
1971
1979
1980
1981
1982
1983
1984
1985
1986
1987
1988
1989
1990
1991
1992
1993
1994
1995
20
30
40
50
60
20253035404550
WWH CriterionIBI=40/42
(ECBP Ecoregion)
I B I
RIVER MILE
Lost Cr.
CSOs
Allentown Dam
Impounded
Ottawa River
Shawnee #2
12
Lima WWTP, Landfill,BP Refinery/Arcadian LP
Ottawa River: Lima to Elida
Demonstrating Linkages Between Indicators: Ottawa River Case Study

Measurable Parameters of Watershed Health: Biological Assessment
Using Indicators toEvaluate CausalAssociations & TrendsRocky Fork Mohican River:WWH Use (existing)Major Point Sources:Mansfield WWTP
[Industrial Pretreatment]Armco SteelOther Stressors:Luntz Corp. ScrapyardChannelization
Key Indicators: (Levels 4&6)Biological Response Signatures
[IBI, DELT Anomalies]Chemical (Sediment Chemistry)

Measurable Parameters of Watershed Health: Biological Assessment
Indicator Case Examples in Ohio
Documentation of Permit Program Effectiveness:• Good "success stories" limited to point sources.• Scioto River type of results repeated at
approximately 20-25 other municipalities statewide.• Ottawa River type results in fewer, but historically
industrialized areas of Ohio.
Documentation of Other WQ Management Successes:• Evidence of nonpoint source abatement emerging.• Clear Creek watershed - 50% reduction in soil loss.• Response observed in IBI 10-12 later.
Recent Indicators Publications
1. As Used in Water Quality Management
The role of biological indicators in a state water qualitymanagement process. J. Env. Mon. Assess. 51: 61-88.
Biological criteria for water resource management, pp.227-254. in P. Sculze (ed.). Measures of EnvironmentalPerformance and Ecosystem Condition, National AcademyPress, Washington, D.C.[www.nap.edu/books/0309054419/html/227.html]
2. As Used in Monitoring & Assessment Programs
Important elements and concepts of an adequateState watershed monitoring and assessment program.[www.epa.state.oh.us/dsw/document_index/docindex.html]
Measurable Parameters of Watershed Health: Biological Assessment
-20.0
0.0
20.0
40.0
60.0
80.0
100.0
CRICOTOPUSIMPACT TYPES
%C
RIC
OT
OP
US
SP
P.
n=72 n=275 n=22 n=10 n=83 n=23 n=24 n=11
Complex Muni. CSO Chan. Agric. Flow CSO Live- Toxic Conv. Conv. Mod. NPS Alter. Toxic stock
-20
0
20
40
60
80
Uni
ts
%TANYTARSINIIMPACT TYPES
%T
AN
YT
AR
SIN
I
n=72 n=275 n=22 n=10 n=83 n=23 n=24 n=11
Complex Muni. CSO Chan. Agric. Flow CSO Live- Toxic Conv. Conv. Mod. NPS Alter. Toxic stock
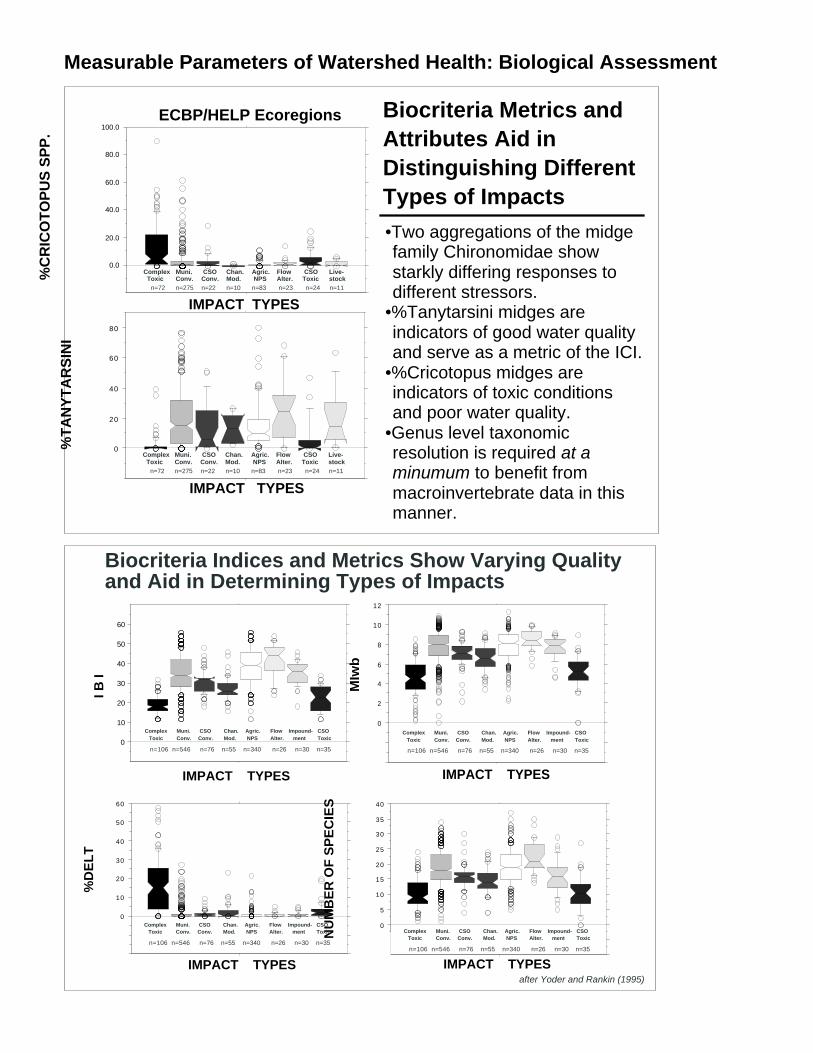
Biocriteria Metrics andAttributes Aid inDistinguishing DifferentTypes of Impacts
•Two aggregations of the midgefamily Chironomidae showstarkly differing responses todifferent stressors.
•%Tanytarsini midges areindicators of good water qualityand serve as a metric of the ICI.
•%Cricotopus midges areindicators of toxic conditionsand poor water quality.
•Genus level taxonomicresolution is required at aminumum to benefit frommacroinvertebrate data in thismanner.
ECBP/HELP Ecoregions
Biocriteria Indices and Metrics Show Varying Qualityand Aid in Determining Types of Impacts
after Yoder and Rankin (1995)
-10
0
10
20
30
40
50
60
70
I B I
IBIIMPACT TYPES
n=106 n=546 n=76 n=55 n=340 n=26 n=30 n=35
Complex Muni. CSO Chan. Agric. Flow Impound- CSO Toxic Conv. Conv. Mod. NPS Alter. ment Toxic
-4
-2
0
2
4
6
8
10
12
MIwb
MIw
b
IMPACT TYPES
-20
-10
0
10
20
30
40
50
60
%DELTIMPACT TYPES
%D
EL
T
-10
-5
0
5
10
15
20
25
30
35
40
Uni
ts
NO. SPECIESIMPACT TYPES
NU
MB
ER
OF
SP
EC
IES
n=106 n=546 n=76 n=55 n=340 n=26 n=30 n=35
Complex Muni. CSO Chan. Agric. Flow Impound- CSO Toxic Conv. Conv. Mod. NPS Alter. ment Toxic
n=106 n=546 n=76 n=55 n=340 n=26 n=30 n=35
Complex Muni. CSO Chan. Agric. Flow Impound- CSO Toxic Conv. Conv. Mod. NPS Alter. ment Toxic
n=106 n=546 n=76 n=55 n=340 n=26 n=30 n=35
Complex Muni. CSO Chan. Agric. Flow Impound- CSO Toxic Conv. Conv. Mod. NPS Alter. ment Toxic

Measurable Parameters of Watershed Health: Biological Assessment
20
30
40
50
60
05101520253035
HistoricalPre-DischargePost-Discharge
IND
EX O
F BI
OTI
C IN
TEG
RIT
Y (IB
I)
RIVER MILE
WWH Bio-criterion(IBI = 44)
Parker Run(Meigs #31 Discharge)
12
Leading Creek
Using Biocriteria to Evaluate Impacts of ToxicReleases: Leading Creek (SOCCo Mine Spill)
Using Biocriteria toEvaluate ChemicalContaminant Thresholds:Metals in Sediment
•Direct correlation of heavymetals in sediment with the IBIand %DELT anomalies state-wide.
•Determine highest concentra-tions at which biocriteria areattained, thus evaluatingprotectiveness of thresholdconcentrations.
•Does not rule out adverseeffects at lower concentrations -other test data needed.
•Can be used to evaluate the riskof toxic contamination in bottomsediments to aquatic life.
0
10
20
30
40
50
60
70
80
0-50
51
-10
0
10
1-1
50
15
1-2
00
20
1-2
50
25
1-3
00
30
1-3
50
35
1-4
00
40
1-4
50
45
1-5
00
>50
0
IBI >40 (Meets WWH)IBI >50 (Meets EWH)
NU
MB
ER
OF
SIT
ES
TOTAL TOXIC METALS (MG/KG)
0
5
10
15
20
0-50
51
-10
0
10
1-1
50
15
1-2
00
20
1-2
50
25
1-3
00
30
1-3
50
35
1-4
00
40
1-4
50
45
1-5
00
>50
0
%DELT (5Oth %ile)%DELT (75th %ile)
%D
ELT
AN
OM
ALI
ES
TOTAL TOXIC METALS (MG/KG)
ExtremeDeparture
ModerateDeparture

Measurable Parameters of Watershed Health: Biological Assessment
0
20
40
60
80
100
120
140
Sm
allm
outh
Bas
s
Bio
mass
Maintained/No Recovery
Recovering Recovered None
CHANNEL CONDITION
N = 88 N = 159 N = 23 N = 259
6 Sites>150 KgECBP/HELP
Ecoregions(<200 sq. mi.)
0
20
40
60
80
100
Sm
allm
outh
Bas
s
Abu
ndan
ce
Maintained/No Recovery
Recovering Recovered None
CHANNEL CONDITION
ECBP/HELPEcoregions
(<200 sq. mi.)
N = 90 N = 164 N = 25 N = 262
Smallmouth Bass Abundanceand Biomass by Channel Condition:
ECBP/HELP Ecoregion StreamsChannel ConditionAffects the Abundanceand Size of Small-mouth Bass in OhioStreams & Rivers•Smallmouth bass are one ofthe most popular and wide-spread game fish in Ohioand are a sentinel speciesfor WWH and EWH streamsand rivers.
•Adverse effects of channelmodification to smallmouthbass include loss of cover,loss of pools, degradation ofsubstrates, and food webalterations.
Channel ConditionAffects the Abundanceand Size of Rock Bassin Ohio Streams•Rock bass are a popularand widespread pan fish inOhio and are a sentinelspecies for small WWHand EWH streams.
•Adverse effects of channelmodification to rock bassinclude loss of cover, loss ofpools, degradation of sub-strates, and food webalterations.
0
5
10
15
20
Roc
k B
ass
Bio
mas
s
Maintained/No Recovery
Recovering Recovered None
CHANNEL CONDITION
N = 90 N = 164 N = 25 N = 262
2 Sites>20 KgECBP/HELP
Ecoregions(<200 sq. mi.)
0
50
100
150
200
250
Roc
k B
ass
Abu
ndan
ce
Maintained/No Recovery
Recovering Recovered None
CHANNEL CONDITION
N = 90 N = 164 N = 25 N = 262
5 Sites>250ECBP/HELP
Ecoregions(<200 sq. mi.)
Rock Bass Abundance andBiomass by Channel Condition:ECBP/HELP Ecoregion Streams

Measurable Parameters of Watershed Health: Biological Assessment
The Abundance andSize of SmallmouthBass Corresponds tothe IBI in OhioStreams & Rivers•Smallmouth bass are one ofthe most popular and wide-spread game fish in Ohioand achieve their highestnumbers and size instreams and rivers whichattain WWH and EWH.
•As a top carnivore, small-mouth bass abundance andsize decrease as overallaquatic community conditionand health declines.
-5
0
5
10
15
20
25
Rel. Wt.
RE
LA
TIV
E W
EIG
HT
(K
g)
-25
0
25
50
75
100
125
150
175
200
Rel. No.
RE
LA
TIV
E N
UM
BE
RS
V. POOR POOR FAIR GOOD EXCEP.
V. POOR POOR FAIR GOOD EXCEP.
n=50 n=356
n=1178 n=1846 n=683
n=50 n=356
n=1178 n=1846 n=683
IBI<18
IBI<28
IBI<38IBI<48
IBI>50
IBI<18
IBI<28
IBI<38IBI<48
IBI>50
IBI>18
IBI>28IBI>38
IBI>18
IBI>28 IBI>38
INDEX OF BIOTIC INTEGRITY
<18 18-27 28-37 38-47 48-60
0
0.1
0.2
0.3
0.4
0.5
12-19 20-29 30-39 40-49 50-60
UN
ION
IZE
D A
MM
ON
IA-N
(M
G/L
)
INDEX OF BIOTIC INTEGRITY (IBI)
VERYPOOR POOR FAIR GOOD EXCEP-
TIONAL
20
30
40
50
60
0 0.1 0.2 0.3 0.4 0.5
IND
EX
OF
BIO
TIC
IN
TE
GR
ITY
(IB
I)
UNIONIZED AMMONIA-N
N = 10,396
12
EWH
WWH #1
WWH #2
MWH
95% "Line-of-Best-Fit"
Using Biocriteria toValidate and EvaluateWater Quality Criteria:Ammonia
•Direct correlation of ambientammonia results with the IBIstatewide.
•Determine upper concentrationsat which biocriteria are attained,thus evaluating protectivenessof a criterion.
•Does not rule out adverseeffects at lower concentrations -toxicity test data needed.
•Can be used to set tieredchemical criteria for differentdesignated uses.

Sustainable Watershed Planning in Ohio
Measurable Parameters of Ecosystem Health:Ohio Water Resource Inventory (305b Report)

Measurable Parameters of Watershed Health: 305[b] Reporting
Ohio Water Resource Inventory(305[b] Report)
√ Reports on status of designated uses of Ohio's rivers,streams, lakes, reservoirs, Lake Erie, Ohio River,wetlands, and ground water.
√ Causes and sources of impairment determined usingmultiple indicators and "lines of evidence" approach.
√ Tracks progress in restoring water resources.√ Provides rankings of different types of problems.√ Baseline for future comparisons.
Required by Sec. 305b of the Clean Water Act
Ohio WaterResource Inventory
(305b Report)
STAFF COMPLETE WBS ASSESSMENTS(Determine associated causes & sources of
impairment and severity of impacts)
DATA AGGREGATION (Miles of rivers& streams which attain or do not attainbiocriteria and other criteria; associated
causes & sources are compiled)
OtherUseableData**
DATA ENTRY TO OHIO EPAWATER BODY SYSTEM (WBS)
TECHNICAL ASSESSMENT(Detailed summary of analysis
& status/trends throughoutwatershed)
Ohio EPA Assessment& Reporting Process:305b Reporting Process
303(d) List/TMDLs** - Must meet Data Quality Objectives perOhio EPA 5-Year Monitoring Strategy
Causes and Sources of Impairment
Causes• Agents such as pollutants and stressors such as
habitat alterations
Sources• Activities that produce the agents such as
point source discharges or land use activities

Year 2000Ohio Water Resource Inventory
Bob TaftGovernor, State of OhioChristopher JonesDirector, Ohio Environmental Protection AgencyP.O. Box 1049Lazarus Government Center,122 S. Front StreetColumbus, Ohio 43216-1049 Sept 11, 2000

Appendices to theYear 2000
Ohio Water Resource Inventory
Bob TaftGovernor, State of OhioChristopher JonesDirector, Ohio Environmental Protection AgencyP.O. Box 1049Lazarus Government Center,122 S. Front StreetColumbus, Ohio 43216-1049 Sept 11, 2000
Measurable Parameters of Watershed Health: 305[b] Reporting

Measurable Parameters of Watershed Health: 305[b] Reporting
Attainment Status by Stream/River Size:Year 2000 305b Report
Aquatic Life Use Attainment Status by Ohio EPADistrict: Year 2000 305b Report

Measurable Parameters of Watershed Health: 305[b] Reporting
RECREATIONAL USES STATUS: YEAR 2000305B REPORT

Measurable Parameters of Watershed Health: Habitat/UAA
Waterbody System Segment Coding Worksheet
Front Side Back Side

Measurable Parameters of Watershed Health: 305[b] Reporting

Fact Sheet #: FS-1-EAS-2000
Ohio WaterResourceInventory:
Aquatic Life Status: Year 2000
Ohio is a water-rich state with morethan 25,000 miles of named anddesignated streams and rivers and a451-mile border on the Ohio River.The suitability of these waters forbeneficial uses (e.g., recreation anddrinking water) and to maintainhealthy ecological conditions or“biological integrity” (a key goal ofthe Clean Water Act) is importantto Ohio's economy and standard ofliving.
Ohio EPA uses multiple chemical,physical, and biological measuresto assess the health and integrity ofsurface water resources. The bio-logical measures are emphasizedbecause the fish and invertebratesthat comprise this measure serve asliving indicators of the health andwell-being of Ohio's waterways.They also serve as a direct measureof the biological integrity goal ofthe Clean Water Act. These organ-isms are sensitive indicators ofwater pollution because they inhabitthe water all of the time and allaspects of their life cycles aredependent on water. A healthy fishor invertebrate community is alsoassociated with high quality recre-ational opportunities (e.g., fishing,swimming, canoeing, etc.).
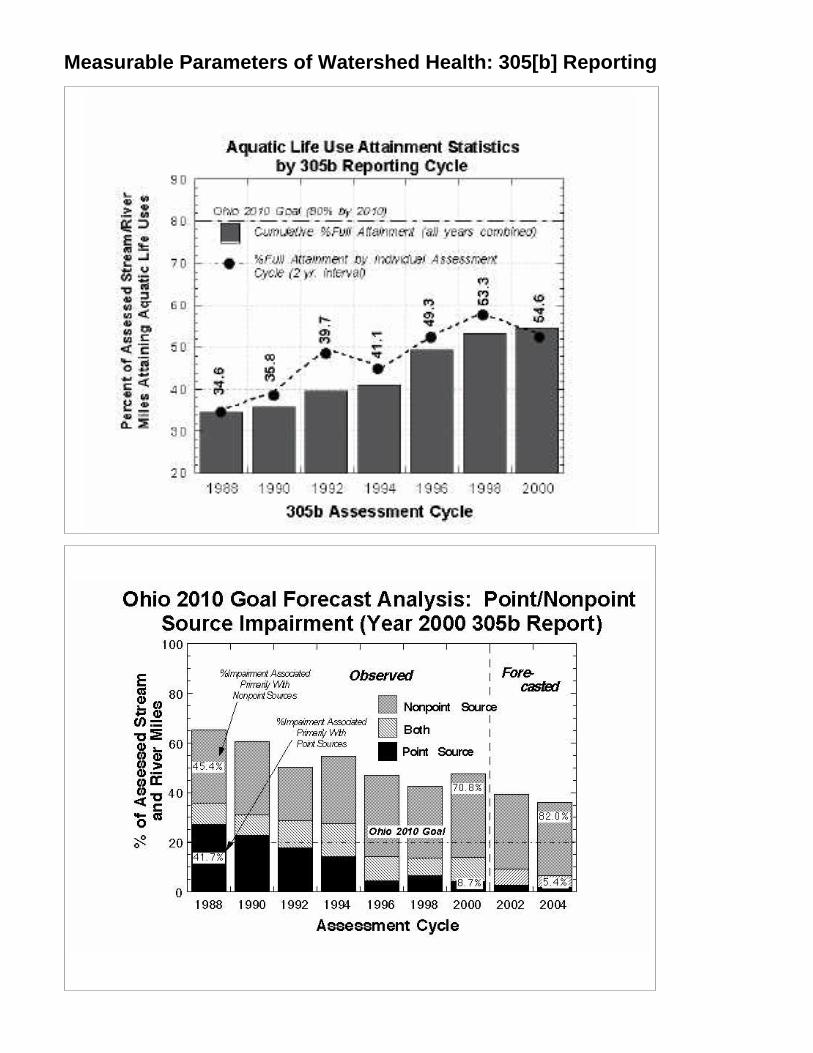
Ohio’s goal is for 80% of streamand river miles to fully meet theapplicable aquaticlife goals and stan-dards (called “uses”)by the year 2010.Progress towards thisgoal is tracked bythis report. The sta-tistics reported hereindicate that just overone-half (54.6%) ofthe streams and riv-ers that have beenmonitored and datais considered currentby Ohio EPA arefully supporting theirapplicable aquaticlife use designation(Figure 1). Thismeans that more thanone-half of Ohio'sstreams and riversharbor good orexceptional qualityassemblages of aquatic life. Statis-tics for the most recent two-yearreporting cycle alone (representingdata collected in 1997-98) showed52.3% of streams and rivers meet-ing uses (dotted line on Figure 2)which is a break in the trend ofincreasing attainment that has beenobserved since 1994. There aremultiple factors that are responsiblefor this change. Almost all of theimprovement noted in these statis-
tics since 1988 (Figure 2) is theresult of the abatement of the pointsource impacts dating from before
the 1970s and 1980s that were theoriginal impetus for the CleanWater Act. Reducing the effects ofthese sources was amenable to thetype of permitting and fundingassistance that was widely availablein the 1980s. The remaining pointand nonpoint source impactspresent greater challenges and thusa leveling off of the comparativelyrapid rate of restoration seenbetween 1988 and 1998 was
Figure 1. This pie chart summarizes the currentcumulative aquatic life use attainmentstatus for monitored-level data from the1988-2000 assessment cycles.
Figure 2. This bar chart summarizes the aquatic life use attainmentstatistics cumulatively up to each two-year cycle from1988 to 2000. Statistics for each assessment cycle aloneare illustrated by the dotted line. The individual 2000cycle reflects data collected in 1997 and 1998, the 1998cycle data collected from 1995 and 1996, etc.
20
30
40
50
60
70
80
90
1988 1990 1992 1994 1996 1998 2000
34.6
35.8 39
.7
41.1
49.3 53
.3
54.6
Year 2010 Goal
Aquatic Life Use Attainment Statistics By Cycle
Per
cen
t o
f M
iles
Att
ain
ing
Aq
uat
ic L
ife
Use
s
Assessment Cycle
Cumulative Statistics Up To That Cycle
Statistics By Individual Assessment Cycle
expected. An increasingly greaterproportion of the remaining impair-ment is associated with nonpointsources, which includes pollutedrunoff (such as sediment, nutrients,and toxic chemicals), habitat modi-fication and destruction, and alter-ation of flow regimes, that havealways been present during the past20 years, but in which there hasbeen comparatively little progressin abating. Other factors contribut-ing to the decline includes a shift tomonitoring a larger number of smallstreams, spatial bias in where moni-toring is conducted each year, andformerly attaining streams and riv-ers which have since becomeimpaired. Small, headwater streamsare the most common stream type inOhio (80% of streams drain <20 sq.mi.) and are theprimary interfacebetween non-point source pol-lutants andwatersheds.These streamstend to be propor-tionately moreimpaired thanlarger streamsand rivers.
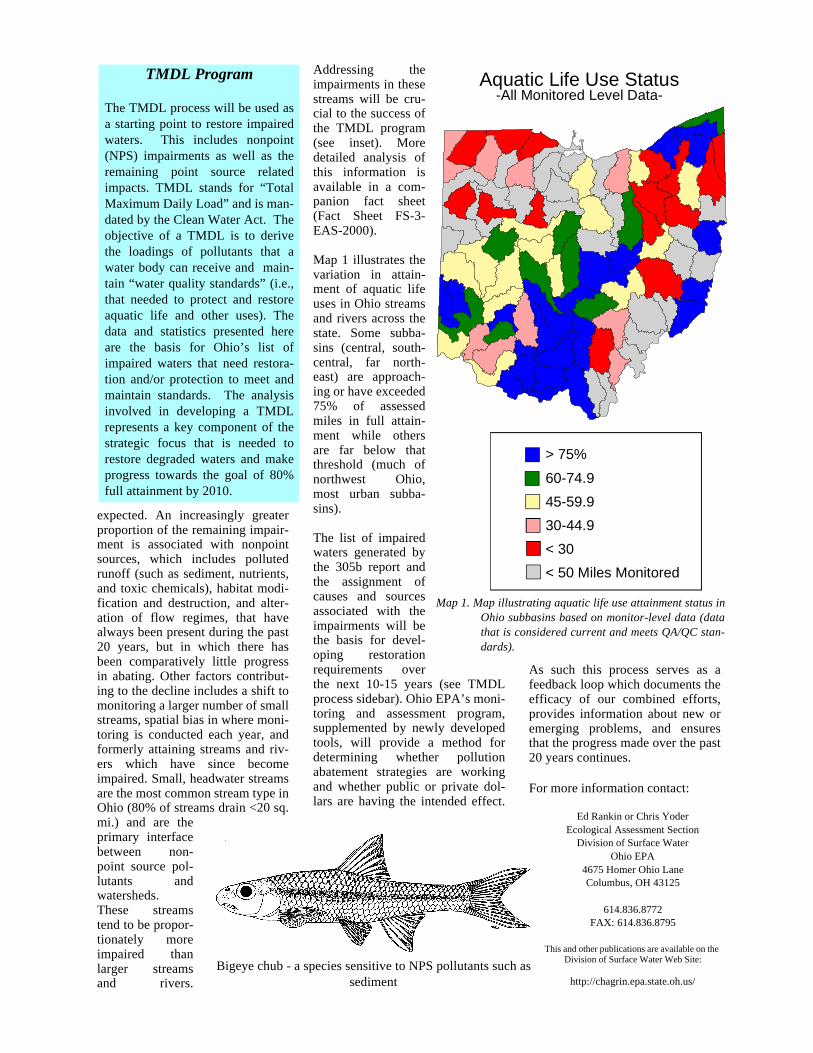
Addressing theimpairments in thesestreams will be cru-cial to the success ofthe TMDL program(see inset). Moredetailed analysis ofthis information isavailable in a com-panion fact sheet(Fact Sheet FS-3-EAS-2000).
Map 1 illustrates thevariation in attain-ment of aquatic lifeuses in Ohio streamsand rivers across thestate. Some subba-sins (central, south-central, far north-east) are approach-ing or have exceeded75% of assessedmiles in full attain-ment while othersare far below thatthreshold (much ofnorthwest Ohio,most urban subba-sins).
The list of impairedwaters generated bythe 305b report andthe assignment ofcauses and sourcesassociated with theimpairments will bethe basis for devel-oping restorationrequirements overthe next 10-15 years (see TMDLprocess sidebar). Ohio EPA’s moni-toring and assessment program,supplemented by newly developedtools, will provide a method fordetermining whether pollutionabatement strategies are workingand whether public or private dol-lars are having the intended effect.
As such this process serves as afeedback loop which documents theefficacy of our combined efforts,provides information about new oremerging problems, and ensuresthat the progress made over the past20 years continues.
For more information contact:
Ed Rankin or Chris YoderEcological Assessment Section
Division of Surface WaterOhio EPA
4675 Homer Ohio LaneColumbus, OH 43125
614.836.8772FAX: 614.836.8795
This and other publications are available on the Division of Surface Water Web Site:
http://chagrin.epa.state.oh.us/
TMDL Program
The TMDL process will be used asa starting point to restore impairedwaters. This includes nonpoint(NPS) impairments as well as theremaining point source relatedimpacts. TMDL stands for “TotalMaximum Daily Load” and is man-dated by the Clean Water Act. Theobjective of a TMDL is to derivethe loadings of pollutants that awater body can receive and main-tain “water quality standards” (i.e.,that needed to protect and restoreaquatic life and other uses). Thedata and statistics presented hereare the basis for Ohio’s list ofimpaired waters that need restora-tion and/or protection to meet andmaintain standards. The analysisinvolved in developing a TMDLrepresents a key component of thestrategic focus that is needed torestore degraded waters and makeprogress towards the goal of 80%full attainment by 2010.
Aquatic Life Use Status-All Monitored Level Data-
> 75%
60-74.9
45-59.9
30-44.9
< 30
< 50 Miles Monitored
Map 1. Map illustrating aquatic life use attainment status inOhio subbasins based on monitor-level data (datathat is considered current and meets QA/QC stan-dards).
Bigeye chub - a species sensitive to NPS pollutants such as sediment

Fact Sheet #: FS-2-EAS-2000
Ohio WaterResourceInventory:
Causes & Sources of Impairment:
Year 2000
hio's streams and rivers havesubstantially improved in
quality over the past 10-15 years.The majority of this improvementhas been the result of improvementsin the quality of municipal waste-water treatment discharges acrossOhio.
Ohio EPA uses multiple chemical,physical, and biological measuresto assess the health and integrity ofsurface water resources. The bio-logical measures are emphasizedbecause the fish and invertebratesthat comprise this measure serve asliving indicators of the health andwell-being of Ohio's waterways.They also serve as a direct measureof the biological integrity goal ofthe Clean Water Act. These organ-isms are sensitive indicators ofwater pollution because they inhabitthe water all of the time and allaspects of their life cycles aredependent on water. A healthy fishor invertebrate community is alsoassociated with high quality recre-ational opportunities (e.g., fishing,swimming, canoeing, etc.).
In addition to biological data, OhioEPA also collects information onthe chemical quality of the water,sediment and effluents; data on thecontaminants in fish flesh; and dataon the physical nature of streams(i.e., aquatic habitat, siltation). Thisdata is essential to identify the fac-tors that are limiting or impairaquatic life and which constitutethreats to human health.
Describing the causes and sourcesassociated with the impairmentsrevealed by the biological data andlinking this with pollution sourcesinvolves an interpretation of multi-ple lines of evidence includingwater and sediment chemistry data,habitat data, effluent data, biomoni-toring results, land use data, andresponse signatures within the bio-logical data itself. The assignmentof principal causes and sources of
impairment represents the associa-tion of impairments (defined by thebiological response) with stressorand exposure indicators (e.g.,chemical and physical data).
Leading CausesThe leading causes of impairmentin Ohio streams and rivers are listedin Figure 1. Although the leadingcause had been organic enrichment
Figure 1. Changes in major causes of aquatic life use impairment in Ohio streamsand rivers over the past three 305(b) assessment cycles: 1988, 1996, and2000. These represent the water years 1980-87, 1993-94, and 1997-98.
0 500 1000 1500 2000 2500 3000
Habitat Alterations
Siltation
Organic Enrichment
Nutrients
Flow Alteration
Metals
Ammonia
Major Causes of Aquatic Life Impairment
200019961988
1222
932.7
783.2
575.9
537.3
413.5
81.7
847.2
754.2
931.2
228
314.8
226.1
150.1
563.5
615.7
2674
3.3
355.2
599.2
648.4
Miles Impaired
O
Causes of impairment are the“agents” that actually damage orimpair the aquatic life in a stream,such as the toxic effects of heavymetals or acidic water. Sources ofimpairment are the origin of theagent. For example, an industrymay discharge a heavy metal, afarm may erode topsoil, or a coalmine may be the source of acidwater leaching into a stream.

and low dissolved oxygen up until1996, habitat degradation and sedi-mentation are now the leadingcauses of impairment. Habitat refersto the physical character of a streamor river which is necessary to sup-porting aquatic life. Many humanactivities can directly or indirectlydegrade habitat, thus making it lesssuitable for aquatic life. Aquatic lifeis especially dependent on intactinstream habitat and the adjacentvegetated riparian habitat as aremany other forms of wildlife. Ohiois not unique in this regard. TheNational Academy of Sciences(National Research Council 1992)recognized the devastation of ripar-ian and instream habitats and rec-ommended that 400,000 miles ofriver-riparian ecosystems berestored over the next 20 years. Themosaic of intact instream and ripar-ian habitats is also critical to astream or watershed maintainingthe capacity to intercept and assimi-late nonpoint source runoff, particu-larly nutrients and sediment. Thisensures that high quality water andbiological resources are “exported”to downstream reaches and largerreceiving water bodies.
Point SourcesImpairments from organic enrich-ment and low dissolved oxygenlargely originated from the inade-quate treatment of municipal waste-
water (a “point source”). Thesehave been the most rapidly declin-ing causes of impairment since1988. In 2000 point sources, as aprincipal source of impairment,declined to 8.7% of impaired streammiles from 41.7% in 1988 (FactSheet FS-3-EAS-2000).
Point source-related causes ofimpairment have also declinedsince 1988. Ammonia, a toxic com-ponent of municipal wastewater andthe second leading cause of impair-ment in 1988 (responsible for 648
miles of impair-ment), droppedto tenth in 2000(82 miles; Figure1). This dramaticimprovementresulted from theconstruction ofnew andupgraded sew-age treatmentfacilities in the1980s at a costof approximately$6 billion acrossOhio. Heavymetals as a prin-cipal cause ofimpairmentshowed a less
dramatic decline since 1988 (Figure1).
Nonpoint Sources: Leading Sources of Impairment in OhioThe major sources of aquatic lifeimpairment are illustrated in Figure2. Hydromodification is now theleading source of impairment and isthe origin of habitat degradationand sedimentation problems that arenow the top two leading causes ofimpairment. These are termed “non-point sources” because they do notemanate from pipes or other dis-crete conveyances, but instead arethe result of land disturbance activi-ties or direct modifications ofstream ecosystems. In 2000 we ini-tiated a more detailed analysis ofhydromodification by more pre-cisely delineating the origin (e.g.,associated with development oragricultural activities, etc.). Urbanand suburban development associ-ated hydromodification was respon-sible for 23.8% of the impairmentattributed to hydromodification(Figure 2). Combined with the con-struction category, development isthe fifth ranked source of impair-ment behind mining. Development-related activities are also the highest
0 200 400 600 800 1000 1200 1400
Hydromodi f icat ion
Agr icul ture
Poin t Sources
M ining
Other
Urban Runof f
Unknown
Land Disposal
Construct ion
Si lv icul ture
Major Source Categories Associated With
Aquatic Life Impairment2000 Cycle
1005.8
1048.8
774
455
287.6
274.5
250
135.9
108.2
0
Miles Impaired
Deve lopment
RelatedAgricul ture
Related
(2)
(3)
(1)
(4)
(5)
(6)
(7)
314.1
(8)
(9)
(10)
Figure 2. Major sources associated with aquatic life use impairment in Ohiostreams and rivers and considered current for the 2000 assessmentcycle (data collected as of 1998). Numbers in parentheses are ranksfrom the 1998 assessment cycle.
Figure 3. Change in major source categories associated withaquatic life use impairment in Ohio streams and riversbetween the 1988 and the 2000 assessment cycles.
-1000 -500 0 500 1000 1500 2000
Point Sources
Other
Mining
Silviculture
Land Disposal
Urban Runoff
Unknown
Development
Agriculture
Ag Hydromodification
Change in Major Sources Between the 1988 and 2000 Assessment Cycle
Change in River Mi les
Fewer Mi les Impaired
MoreMiles Impaired

ranked threat to fully attainingstreams and rivers. Point sources of impairment havedeclined the most since 1988 whenwe began tracking it in this manner.At that time point sources were amajor source in 2,453 miles of riv-ers and streams versus 777 miles in2000. Figure 3 summarizes thesechanges for the leading source cate-gories. Increases in agriculture andrelated hydromodification does notmean that these sources have wors-ened, rather they were previouslyovershadowed by now correctedpoint source impacts. It is theseremaining nonpoint source impactsthat will provide the primary resto-ration challenge for the TMDL pro-cess.
For more information contact:
Ed Rankin or Chris YoderEcological Assessment Section
Division of Surface WaterOhio EPA
4675 Homer Ohio LaneColumbus, OH 43125
614.836.8772FAX: 614.836.8795
This and other publications are avail-able on the Division of Surface Water
Web Site:
http://chagrin.epa.state.oh.us/
CitationNational Research Council. 1992.
Restoration of aquatic eco-systems: science, technol-ogy, and public policy. Committee on Restoration of Aquatic Ecosystems: Sci-ence, Technology, and Pub-lic Policy. National Academy Press, Washing-ton, D.C.
0 50 100 150 200 250 300
Development
Agriculture
Ag Hydromodification
Point Sources
Land Disposal
Urban Runoff
Mining
Major Source Categories Threatening Aquatic Life Uses
2000 Cycle
268.6
166.8
134.7
119.5
69.4
62.6
29
Miles Threatened
Figure 4. Major sources threatening aquatic life use attainment in Ohiostreams and rivers and considered current for the 2000 assess-ment cycle (data collected as of 1998).
Black Redhorse - Moxostoma duquesnei (Lesueur)An intolerant species found in medium to large streams and riv-ers that feeds on insects and invertebrates and is sensitive to the
causes of impairment that predominate in Ohio waters (e.g., sedimentation, habitat destruction, nutrient enrichment)

Fact Sheet #: FS-3-EAS-2000
Ohio WaterResourceInventory:
Trend Analysis Year 2000
hio EPA has been assessingthe quality of rivers and
streams for nearly 25 years. Eachriver or stream in Ohio has one offour aquatic life use goals (termed“uses”) that vary with the ecologi-cal potential of that waterway.Monitoring and assessment resultsare used to track attainment of thesegoals and this is detailed in theOhio Water Resource Inventory.The results of the year 2000 reportare summarized in this and twocompanion fact sheets.
Numerous Ohio stream and riversegments have been reassessed fol-lowing the implementation of pointsource controls to meet water qual-ity standards in the 1970s and1980s. One benefit of the monitor-ing approach employed by OhioEPA is the ability to forecast poten-tial water quality changes into thefuture. A major challenge facing theOhio EPA water programs is thegoal of achieving full support ofaquatic life uses in 80% of Ohio'sstreams and rivers by the year 2010(Ohio 2010 Goal). In order to deter-mine if existing programs are likelyto achieve this goal, we attemptedto look ahead based on past trendsin the process of restoring impairedwaters. The first of these forecastanalyses was accomplished in 1994,and updated biennially thereafterThe rate of restoration based onresults observed between 1988 and1998 (Figure 1) was 2.2% impairedmiles restored per year (range: 0.9-3.8% per year). This has largelybeen the product of point sourceabatement efforts that took place inthe 1970s and 1980s (see Figure 3).The results of the 2000 forecastanalysis indicate a slowing in therate of restoration to less than 2%(Figure 1). This was not entirelyunexpected since the proportion ofpoint source related impairmentshas been declining, presently com-prising less than 10% of impairedwaters. It is likely that the trendover the next several biennial
assessment cycles will continue tolevel off until additional progress isrealized in abating nonpoint sourcesof impairment, which comprisemore than 80% of the currentimpairment. Even if immediateprogress is made in dealing withthese sources, the inherently longerrecovery time from nonpoint sourceimpacts will result in the slowing ofthe rate of restoration in the future.
Slowing Rate of RestorationIt is important to understand thebasis for the trend assessment andto recognize what in the forecastanalysis is realand how muchis statistical“noise”. Thedata used in thetrend and fore-cast analysesare generated bythe watershedassessments thatcomprise thefive-year basinapproach. Thiseffort employs atargeted, inten-sive watershedsurvey design.While it isdriven by the
need to provide site-specific infor-mation for a variety of water qualitymanagement purposes (e.g., is a
O
Ohio 2010 Goals:
Aquatic Life Uses2010 Goal:
2010 Forecast:80%60.0%
2000 Actual:
Assuming Asymptotic Trend
52.3%
1
1
2000 Forecast: 61.7%2
97/98 Water Years2
Figure 1. Aquatic life use attainment trend prediction basedon 1988-1998 assessment cycles.
20
30
40
50
60
70
80
90
1988 1990 1992 1994 1996 1998 2000 2002
Predicted
Actual
Per
cen
t o
f M
iles
Att
ain
ing
Aq
uat
ic L
ife
Use
s
Assessment Cycle
Proposed Year 2010 Goa l
Prev ious Year 2000 Goa l
Aquatic Life Use Attainment Statistics By Cycle
34.6%39.4%
49.8%
45.4%
52.9%
57.4%
52.3%
66.1%
61.7%57% PredictedFrom 1996 Data
60.7% PredictedFrom 2000 Data

particular treatment plant effec-tive? is the designated aquatic lifeuse appropriate? should we commitabatement resources to this waterbody? etc.), it also provides a grow-ing database from which aggregatestatistics like those featured in thisreport can be derived. Comparisonsof this approach to a statisticallyrandom stream sampling design(1996 REMAP project) validate itsability to provide reliable statewideestimates of quality and trends inquality. As such, it provides a rea-sonable estimate of the condition ofall of Ohio’s rivers and streamsusing a subsample of assessedstreams and rivers.
Potential Factors: Stream Size, Declines in Attain-ment, and Spatial Bias
The 2000 results for the data years1997 and 1998 showed that 52.3%of the assessed miles were in fullattainment. This was 5.1% less thanthe 57.4% result reported in 1998(data years 1995 and 1996). It alsorepresented a break in the trend ofsteadily increasing full attainmentobserved since 1988 and was signif-icantly different from that pre-dicted by the 1998 forecast analysis(Figure 1). A major question raisedby these results is whether theobserved change in the rate of resto-ration can be attributed to realchanges in environment quality,whether it is within or outside of therange of expected deviation, orsome combination of these factors.Several factors were examined todetermine the extent of their influ-ence on the changes in the rate ofrestoration and the forecast analy-sis. Several factors, in addition to ananticipated leveling off of the resto-ration rate, were identified as poten-tially being responsible for the 5.1%difference between the 1998 and2000 two-year results. It is impor-tant to understand that we are con-cerned with changes in recenttrends, recognizing that the aggre-gate database (1988-2000) showedan overall improvement.
Stream SizeThe inclusion of proportionatelymore small streams in our basinassessments beginning in 1998 wasidentified as one factor potentiallyaffecting the 2000 results. When the2000 statistics are stratified bystream size ranges, the inclusion ofmore small streams had only aminor effect on the overall statisticsand were similar to the 1998 resultsfor small streams. The contribution
of this factor was less than 1% (Fig-ure 2).
Spatial Bias: Postponing Selected Basin Assessments
The five-year basin approachintends that watersheds will be reg-ularly assessed and reassessed on a5-10 year cycle. The resulting data-base forms the basis for the biennial305b statistics and the forecast anal-ysis. In 1998, the TMDL develop-ment commitment resulted in some
Figure 3. Trend in non-attainment of aquatic life uses in Ohio streams and riv-ers and illustrating the percent of non-attainment due to point sources,nonpoint sources, or a combination of point and nonpoint sources.
Figure 2. The attainment statistics for the 2000 assessment cycle and theestimated apportioning of deviation from the projected trend basedon the 1988-1998 assessment data.
40
45
50
55
60
65
Error in Forecast Estimate
Backsliding
Spatial Bias 2000
Small Stream Bias
Base
AquaticLifeUse
Attainment
2000Cycle

previously scheduled watershedreassessments being postponed.This shift towards monitoringTMDL targeted watersheds couldpotentially induce a spatial bias tothe biennial results by: 1) providingproportionately more data fromimpaired watersheds; and, 2) notincluding data from watershedswith proportionately higher levelsof full attainment.
Map 1 illustrates the 2000 cycleaquatic life attainment statistics bysubbasin where at least 25 streamand river miles were assessed.Three high quality subbasins (BigDarby Creek, Kokosing River, SaltCreek) scheduled for reassessmentin 1997 and 1998 were bypassed forthe aforementioned reasons. Inorder to examine the potential effectof this on the 2000 statistics, theprevious assessment results werecarried forward and used to recalcu-late the 2000 attainment statistics.The addition of this informationadded 1.4% to the 2000 cycleaquatic life attainment statistics,which is approximately one-fourthof the 5.1% change from 1998 to2000 (Figure 2).
Declining Attainment On average, in reaches where wehave sampled during a previousassessment cycle there has been atrend of improving attainment sta-tistics when the earliest versus latestdata were compared. Generally thisentails comparison of pre-1988 sur-veys with post-1988 results, whichcomprises the information for theOhio 2010 goal tracking and theforecast analysis. The 1988 year isan important threshold as it repre-sents the deadline for municipalwastewater treatment plants beingin compliance with water quality-based permit limitations. Increas-ingly, data is available to comparethe results of assessments and reas-sessments conducted since 1988,thus assessing the maintenance ofthe post-1988 gains in full attain-ment. Approximately 16% of theseresampled reaches in 1997 and1998 showed declines in miles
attaining and an increases in milesimpaired. The total miles thatdeclined (105.3 miles) contributed3.2% to the 5.1% change between1998 and 2000 (nearly two-thirds)and was the greatest of the factorsexamined (Figure 2). Most of thedecline in formerly attaining watersoccurred in the Little Miami Riverand East Fork Little Miami River,both EWH designated rivers. It willbe important in the future to deter-mine if similar high quality riverswith major point sources and a rela-tively high proportion of effluentflow show similar results.
ConclusionsAll of the factors examined hadmeasurable effects on the 2000results and the changes noted from1998. Of these, declines in attain-ment status associated with pointsources was the largest factor, fol-lowed by spatial bias in watershedselection, and stream size. How-ever, these factors combinedaccounted for just over one-half ofdifference between the 2000 resultsand the forecast analysis of 1998.The most reasonable interpretationof the data presented here is that thetrend of consistent linear increaseover the past decade is in realityleveling off and that the progressmade in abating point source pollu-tion the 1970s and 1980s has essen-
tially been accounted for in the305b database. This conclusion issupported by examining thechanges in impairment where pointsources are the sole problem (Fig-ure 3). The trend in these statisticsleveled off between the 1996 and2000 assessment cycles comparedto the greater improvements notedin the 1988 to 1994 cycles. It seemslikely that the attainment statisticswill level off between 55-60% untilthe remaining sources of impair-ment are addressed and thoseresults become evident in the statis-tics. The TMDL process and othermanagement and funding programswill assume much significance overthe next decade if we are to resumethe trend of restoration we observedduring the 1980s.
For more information, contact:
Ed Rankin or Chris YoderEcological Assessment Section
Division of Surface WaterOhio EPA
4675 Homer-Ohio LaneGroveport, OH 43125
614-836-8772Fax: 614-836-8795
e-mail: [email protected]: www.chagrin.epa.state.oh.us/
Populations of smallmouth bass, a premier sport fish in Ohio riv-ers and streams, would benefit from the abatement of nonpoint causes of impairment such as habitat, sediment, and nutrients
identified in the Ohio Water Resource Inventory.

Sustainable Watershed Planning in Ohio
Measurable Parameters of Ecosystem Health:Habitat Assessment/Use Attainability Analysis

Measurable Parameters of Watershed Health: Habitat/UAA
The Qualitative Habitat EvaluationIndex (QHEI)
• Substrate - types, origin, quality, embeddedness• Instream Cover - types and amounts• Channel Quality - sinuosity, development, stability• Riparian/Bank Stability - width, quality, bank erosion• Pool/Riffle/Run - max. depth, current types,
morphology, substrate embeddedness• Gradient - local gradient (varies by drainage area)
QHEI Includes Six Major Categories of Macrohabitat
Source: The Qualitative Habitat Evaluation Index (Rankin 1989)
QHEI: Qualititave HabitatEvaluation Index
• Visual method of measuring habitat quality
• Aid in designating aquatic life uses
• Aid in assessing causes of impacts
• Correlated with biological integrity
• Depends on standardized definitions of habitat types(training is very important)
• Reach-level habitat conditions also important (i.e.,“covariate” to QHEI)

Qualitative Habitat Evaluation Index Field Sheet QHEI Score:
Cover
Substrate
Channel
Riffle/Run
Gradient
Max 20
Max 20
Max 20
Riparian
Max 10
Max 12
Max 8
Max 10
7/16/98
*
*Best areas must be large enough to support a population of riffle-obligate fish species.
Pool/Current
EPA 4520
River Code:_________RM: _____ Stream____________________________________________________________________Date_____________ Location______________________________________________________________________________Scorers Initials:__________________ Comments_______________________________________________________________1] SUBSTRATE (Check ONLY Two Substrate TYPE BOXES; Estimate % present);TYPE POOL RIFFLE POOL RIFFLE SUBSTRATE ORIGIN SUBSTRATE QUALITY
❐ ❐-BLDR /SLBS[10]____ ____ ❐ ❐-GRAVEL [7] ____ ____Check ONE (OR 2 & AVERAGE)Check ONE (OR 2 & AVERAGE)❐ ❐-BOULDER [9] ____ ____ ❐ ❐-SAND [6] ____ ____ ❐ -LIMESTONE [1] SILT: ❐ -SILT HEAVY [-2]❐ ❐-COBBLE [8] ____ ____ ❐ ❐-BEDROCK[5] ____ ____ ❐ -TILLS [1] ❐ -SILT MODERATE [-1]❐ ❐-HARDPAN [4] ____ ____ ❐ ❐-DETRITUS[3] ____ ____ ❐ -WETLANDS[0] ❐ -SILT NORMAL [0]❐ ❐-MUCK [2] ____ ____ ❐ ❐-ARTIFICIAL[0]____ ____ ❐ -HARDPAN [0] ❐ -SILT FREE [1]❐ ❐-SILT [2] ____ ____ ❐ -SANDSTONE [0] EMBEDDED ❐ -EXTENSIVE [-2]NOTE: (Ignore sludge originating from point-sources; ❐ -RIP/RAP [0] NESS: ❐ -MODERATE [-1]score on natural substrates) ❐-5 or More [2] ❐ -LACUSTRINE [0] ❐ -NORMAL [0]NUMBER OF SUBSTRATE TYPES: ❐-4 or Less [0] ❐ -SHALE [-1] ❐ -NONE [1]COMMENTS_____________________________________________❐-COAL FINES [-2]_________________________________________2] INSTREAM COVER (see back for instructions for additional cover scoring method) AMOUNT: (Check ONLY One or
TYPE: (Check All That Apply) check 2 and AVERAGE)
❐ ___UNDERCUT BANKS [1] ❐ ___POOLS> 70 cm [2] ❐___OXBOWS, BACKWATERS [1] ❐ - EXTENSIVE > 75% [11]❐ ___OVERHANGING VEGETATION [1] ❐ ___ROOTWADS [1] ❐___AQUATIC MACROPHYTES [1] ❐ - MODERATE 25-75% [7]❐ ___SHALLOWS (IN SLOW WATER) [1] ❐ ___BOULDERS [1] ❐___LOGS OR WOODY DEBRIS [1] ❐ - SPARSE 5-25% [3]❐ ___ROOTMATS [1] COMMENTS:______________________________________________ ❐ - NEARLY ABSENT < 5%[1] 3] CHANNEL MORPHOLOGY: (Check ONLY One PER Category OR check 2 and AVERAGE)
SINUOSITY DEVELOPMENT CHANNELIZATION STABILITY MODIFICATIONS/OTHER❐ - HIGH [4] ❐ - EXCELLENT [7] ❐ - NONE [6] ❐ - HIGH [3] ❐ - SNAGGING ❐ - IMPOUND.❐ - MODERATE [3] ❐ - GOOD [5] ❐ - RECOVERED [4] ❐ - MODERATE [2] ❐ - RELOCATION ❐ - ISLANDS❐ - LOW [2] ❐ - FAIR [3] ❐ - RECOVERING [3] ❐ - LOW [1] ❐ - CANOPY REMOVAL ❐ - LEVEED❐ - NONE [1] ❐ - POOR [1] ❐ - RECENT OR NO ❐ - DREDGING ❐ - BANK SHAPING
RECOVERY [1] ❐ - ONE SIDE CHANNEL MODIFICATIONSCOMMENTS:_________________________________________________________4]. RIPARIAN ZONE AND BANK EROSION-(check ONE box per bank or check 2 and AVERAGE per bank) ★River Right Looking Downstream★
RIPARIAN WIDTH FLOOD PLAIN QUALITY (PAST 100 Meter RIPARIAN) BANK EROSIONL R (Per Bank) L R (Most Predominant Per Bank) L R L R (Per Bank)❐ ❐ -̇WIDE > 50m [4] ❐ ❐-FOREST, SWAMP [3] ❐ ❐-CONSERVATION TILLAGE [1] ❐ ❐ -NONE/LITTLE [3]❐ ❐ - MODERATE 10-50m [3] ❐ ❐-SHRUB OR OLD FIELD [2] ❐ ❐ -URBAN OR INDUSTRIAL [0] ❐ ❐ -MODERATE [2]❐ ❐ -̇NARROW 5-10 m [2] ❐ ❐-RESIDENTIAL,PARK,NEW FIELD [1] ❐ ❐ -OPEN PASTURE,ROWCROP [0] ❐ ❐ -HEAVY/SEVERE[1]❐ ❐ -̇ VERY NARROW <5 m[1] ❐ ❐ -FENCED PASTURE [1] ❐ ❐ -MINING/CONSTRUCTION [0]❐ ❐ -̇ NONE [0]COM-MENTS:_____________________________________________________________________________________________________________________5.]POOL/GLIDE AND RIFFLE/RUN QUALITY
MAX. DEPTH MORPHOLOGY CURRENT VELOCITY [POOLS & RIFFLES!](Check 1 ONLY!) (Check 1 or 2 & AVERAGE) (Check All That Apply)
❐ - >1m [6] ❐˙-POOL WIDTH > RIFFLE WIDTH [2] ❐˙-EDDIES[1] ❐˙-TORRENTIAL[-1]❐ - 0.7-1m [4] ❐ -POOL WIDTH = RIFFLE WIDTH [1] ❐ -̇FAST[1] ❐ -̇INTERSTITIAL[-1]❐ - 0.4-0.7m [2] ❐˙-POOL WIDTH < RIFFLE W. [0] ❐ -̇MODERATE [1] ❐ -̇INTERMITTENT[-2]❐ - 0.2- 0.4m [1] ❐ -̇SLOW [1]❐ - < 0.2m [POOL=0] COMMENTS:________________________________________________________________________
CHECK ONE OR CHECK 2 AND AVERAGE
RIFFLE DEPTH RUN DEPTH RIFFLE/RUN SUBSTRATE RIFFLE/RUN EMBEDDEDNESS❐ - Best Areas >10 cm [2] ❐ - MAX > 50 [2] ❐-STABLE (e.g.,Cobble, Boulder) [2] ❐ - NONE [2]❐ - Best Areas 5-10 cm[1] ❐ - MAX < 50[1] ❐-MOD. STABLE (e.g.,Large Gravel) [1] ❐ - LOW [1]❐ - Best Areas < 5 cm ❐-UNSTABLE (Fine Gravel,Sand) [0] ❐ - MODERATE [0]
[RIFFLE=0] ❐ - EXTENSIVE [-1]COMMENTS:________________________________________________________❐ - NO RIFFLE [Metric=0]
6] GRADIENT (ft/mi): _______DRAINAGE AREA (sq.mi.):_______ %POOL: %GLIDE:%RIFFLE: %RUN:

Is Sampling Reach Representative of the Stream (Y/N)___ If Not, Explain: Major Suspected Sources ofImpacts (Check All That Apply):
NoneIndustrial
WWTPAg
LivestockSilviculture
ConstructionUrban Runoff
CSOsSuburban Impacts
MiningChannelization
Riparian RemovalLandfillsNatural
DamsOther Flow Alteration
Other:_____________
❐❐❐❐❐❐❐❐❐❐❐❐❐❐❐❐❐❐
SubjectiveRating(1-10)
AestheticRating(1-10)
FirstSampling Pass
Gear: Distance: Water Clarity: Water Stage: Canopy -% Open
Stream Measurements:AverageWidth
AverageDepth
MaximumDepth
Av. BankfullWidth
Bankfull MeanDepth
Bankfull MaxDepth
FloodproneArea Width
W/DRatio
Entrench.Ratio
Gradient:❐ - Low, ❐ - Moderate, ❐ -High
Stream Drawing:
Instructions for Scoring the Alternate Cover Metric: Each Cover Type Should Receive a Score of Between 0 and 3, Where:0 - Cover type absent; 1 - Cover type present in very small amounts or if more common of marginal quality; 2 - Cover typepresent in moderate amounts, but not of highest quality or in small amounts of highest quality; 3 - Cover type of highest quality inmoderate or greater amounts. Examples of highest quality cover include very large boulders in deep or fast water, large diameterlogs that are stable, well developed rootwads in deep/fast water, or deep, well-defined, functional pools.

Measurable Parameters of Watershed Health: Habitat/UAA
<30 30-44 45-59 60-74 >75
Q H E I(V. Poor) (Poor) (Fair-Good) (Good) (Excellent)
BIOLOGICAL CONDITION IS CORRELATEDWITH HABITAT QUALITY: IBI
Abundance of Cover Types Affects the Abilityto Meet Designated Uses
Channel Condition Affects the Ability to MeetDesignated Uses

Measurable Parameters of Watershed Health: Habitat/UAA
Substrate Condition Affects the Ability to MeetDesignated Uses
BIOLOGICAL CONDITION IS CORRELATEDWITH HABITAT QUALITY: DELT Anomalies
<30 30-44 45-59 60-74 >75
Q H E I(V. Poor) (Poor) (Fair-Good) (Good) (Excellent)

KeyQHEIComponents
QHEI
Moderate Influence
Gradient(ft/mile)
RiverMile
Qualitative Habitat Evaluation Index (QHEI)
WWH Attributes MWH AttributesHigh Influence
(04-130) Little Auglaize RiverYear: 1983
22.0 ■ ● 41.1 ● ▲▲ ▲▲▲ ▲ ▲ 2.23 1 2 9▲ ▲ 1.50 6.00
22.0 ■ ■ ● ● 37.4 ● ▲ ▲ ▲ ▲ 1.48 2 3 5▲ 1.33 3.00
29.0 ■ ■ ● 34.2 ● ▲▲ ▲ ▲ ▲ 1.36 2 2 7▲ ▲ 1.00 3.33
22.0 ● 29.5 ● ● ▲▲ ▲▲ ▲ ▲ 1.06 0 3 8▲ ▲ 4.00 *.**
37.0 ■ ■ ■ ● 18.8 ● ▲▲ ▲▲ ▲ 3.23 3 2 7▲ ▲ 0.75 2.50
36.0 ■ ■ ● 17.6 ● ● ▲ ▲▲ ▲ ▲ 3.50 2 3 8▲ ▲ ▲ 1.33 4.00
37.0 ■ ■ 14.2 ● ● ▲▲ ▲ ▲ ▲ 1.71 2 2 7▲ ▲ 1.00 3.33
40.0 ■ 7.8 ● ● ▲▲ ▲▲ ▲ ▲ 2.66 1 2 8▲ ▲ 1.50 5.50
26.0 ■ ■ ● ● 2.0 ● ▲ ▲ ▲ ▲ 0.10 2 3 6▲ ▲ 1.33 3.33
(14-500) Twin CreekYear: 1986
84.5 ■ ■ ■ ■ ■ ■ ■ ■ ■ ■ 35.5 9.26 10 0 0 0.09 0.09
92.0 ■ ■ ■ ■ ■ ■ ■ ■ ■ 35.0 9.26 9 0 0 0.10 0.10
71.0 ■ ■ ■ ■ ■ ■ ■ ■ 31.7 ▲ ▲ 5.56 8 0 2 0.11 0.33
88.0 ■ ■ ■ ■ ■ ■ ■ ■ ■ 27.0 9.62 9 0 0 0.10 0.10
80.0 ■ ■ ■ ■ ■ ■ ■ ■ 26.7 8.55 8 0 1▲ 0.11 0.22
88.5 ■ ■ ■ ■ ■ ■ ■ ■ ■ ■ 23.9 13.70 10 0 0 0.09 0.09
90.5 ■ ■ ■ ■ ■ ■ ■ ■ ■ ■ 19.2 8.00 10 0 0 0.09 0.09
89.5 ■ ■ ■ ■ ■ ■ ■ ■ ■ ■ 18.3 8.00 10 0 0 0.09 0.09
73.0 ■ ■ ■ ■ ■ ■ ■ ■ ■ 16.9 ● 5.21 9 1 0 0.20 0.20
90.5 ■ ■ ■ ■ ■ ■ ■ ■ ■ ■ 9.8 4.93 10 0 0 0.09 0.09
73.5 ■ ■ ■ ■ ■ ■ 0.2 ▲ ▲ ▲13.16 6 0 4▲ 0.14 0.71
01/08/20 1

Measurable Parameters of Watershed Health: Habitat/UAA
Use Attainability Analysis I: AreCWA Goal Uses Attainable?U.S. EPA regulations allow lower than CWAgoal uses where precluded by:
Source: 40 CFR Part 131.10 (g)(1-6)
• naturally occuring pollutant levels;• natural flow conditions (i.e., ephemeral)**;• human-induced conditions which cannot be remediated;• hydrological modififcations (dams, diversions, channel
modifications) which cannot be operated in a mannerconsistent with the CWA goal use;
• natural physical features (substrate, flow, depth);• controls to attain use would cause widespread,
socioeconomic impacts.** - does not apply when flow is augmented by an.effluent discharge.
Use Attainability Analysis II: Processand Information Requirements**
• existing status of waterbody based on biocriteria;• habitat assessment to evaluate potential;• reasonable relationship between impaired state and
precluding activity based on assessment of multipleindicators used in appropriate roles;
• recommendation subject to WQS ruelmaking process• reviewable every three years - a "temporary"
designation.
Use attainability analysis requires the followinginformation and knowledge:
** - All data collection and analysis must conform to Ohio WQS andFive-Year Monitoring Strategy data and design quality objectives.
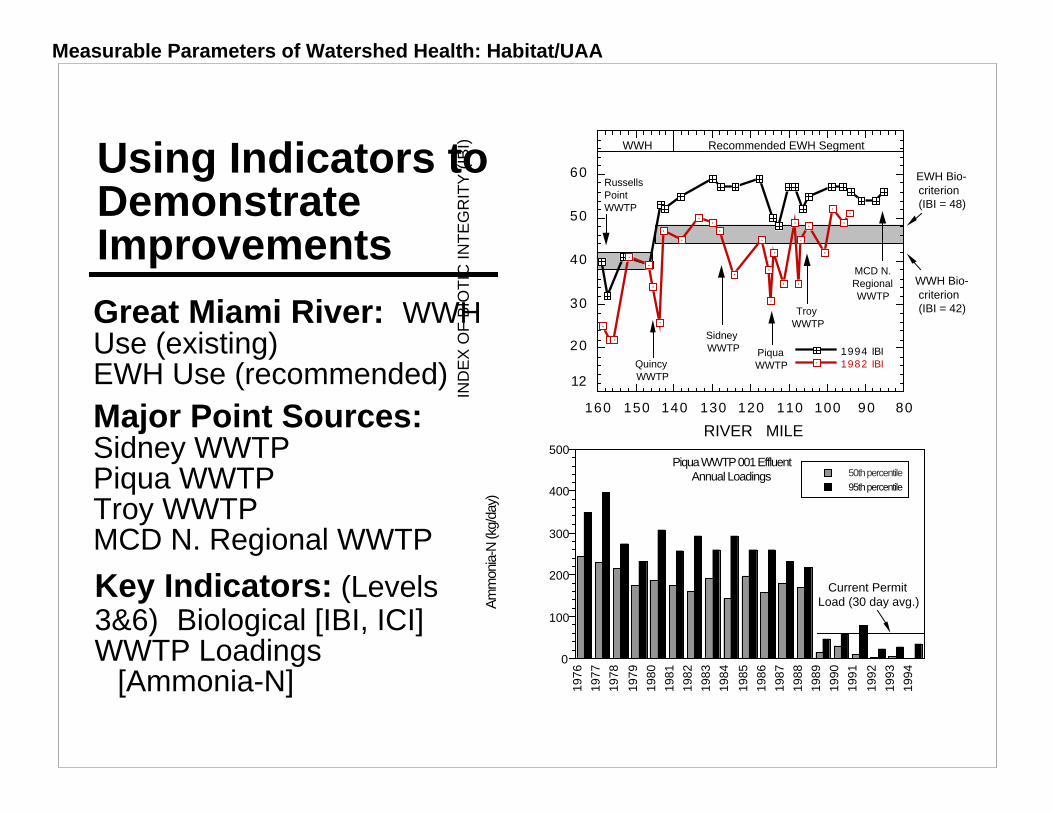
Measurable Parameters of Watershed Health: Habitat/UAA
Using Indicators toDemonstrateImprovements
Great Miami River: WWHUse (existing)EWH Use (recommended)
Major Point Sources:Sidney WWTPPiqua WWTPTroy WWTPMCD N. Regional WWTP
Key Indicators: (Levels3&6) Biological [IBI, ICI]WWTP Loadings
[Ammonia-N]
20
30
40
50
60
8090100110120130140150160
1994 IBI1982 IBI
IND
EX
OF
BIO
TIC
INT
EG
RIT
Y (
IBI)
RIVER MILE
WWH Bio-criterion (IBI = 42)
PiquaWWTPQuincy
WWTP
SidneyWWTP
MCD N.RegionalWWTP
12
Recommended EWH SegmentWWH
EWH Bio-criterion (IBI = 48)
RussellsPointWWTP
TroyWWTP
0
100
200
300
400
500Piqua WWTP 001 Effluent
Annual Loadings 50th percentile95th percentile
1976
1977
1978
1979
1980
1981
1982
1983
1984
1985
1986
1987
1988
1989
1990
1991
1992
1993
1994
Am
mon
ia-N
(kg/
day)
Current PermitLoad (30 day avg.)
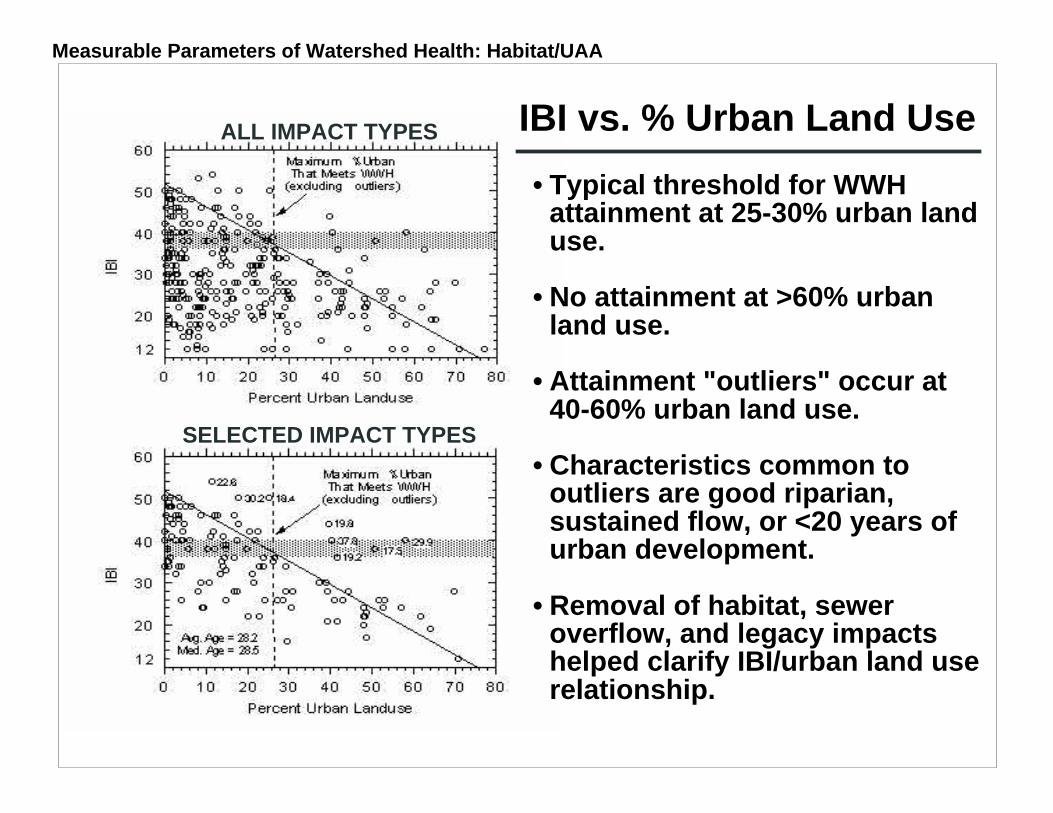
Measurable Parameters of Watershed Health: Habitat/UAA
ALL IMPACT TYPES
SELECTED IMPACT TYPES
IBI vs. % Urban Land Use
• Typical threshold for WWHattainment at 25-30% urban landuse.
• No attainment at >60% urbanland use.
• Attainment "outliers" occur at40-60% urban land use.
• Characteristics common tooutliers are good riparian,sustained flow, or <20 years ofurban development.
• Removal of habitat, seweroverflow, and legacy impactshelped clarify IBI/urban land userelationship.

Measurable Parameters of Watershed Health: Habitat/UAA
Using Biocriteria toAssess Small UrbanStreams in Ohio
•Data from statewide OhioEPA database at urbanand suburban sites <100mi2 drainage area.
•No more than 35-40% ofsites in any majormunicipal area attained theWWH IBI criterion.
•The additive effect ofmultiple stressors in urbanwatersheds was evident inconsistently lower IBIscores.

Measurable Parameters of Watershed Health: Habitat/UAA
0
10
20
30
40
501
2-1
5
16
-19
20
-23
24
-27
28
-31
32
-35
36
-39
40
-43
44
-47
48
-51
52
-55
56
-60
QHEI > 60QHEI 46-60QHEI < 46
IBI INTERVALS
FR
EQ
UE
NC
Y (%
)
WWH EWHMWH
HABITAT THRESHOLDS FOR DESIGNATEDUSE ATTAINMENT
Habitat Attributes of Warmwater andModified Streams
Warmwater Streams Modified Streams
Source: The Qualitative Habitat Evaluation Index (Rankin 1989)
1. No channel mod./recovered Recent channel mod./recovered2. Boulder/cobble/gravel substrtates Silt/muck Substrates3. Silt Free or Silt Normal Heavy/moderate Silt Covering4. Good/Excellent Development Fair/Poor Development5. Moderate/High Sinuosity Low/No Sinuosity6. Extensive/moderate Cover Only 1-2 Cover Types7. Fast Current w/Eddies No Fast Current8. Low/Normal Embeddedness High Embeddedness9. Maximum Depth >40 cm Maximum Depth <40 cm10. Intermittent/interstitial Flow
RA
TIO
OF
MO
DIF
IED
:WA
RM
-W
AT
ER
HA
BIT
AT
AT
TR
IBU
TE
S
N = 666 Sites
0
2
4
6
8
10
12
14
16
12-19 20-29 30-39 40-49 50-60
IBI Range
EXCEPT.GOODFAIRPOORVERY POOR
Influence of Modified Habitat Attributes onthe IBI and Biological Integrity

Sustainable Watershed Planning
Measurable Parameters of Ecosystem Health:Program Management Concepts
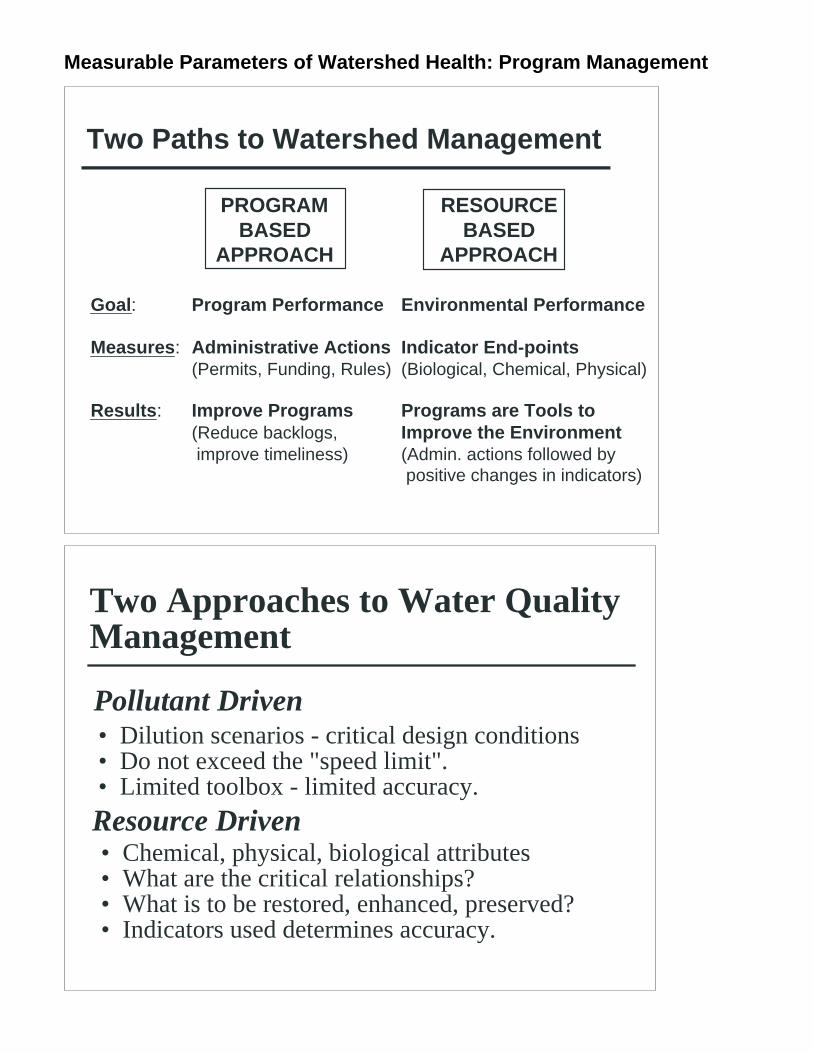
Measurable Parameters of Watershed Health: Program Management
PROGRAMBASED
APPROACH
Two Paths to Watershed Management
RESOURCEBASED
APPROACH
Goal: Program Performance Environmental Performance
Measures: Administrative Actions Indicator End-points(Permits, Funding, Rules) (Biological, Chemical, Physical)
Results: Improve Programs Programs are Tools to(Reduce backlogs, Improve the Environment improve timeliness) (Admin. actions followed by
positive changes in indicators)
Two Approaches to Water QualityManagement
• Dilution scenarios - critical design conditions• Do not exceed the "speed limit".• Limited toolbox - limited accuracy.
Pollutant Driven
• Chemical, physical, biological attributes• What are the critical relationships?• What is to be restored, enhanced, preserved?• Indicators used determines accuracy.
Resource Driven

Measurable Parameters of Watershed Health: Program Management
TMDL: CWA Section 303[d]
• PS Pollutants + NPS Pollutants + Safety Margin = TMDL
Total Maximum Daily Loads (TMDL)"Letter of the Law"
Pollutant Focused Approach
•Restoration of impaired waters based on attainment ofdesignated uses
Resource Focused Approach
"Spirit of the Law"
Essential Technical Elements of aWatershed Approach
Three major classes of environmental indicators:
• Stressor Indicators (e.g., loadings, land use, habitat)• Exposure Indicators (e.g., chemical-specific,
biomarkers, toxicity)• Response Indicators (e.g., biological community
condition)Landscape partitioning framework:
• Ecoregions and/or subecoregions (other thanhydrologic units).

Measurable Parameters of Watershed Health: Program Management
Essential Technical Elements of aWatershed Approach
Three major classes of environmental indicators:
• Stressor Indicators (e.g., loadings, land use, habitat)• Exposure Indicators (e.g., chemical-specific,
biomarkers, toxicity)• Response Indicators (e.g., biological community
condition)Landscape partitioning framework:
• Ecoregions and/or subecoregions (other thanhydrologic units).
What Biocriteria Can Bring toWatershed Management
• Watershed Approach to Monitoring, Assessment,and Management
• Integrated Point, Nonpoint, and Habitat Assessmentand Management
• Cumulative Effects• Biodiversity Concerns• Interdisciplinary Focus• Sound Science
Incorporating Biocriteria Can Result in theFollowing:

Measureable Paraneters of Watershed Health: Introduction & Concepts
The Role of Biological Assessments andCriteria in the TMDL Process: I
Biocriteria and allied tools serve the followingfunctions in the 303d process:• as a principal arbiter of attainment status (303d listing).• key tool for determining the appropriate designated use.• biological data provides information to describe causes
and sources of impairments.• key effectiveness end-point for assessment of TMDL
implementation.• important vector for development of "new" criteria for
TMDL modeling outputs.
The Role of Biological Assessments andCriteria in the TMDL Process: IIUsing Biocriteria Indices as an end-point for TMDLdevelopment can:• incorporate the cumulative effect of all chemical,
physical, and biological stressors in a watershed asopposed to a focus on individual pollutants alone.
• appropriately integrate factors that influence the fate ofpollutants (e.g., habitat and nutrients).
• provide a more direct link between the TMDL processand attainment of designated uses.