measuring the size and scope of the voluntary and
TRANSCRIPT
Measuring the size and scope of the voluntary and community sector in
Liverpool
Gerwyn Jones & Richard Meegan European Institute for Urban Affairs
Liverpool John Moores University
On behalf of
July 2015
Measuring the size and scope of the voluntary and community sector in the Liverpool City Region
2
Contents
Section Page
About the Research Team 3
1 Executive Summary 4
2 Introduction 6
Aims of the research 6
Methodology and structure of report 6
3 The size and scope of the voluntary and community sector in Liverpool 9
Total number of voluntary sector organisations 9
Voluntary sector employment 11
Income 12
The economic contribution of volunteers 13
Economic contribution of the VCS – GVA 14
What does the voluntary sector do? 16
5 Conclusion: Liverpool VCS punching above its weight in the City Region 22
References 23
Appendices 24
Measuring the size and scope of the voluntary and community sector in the Liverpool City Region
3
The Research Team
Gerwyn Jones is a Senior Research Fellow at the European Institute for Urban Affairs. He has a PhD in Geography from
Liverpool University. He has worked in the urban and social policy field as a researcher for over 10 years, undertaking
work for UK Government, the Economic and Social Research Council and European Commission. Recently he has been
involved in researching the impact of recession and austerity on the voluntary sector as part of a wider ESRC funded
project looking at recession and austerity in the cities of Bristol and Liverpool.
Richard Meegan is Professor of Economic Geography at the European Institute for Urban Affairs, Liverpool John
Moores University. His research has ranged across urban and regional development, labour market change and the
impact of economic restructuring and has been funded by central and local government, overseas planning and
government agencies and a variety of research councils and foundations. He has also undertaken a substantial body
of evaluation research for the European Commission and UK Government.
The European Institute for Urban Affairs is a research and consultancy group within Liverpool John Moores University
with an international reputation for its work on urban and regional policy research and evaluation. It has conducted
work for a wide range of prestigious clients including the European Commission, Government departments,
Government Regional Offices, English Partnerships, Regional Development Agencies, local authorities, regeneration
partnerships, the Economic and Social Research Council, Joseph Rowntree Foundation, voluntary organisations and
the private sector. It has completed many influential reports over the past decade, such as the State of the English
Cities Report for ODPM and Second Tier Cities in Europe for ESPON.
Measuring the size and scope of the voluntary and community sector in the Liverpool City Region
4
1. Executive Summary
1.1 Using secondary data and literature sources, the aim of this review is to answer the following questions in
relation to the city of Liverpool’s voluntary and community sector (VCS): How many VCS organisations are there?
How many people are employed in the sector?
What economic contribution does the sector make?
What is the range of the sectors activities?
How does the size and shape of the VCS in Liverpool compare to other local authorities in the Liverpool
City Region?
How many voluntary sector organisations are there in Liverpool?
1.2 We estimate that there are 3,055 voluntary sector organisations (VSOs) based in the city of Liverpool, a total
made up of 1,332 registered and some 1,723 ‘below the radar’ organisations.
How many people are employed in the sector?
1.3 We estimate a figure of 10,390 full-time equivalent (FTE) employees working in the sector in Liverpool, with
an average of 7.8 employees per registered VSO.
What economic contribution does the sector make?
1.4 We estimate that Liverpool’s VCS has a Gross Value Added (GVA) of £394m, or 4% of the cities total GVA.
What is the economic contribution of volunteering?
1.5 We estimate that volunteering in Liverpool has a GVA of £171.5m. Combining the GVA of both volunteers and
paid employees we can estimate that the sector as a whole has a GVA of £565.5m, comparable to both the
Construction and Information & Communication sectors in Liverpool.
What roles do VCS organisations undertake?
1.6 The VCS plays a vital role in ensuring services are delivered to the parts of society where the private and public
sectors cannot or will not reach. Compared to the national average, Liverpool has proportionally more
organisations working in the following: capacity building, health, equalities, environment, training, economic
well-being, culture, cohesion/civic participation and community development. Compared to the national
pattern, Liverpool also has proportionally more voluntary sector organisations fulfilling the following roles:
the delivery of public services – 37% of organisations
community development and mutual aid – 37% of organisations
delivery of ‘other’ services – 35% of organisations
advice to individuals – 32% of organisations
Measuring the size and scope of the voluntary and community sector in the Liverpool City Region
5
advocacy, campaigning, representation, information and research – 25% of organisations
emotional support – 23% of organisations
help people to access services and benefits – 21% of organisations
advancing cultural awareness – 21% of organisations
providing staff and volunteering – 20% of organisations
capacity building – 20% of organisations
How does the size and shape of the VCS in Liverpool compare to other local
authorities in the City Region?
1.7 Liverpool has twice the number of VCS registered organisations (1,332) than the Wirral (677), the next best
performing LA in the City Region.
1.8 Liverpool has 43% of the total voluntary sector workforce in the City Region, nearly twice the proportion of
the Wirral (22%), the second best performing LA. Similarly, Liverpool has a 43% share of the VCS total GVA
across the City Region, again nearly twice that of the Wirral’s share (22%).
1.9 Liverpool performs strongly when comparing its VCS percentage share of GVA (43%) with its percentage share
of the City Region’s total population (31%). The Wirral is the only other LA that has a VCS with a GVA
percentage share outperforming its population share, but only by 1 percentage point.
Measuring the size and scope of the voluntary and community sector in the Liverpool City Region
6
2. INTRODUCTION
Aims of the research
2.1 The aim of this review is to measure the size and scope of the voluntary and community sector (VCS) in
Liverpool. Using secondary data and literature sources, it attempts to answer the following questions:
How many VCS organisations are there in Liverpool?
How many people are employed and work as volunteers in the sector?
What economic contribution does the sector make?
What is the range of sector activities?
Methodology and structure of report
What are we measuring - defining the voluntary and community sector?
2.2 We take the voluntary and community sector to denote the organisations that broadly operate between the
market and the state and that are covered by terms such as ‘Third Sector’, favoured by the previous New
Labour Government or ‘Civil Society’ as promoted by the current Coalition Government. Underlying these
catch-all descriptions, however, is a diversity of institutions and activity that makes measuring the sector a
difficult practical challenge. The ‘sector’ encompasses a number of overlapping ‘sub-sectors’ including:
registered – and unregistered – charities – the charity sector (which includes the large organisations
operating locally and nationally (like, for example, Barnardo’s, the Royal National School for the Blind and
Age Concern);
more informal, generally relatively small, community groups and self-help initiatives – the community
sector;
not-for-profit organisations – the non-profit sector – using surpluses for the benefit of targeted
beneficiaries including housing associations providing social housing on a non-profit basis (major social
housing providers in Liverpool);
religious institutions - the faith sector (like Faiths 4 Change, St Andrew’s Community Network, and
Churches Together on Merseyside);
the social enterprise sector – that generates income from its socially-targeted activities (like Bulky Bob’s,
one of the city-region’s Social Enterprise Network of over 300 social enterprises);
the cooperatives and mutual sector – including Industrial provident Societies, consumer and worker
cooperatives, cooperative consortiums, agricultural cooperatives and housing cooperatives (like the
Eldonians).
2.3 The main source of statistics for the sector is the National Council for Voluntary Organisations and its annual
flagship publication, The UK Civil Society Almanac, which brings together information from the Charity
Commission’s database, the Labour Force Survey, the Office for National Statistics and other sources (UK
Statistics Authority, 2012).
Measuring the size and scope of the voluntary and community sector in the Liverpool City Region
7
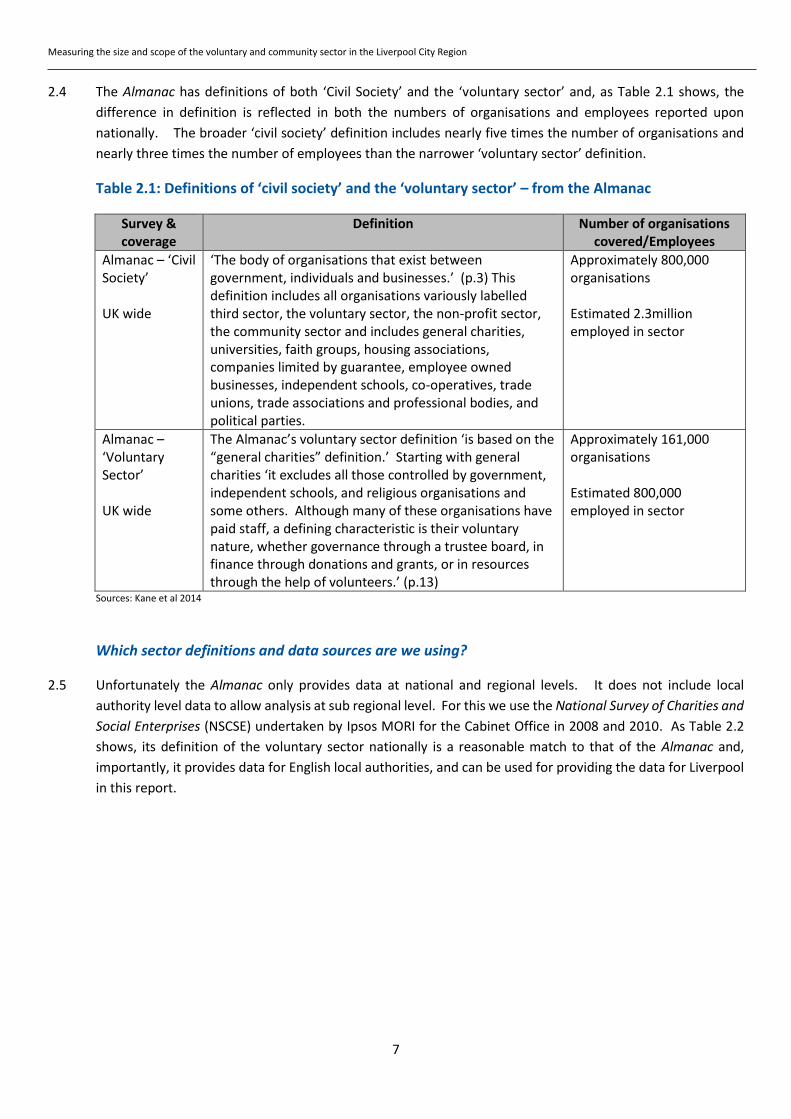
2.4 The Almanac has definitions of both ‘Civil Society’ and the ‘voluntary sector’ and, as Table 2.1 shows, the
difference in definition is reflected in both the numbers of organisations and employees reported upon
nationally. The broader ‘civil society’ definition includes nearly five times the number of organisations and
nearly three times the number of employees than the narrower ‘voluntary sector’ definition.
Table 2.1: Definitions of ‘civil society’ and the ‘voluntary sector’ – from the Almanac
Survey & coverage
Definition Number of organisations covered/Employees
Almanac – ‘Civil Society’ UK wide
‘The body of organisations that exist between government, individuals and businesses.’ (p.3) This definition includes all organisations variously labelled third sector, the voluntary sector, the non-profit sector, the community sector and includes general charities, universities, faith groups, housing associations, companies limited by guarantee, employee owned businesses, independent schools, co-operatives, trade unions, trade associations and professional bodies, and political parties.
Approximately 800,000 organisations Estimated 2.3million employed in sector
Almanac – ‘Voluntary Sector’ UK wide
The Almanac’s voluntary sector definition ‘is based on the “general charities” definition.’ Starting with general charities ‘it excludes all those controlled by government, independent schools, and religious organisations and some others. Although many of these organisations have paid staff, a defining characteristic is their voluntary nature, whether governance through a trustee board, in finance through donations and grants, or in resources through the help of volunteers.’ (p.13)
Approximately 161,000 organisations Estimated 800,000 employed in sector
Sources: Kane et al 2014
Which sector definitions and data sources are we using?
2.5 Unfortunately the Almanac only provides data at national and regional levels. It does not include local
authority level data to allow analysis at sub regional level. For this we use the National Survey of Charities and
Social Enterprises (NSCSE) undertaken by Ipsos MORI for the Cabinet Office in 2008 and 2010. As Table 2.2
shows, its definition of the voluntary sector nationally is a reasonable match to that of the Almanac and,
importantly, it provides data for English local authorities, and can be used for providing the data for Liverpool
in this report.
Measuring the size and scope of the voluntary and community sector in the Liverpool City Region
8
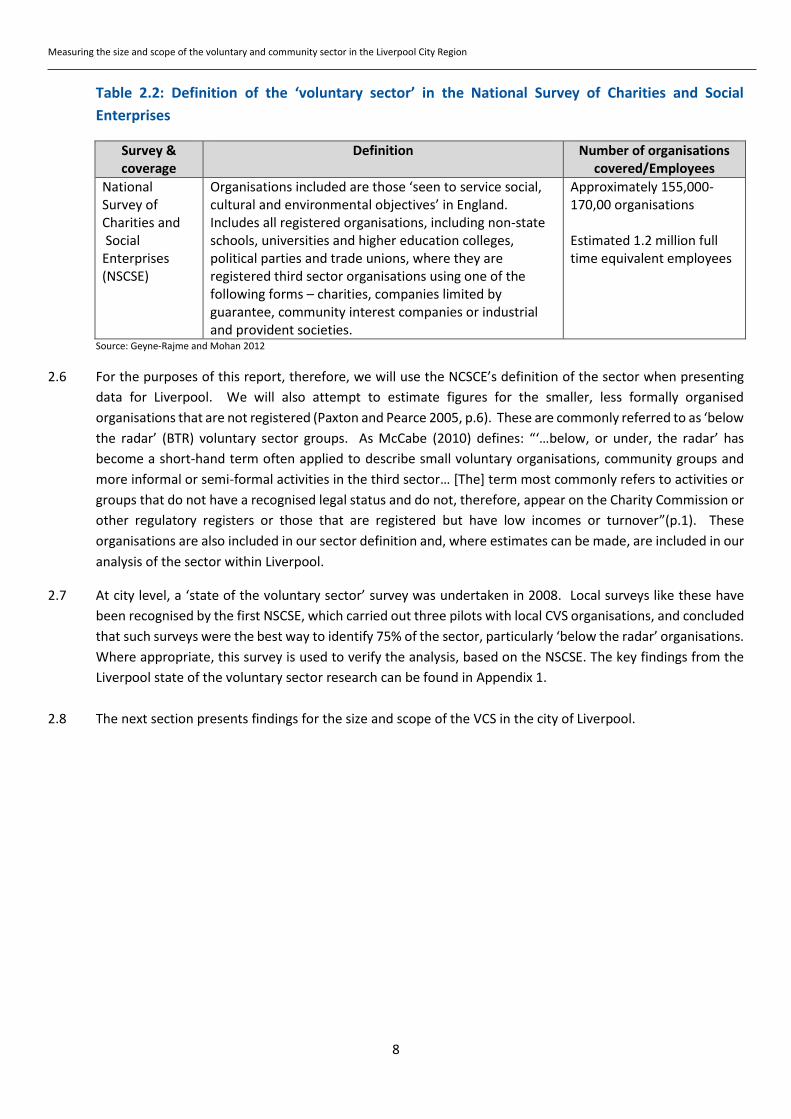
Table 2.2: Definition of the ‘voluntary sector’ in the National Survey of Charities and Social
Enterprises
Survey & coverage
Definition Number of organisations covered/Employees
National Survey of Charities and Social Enterprises (NSCSE)
Organisations included are those ‘seen to service social, cultural and environmental objectives’ in England. Includes all registered organisations, including non-state schools, universities and higher education colleges, political parties and trade unions, where they are registered third sector organisations using one of the following forms – charities, companies limited by guarantee, community interest companies or industrial and provident societies.
Approximately 155,000-170,00 organisations Estimated 1.2 million full time equivalent employees
Source: Geyne-Rajme and Mohan 2012
2.6 For the purposes of this report, therefore, we will use the NCSCE’s definition of the sector when presenting
data for Liverpool. We will also attempt to estimate figures for the smaller, less formally organised
organisations that are not registered (Paxton and Pearce 2005, p.6). These are commonly referred to as ‘below
the radar’ (BTR) voluntary sector groups. As McCabe (2010) defines: “‘…below, or under, the radar’ has
become a short-hand term often applied to describe small voluntary organisations, community groups and
more informal or semi-formal activities in the third sector… [The] term most commonly refers to activities or
groups that do not have a recognised legal status and do not, therefore, appear on the Charity Commission or
other regulatory registers or those that are registered but have low incomes or turnover”(p.1). These
organisations are also included in our sector definition and, where estimates can be made, are included in our
analysis of the sector within Liverpool.
2.7 At city level, a ‘state of the voluntary sector’ survey was undertaken in 2008. Local surveys like these have
been recognised by the first NSCSE, which carried out three pilots with local CVS organisations, and concluded
that such surveys were the best way to identify 75% of the sector, particularly ‘below the radar’ organisations.
Where appropriate, this survey is used to verify the analysis, based on the NSCSE. The key findings from the
Liverpool state of the voluntary sector research can be found in Appendix 1.
2.8 The next section presents findings for the size and scope of the VCS in the city of Liverpool.
Measuring the size and scope of the voluntary and community sector in the Liverpool City Region
9
3. THE SIZE AND SCOPE OF THE VCS IN LIVERPOOL
Total number of voluntary sector organisations
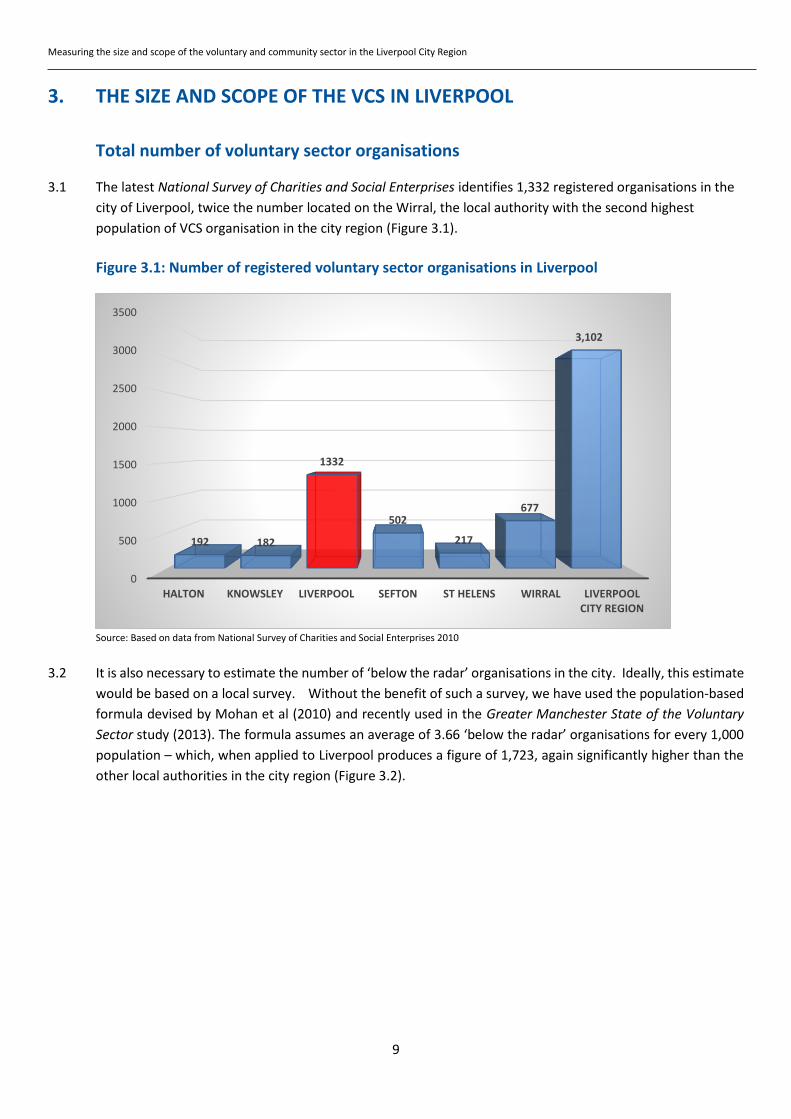
3.1 The latest National Survey of Charities and Social Enterprises identifies 1,332 registered organisations in the
city of Liverpool, twice the number located on the Wirral, the local authority with the second highest
population of VCS organisation in the city region (Figure 3.1).
Figure 3.1: Number of registered voluntary sector organisations in Liverpool
Source: Based on data from National Survey of Charities and Social Enterprises 2010
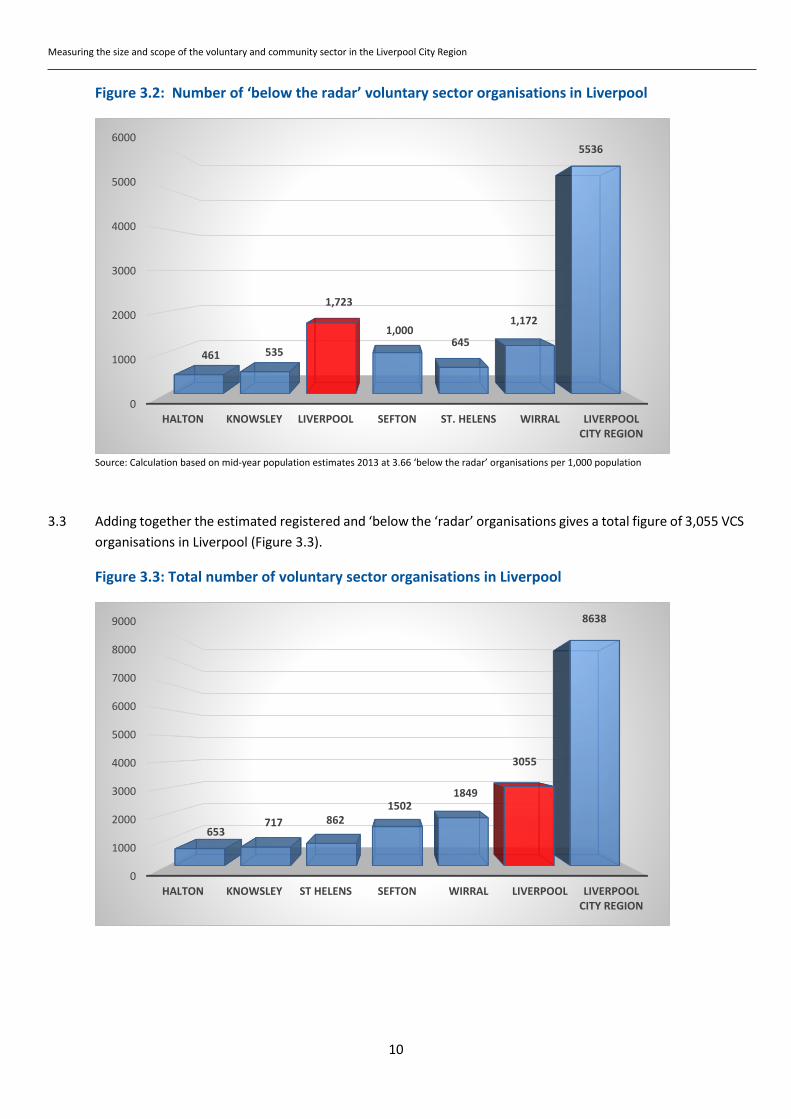
3.2 It is also necessary to estimate the number of ‘below the radar’ organisations in the city. Ideally, this estimate
would be based on a local survey. Without the benefit of such a survey, we have used the population-based
formula devised by Mohan et al (2010) and recently used in the Greater Manchester State of the Voluntary
Sector study (2013). The formula assumes an average of 3.66 ‘below the radar’ organisations for every 1,000
population – which, when applied to Liverpool produces a figure of 1,723, again significantly higher than the
other local authorities in the city region (Figure 3.2).
0
500
1000
1500
2000
2500
3000
3500
HALTON KNOWSLEY LIVERPOOL SEFTON ST HELENS WIRRAL LIVERPOOL CITY REGION
192 182
1332
502
217
677
3,102
Measuring the size and scope of the voluntary and community sector in the Liverpool City Region
10
Figure 3.2: Number of ‘below the radar’ voluntary sector organisations in Liverpool
Source: Calculation based on mid-year population estimates 2013 at 3.66 ‘below the radar’ organisations per 1,000 population
3.3 Adding together the estimated registered and ‘below the ‘radar’ organisations gives a total figure of 3,055 VCS
organisations in Liverpool (Figure 3.3).
Figure 3.3: Total number of voluntary sector organisations in Liverpool
0
1000
2000
3000
4000
5000
6000
HALTON KNOWSLEY LIVERPOOL SEFTON ST. HELENS WIRRAL LIVERPOOL CITY REGION
461 535
1,723
1,000645
1,172
5536
0
1000
2000
3000
4000
5000
6000
7000
8000
9000
HALTON KNOWSLEY ST HELENS SEFTON WIRRAL LIVERPOOL LIVERPOOL CITY REGION
653717 862
15021849
3055
8638
Measuring the size and scope of the voluntary and community sector in the Liverpool City Region
11
Voluntary sector employment
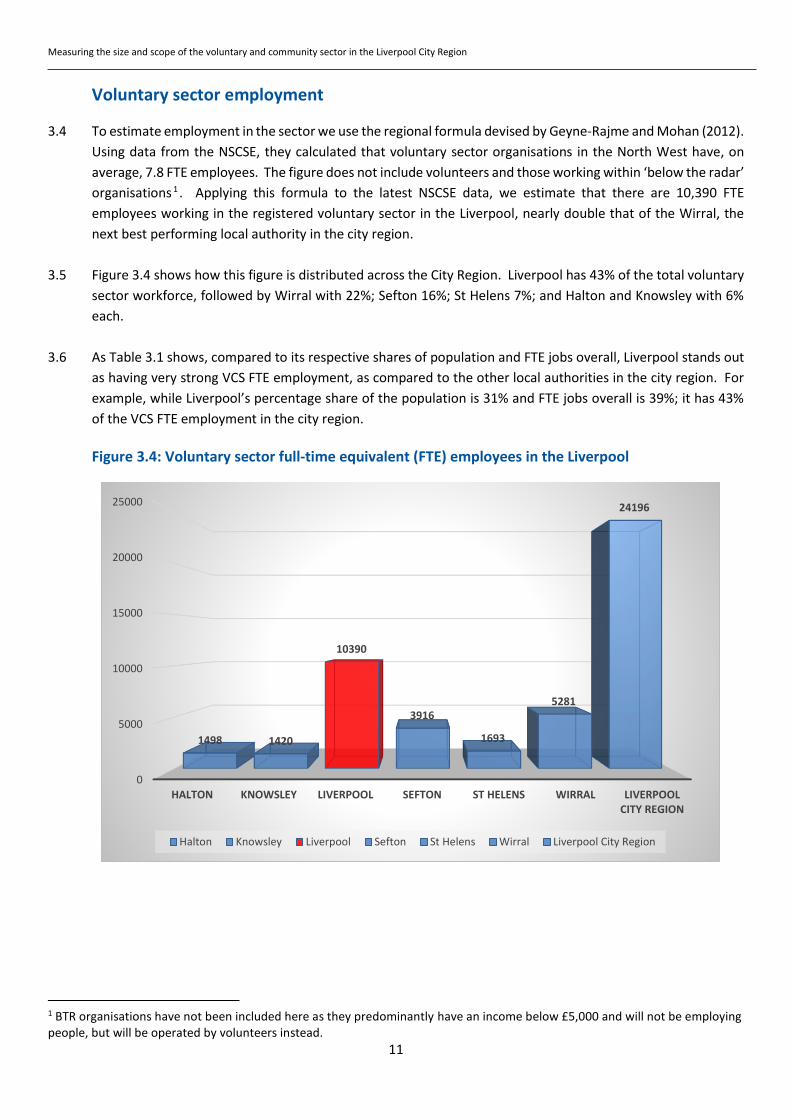
3.4 To estimate employment in the sector we use the regional formula devised by Geyne-Rajme and Mohan (2012).
Using data from the NSCSE, they calculated that voluntary sector organisations in the North West have, on
average, 7.8 FTE employees. The figure does not include volunteers and those working within ‘below the radar’
organisations 1 . Applying this formula to the latest NSCSE data, we estimate that there are 10,390 FTE
employees working in the registered voluntary sector in the Liverpool, nearly double that of the Wirral, the
next best performing local authority in the city region.
3.5 Figure 3.4 shows how this figure is distributed across the City Region. Liverpool has 43% of the total voluntary
sector workforce, followed by Wirral with 22%; Sefton 16%; St Helens 7%; and Halton and Knowsley with 6%
each.
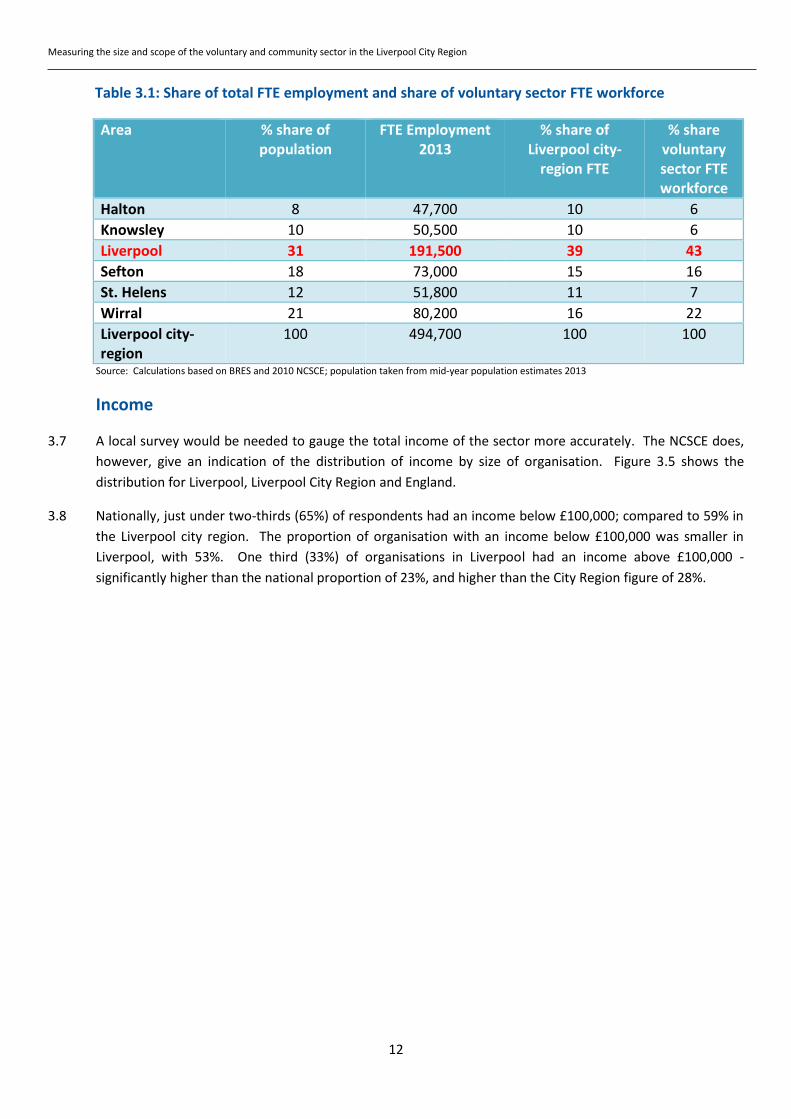
3.6 As Table 3.1 shows, compared to its respective shares of population and FTE jobs overall, Liverpool stands out
as having very strong VCS FTE employment, as compared to the other local authorities in the city region. For
example, while Liverpool’s percentage share of the population is 31% and FTE jobs overall is 39%; it has 43%
of the VCS FTE employment in the city region.
Figure 3.4: Voluntary sector full-time equivalent (FTE) employees in the Liverpool
1 BTR organisations have not been included here as they predominantly have an income below £5,000 and will not be employing people, but will be operated by volunteers instead.
0
5000
10000
15000
20000
25000
HALTON KNOWSLEY LIVERPOOL SEFTON ST HELENS WIRRAL LIVERPOOL CITY REGION
1498 1420
10390
3916
1693
5281
24196
Halton Knowsley Liverpool Sefton St Helens Wirral Liverpool City Region
Measuring the size and scope of the voluntary and community sector in the Liverpool City Region
12
Table 3.1: Share of total FTE employment and share of voluntary sector FTE workforce
Area % share of population
FTE Employment 2013
% share of Liverpool city-
region FTE
% share voluntary sector FTE workforce
Halton 8 47,700 10 6
Knowsley 10 50,500 10 6
Liverpool 31 191,500 39 43
Sefton 18 73,000 15 16
St. Helens 12 51,800 11 7
Wirral 21 80,200 16 22
Liverpool city-region
100 494,700 100 100
Source: Calculations based on BRES and 2010 NCSCE; population taken from mid-year population estimates 2013
Income
3.7 A local survey would be needed to gauge the total income of the sector more accurately. The NCSCE does,
however, give an indication of the distribution of income by size of organisation. Figure 3.5 shows the
distribution for Liverpool, Liverpool City Region and England.
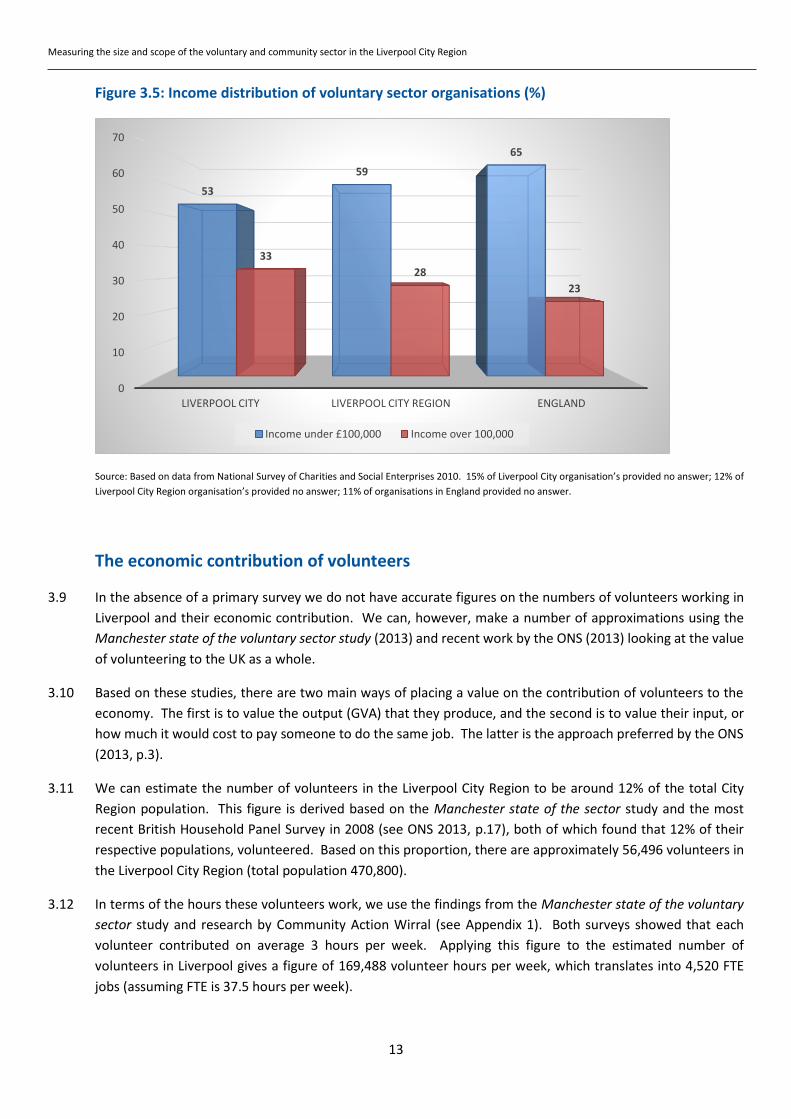
3.8 Nationally, just under two-thirds (65%) of respondents had an income below £100,000; compared to 59% in
the Liverpool city region. The proportion of organisation with an income below £100,000 was smaller in
Liverpool, with 53%. One third (33%) of organisations in Liverpool had an income above £100,000 -
significantly higher than the national proportion of 23%, and higher than the City Region figure of 28%.
Measuring the size and scope of the voluntary and community sector in the Liverpool City Region
13
Figure 3.5: Income distribution of voluntary sector organisations (%)
Source: Based on data from National Survey of Charities and Social Enterprises 2010. 15% of Liverpool City organisation’s provided no answer; 12% of
Liverpool City Region organisation’s provided no answer; 11% of organisations in England provided no answer.
The economic contribution of volunteers
3.9 In the absence of a primary survey we do not have accurate figures on the numbers of volunteers working in
Liverpool and their economic contribution. We can, however, make a number of approximations using the
Manchester state of the voluntary sector study (2013) and recent work by the ONS (2013) looking at the value
of volunteering to the UK as a whole.
3.10 Based on these studies, there are two main ways of placing a value on the contribution of volunteers to the
economy. The first is to value the output (GVA) that they produce, and the second is to value their input, or
how much it would cost to pay someone to do the same job. The latter is the approach preferred by the ONS
(2013, p.3).
3.11 We can estimate the number of volunteers in the Liverpool City Region to be around 12% of the total City
Region population. This figure is derived based on the Manchester state of the sector study and the most
recent British Household Panel Survey in 2008 (see ONS 2013, p.17), both of which found that 12% of their
respective populations, volunteered. Based on this proportion, there are approximately 56,496 volunteers in
the Liverpool City Region (total population 470,800).
3.12 In terms of the hours these volunteers work, we use the findings from the Manchester state of the voluntary
sector study and research by Community Action Wirral (see Appendix 1). Both surveys showed that each
volunteer contributed on average 3 hours per week. Applying this figure to the estimated number of
volunteers in Liverpool gives a figure of 169,488 volunteer hours per week, which translates into 4,520 FTE
jobs (assuming FTE is 37.5 hours per week).
0
10
20
30
40
50
60
70
LIVERPOOL CITY LIVERPOOL CITY REGION ENGLAND
53
59
65
33
28
23
Income under £100,000 Income over 100,000
Measuring the size and scope of the voluntary and community sector in the Liverpool City Region
14
3.13 Using the above figures we can place an economic output value of volunteers to Liverpool, by multiplying the
number of FTE volunteers by the GVA per employee figures for the Liverpool City Region averaged across three
public sectors: public administration and defence, educations and health and social work. On this basis, we
estimate that the economic contribution of volunteering to the Liverpool economy stands at some £171.5m
per annum.
Economic contribution of the VCS – GVA2
3.14 To estimate GVA we have adapted the methodology used in the Manchester State of the Voluntary Sector
study (2013). That study estimated city-regional GVA by applying North West regional average GVA per
employee data. Our estimate is based, instead, on GVA per employee figures for Liverpool City Region
averaged across three public sectors: public administration and defence, education and health and social work.
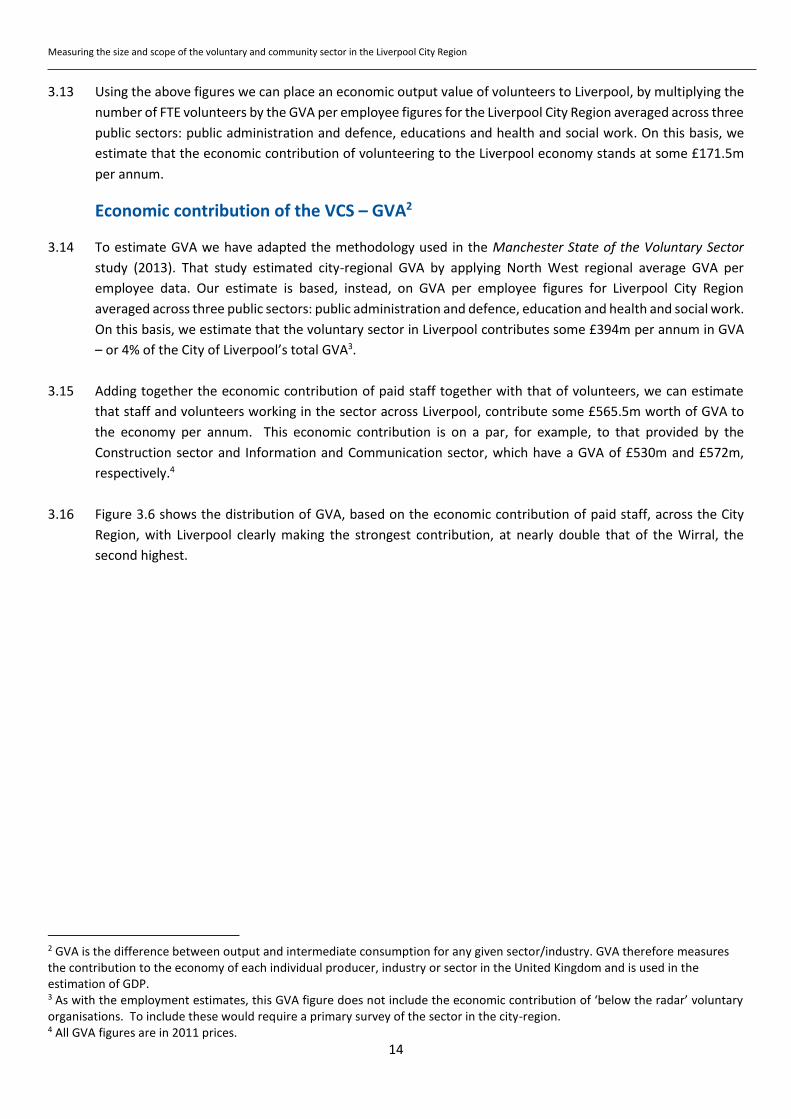
On this basis, we estimate that the voluntary sector in Liverpool contributes some £394m per annum in GVA
– or 4% of the City of Liverpool’s total GVA3.
3.15 Adding together the economic contribution of paid staff together with that of volunteers, we can estimate
that staff and volunteers working in the sector across Liverpool, contribute some £565.5m worth of GVA to
the economy per annum. This economic contribution is on a par, for example, to that provided by the
Construction sector and Information and Communication sector, which have a GVA of £530m and £572m,
respectively.4
3.16 Figure 3.6 shows the distribution of GVA, based on the economic contribution of paid staff, across the City
Region, with Liverpool clearly making the strongest contribution, at nearly double that of the Wirral, the
second highest.
2 GVA is the difference between output and intermediate consumption for any given sector/industry. GVA therefore measures the contribution to the economy of each individual producer, industry or sector in the United Kingdom and is used in the estimation of GDP. 3 As with the employment estimates, this GVA figure does not include the economic contribution of ‘below the radar’ voluntary organisations. To include these would require a primary survey of the sector in the city-region. 4 All GVA figures are in 2011 prices.
Measuring the size and scope of the voluntary and community sector in the Liverpool City Region
15
Figure 3.6: VCS Total GVA (£m), Liverpool
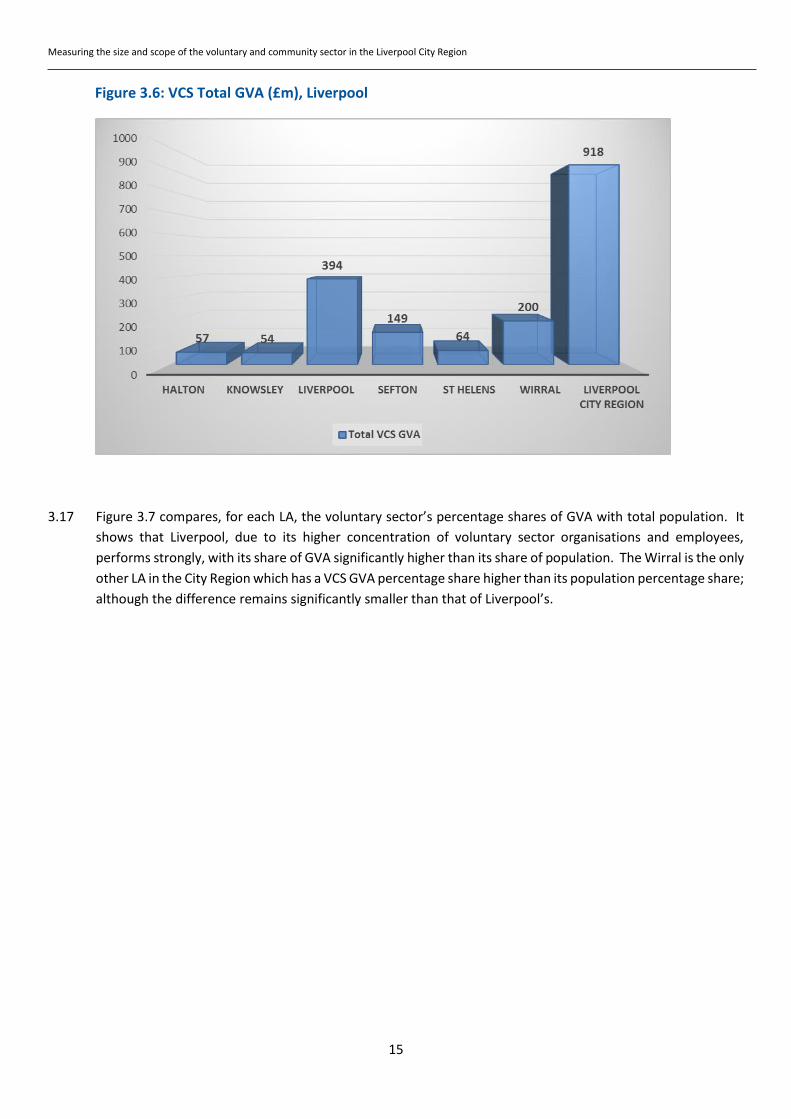
3.17 Figure 3.7 compares, for each LA, the voluntary sector’s percentage shares of GVA with total population. It
shows that Liverpool, due to its higher concentration of voluntary sector organisations and employees,
performs strongly, with its share of GVA significantly higher than its share of population. The Wirral is the only
other LA in the City Region which has a VCS GVA percentage share higher than its population percentage share;
although the difference remains significantly smaller than that of Liverpool’s.
Measuring the size and scope of the voluntary and community sector in the Liverpool City Region
16
Figure 3.7: % share of total population and % share VCS GVA
Source: Population take from 2013 mid-year population estimates, Nomis
What does the VCS do?
Main areas of work
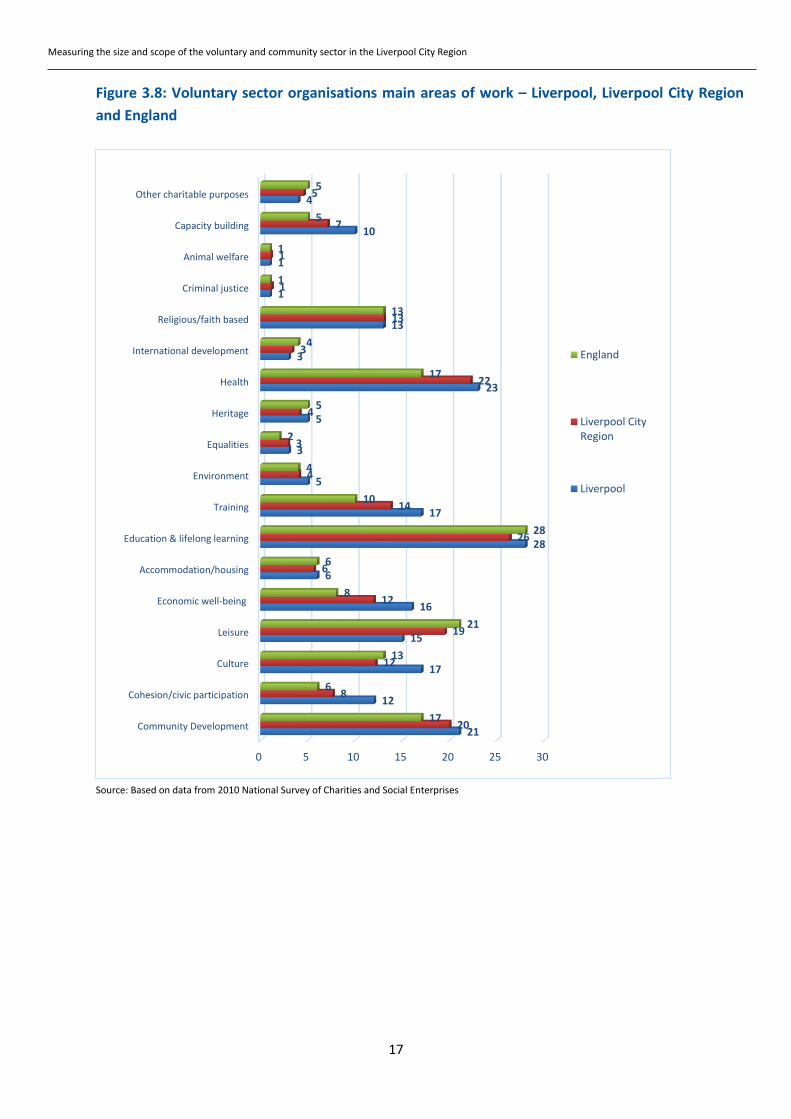
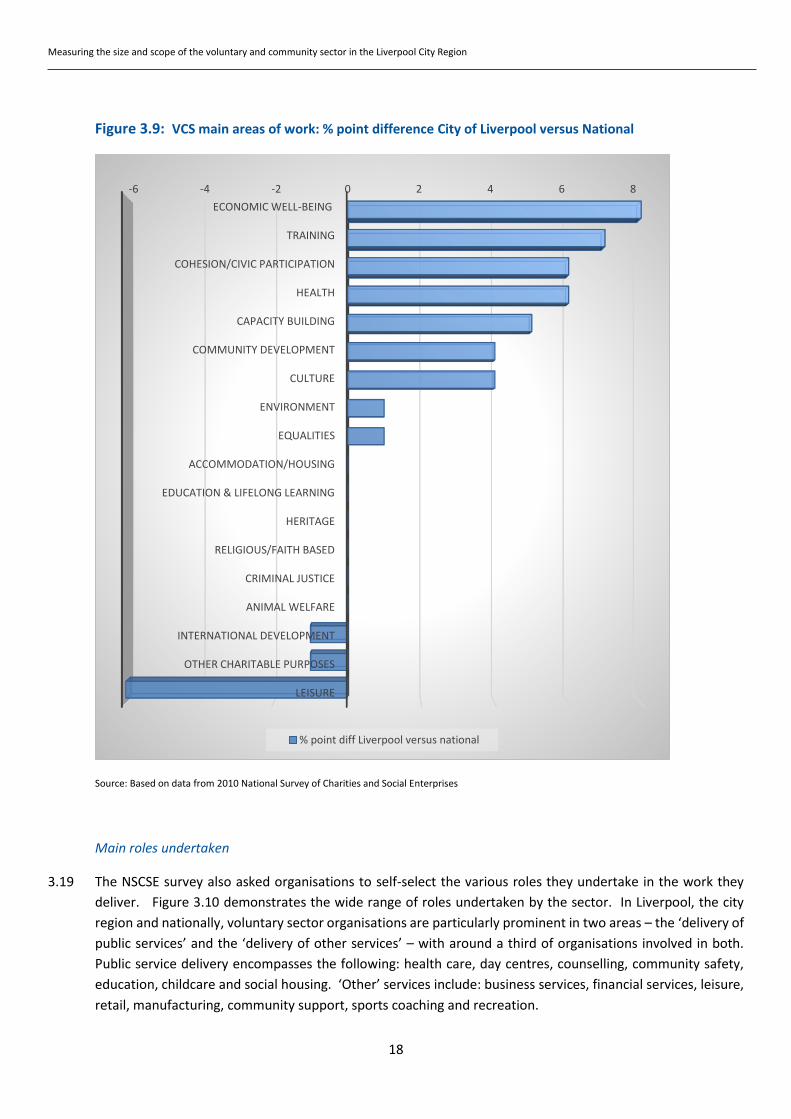
3.18 As part of the NSCSE organisations were asked to identify the main broad areas in which they work. The
findings from the 2010 survey suggest that the Liverpool has proportionally more voluntary organisations
working in the following areas compared to national: capacity building, health, equalities, environment,
training, economic well-being, culture, cohesion/civic participation and community development (Figures 3.8
and 3.9). Compared to the Liverpool City-Region as a whole, it has proportionally more organisations involved
in the following areas: capacity building, health, heritage, environment, training, education and life-long
learning, economic well-being, culture, cohesion/civic participation and community development (Figure 3.8)
0 10 20 30 40 50
Halton
Knowsley
Liverpool
Sefton
St. Helens
Wirral
8
10
31
18
12
21
6
6
43
16
7
22
% share VCS GVA
% share of population
Measuring the size and scope of the voluntary and community sector in the Liverpool City Region
17
Figure 3.8: Voluntary sector organisations main areas of work – Liverpool, Liverpool City Region
and England
Source: Based on data from 2010 National Survey of Charities and Social Enterprises
0 5 10 15 20 25 30
Community Development
Cohesion/civic participation
Culture
Leisure
Economic well-being
Accommodation/housing
Education & lifelong learning
Training
Environment
Equalities
Heritage
Health
International development
Religious/faith based
Criminal justice
Animal welfare
Capacity building
Other charitable purposes
21
12
17
15
16
6
28
17
5
3
5
23
3
13
1
1
10
4
20
8
12
19
12
6
26
14
4
3
4
22
3
13
1
1
7
5
17
6
13
21
8
6
28
10
4
2
5
17
4
13
1
1
5
5
England
Liverpool CityRegion
Liverpool
Measuring the size and scope of the voluntary and community sector in the Liverpool City Region
18
Figure 3.9: VCS main areas of work: % point difference City of Liverpool versus National
Source: Based on data from 2010 National Survey of Charities and Social Enterprises
Main roles undertaken
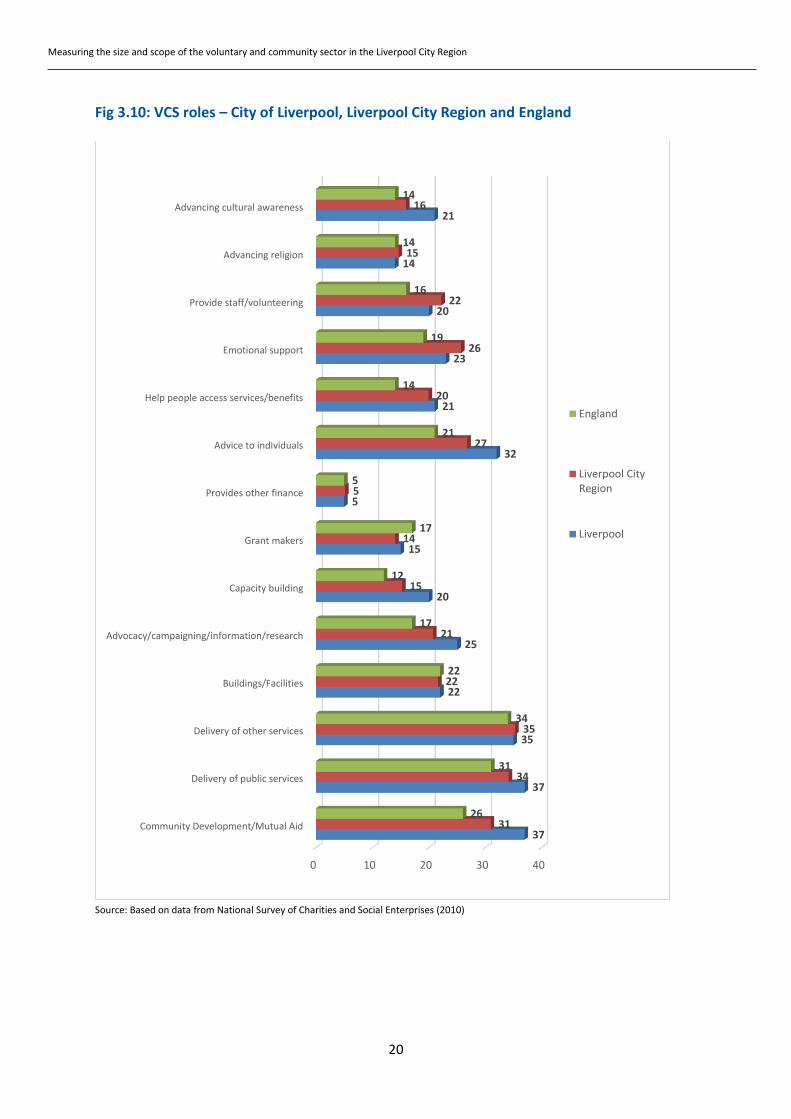
3.19 The NSCSE survey also asked organisations to self-select the various roles they undertake in the work they
deliver. Figure 3.10 demonstrates the wide range of roles undertaken by the sector. In Liverpool, the city
region and nationally, voluntary sector organisations are particularly prominent in two areas – the ‘delivery of
public services’ and the ‘delivery of other services’ – with around a third of organisations involved in both.
Public service delivery encompasses the following: health care, day centres, counselling, community safety,
education, childcare and social housing. ‘Other’ services include: business services, financial services, leisure,
retail, manufacturing, community support, sports coaching and recreation.
-6 -4 -2 0 2 4 6 8
ECONOMIC WELL-BEING
TRAINING
COHESION/CIVIC PARTICIPATION
HEALTH
CAPACITY BUILDING
COMMUNITY DEVELOPMENT
CULTURE
ENVIRONMENT
EQUALITIES
ACCOMMODATION/HOUSING
EDUCATION & LIFELONG LEARNING
HERITAGE
RELIGIOUS/FAITH BASED
CRIMINAL JUSTICE
ANIMAL WELFARE
INTERNATIONAL DEVELOPMENT
OTHER CHARITABLE PURPOSES
LEISURE
% point diff Liverpool versus national
Measuring the size and scope of the voluntary and community sector in the Liverpool City Region
19
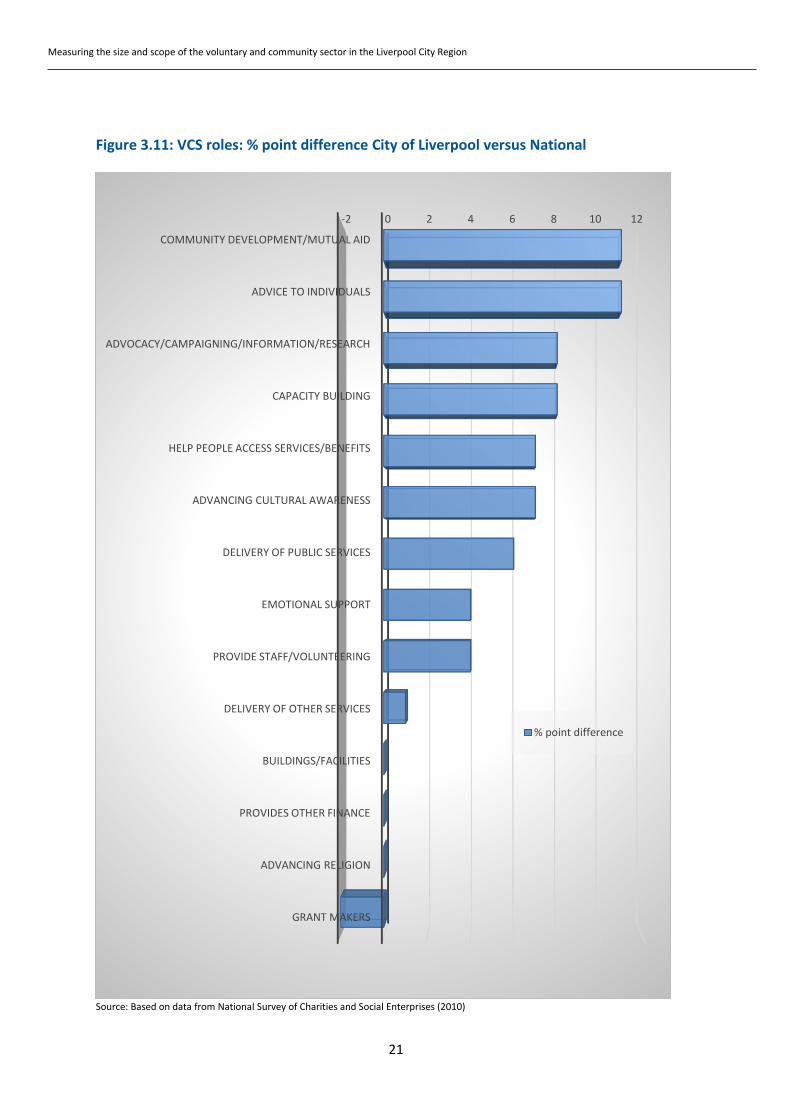
As Figures 3.10 and 3.11 show, compared to the national pattern, the City of Liverpool has proportionally
more voluntary organisations involved in:
the delivery of public services – 37% of organisations
community development and mutual aid – 37% of organisations
delivery of ‘other’ services – 35% of organisations
advice to individuals – 32% of organisations
advocacy, campaigning, representation, information and research – 25% of organisations
emotional support – 23% of organisations
help people to access services and benefits – 21% of organisations
advancing cultural awareness – 21% of organisations
providing staff and volunteering – 20% of organisations
capacity building – 20% of organisations
Compared to the Liverpool city region average, the City of Liverpool has proportionally more VCS
organisations involved in: advancing cultural awareness; help for people to access services and benefits;
advice to individuals; grant making; capacity building; advocacy/campaigning/representation/information
and research; delivery of public services; community development/mutual aid (Figure 3.10).
Measuring the size and scope of the voluntary and community sector in the Liverpool City Region
20
Fig 3.10: VCS roles – City of Liverpool, Liverpool City Region and England
Source: Based on data from National Survey of Charities and Social Enterprises (2010)
0 10 20 30 40
Community Development/Mutual Aid
Delivery of public services
Delivery of other services
Buildings/Facilities
Advocacy/campaigning/information/research
Capacity building
Grant makers
Provides other finance
Advice to individuals
Help people access services/benefits
Emotional support
Provide staff/volunteering
Advancing religion
Advancing cultural awareness
37
37
35
22
25
20
15
5
32
21
23
20
14
21
31
34
35
22
21
15
14
5
27
20
26
22
15
16
26
31
34
22
17
12
17
5
21
14
19
16
14
14
England
Liverpool CityRegion
Liverpool
Measuring the size and scope of the voluntary and community sector in the Liverpool City Region
21
Figure 3.11: VCS roles: % point difference City of Liverpool versus National
Source: Based on data from National Survey of Charities and Social Enterprises (2010)
-2 0 2 4 6 8 10 12
COMMUNITY DEVELOPMENT/MUTUAL AID
ADVICE TO INDIVIDUALS
ADVOCACY/CAMPAIGNING/INFORMATION/RESEARCH
CAPACITY BUILDING
HELP PEOPLE ACCESS SERVICES/BENEFITS
ADVANCING CULTURAL AWARENESS
DELIVERY OF PUBLIC SERVICES
EMOTIONAL SUPPORT
PROVIDE STAFF/VOLUNTEERING
DELIVERY OF OTHER SERVICES
BUILDINGS/FACILITIES
PROVIDES OTHER FINANCE
ADVANCING RELIGION
GRANT MAKERS
% point difference
Measuring the size and scope of the voluntary and community sector in the Liverpool City Region
22
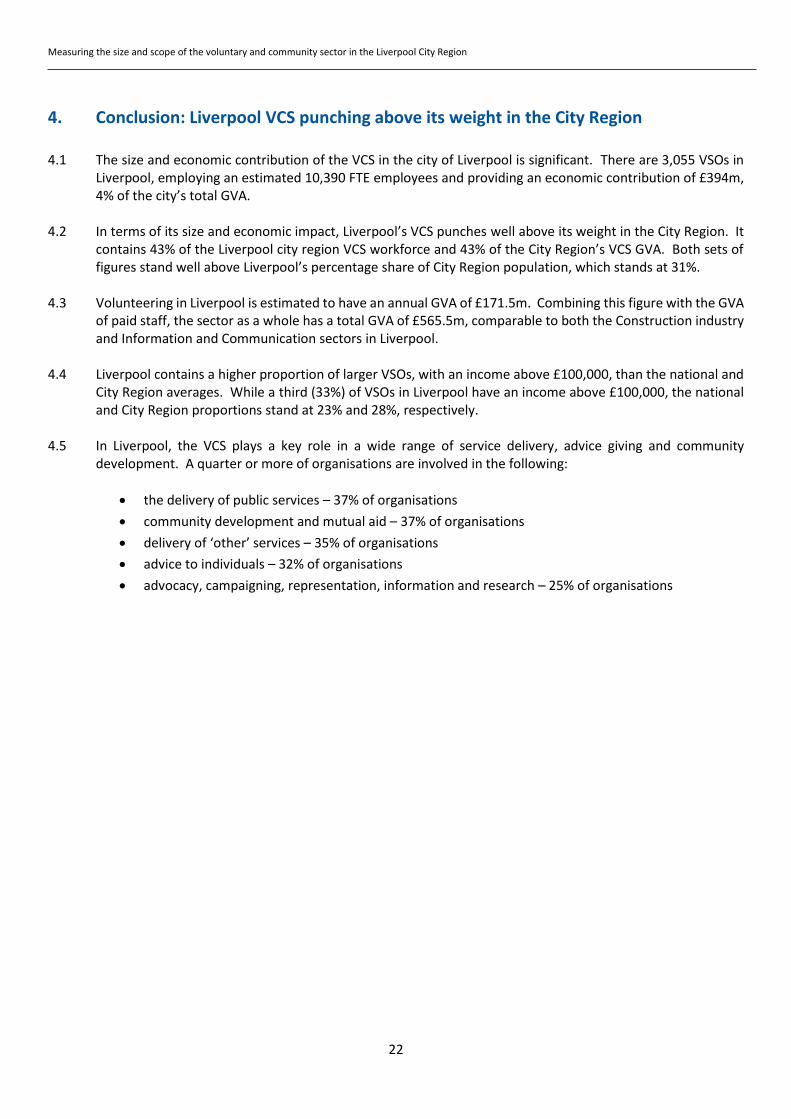
4. Conclusion: Liverpool VCS punching above its weight in the City Region 4.1 The size and economic contribution of the VCS in the city of Liverpool is significant. There are 3,055 VSOs in
Liverpool, employing an estimated 10,390 FTE employees and providing an economic contribution of £394m, 4% of the city’s total GVA.
4.2 In terms of its size and economic impact, Liverpool’s VCS punches well above its weight in the City Region. It
contains 43% of the Liverpool city region VCS workforce and 43% of the City Region’s VCS GVA. Both sets of figures stand well above Liverpool’s percentage share of City Region population, which stands at 31%.
4.3 Volunteering in Liverpool is estimated to have an annual GVA of £171.5m. Combining this figure with the GVA
of paid staff, the sector as a whole has a total GVA of £565.5m, comparable to both the Construction industry and Information and Communication sectors in Liverpool.
4.4 Liverpool contains a higher proportion of larger VSOs, with an income above £100,000, than the national and
City Region averages. While a third (33%) of VSOs in Liverpool have an income above £100,000, the national and City Region proportions stand at 23% and 28%, respectively.
4.5 In Liverpool, the VCS plays a key role in a wide range of service delivery, advice giving and community
development. A quarter or more of organisations are involved in the following:
the delivery of public services – 37% of organisations
community development and mutual aid – 37% of organisations
delivery of ‘other’ services – 35% of organisations
advice to individuals – 32% of organisations
advocacy, campaigning, representation, information and research – 25% of organisations
Measuring the size and scope of the voluntary and community sector in the Liverpool City Region
23
References Dayson, C., Eadson, W., Sanderson, E., Wilson, I., ‘City of Manchester State of the Voluntary Sector 2013: A report on social and economic impact.’ Centre for Regional Economic and Social Research. Sheffield: Sheffield Hallam University.
Geyne-Rajme, F. & Mohan, J. (2012) ‘The regional distribution of employees in the third sector in England: estimates
from the National Survey of Third Sector Organisations’. Third Sector Research Centre Working Paper 80. University
of Southampton and University of Birmingham: Third Sector Research Centre
Kane, D., Heywood, J., Bass, P. (2014) The UK Civil Society Almanac. London: NCVO.
McCabe, A. Phillimore, J. Mayblin, L. (2010) “‘Below the radar’ activities and organisations in the third sector: a
summary review of the literature”. Third Sector Research Centre Working Paper 29. University of Southampton and
University of Birmingham: Third Sector Research Centre
Mohan, J. et al (2010) ‘Beyond ‘flat-earth’ maps of the third sector: enhancing our understanding of the contribution
of ‘below the radar’ organisations’. Northern Rock Foundation Briefing Paper.
Office National Statistics (2013) Household Satellite Accounts – valuing voluntary activity in the UK
Measuring the size and scope of the voluntary and community sector in the Liverpool City Region
24
Appendix 1. Summary of main findings from Liverpool and Wirral state of the voluntary sector surveys
The main findings from Liverpool CVS and Community Action Wirral state of the voluntary sector surveys are
summarised below:
Liverpool:
527 organisations responded to its survey in 2008;
A total of 6,067 FTE jobs were reported by respondents; 8,759 volunteers and 1,969 volunteer committee
members;
The total income of those surveyed was £156,743m;
Local VCS made up predominantly smaller organisations, with an income below £100,000.
In terms of the work undertaken by organisations, the most popular categories comprised: education and
training (16%); community and economic development (11%); health and social care (10%); youth work (9%);
sports and recreation (9%); and arts and culture (9%).
Wirral:
670 local groups responded to a survey in 2013;
The majority of organisations, nearly 70%, had an annual income below £100,000; while a tenth had an annual
income over £1m.
Estimated to be 26,600 volunteers on the Wirral, averaging 3 hours of volunteering per week.
The annual contribution of volunteers to the Wirral economy is estimated to be £36,733,536.