measuring the roi on fp&a€¦ · insurance services . investments made into the fp&a teams...
TRANSCRIPT

Measuring the ROI on FP&A
Amber Bowden,
CPA, CTP
Sr Analyst
Lockheed Martin
Gavin Block,
Market Vice President
Kforce Professional
Staffing
Bill Sayer,
FP&A Manager
Crump Life
Insurance Services

Investments made into the FP&A teams over
past two years
48.7% 51.3% 51.3%
23.1%
7.7%
0%
10%
20%
30%
40%
50%
60%

Organizations that have added headcount to
their FP&A teams in 2013
43.6% No
56.4% Yes
0.0%

Most Important Contributions of FP&A
41.0%
41.0%
10.3%
7.7%
Forecasting
Strategic Planning
Budgeting
Other

ROI of Your FP&A Department
Why Evaluate ROI on FP&A?
The Process
Challenges

Why Evaluate ROI on FP&A?
Improve project quality
Determine if objectives
accomplished
Identify process strengths & weaknesses
Enable a cost-benefit analysis
Determine appropriate
solution
Establish priorities for
future investment
Direct Benefits of an ROI Study

Why Evaluate ROI on FP&A?
Increase engagement within FP&A
team
Improve customer service
Fewer complaints,
reduced conflict
Better understanding of
FP&A function
Better “seat at the table”
Create developmental
objectives
Indirect Benefits of an ROI Study

The Process

The Process: Decision
So you’ve decided to measure the ROI of your
FP&A function…
How far do you want to go?

The Process: Decision
Get a reaction to the idea/project and look for
perceived value
Do You Need Buy-In and From Who?
What Will This Cost in Time & Money?

Challenges
Lack of Support & Resources
Time Constraints
Valuing Soft Data
Valuing Intangibles
Defining Scope

The Process

The Process: Define Data
Agree on what your FP&A function contributes based on your primary responsibilities
Job descriptions
Department descriptions/
flowcharts Task lists/calendars

The Process: Define Data
Assign a value to your primary
responsibilities
Assumptions/ Estimates
Sensitivity analysis
Scenario analysis
Calculations
Calculated time savings
Historical trends

The Process: Define Data
Categories of Data to
Consider:
“Soft” data
Quality (failure rates, waste
etc.)
Costs (variances, cost of sales)
Time (cycle time, downtime, overtime)
Output (units, accounts, clicks etc.)
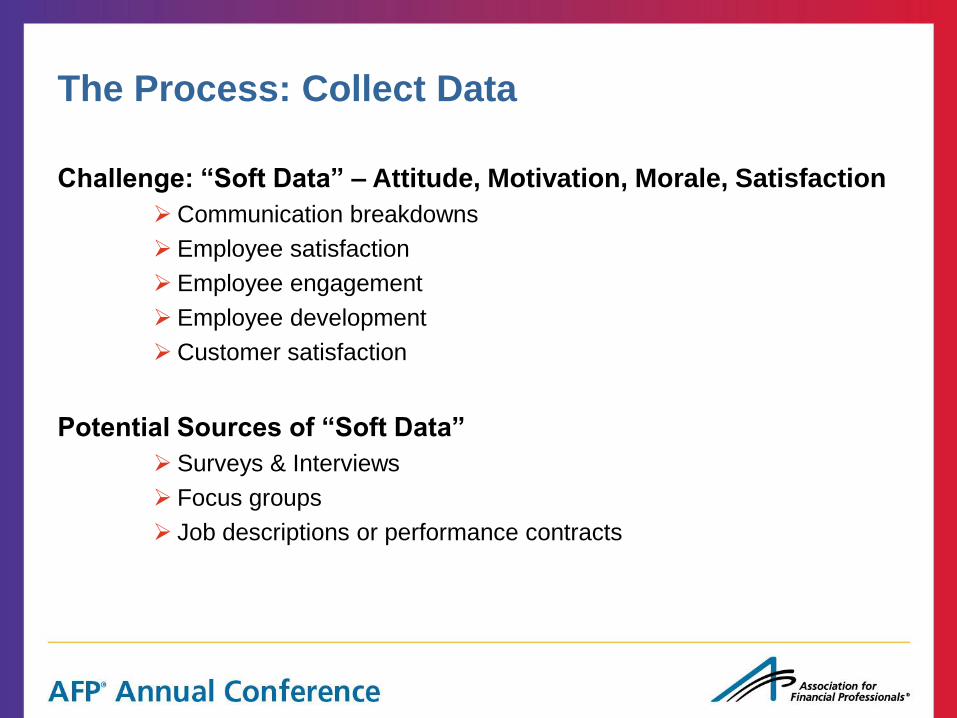
The Process: Collect Data
Challenge: “Soft Data” – Attitude, Motivation, Morale, Satisfaction
Communication breakdowns
Employee satisfaction
Employee engagement
Employee development
Customer satisfaction
Potential Sources of “Soft Data”
Surveys & Interviews
Focus groups
Job descriptions or performance contracts

Define Data: What Are The Contributions Of
Our FP&A Team?
Assumptions
Financial Services
10 person team
– VP
– Manager
– 4 SFA’s
– 4 FA’s
Important – The method is the thing. Agree or disagree on our
numbers.

Define Data: What Are The Contributions Of
Our FP&A Team?
Primary goals for our team:
– Accurate & Timely Financial Reporting
• Monthly executive business review meeting reporting
• Internal and corporate parent close
• Compensation support
– Business Support & Analysis
• Annual operating & strategic plan leadership
• Variance analysis
• Forecasting
• Business Development
• Improved Efficiencies
Secondary goals:
• Support of other finance teams as needed
• Internal process improvement
• Documentation

The Process

Calculate a Value: Things You Will Need
Team goals and job descriptions
Summary financial statements (P&L)
FP&A team cost information (could be confidential)
A few cooperative but credible internal sources to talk to
A famous dead Italian physicist

Calculate The Value Of The Team Contributions
But How Do You Calculate?
Enrico Fermi, 1901-1954
• Physicist
• Nuclear energy pioneer
• Nobel Laureate
• Also…master estimator

Calculate The Value Of The Team Contributions
The Fermi method of estimation:
• Using clearly identified, reasonable assumptions, you
can make a justifiable estimate about the quantity of
something that seems impossible to know.
The application of multiple nonbiased factors will likely
be more accurate than an outright guess
We’ve all been in this situation before
Ask Fermi questions: Is it more than X? Less than Y?

Calculate The Value Of The Team Contributions
How can we use this?
– For your FP&A team’s contributions that cannot be directly
measured or otherwise estimated, apply the Fermi method
to arrive at a justifiable number.

Calculate The Value Of The Team Contributions
1. Monthly executive business review meeting reporting
227 page package of reports
Estimated FP&A team time committed to process:
• Creation of reports: estimate per page per month including
production, quality review, process maintenance, analysis
& summarization.
• Total time = 151.5 hours (18.8 person-days)
FP&A review with executive team:
• Monthly meeting w/business leaders
• Key leaders have their own meetings
• Total time = 28.5 hours
Total FP&A time = 180 hours.

Calculate The Value Of The Team Contributions
2. Expense & Revenue Impact
Total non-compensation expenses reviewed during meetings:
$10MM.
• What are we worth? How much more would we spend if we
did not report & analyze our expenses?
• Fermi it: 5%? 3%?
• Estimated impact of meetings on expense management:
4% ($400,000 monthly)
Total revenue reviewed during meetings: $15M
• Estimated impact of meetings on revenue creation:
2% ($300,000 monthly)

Calculate The Value Of The Team Contributions
3. Business Support & Analysis
Annual operating & strategic plan leadership
• Annual value of expenses in plan: $175MM
• Estimated value of FP&A impact on expense planning (no enterprise planning solution): 5% or $8.75MM
Variance analysis: included in monthly review estimate
Forecasting: included in monthly review estimate
Business Development
• Total annual value of signed new business worked by FP&A team: $10MM
• Importance of FP&A team on business development signing: pricing, pro forma planning, value prop development: 20% ($2MM)
Improved Efficiencies
• Waste, fraud & abuse identified: $100,000
• Terminated contracts & expenses: $200,000
• Improved metric reporting, better HC management: $150,000

Calculate The Value Of The Team Contributions
4. Compensation support
$2MM in monthly variable compensation, inputs calculated &
supplied by FP&A team.
Estimated value of FP&A team through added accuracy and
precision: 20% ($400,000 monthly)
5. Internal & corporate parent close
Not included here: could be done elsewhere? Overlap?
Excluding things is OK.

Calculate The Value Of The Team Contributions
6. Secondary Goals: not included here.
Support of other finance teams as needed: expected by any
team part of a larger department.
Internal process improvement: no hard dollar savings if we have
constant headcount.
Documentation: very hard to measure risk prevention for us.
Could possibly still carry on without documentation due to
experience from cross training and internal promotion/transfer of
duties.

In Total the Value Of The Team’s Contributions
Monthly executive business review meeting reporting
• Total FP&A time = 180 hours
Monthly executive business review
• Estimated impact of meetings on expense management: 4% ($400,000 monthly)
• Estimated impact of meetings on revenue creation: 2% ($300,000 monthly)
Business Support and Analysis
• Annual operating & strategic plan -Estimated value of FP&A impact 5% ($8.75MM)
• Business Development -Total impact on signed new business - $12M
• Improved Efficiencies -$450,000 annually
Compensation support
• Estimated value through added accuracy and precision: $400,000 monthly
Internal & corporate parent close

Consider Any Hidden Value
Hidden value:
– FP&A as a source of internal business leader development
(not included here)
– Human capital market value surplus:
• Hiring an equivalent FP&A team off the street, at AFP’s
compensation survey values at 50th percentile, would cost
approximately $100,000 more.
– Cost of outsourcing
• Assuming a 30% margin applied to internally-sourced cost
of FP&A team, outsourcing would cost an additional
$300,000
• Hiring difficulty

The Process

Measure the Cost of the FP&A team
All-In Compensation $741,000
Travel $35,000
Recruiting & Training $20,000
Systems & Services $15,000
Other $15,000
Subtotal $826,000
SV&A Overhead (20%) $165,200
Total $991,200
Hours 15,000
All-In Cost Per Hour $66.08

The Process

Arrive at a Confidence Measure of ROI Monthly Reporting:
Production of Binder (hours) 114
Analysis of Binder 38
Review w/executive team 29
Total Monthly Binder Hours 180
Weighted Avg Cost/Hour $66.08
Total Monthly Cost of Binder $11,883
Total Annual Cost of Binder $142,601
Monthly Review:
Est Impact of expense mgmt $400,000
Est Impact on revenue $300,000
Compensation support $400,000
Monthly expense impact $1,100,000
Annual Expense impact $13,200,000
Percent of total expenses 8.8%
Total Financial Review Value $13,342,601
Percent of total expenses 8.9%
5% Annual Expense Plan Impact $8,750,000
20% Business Development Revenue $2,000,000
Improved efficiencies $450,000
Total annual value $24,542,601

Bill, that’s CRAZY….$24 Million in value? Let’s make some scenarios…
Original Calculation Alternative 1: A little conservative Alternative 2: Very conservative
Monthly Reporting: Monthly Reporting: Monthly Reporting:
Production of Binder (hours) 114 Production of Binder (hours) 85 Production of Binder (hours) 75
Analysis of Binder 38 Analysis of Binder 25 Analysis of Binder 20
Review w/executive team 29 Review w/executive team 29 Review w/executive team 29
Total Monthly Binder Hours 180 Total Monthly Binder Hours 139 Total Monthly Binder Hours 124
Weighted Avg Cost/Hour $66.08 Weighted Avg Cost/Hour $66.08 Weighted Avg Cost/Hour $66.08
Total Monthly Cost of Binder $11,883 Total Monthly Cost of Binder $9,152 Total Monthly Cost of Binder $8,161
Total Annual Cost of Binder $142,601 Total Annual Cost of Binder $109,825 Total Annual Cost of Binder $97,931
Monthly Review: Monthly Review: Monthly Review:
Est Impact of expense mgmt $400,000 Est Impact of expense mgmt $250,000 Est Impact of expense mgmt $100,000
Est Impact on revenue $300,000 Est Impact on revenue $200,000 Est Impact on revenue $100,000
Compensation support $400,000 Compensation support $250,000 Compensation support $100,000
Monthly expense impact $1,100,000 Monthly expense impact $700,000 Monthly expense impact $300,000
Annual Expense impact $13,200,000 Annual Expense impact $8,400,000 Annual Expense impact $3,600,000
Percent of total expenses 8.8% Percent of total expenses 5.6% Percent of total expenses 2.4%
Total Financial Review Value $13,342,601 Total Financial Review Value $8,509,825 Total Financial Review Value $3,697,931
Percent of total expenses 8.9% Percent of total expenses 5.7% Percent of total expenses 2.5%
5% Annual Expense Plan Impact $8,750,000 3% Annual Expense Plan Impact $5,250,000 1% Annual Expense Plan Impact $1,750,000
20% Business Development Revenue $2,000,000 10% Business Development Revenue $1,000,000 5% Business Development Revenue $500,000
Improved efficiencies $450,000 Improved efficiencies $300,000 Improved efficiencies $200,000
Total annual value $24,542,601 Total annual value $15,059,825 Total annual value $6,147,931
ROI = 23.76 ROI = 14.19 ROI = 5.20

Arrive At a Confidence Measure of ROI
(Gain from Investment - Cost of Investment)ROI=
Cost of Investment
$991,200= 23.76
($24,542,601 - $991,200)
Plus: Hidden value
Confidence: 50% on first pass: 11.5
ROI could be as low as 5.2 at ~75% discount

Summary
We excluded the following value:
Internal & corp parent close
Support of other finance teams
Internal process improvement
Risk management value through backup & documentation
You can discount it down 75%
WE STILL PROVIDE AT LEAST 5X RETURN

The Process

The Process: Refinement and Ongoing
Evaluation
Clear Communication of
Results is Essential to
Project Success!

The Process: Ongoing Evaluation
Periodic Review
Satisfaction with Process
Understanding & Application

Summary
Even though this is challenging and can be inexact, it
has many direct & indirect benefits
Be unbiased and do it with an open mind, and be
open to feedback
Reevalution and ongoing evaluation are critical, really
makes the time worth it

Questions
Resources & Further Reading
• Show Me the Money: How to Determine ROI in People, Projects,
and Programs By: Jack J. Phillips & Patricia Pulliam Phillips
• The ROI of Human Capital By: Jac Fitz-Enz
• How To Measure Anything By: Douglas W. Hubbard