measuring the impact of the jamaican government on the economy … the impact of... · measuring...
TRANSCRIPT

1
Measuring the Impact of the Jamaican Government on the Economy via Fiscal
Multipliers
Working Paper
Tarick Blake*
Fiscal and Economic Programme Monitoring Department Bank of Jamaica
2012
The recent global economic crisis and the subsequent contraction in Jamaica’s economy have renewed
attention and interest on the impact of expansionary fiscal policy on economic activity, that is, Jamaica’s
fiscal multiplier. This paper seeks to shed some light on this issue by determining the dynamic effect of
expansionary fiscal policy on economic activities in Jamaica, using quarterly data from 1993 Q2 to
2012Q2. The paper employs the traditional Structural Autoregressive Model (SVAR)-pioneered by
Blanchard et al (2002), due to its ability to capture the dynamic responses of fiscal policy shocks and
determining fiscal multipliers. The results of the model indicate that the effect of expansionary fiscal
policy in Jamaica on GDP is weak and not persistent. Specifically, the fiscal multiplier was found to be
very small on impact and zero over the long run. It was also found that the impact multiplier for
consolidated capital expenditure was larger than government spending multiplier while there is no
difference in the long run multiplier.
JEL Classification: H20, H51 H63, E21, E22
Keywords: Tax revenue, GDP, Government Expenditure, Public Debt, Investment, Consumption, Structural Vector
Autoregressive models
*The views expressed in this paper are not necessarily those of the Bank of Jamaica.
2
Introduction
The recent global economic crisis and the subsequent contraction of the Jamaica economy have
brought renewed attention and debate to the question of whether the government should increase
spending to combat the effects of the recession or should they consolidate fiscal spending in
order to reduce the fiscal deficit and therefore set the economy on a sustainable path. Those
arguing for an increase in government spending tend to do so from a textbook Keynesian
position which states that output is determined by aggregate demand, thus the multiplier effect of
fiscal expansion would increase aggregate demand and ultimately output. In other words, an
increase in government spending or a reduction in taxes will have an expansionary effect on
economic growth. On the other hand, the arguments against expansionary fiscal policy has been
for small open economies and highly indebted countries like Jamaica, increases in government
spending only increase the debt, crowd out private investment and widen the fiscal deficit.
Moreover, it has been suggested by the critics, that fiscal stimulus measures are not likely to be
well targeted, but are likely instead to be directed toward wasteful and distortionary public
resources. Further, once implemented they are not likely to be withdrawn sufficiently to preserve
fiscal sustainability.
Empirical studies on the fiscal multiplier have offered no consensus on sign, size or even the
persistence of fiscal multipliers. Blanchard et al (2002) and Skeete (2011) showed that
expansionary fiscal policies tended to have a positive effect on output. Mendoza et al (2010)
indicated that while the fiscal multiplier tended to be positive and large for some countries,
countries with a high debt to GDP ratio tend to have small or negative multiplier. Other studies
have shown that expansionary fiscal policy tends to have little or no effect on output.
Few studies have been done on Jamaica and the Caribbean. Guy et al (2009) and Bynoe et al
(2008) employed SVAR to address the effectiveness of fiscal policy in Barbados. In addition,
Skeete (2011) also employed SVAR to address the effectiveness of fiscal policy in the Caribbean
in particular Jamaica, Barbados and Trinidad & Tobago, however, Guy et al (2009) and Bynoe et
al (2008) only considered the case of Barbados in their studies. On the other hand, Skeete (2011)
did not provide an in-depth analysis of the role of fiscal policy in influencing economic activities
in Jamaica and moreover failed to consider the influence of fiscal policy on investment,
3
consumption and central bank policy interest rate. In addition, Skeete (2011) did not explore
whether the type of government spending had any greater effect on economic activities in
Jamaica. Annual data used in this study increases the risk of simultaneity bias.
This paper aims to identify Jamaica’s fiscal multiplier and provide evidence of the crowding-out
effect on economic activities of an increase in government spending. It seeks to identify the
strength and persistence of expansionary fiscal policy on output. In addition, the studies seek to
determine if the types of government spending in Jamaica matter in determining the size of fiscal
multipliers. Finally, the paper seeks to establish the influence of monetary authorities on the size
of Jamaica’s fiscal multiplier.
Literature Review
There are generally three approaches used to study fiscal multipliers, the narrative approach, the
structural model approach and the structural VAR approach. The narrative approach, pioneered
by Ramey et al (1998) involves isolating the exogenous unanticipated component of fiscal policy
changes and estimating reduced-form regressions of GDP on dummy variables corresponding to
episodes of exogenous fiscal policy changes. Evidence from such event studies is consistent with
some effectiveness of fiscal policy. For instance, Guimarães (2010) found that the 2001 income
tax rebates in the United States were effective in boosting consumption, but the multiplier was
estimated at less than one.
The second approach is based on full-fledged structural models. The class of models used, range
from the more traditional simultaneous equations models such as the one used by
Macroeconomic Advisers to fully-optimizing DSGE models with price rigidities as in Taylor
et.al. (2009). Researchers who used these types of models found that the size of estimated
multipliers is not robust, as evident in Guimarães (2010). The third approach pioneered by
Blanchard et al (2002), identified fiscal policy “shocks” using VARs and simulated the dynamic
impact of these shocks on GDP and other variables of interest. Guimarães (2010) further stated
that identification of the fiscal shocks is typically achieved by assuming that government
spending is predetermined within a quarter (such assumption would not be reasonable with
annual data). The VAR studies typically found a larger effect of government spending on GDP

4
and in some cases they found government spending actual crowds in consumption (e.g.
Blanchard et al, 2002).
Traditional Mundell-Fleming analysis and several empirical studies have emphasized that the
effectiveness of fiscal policy hinges on several factors including trade openness, financial
innovation, monetary policy framework, the health of public finances, the nature of fiscal policy
changes and the exchange rate regime employed by a country. Scott et al (2008), Giancarlo et al
(2010) and Mendoza et al (2010) argue that the health of public finances/level of public
indebtedness is an important factor in determining the output effect of fiscal expansion. Scott et
al (2008) argues that high debt level lowers the multiplier because fiscal expansions are
associated with rising interest rates and spreads. He further contended that while interest rates on
government bonds may not respond to bad news about the fiscal position, credit spreads may do
the job, raising the cost of financing for corporations and households. This point was emphasized
by Agca et al (2009), when they found that public external debt has a sizable positive impact on
corporate syndicated loan spreads.
Further, Mendoza et al (2010) argued that when debt levels are high, increases in government
expenditure may act as a signal that fiscal tightening will be required in the near future. The
anticipation of such adjustments (in effect, a contraction in fiscal policy, possibly involving both
a reduction in fiscal spending and higher taxes) should have a contractionary effect that would
tend to offset whatever short-term expansionary impact government consumption may have.
Under these conditions, fiscal stimulus may therefore be counter-productive (Mendoza et al,
2010). Several empirical studies seem to support this claim. Mendoza et al (2010) in a cross
sectional study, found that the impact multiplier for highly indebted nations was close to zero
and the long run impact was negative. Similarly, Scott et al, (2008), found that multipliers for
high-debt economies were small and persistently negative.
According to Guimarães (2010), fiscal policy remains effective when monetary policy is
accommodative, thus alleviating the crowding-out effect (Scott et al, 2008). This point is
emphasized by Christiano et al (2009), Scott et al (2008), Mendoza et al (2010) and Erceg et al
(2010). They found that fiscal multiplier is large (greater than one for government spending)

5
when the nominal interest/central bank policy interest rate is constant. Schindler et al (2009)1
argued that accommodative monetary conditions can increase the size of multipliers by a factor
of 2 to 3.
According to Corsetti et al (2010) another determinant of effective fiscal policy is the state of the
financial system, or more specifically, the extent to which the private sector has access to credit,
given the greater impact of fiscal stimulus in the presence of liquidity constraints. This point is
supported by Scott et al (2008) who indicated that financial development yields a higher
multiplier.
In addition to the factors mentioned above, several studies which include Mendoza et al (2010)
and the traditional Mundell-Fleming model have argued that trade openness plays a critical role
in determining the effectiveness of fiscal multipliers. They argued that the fiscal multiplier would
be lower in a more open economy (i.e., an economy with a higher marginal propensity to import)
because part of the increase in aggregate demand would be met by a reduction in net exports
rather than by an increase in domestic production. This point was exemplified by Mendoza et al
(2010) who found that for open economies their fiscal multipliers were negative while for closed
economies, their multiplier were positive and large. However, Scott et al, (2008) found that
higher levels of trade openness yield higher multipliers.
From a rational expectations view point, the distinction between temporary and permanent policy
changes is an important determinant of the effectiveness of fiscal policy as this would
significantly alter adaptive expectations. For example, while a temporary fiscal expansion that
has no long-term effects will not influence expectations; a permanent fiscal expansion can lead to
crowding out – possibly to an extent that fiscal multipliers turn negative. Hemming et al., 2002
explains that this is due to the fact that households and firms will expect that an initial increase in
interest rates and appreciation of the exchange rate will persist and could become larger. The
Ricardian principle is that the outcome of a fiscal expansion is dependent on how consumers
perceive the increased spending would be paid for in the future. Consumers are forward-looking
and are fully aware of government’s inter-temporal budget constraints. Therefore, an increase in
1 IMF Staff Position Note (May 2009)
6
government spending may have no effect on aggregate demand (or possibly negative fiscal
multipliers), as consumers tend to offset fiscal injections through higher private savings –so that
aggregate demand is not affected.
Finally, another important determinant of effective fiscal multiplier is the exchange rate regime
employed by a country. Mendoza et al (2010) argued that under a flexible exchange regime, an
initial effect of a fiscal expansion is to increase output, raise interest rates, and induce an inflow
of foreign capital, which creates pressure to appreciate the domestic currency. Under
predetermined exchange rates, the monetary authority expands the money supply to prevent this
appreciation. Mendoza et al (2010) found that countries operating a predetermined exchange rate
regime had an impact multiplier of 0.09 and a long run multiplier of 1.5 while economies
operating under flexible exchange rates had an impact multiplier of -0.28 and a long run
multiplier of -0.41. However, Scott et al (2008) contends that multipliers are higher under a
flexible exchange rate regime.
Studies by Mendoza et al (2010) and Sharmda et al (2010) indicated that the effect of fiscal
policy on output and the size of fiscal multipliers varied considerably for different countries.
While employing a Structural Vector Auto regression (VAR) model, Mendoza et al (2010) found
that a fiscal multiplier/output effect of an increase in government consumption was larger in
industrial than in developing countries. They also found that investment responds negatively to a
shock to government consumption, while private consumption responds positively to a shock to
government consumption when operating under a fixed exchange regime and negatively under a
flexible exchange regime. Of note, they found that once monetary policy is controlled for,
consumption responds positively to government consumption shocks, but only when the central
bank accommodates the fiscal shock. Sharmda et al (2010), while studying the impact of fiscal
policy shocks on the Indian economy, found that the tax and government spending impact
multipliers were -1.37 and 0.09, respectively, while the long run tax and government spending
multiplier was -1.89 and 1.38, respectively. Guimarães (2010) who also studied India, found that
tax revenue multiplier was almost twice as large as the current spending multiplier. Of note,
Guimarães (2010) found that the development spending multiplier was greater than 1, suggesting
that the composition of spending matters. Similarly, the Scott et al (2008) also found that tax and

7
spending multipliers were generally in line with economic theory but they were relatively small.
In addition, revenue-based stimulus measures were found to be more effective in boosting real
GDP than expenditure-based measures, particularly in the medium-term and for advanced
economies. Their study also indicated that expenditure-based impulses had consistent negative
effects in emerging economies in the medium-term; perhaps reflecting concerns that, once
implemented, increased expenditure was difficult to remove.
Blanchard et al (2002), pioneers in their use of a Structural Autoregressive model to study fiscal
multipliers, found that positive government spending shocks have a positive effect on output, and
positive tax shocks have a negative effect on output. Of note, they found that both increases in
taxes and government spending have strong negative effects on investment spending.
Notwithstanding this however, they also found that private consumption responds positively to
an increase in government consumption. However, Ramey (2009) countered this claim, when he
found that private consumption declined in response to military expenditure shocks.
Ducanes et al (2006) in their study of the Macroeconomic Effect of Fiscal Policies in
Bangladesh, China, Indonesia & the Philippines, found that short-term fiscal multipliers from an
untargeted increase in government expenditure are positive but much less than those from an
increased expenditure targeted at capital spending. They also stated that the multiplier effects
from fiscal expansion via a tax rate reduction were typically much less than through higher
spending. Of importance, they found that the short-run positive impact of higher fiscal spending,
whether targeted or not, occurred mainly through investment on the demand side and secondary
sector output on the supply side. On the other hand, Ducanes et al, 2006 stated that a tax
reduction affects output primarily through private consumption and tertiary sector output
Crosetti et al (2010) in their panel study of several OECD countries found that a persistent
increase in government spending increases aggregate output. Similar to the results of Blanchard
et al (2002), they identified that government spending reduces investment while it increases
consumption and that once there is a financial crisis, consumption and output rise about twice as
much as the rise in spending.
8
In a Caribbean context, the results from a few studies indicate that fiscal multipliers are not very
large. Skeete (2011) studied the effectiveness of fiscal policy in three Caribbean countries-
Jamaica, Barbados and Trinidad & Tobago and found that government spending policies
stimulated the economies of Jamaica and Trinidad & Tobago but not of Barbados. However, the
multipliers in the case of Jamaica and Trinidad & Tobago were small and were found not to be
persistent. Similarly, Bynoe et al (2008) indicated that there was a positive, but weak response of
government expenditure shocks on real output in Barbados. However, the length of persistence
in most cases was found to be small. In addition, Guy et al (2009) found that government
expenditure shocks have a positive impact on real output in Barbados. Further, their study
indicated that the response of private consumption and private investment in Barbados is quite
similar to that of GDP, increasing in the short-term following the shock to government spending
and declining in the longer term, indicating that that these effects were not persistent.
Methodology
The reduced-form VAR can be represented as2
(1)
:
where is a vector of endogenous variables (consist of , , , , , and )3
, C (L)
is an autoregressive lag polynomial in the lag operator L, and is a vector of reduced-form
innovations, which are independent and identically distributed. The relation between the
reduced-form innovations, , and the objects of ultimate interest, the structural shocks, can
be represented as:
A = B (2)
where A and B are square matrices that respectively describe (i) the instantaneous relation
between the variables and (ii) the linear relationship between the reduced-form innovations. The
2 The structural specification followed the methodology adopted in McDonald et al, 2010 and Guy et al 2009. 3 We also included 4 Dummy variables (as a Exogenous variables) that control for (1) structural breaks for 1994 to 1998 and 2008 to 2009, and outliers.
9
structural shocks are assumed to be independently and identically distributed with covariance
matrix equal to the identity. The structural form of the VAR can be obtained by multiplying
equation (1) by A and then applying the relational defined of equation (2):
A = (3)
Solving equations (3) for yields the structural specification:
Identification
The identification of the structural form from the estimated reduced model requires restrictions
to be imposed on the A and B matrix. For appropriate identification of the model, the
assumptions of Blanchard et al (2002) were adopted which assumes that policy makers and
legislatures require more than a quarter to learn about GDP and other macroeconomic variables
shocks, decide what fiscal measures, if any, to take in response, pass these measures through the
legislatures, and actually implement them. In this regard, the use of Choleski decomposition was
employed, where the assumption of the lack of a contemporaneous relationship informs the order
of the variables in the estimated model.
In this regard, the variables were entered into the estimated VAR as follows: , , , ,
and . This ordering implies that the level of taxes, GDP, debt, private investment and
private consumption do not have a contemporaneous impact on government spending. It is also
assumed that GDP, debt, private investment and private Consumption do not have
contemporaneous impact on the level of taxes. However, both government spending and the
level of taxes have a contemporaneous impact on GDP and the level of debt.
The impact multiplier which measures the ratio of the change in output to a change in the fiscal
variables ( and ) at the time in which the impulse to or occur. The long run multipliers
which measures the cumulative change in output per unit of additional or , from the time of
the impulse to or to the reported horizon. More specifically, government spending
10
multiplier was computed by dividing impact effects from the impact response function (IRF) of
the SVAR by the ratio of government spending to GDP.
Impact Multiplier =
Cumulative Multiplier
Data
For the purposes of this paper, taxes or the level of taxes is defined as the ratio of Tax Revenue
to Consumption (Haan et al 2001). Government spending (TG) is defined as Total government
spending that includes amortization. It is a well-known fact in Jamaica that the bulk of
government capital expenditure goes through various public entities and as such measuring
central government capital expenditure might not reflect the true picture of development
spending in Jamaica. In this regard, capital expenditure (consolidated) (CCE) is measured by
Central Government capital expenditure plus Capital expenditure for the Public Entities. Output
is measured by Real GDP (GDP). We also included Total Government Debt divided by nominal
GDP (V) due to theoretical relationship between fiscal policy and debt sustainability and also the
evidence found by Mendoza et al (2010) that the level of indebtedness of a country determines
the effect of expansionary government spending on output. Similarly, the Central Bank (CB)
policy interest rate (I) was also included to determine if the monetary authority was
accommodative to fiscal expansionary policy in Jamaica. Private consumption (PC) and private
investment (PI) were included to determine the crowding out effect of expansionary fiscal policy
on these variables. We also included four Dummy variables that control (1) structural breaks for
the period 1994 to 19984 and 2008 to 20095
The data series consist of quarterly observations covering the period 1993 to 2012. The Data
were collected from the Bank of Jamaica (BOJ)
and (2) outliers. All the variables were seasonally
adjusted using the Census X-12 Method.
6
4 In this period Jamaica suffer and financial sector meltdown
. It must also be noted that quarterly data on
5 In this period Jamaica were experiencing the effects of world economic crisis. 6 BOJ collects some data from the Ministry of Finance and the Statistical Institute of Jamaica.
11
Private Consumption7 and Private Investment8 were not available and as such the quarterly data
was interpolated. In addition, quarterly data on capital expenditure for Public Entities was not
available and as such the data was interpolated.9 Similarly, quarterly data10
Consistent with Mendoza et al (2010), quarterly data were used to ensure validity of the
identifying assumptions used in a Structural Vector Autoregression. SVAR analysis assumes that
fiscal authorities require at least one period to respond to new economic data with discretionary
policy. It may take as long as a quarter for the response of fiscal authorities to a shock to be
transmitted thus using annual data would not allow exact identification of when the impact takes
place.
on domestic
amortization and total government debt were not available for the period June 1993 to 1996 and
June 1993 to December 1995, respectively.
The Augmented Dickey-Fuller Test for unit root revealed that all of the variables in the model
were I(1). In addition, the Johansen cointegration test using the trace and eigenvalue tests did not
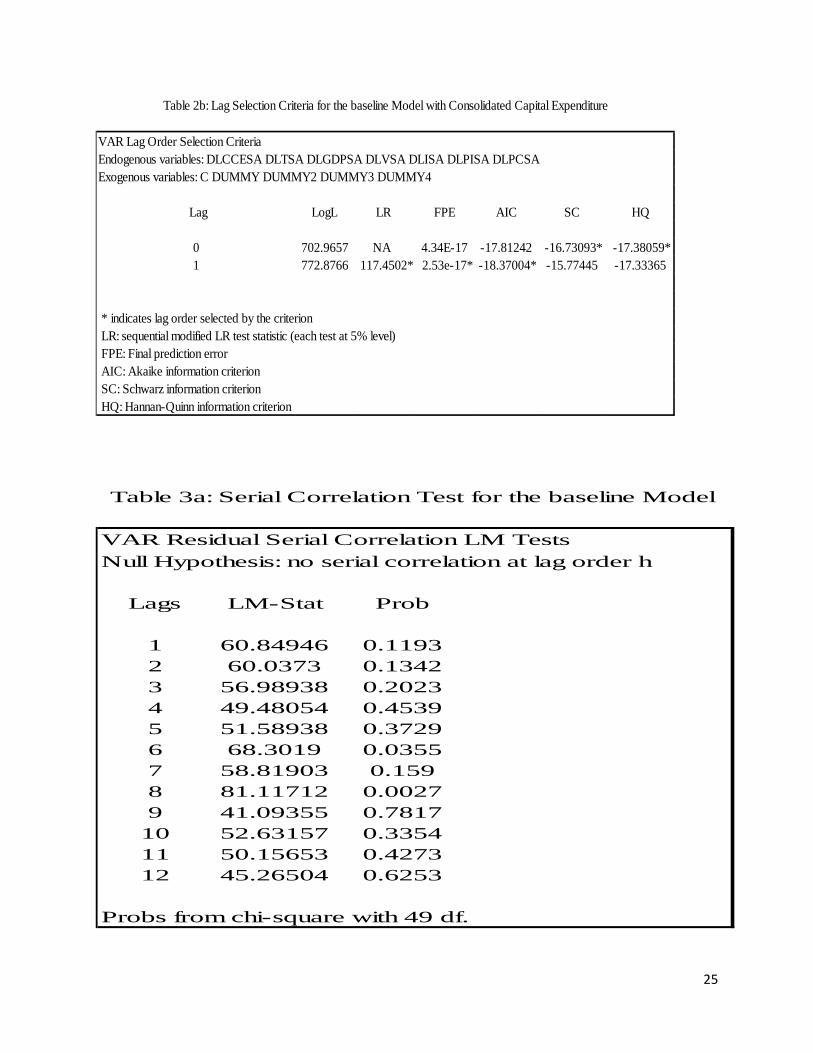
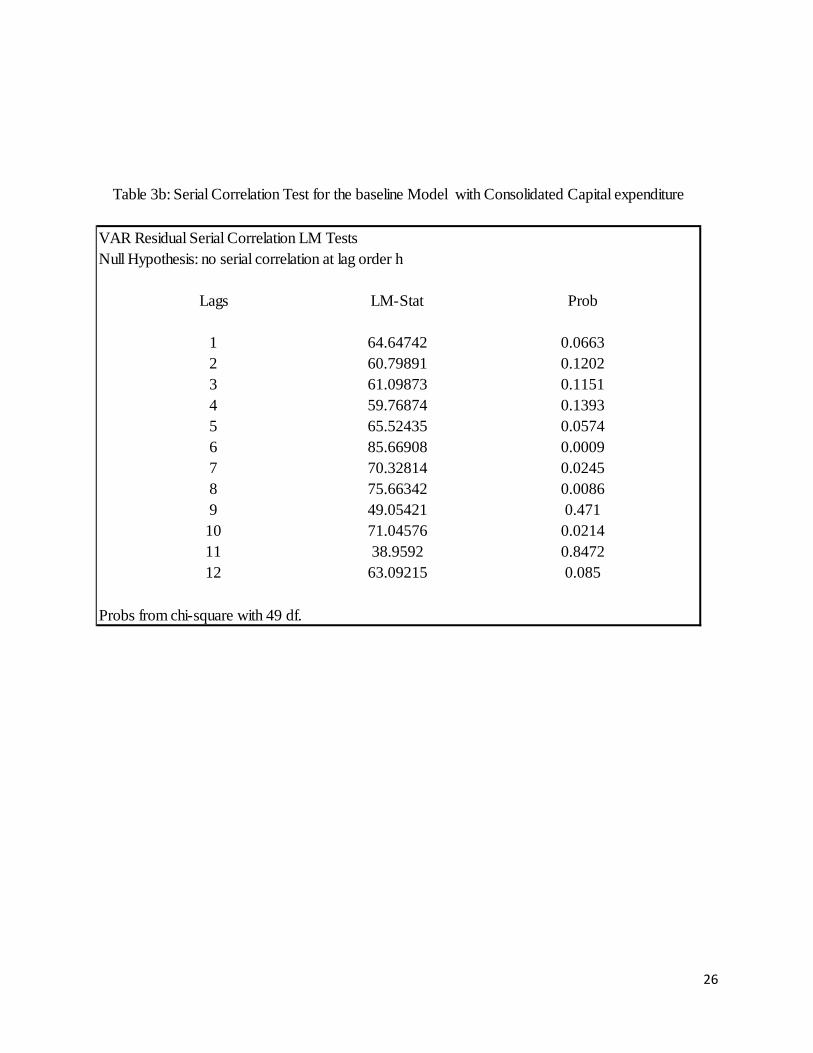
indicate the presence of a cointegration vector. In this regard, a VAR model was estimated of an
order of 1 lags as chosen by the Lag Criterion test which satisfied diagnostic test for normality
and the absence of autocorrelation (see appendix for respective tables).
7 This variable was interpolated in a software program called Benching using quarterly data on imports due to its high correlation with these two variables 8 This variable was interpolated in a software program called Benching using quarterly data on capital goods imports and consumption tax due to its high correlation with these two variables
9 This variable was interpolated in E-views, using the Quadratic-match sum method.
10 These variables were interpolated in E-views, using the Quadratic-match sum method.
12
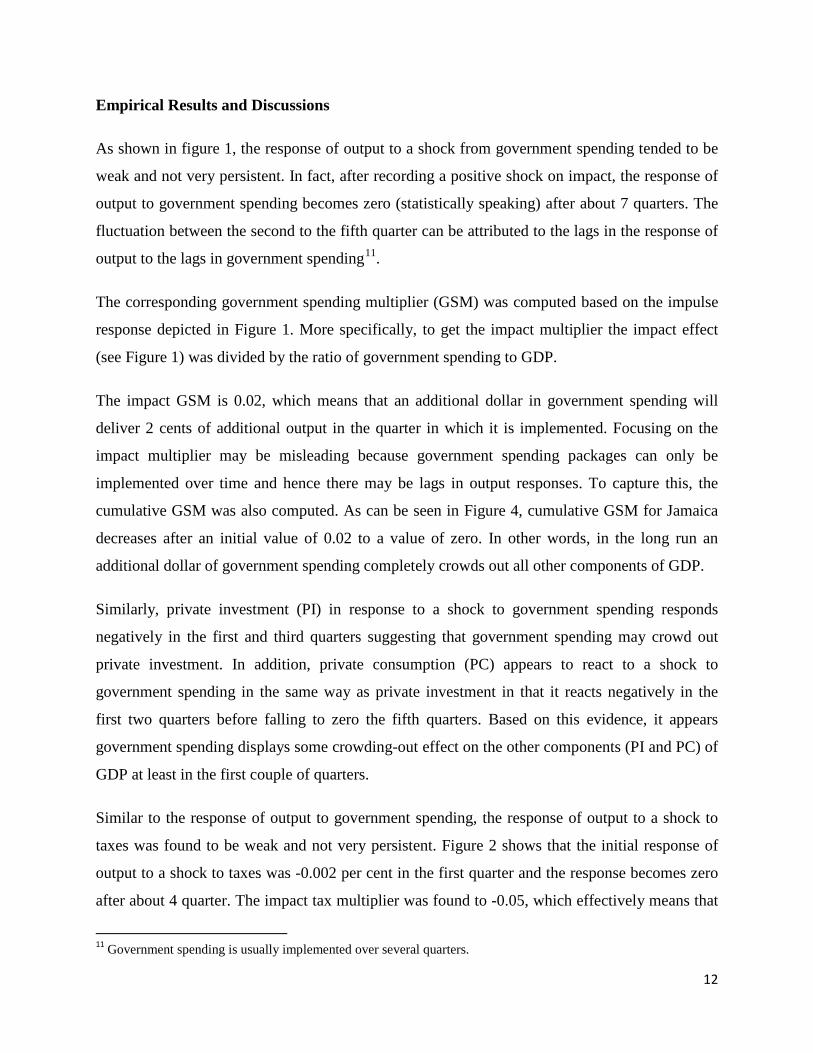
Empirical Results and Discussions
As shown in figure 1, the response of output to a shock from government spending tended to be
weak and not very persistent. In fact, after recording a positive shock on impact, the response of
output to government spending becomes zero (statistically speaking) after about 7 quarters. The
fluctuation between the second to the fifth quarter can be attributed to the lags in the response of
output to the lags in government spending11
The corresponding government spending multiplier (GSM) was computed based on the impulse
response depicted in Figure 1. More specifically, to get the impact multiplier the impact effect
(see Figure 1) was divided by the ratio of government spending to GDP.
.
The impact GSM is 0.02, which means that an additional dollar in government spending will
deliver 2 cents of additional output in the quarter in which it is implemented. Focusing on the
impact multiplier may be misleading because government spending packages can only be
implemented over time and hence there may be lags in output responses. To capture this, the
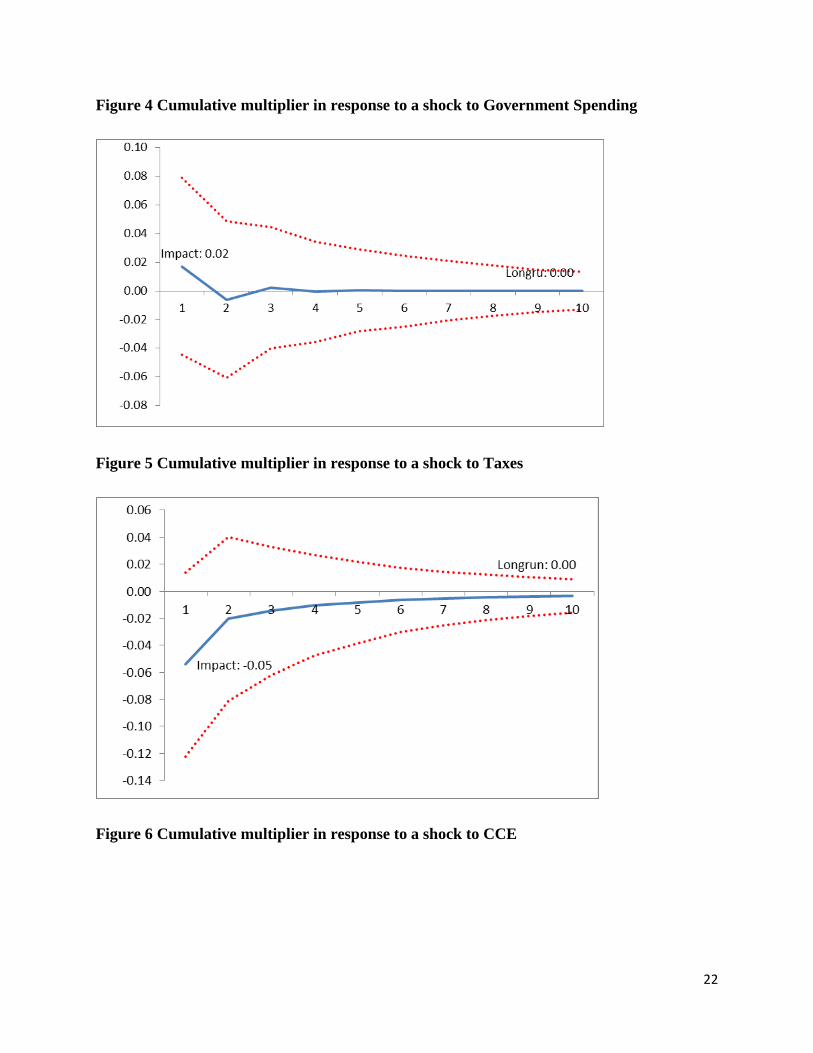
cumulative GSM was also computed. As can be seen in Figure 4, cumulative GSM for Jamaica
decreases after an initial value of 0.02 to a value of zero. In other words, in the long run an
additional dollar of government spending completely crowds out all other components of GDP.
Similarly, private investment (PI) in response to a shock to government spending responds
negatively in the first and third quarters suggesting that government spending may crowd out
private investment. In addition, private consumption (PC) appears to react to a shock to
government spending in the same way as private investment in that it reacts negatively in the
first two quarters before falling to zero the fifth quarters. Based on this evidence, it appears
government spending displays some crowding-out effect on the other components (PI and PC) of
GDP at least in the first couple of quarters.
Similar to the response of output to government spending, the response of output to a shock to
taxes was found to be weak and not very persistent. Figure 2 shows that the initial response of
output to a shock to taxes was -0.002 per cent in the first quarter and the response becomes zero
after about 4 quarter. The impact tax multiplier was found to -0.05, which effectively means that
11 Government spending is usually implemented over several quarters.
13
one dollar decrease in taxes should deliver 5 cent of additional output in the quarter it is
implemented. The cumulative tax multiplier is zero.
In comparing the effect of government spending and taxes on output in Jamaica, it may seem that
the latter does have a greater impact on the output given its higher initial impact. However, as
can be seen in Figure 2, a shock to taxes does have a positive initial effect on private investment
unlike government spending. Moreover, given the small impact of these two variables on output
which can be seen via their respective multipliers, it is difficult to say if any of the variables have
a greater impact on output.
These results (low fiscal multiplier) was consistent with what was obtained by (1) Mendoza et al
(2010) who found that government spending multipliers tend to be small and even negative in
developing countries; and (2) Skeete (2011) who found that government spending multiplier in
Jamaica was small and not persistent.
The result above also seems to be consistent with what was found in the past for countries with
high debt12. Studies such as Mendoza et al (2010) and Scott et al (2008) have found that
countries with high debt tend to have multipliers close to zero and persistently negative.
Jamaica13
12 High Debt is defined in this paper as any country with a Debt/GDP ratio of 60 per cent and over.
is regarded as a country with a high level of debt given by its debt/GDP ratio of over
60 per cent over the past 24 years. Furthermore, over the period 1993 to 2012, Jamaica debt
service payment has averaged about 54.3 per cent of total government spending. In this regard,
as explained by Mendoza et al (2010), any increase in government spending may act as a signal
that fiscal tightening (taxes increases and a reduction in government spending) will be required
in the near future. Thus in anticipation of this, consumers and businesses may not spend or invest
in the short to medium term given the possibilities that they will be required to compensate for
these expenditures in the future. In addition, given the high level of debt, an increase in spending
is more likely to be financed in the short term by loans and as a result this may increase interest
rate and as consequence this may act a deterrent to increased investment and consumption.
Further, an increase in government spending that is facilitated by borrowing, crowds out private
investments because this reduces the amount of funds available for the private sector to borrow.
13 For the period Fiscal year (FY) 1988/89 to FY 2011/12 Jamaica Debt/GDP ratio has average about 113 per cent and they have recorded a Debt/GDP ratio of over 60 per cent in every single FY since FY 1988/89 –Present.
14
Thus, due to high level of debt that the Government of Jamaica has incurred, any expansionary
government spending will not have a large impact on output.
Figure 1 indicates that in response to a shock to government spending, taxes increase on impact
before decreasing in the second and third quarters and subsequently increasing in the fourth
quarter. The increase in the response of taxes to a shock to government spending in the fourth
quarters could be explained by the fact that over time, the Government is trying to compensate
for their prior increases in spending.
Similarly, private investment (PI) in response to a shock to government spending responds
negatively in the first and third quarters suggesting that government spending may crowd out
private investment. In addition, private consumption (PC) appears to react to a shock to
government spending in the same way as private investment in that it reacts negatively in the
first two quarters before falling to zero the fifth quarters. Based on this evidence, it appears
government spending displays some crowding-out effect on the other components (PI and PC) of
GDP at least in the first couple of quarters.
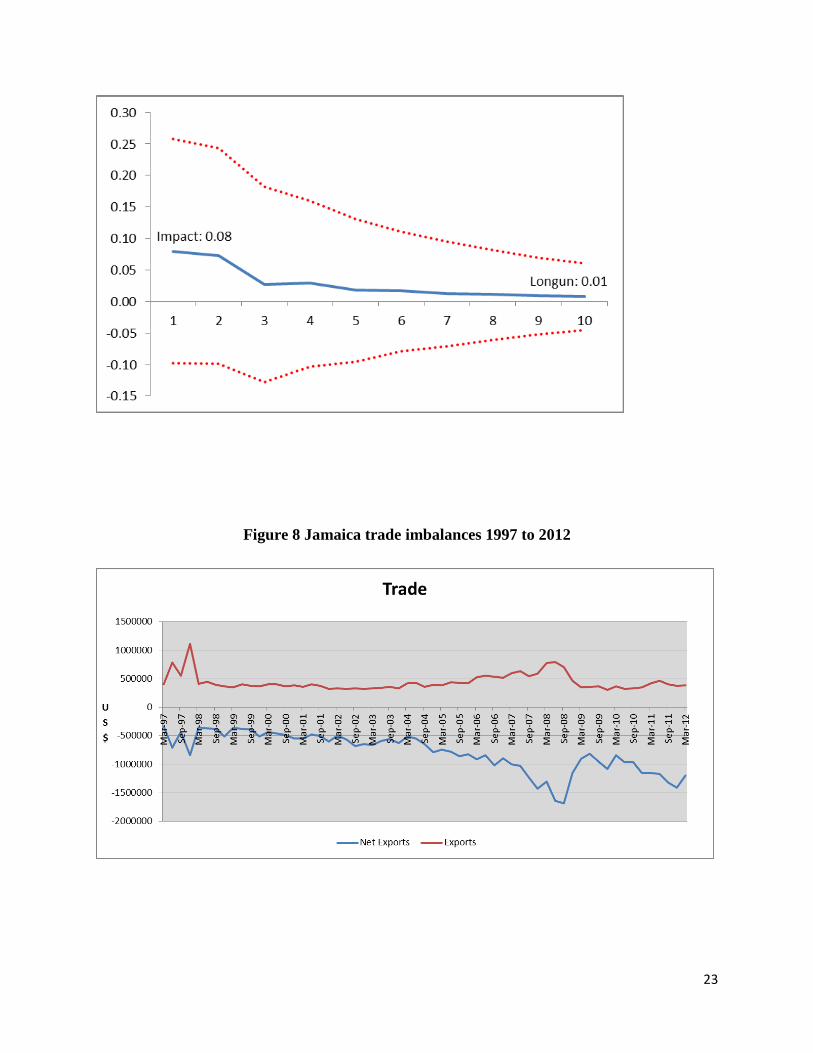
The low fiscal multiplier could also be explained by the fact Jamaica is a small open14
Jamaica suffers from a huge trade deficit as can be shown in Figure in 8
economy
with a floating exchange rate regime. This can be explained by the fact that small open
economies tend to have small fiscal multipliers because there is a higher marginal propensity to
import in these economies. In this regard, in an open economy the increase in aggregate demand
resulting from expansionary fiscal policy would also be met by a reduction in net exports rather
than an increase in domestic production.
15
14 Openness is defined as the ratio of trade (imports plus exports) to GDP. A country is considered open once this ratio exceeds 60 per cent.
(the graphs show an
increasing trend in Jamaica’s trade deficit over the period over the 1997 to 2012). It can be
deduced that Jamaica has a high marginal propensity to import and as such we could expect that
an increase in income in Jamaica could be met by an increase in imports. This result is consistent
with the findings of Mendoza et al (2010) who found that fiscal multiplier is smaller in open
economies. The low GSM can also be attributed to the flexible exchange regime that Jamaica
15 Figure 8 also shows that Jamaica’s exports have largely remained constant or decreasing over the period

15
employs. Mendoza et al (2010) found that countries that employ a flexible exchange rate tend to
have a low government spending multiplier.
The low GSM could also be because government spending in Jamaica is largely consumed by
debt servicing. Over the period 1993 to 2012, debt service average about 54.2 per cent of total
government spending in Jamaica. Thus, most of government resources are consumed by the
repayment of debt rather than by providing growth inducement infrastructure such as schools,
roads and bridges. In this regard, it can be expected that government spending might not have a
major impact on GDP. This is not to say that debt servicing has no positive impact output in
Jamaica. In fact most central government in actual owned by Jamaicans companies and
individuals and as such these entities and individual earned significant incomes from government
debt.
Several studies such as Christiano et al (2009) and Scott et al (2008) found that fiscal multiplier
is large (greater than one for government spending) when the nominal interest/central bank
policy interest rate is constant. They argue that due to fact that the main purpose of central banks
is to control for inflation, once there is a significant increase in government spending this usually
leads to an increase in the central bank policy interest rate. As a result of this, loan rates in
commercial banks usually increase. In this regard, this leads to a reduction in investment and as
such this mitigate the impact of an increase in government spending on GDP.
Thus, it is important to take look at the question of whether the stance of the monetary authority
has been accommodative to expansionary fiscal policy in Jamaica. As can be seen in Figure 1, in
responding to a shock to government spending, the Central Bank (CB) policy interest rate reacts
positively in the first quarter and before falling zero for the in 4 quarters. This lack of persistence
in the CB policy interest rate may be seen as general non responsiveness of the Monetary
Authority to fiscal policy. The initial positive response of the CB policy interest can be viewed
as the CB responding to inflation in a context when expansionary fiscal policy leads to inflation.
Thus, this result cannot be seen as the CB accommodating or non-accommodative fiscal policy
in Jamaica.
Some studies such as Guimarães (2010) have suggested that the type of government spending
matters in determining the relative strength and size of fiscal multipliers as spending geared
16
towards capital expenditure will lead to more growth. In this regard, it is important to investigate
this issue in relation to Jamaica.
Figure 416
Even though the CCE impact multiplier is slightly higher than the government spending impact
multiplier, it is still relatively small. This result along with the long-run CCE multiplier could be
explained by the fact that a substantive amount of capital expenditure funds in Jamaica are used
for importing goods and services (including overseas contractors). In addition, public entities in
Jamaica receive a substantial funding for capital expenditure via grants and loans from
multilateral and bilateral agencies. These loans and grants usually carry conditionalities which
require the respective public entities to use foreign goods, services and personnel. In this regard,
it can be understood why spending on development projects in Jamaica does not have a large
impact on output given the leakages via imports and repatriation of profits and incomes. In
addition, central government capital expenditure only contributes a small proportion of
government spending and by extension a small proportion of GDP. As explained previously, the
majority of government spending in Jamaica relates to debt repayment and wages and as such,
limits the amount that can be spend on capital expenditure. In fact, over the period 1993 to 2012,
capital expenditure average about 8 per cent of total government spending.
shows that the initial response of output to a shock from consolidated capital
expenditure (CCE) was found to be 0.001 per cent. This is just about the same as the response of
output to a shock from government spending. Notwithstanding this result, the impact multiplier
for CCE was found to be 0.08, which means that an additional dollar in government spending
will deliver 8 cents of additional output in the quarter in which it is implemented. The
cumulative CCE multiplier on the other hand was found to be the same as that for cumulative
GSM.
16 In this model Government spending was replaced by Consolidated Capital expenditure while the variables was order in the following sequence; , , , , , .

17
Summary &Conclusion
This paper examined the effects of expansionary fiscal policy (increase in government spending
and a decrease in taxes) on economic activity (GDP) in Jamaica via fiscal multipliers. This paper
used a SVAR method and a quarterly data set between 1993 and 2012 to explore the topic. The
findings indicate that the effect of expansionary fiscal policy on GDP is weak and not persistent.
It was also found that fiscal multiplier is very small on impact and zero over the long run
indicating that fiscal policy in Jamaica has a minor impact on economic activities in the long run.
These results were not unexpected and are largely consistent with other findings. In this regard,
these results could be explained by the high level of debt that central government has incurred
(evidence based on other studies results); the fact that country is a small open economy and the
crowding out effect that government spending has on private investment and private
consumption. It was also found that CCE multiplier was found to be higher than the GSM while
the long multiplier was about the same. From a policy perspective, it is imperative that the
Government of Jamaica seek to reduce its debt level as this severely limits the impact of
expansionary fiscal policy.
Due to the limited scope of the study, there are some areas that warrant further investigation. A
much larger data set could facilitate further research in the area of determining the impact of the
exchange regime and the level of openness on the size of fiscal multiplier in Jamaica. In addition,
even though the lack of quarterly data on private investment, private consumption and Public
Entities public expenditure did not have any major impact on the findings of this study it
however, leave the possibility for further research using more accurate quarterly data on these
variables.
18
Appendix
Figure 1-Baseline Variables Response to Government Spending
Response to Cholesky One S.D Innovations ± 2 S.E

19
Figure 2-Baseline Variables Response to Taxes
Response to Cholesky One S.D Innovations ± 2 S.E
Response of TSA To TGSA
Response of ISA To TGSA
Response of PCSA To TGSA
Response of GDPSA To TGSA
Response of TGSA To TGSA Response of VSA To TGSA
Response of PISA To TGSA
-0.005
-0.004
-0.003
-0.002
-0.001
0
0.001
0.002
0.003
0.004
0.005
1 2 3 4 5 6 7 8 9 10
-0.15
-0.1
-0.05
0
0.05
0.1
0.15
0.2
1 2 3 4 5 6 7 8 9 10
-0.02
-0.015
-0.01
-0.005
0
0.005
0.01
0.015
0.02
0.025
0.03
0.035
1 2 3 4 5 6 7 8 9 10
-0.015
-0.01
-0.005
0
0.005
0.01
0.015
1 2 3 4 5 6 7 8 9 10
-0.06
-0.04
-0.02
0
0.02
0.04
0.06
0.08
1 2 3 4 5 6 7 8 9 10
-0.02
-0.015
-0.01
-0.005
0
0.005
0.01
0.015
1 2 3 4 5 6 7 8 9 10
-0.03
-0.02
-0.01
0
0.01
0.02
0.03
0.04
0.05
1 2 3 4 5 6 7 8 9 10

20
Figure 3-Baseline Variables Response to CCE
Response to Cholesky One S.D Innovations ± 2 S.E
Response of PISA To TSA
Response of PCSA To TSA
Response of ISA To TSA
Response of GDPSA To TSA
Response of TGSA To TSA
Response of TSA To TSA Response of VSA To TSA
-0.006
-0.005
-0.004
-0.003
-0.002
-0.001
0
0.001
0.002
0.003
0.004
1 2 3 4 5 6 7 8 9 10
-0.04
-0.03
-0.02
-0.01
0
0.01
0.02
0.03
0.04
1 2 3 4 5 6 7 8 9 10
-0.04
-0.02
0
0.02
0.04
0.06
0.08
0.1
1 2 3 4 5 6 7 8 9 10
-0.03
-0.025
-0.02
-0.015
-0.01
-0.005
0
0.005
0.01
1 2 3 4 5 6 7 8 9 10
-0.06
-0.04
-0.02
0
0.02
0.04
0.06
0.08
0.1
0.12
1 2 3 4 5 6 7 8 9 10
-0.05
-0.04
-0.03
-0.02
-0.01
0
0.01
0.02
1 2 3 4 5 6 7 8 9 10
-0.04
-0.03
-0.02
-0.01
0
0.01
0.02
0.03
1 2 3 4 5 6 7 8 9 10

21
Response of CCESA To CCESA
Response of GDPSA To CCESA
Response of TSA To CCE
Response of ISA To CCESA
Response of PCSA To CCE
Response of VSA To CCESA
Response of PISA To CCESA
Response of PCSA To CCESA
-0.004
-0.003
-0.002
-0.001
0
0.001
0.002
0.003
0.004
0.005
1 2 3 4 5 6 7 8 9 10
-0.02
-0.015
-0.01
-0.005
0
0.005
0.01
0.015
0.02
0.025
1 2 3 4 5 6 7 8 9 10
-0.2
-0.15
-0.1
-0.05
0
0.05
0.1
0.15
0.2
0.25
1 2 3 4 5 6 7 8 9 10
-0.02
-0.015
-0.01
-0.005
0
0.005
0.01
0.015
1 2 3 4 5 6 7 8 9 10
-0.12
-0.1
-0.08
-0.06
-0.04
-0.02
0
0.02
0.04
0.06
0.08
1 2 3 4 5 6 7 8 9 10
-0.015
-0.01
-0.005
0
0.005
0.01
0.015
0.02
1 2 3 4 5 6 7 8 9 10
-0.03
-0.02
-0.01
0
0.01
0.02
0.03
1 2 3 4 5 6 7 8 9 10
22
Figure 4 Cumulative multiplier in response to a shock to Government Spending
Figure 5 Cumulative multiplier in response to a shock to Taxes
Figure 6 Cumulative multiplier in response to a shock to CCE
23
Figure 8 Jamaica trade imbalances 1997 to 2012

24
VariableLevel
GDPSA -0.955 -10.631 ***Government Spending SA -1.257 -13.585 ***Tax SA 0.017 -8.957 ***Debt/GDP SA -1.578 -4.103 ***Private Investment SA -1.904 -13.475 ***Private Consumption SA -1.309 -10.670 ***Monetary Authority Policy Interest Rate SA -2.200 -7.737 ***Consolidated Capital Expenditure SA -0.626594 -15.49673 ***
Notes: *,**,*** are Mackinnon critical valves for the rejection of the null hypothesis of a unit root at the 10%, 5% and 1% levels respectively.
Augumented Dickey Fuller test
Table 1: Unit Root Test
1st Difference
VAR Lag Order Selection CriteriaEndogenous variables: DLTGSA DLTSA DLGDPSA DLVSA DLISA DLPISA DLPCSA Exogenous variables: C DUMMY DUMMY2 DUMMY3 DUMMY4
Lag LogL LR FPE AIC SC HQ
0 716.6865 NA 2.35E-17 -18.42396 -17.33420* -17.989241 791.9911 126.1862 1.18E-17 -19.1349 -16.51947 -18.09157*2 845.761 79.92815* 1.10e-17* -19.26381* -15.12272 -17.61188
* indicates lag order selected by the criterion LR: sequential modified LR test statistic (each test at 5% level) FPE: Final prediction error AIC: Akaike information criterion SC: Schwarz information criterion HQ: Hannan-Quinn information criterion
Table 2a: Lag Selection Criteria for the baseline Model
25
VAR Lag Order Selection CriteriaEndogenous variables: DLCCESA DLTSA DLGDPSA DLVSA DLISA DLPISA DLPCSA Exogenous variables: C DUMMY DUMMY2 DUMMY3 DUMMY4
Lag LogL LR FPE AIC SC HQ
0 702.9657 NA 4.34E-17 -17.81242 -16.73093* -17.38059*1 772.8766 117.4502* 2.53e-17* -18.37004* -15.77445 -17.33365
* indicates lag order selected by the criterion LR: sequential modified LR test statistic (each test at 5% level) FPE: Final prediction error AIC: Akaike information criterion SC: Schwarz information criterion HQ: Hannan-Quinn information criterion
Table 2b: Lag Selection Criteria for the baseline Model with Consolidated Capital Expenditure
VAR Residual Serial Correlation LM TestsNull Hypothesis: no serial correlation at lag order h
Lags LM-Stat Prob
1 60.84946 0.11932 60.0373 0.13423 56.98938 0.20234 49.48054 0.45395 51.58938 0.37296 68.3019 0.03557 58.81903 0.1598 81.11712 0.00279 41.09355 0.781710 52.63157 0.335411 50.15653 0.427312 45.26504 0.6253
Probs from chi-square with 49 df.
Table 3a: Serial Correlation Test for the baseline Model
26
VAR Residual Serial Correlation LM TestsNull Hypothesis: no serial correlation at lag order h
Lags LM-Stat Prob
1 64.64742 0.06632 60.79891 0.12023 61.09873 0.11514 59.76874 0.13935 65.52435 0.05746 85.66908 0.00097 70.32814 0.02458 75.66342 0.00869 49.05421 0.47110 71.04576 0.021411 38.9592 0.847212 63.09215 0.085
Probs from chi-square with 49 df.
Table 3b: Serial Correlation Test for the baseline Model with Consolidated Capital expenditure
27
References
Blanchard, Olivier, and Roberto Perotti. "An Empirical Characterization of the Dynamic Effects
of Changes in Government Spending and Taxes on Output." The Quarterly Journal of
Economics 117, no. 4 (2002): 1329-1368.
Bynoe, Ryan, and Tracy Maynard. "The Barbados Case: Fiscal Shocks and Economic Output."
Research Department: Central Bank of Barbados July (2008).
Christiano, Lawrence, Martin Eichenbaum, and Sergio Rebelo. When is the Government
Spending Multiplier? N.p.: Northwestern University, 2010
Corsetti, Giancarlo, Andr´e Meier, and Gernot J. M¨uller. "What determines government
spending multipliers?" International Dimensions of Fiscal Policy Transmission May (2010).
Ducanes, Geoffrey, Marie A. Cagas, Duo Qin, Pilipinas Quising, and Mohammad A. Razzaque.
Macroeconomic Effects of Fiscal Policies: Empirical Evidence from Bangladesh, People’s
Republic of China, Indonesia,and Philippines. N.p.: Economic and Research Department:
Asian Development Bank, 2006.
Guimarães, Roberto. What Are The Effects of Fiscal Policy Shocks in India? N.p.: International
Monetary Fund, 2010.
Guy, Kester, and Tracy Maynard. "Fiscal Shocks- A Stabilization Tool." Research Department:
Central Bank of Barbados July (2009).
Hann, Jakob de, and Bjørn Volkerink. "Tax Ratios: A Critical Survey." 2001.
Ilzetzki, Ethan, Enrique G. Mendoza, and Carlos A. Végh. How big (small) are Fiscal
Multipliers. Cambridge: National Bureau of Economic Research, 2010.
McDonald, Garry, Andy Mullineux, and Rudra Sensarma. "Asymmetric Effects of Interest Rate

28
Changes: The Role of the Consumption-Wealth Channel."
Scott, Alasdair, Steven Barnett, Mark De Broeck, Anna Ivanova, Daehaeng Kim, Michael
Kumhof, Douglas Laxton, Daniel Leigh, Sven Jari Stehn, and Steven Symansky,.
"World Economic Outlook: Financial Stress, Downturns, and Recoveries ." International
Monetary Fund. 2008.
Sharma, Seema, and Swati Yadav. Impact of fiscal policy shocks on the Indian economy. N.p.:
Munich Personal RePEc Archive, 2010.
Skeete, Prosper. Is Discretionary Fiscal Policy Effective? The Caribbean Experience. Grand
Cayman; International College of the Cayman Islands, 2011
Spilimbergo, Antonio, Steve Symansky, and Martin Schindler. Fiscal Multipliers. N.p.:
International Monetary Fund, 2009.