measuring pharmaceutical quality through manufacturing metrics
TRANSCRIPT
Measuring Pharmaceutical Quality through Manufacturing Metrics and Risk-Based Assessment
May 1 & 2, 2014
Meeting Summary
Quality assurance and control play an essential role in the pharmaceutical manufacturing process, by ensuring that patients are provided with medications that are safe, effective, and produced at a high level of quality. Despite recent advances in the manufacturing sector, quality issues remain a frequent occurrence, and can result in recalls, withdrawals, or harm to patients. Quality issues have also been linked to the rise in critical drug shortages. However, recent legislative actions and regulatory reforms have provided additional tools for regulators and manufacturers to confront these issues. Included among these tools is a program aimed at developing and implementing a set of standardized manufacturing quality metrics for use by the U.S. Food and Drug Administration (FDA). The establishment and collection of these metrics could provide various stakeholders – from industry to regulators – with greater insight into the state of quality at a given manufacturing facility, and allow stakeholders to better anticipate and address quality issues while simultaneously reducing unnecessary regulatory burden.
Background Regulatory Oversight of Pharmaceutical Manufacturing FDA maintains and enforces regulatory requirements for pharmaceutical manufacturing through a group of regulations known collectively as current Good Manufacturing Practices (cGMP).1 These regulations address a range of issues that impact the quality of a final product, including sanitation, equipment maintenance, personnel training, and complaint handling. Taken together, they represent the minimum set of standards that a manufacturer must meet in order to ensure that their products are safe, effective, and unadulterated. Enforcement of cGMPs is carried out through regular inspections, which are conducted both as part of the drug approval process and on an ongoing basis following approval. Any cGMP violations discovered upon inspection may result in warning letters, product seizures, recalls, or fines, depending on how serious the violation is determined to be.
Beyond cGMPs: The FDA’s Evolving Approach to Quality Oversight FDA’s approach to quality oversight has evolved in recent years, with an increasing emphasis placed on production quality control, continuous product and process enhancements, and a broader shift towards a risk-based approach to regulation. The agency is now in the process of undertaking major organizational and work process reforms related to pharmaceutical quality.2
1 Code of Federal Regulations. Title 21--Food And Drugs Chapter I--Food And Drug Administration Department Of
Health And Human Services Subchapter C--Drugs: General. PART 210 Sec. 210.1 (a). Retrieved April 9, 2014, from: http://www.accessdata.fda.gov/scripts/cdrh/cfdocs/cfcfr/CFRSearch.cfm?fr=210.1 2 Wesdyk, R. FDA/CDER’s Evolving Approach to Quality and the Use of Metrics (Presentation). 14 March 2014.
Retrieved April 10, 2014 from http://xavierhealth.org/wp-content/uploads/3.-Wesdyk_Next-Steps-for-the-CDER-Challenge.pdf
Engelberg Center Meeting Summary 5.1.2014: Pharmaceutical Quality Metrics
2
The passage of the Food and Drug Administration Safety and Innovation Act (FDASIA) of 2012 provided FDA with new authorities aimed at improving the agency’s approach to regulating drug quality. Manufacturers are now required to alert the FDA of potential drug shortages, and the agency can exercise greater discretion in terms of how it balances the risks associated with a drug shortage versus the risks of keeping a drug on the market that may not meet quality requirements. The legislation also directs the agency to significantly increase the frequency of its inspections of foreign manufacturing facilities, and replace its biannual inspection system with a risk-based inspection system. This system will require the agency to factor known risks such as compliance history, past recalls, and prior inspection frequency into its decision-making process for scheduling inspections and allocation of inspection resources.3 In order to support this assessment and streamline the on-site inspection process, FDASIA also authorizes FDA to collect records from manufacturers in advance or in lieu of facility inspections.4
Establishing the Office of Pharmaceutical Quality As part of its new approach to drug quality oversight, the FDA is also in the process of establishing an Office of Pharmaceutical Quality (OPQ). The overarching goal for this office is to provide a single, agency-wide quality oversight program that applies a uniform set of standards to all regulated products, and which integrates quality review, evaluation, and inspection activities under one authority. OPQ will also include an Office of Surveillance, which will conduct monitoring, assessment, and reporting on quality issues. As part of its surveillance activities, the office will serve as the business owner of the FDA’s quality data systems, and will manage the agency’s quality surveillance, inspection, and analysis programs. A key component in the office’s approach to quality surveillance will be the collection and analysis of a standardized set of manufacturing quality metrics.
Incorporating Manufacturing Quality Metrics within a Risk-Based Oversight Framework Quality metrics are widely used throughout the pharmaceutical industry to monitor quality control systems and processes, and many of the components that inform those metrics (e.g., data on process capability output or statistical process control) are already collected and maintained as part of cGMP compliance. Several measures are common throughout the industry, though they are defined differently across manufacturers, and even between sites operated by the same manufacturer.5 The proposed FDA program is not the first of its kind; rather, it draws from the example of existing private sector programs that collect voluntarily reported, standardized quality metrics from a large and varying array of manufacturing sites, which are then used by participating manufacturers to benchmark their performance against industry standards.6 For FDA, the collection and analysis of standardized quality metrics can serve several functions. At a basic level, metrics can provide a more quantitative and objective measure of quality at the product, site, and systems levels, which will enhance FDA’s broader surveillance efforts. Metrics data collection
3 U.S. Food and Drug Administration. (April 2014). Generic Drug User Fee Amendments of 2012. Retrieved April 9, 2014 from: http://www.fda.gov/ForIndustry/UserFees/GenericDrugUserFees/default.htm 4 U.S. Food and Drug Administration. Strategic Plan for Preventing and Mitigating Drug Shortages. October 2013. Retrieved April 9, 2014 from: http://www.fda.gov/downloads/Drugs/DrugSafety/DrugShortages/UCM372566.pdf 5 Pharmaceutical Research and Manufacturers of America (PhRMA). Docket No. FDA–2013–N–0124: Food and Drug Administration Drug Shortages Task Force and Strategic Plan; Request for Comments 78 Fed. Reg. 9,928. Submitted February 13, 2013. Accessed May 30, 2014, from: http://www.ipqpubs.com/wp-content/uploads/2013/06/Pharmaceutical_Research_and_Manufacturers_of_America_PhRMA_Comment.pdf 6 George, K. “Quality Metrics: Learnings from McKinsey’s ‘POBOS’ Benchmarking.” Brookings Institution. Washington, D.C. May 1, 2014. Presentation.
Engelberg Center Meeting Summary 5.1.2014: Pharmaceutical Quality Metrics
3
and analysis may also help mitigate or reduce quality-related drug shortages and recalls, by allowing for early identification of products at risk for quality failure. It may also help FDA to stratify manufacturing sites according to quality risk, devote additional resources toward those sites with a higher risk profile, and reduce the inspection burden placed on high-quality performers. Closer scrutiny of these metrics can also help promote positive firm behaviors and a corporate culture of responsibility for quality, by providing incentives to improve product and process capability. More broadly, metrics could contribute to ongoing FDA efforts to increase the visibility of and access to information about drug quality. Some have suggested that a broad-based quality metrics program could allow manufacturers to promote and publicize their own quality data as part of their marketing strategy, thus enabling purchasers to incorporate quality information into their contracting processes and providing incentives for manufacturers to compete based on quality.
Meeting Objectives In light of these opportunities, the Engelberg Center for Health Care Reform at the Brookings Institution, in cooperation with FDA, held a two-day expert workshop that focused on issues related to the selection, definition, and implementation of a common set of manufacturing quality metrics. The workshop included representatives from generic, brand, chemical, and biologic companies, contract manufacturers, active pharmaceutical ingredient manufacturers, group purchasing organizations, and government agencies. An agenda and a list of participating panelists are available here. A summary of the findings from the workshop discussion has been outlined below.
Developing an Initial Consensus Set of Quality Metrics Since early 2013, FDA has sought public input on the goals and objectives for the metrics program, as well as specific proposals on which metrics it should consider collecting. In response, several industry stakeholder groups have worked with FDA to develop consensus around the goals, as well as identify a potential metric set and develop recommendations for their interpretation.7,8 Through these discussions, FDA identified a set of consensus goals for the quality metrics program:
For industry: The use of quality metrics promotes responsible practices and quality driven corporate culture.
For the public: A focus on quality leads to fewer recalls and quality related shortages.
For the FDA: Industry achieves and is rewarded for quality, without extensive regulatory oversight.
FDA also identified four metrics for which there was broad support, which were presented to the workshop attendees at the beginning of the workshop.9 (See Table 1 below)
7
Parenteral Drug Association. Points To Consider: Pharmaceutical Quality Metrics. (2013). Retrieved April 14, 2014 from: http://www.pda.org/pdf-1/PDA-Pharmaceutical-Quality-Metrics.aspx 8 International Society for Pharmaceutical Engineering (ISPE). (December 2013) ISPE Proposals for FDA Quality
Metrics Program – Whitepaper. Retrieved April 14, 2014 from: http://www.ispe.org/quality-metrics-initiative 9 See Attachment 1 for a copy of this presentation
Engelberg Center Meeting Summary 5.1.2014: Pharmaceutical Quality Metrics
4
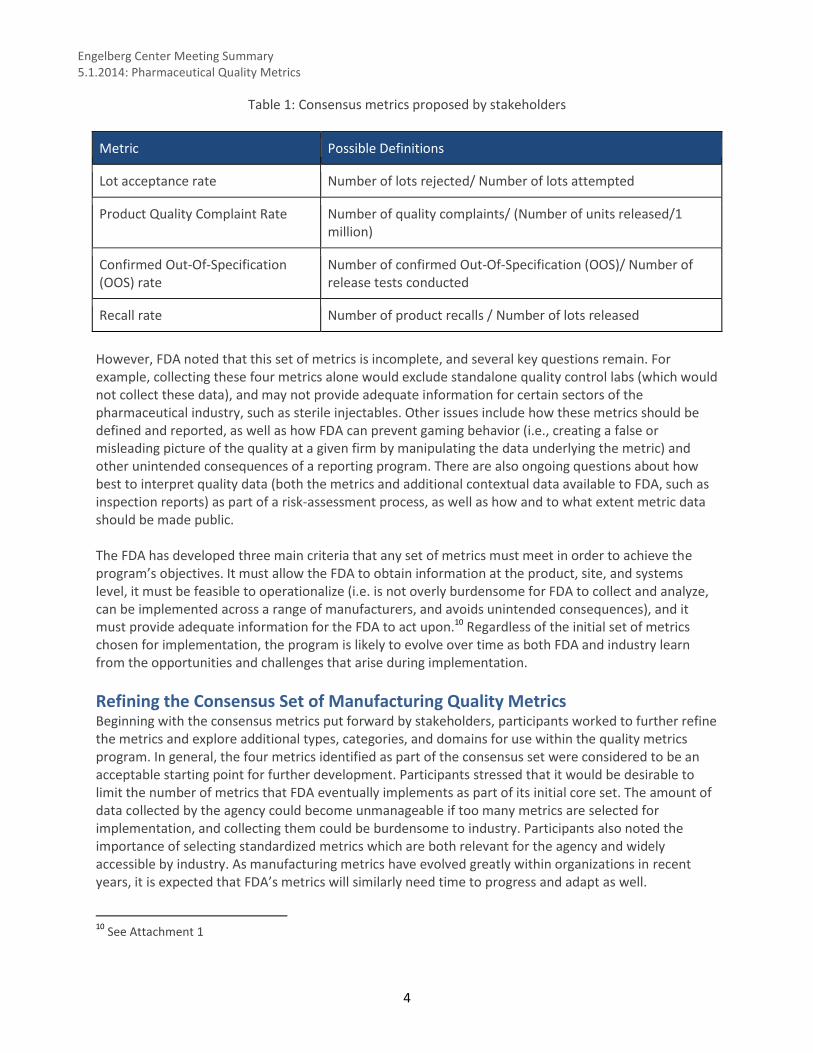
Table 1: Consensus metrics proposed by stakeholders
Metric Possible Definitions
Lot acceptance rate Number of lots rejected/ Number of lots attempted
Product Quality Complaint Rate Number of quality complaints/ (Number of units released/1 million)
Confirmed Out-Of-Specification (OOS) rate
Number of confirmed Out-Of-Specification (OOS)/ Number of release tests conducted
Recall rate Number of product recalls / Number of lots released
However, FDA noted that this set of metrics is incomplete, and several key questions remain. For example, collecting these four metrics alone would exclude standalone quality control labs (which would not collect these data), and may not provide adequate information for certain sectors of the pharmaceutical industry, such as sterile injectables. Other issues include how these metrics should be defined and reported, as well as how FDA can prevent gaming behavior (i.e., creating a false or misleading picture of the quality at a given firm by manipulating the data underlying the metric) and other unintended consequences of a reporting program. There are also ongoing questions about how best to interpret quality data (both the metrics and additional contextual data available to FDA, such as inspection reports) as part of a risk-assessment process, as well as how and to what extent metric data should be made public. The FDA has developed three main criteria that any set of metrics must meet in order to achieve the program’s objectives. It must allow the FDA to obtain information at the product, site, and systems level, it must be feasible to operationalize (i.e. is not overly burdensome for FDA to collect and analyze, can be implemented across a range of manufacturers, and avoids unintended consequences), and it must provide adequate information for the FDA to act upon.10 Regardless of the initial set of metrics chosen for implementation, the program is likely to evolve over time as both FDA and industry learn from the opportunities and challenges that arise during implementation.
Refining the Consensus Set of Manufacturing Quality Metrics Beginning with the consensus metrics put forward by stakeholders, participants worked to further refine the metrics and explore additional types, categories, and domains for use within the quality metrics program. In general, the four metrics identified as part of the consensus set were considered to be an acceptable starting point for further development. Participants stressed that it would be desirable to limit the number of metrics that FDA eventually implements as part of its initial core set. The amount of data collected by the agency could become unmanageable if too many metrics are selected for implementation, and collecting them could be burdensome to industry. Participants also noted the importance of selecting standardized metrics which are both relevant for the agency and widely accessible by industry. As manufacturing metrics have evolved greatly within organizations in recent years, it is expected that FDA’s metrics will similarly need time to progress and adapt as well.
10
See Attachment 1
Engelberg Center Meeting Summary 5.1.2014: Pharmaceutical Quality Metrics
5
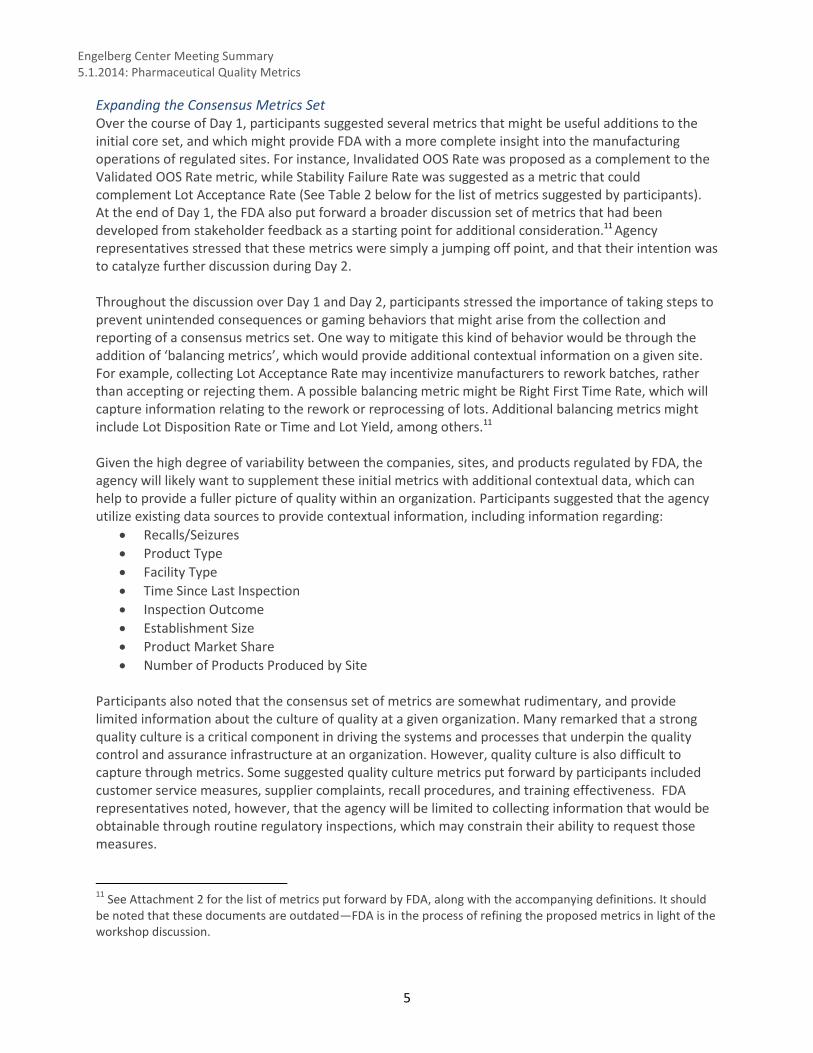
Expanding the Consensus Metrics Set Over the course of Day 1, participants suggested several metrics that might be useful additions to the initial core set, and which might provide FDA with a more complete insight into the manufacturing operations of regulated sites. For instance, Invalidated OOS Rate was proposed as a complement to the Validated OOS Rate metric, while Stability Failure Rate was suggested as a metric that could complement Lot Acceptance Rate (See Table 2 below for the list of metrics suggested by participants). At the end of Day 1, the FDA also put forward a broader discussion set of metrics that had been developed from stakeholder feedback as a starting point for additional consideration.11 Agency representatives stressed that these metrics were simply a jumping off point, and that their intention was to catalyze further discussion during Day 2. Throughout the discussion over Day 1 and Day 2, participants stressed the importance of taking steps to prevent unintended consequences or gaming behaviors that might arise from the collection and reporting of a consensus metrics set. One way to mitigate this kind of behavior would be through the addition of ‘balancing metrics’, which would provide additional contextual information on a given site. For example, collecting Lot Acceptance Rate may incentivize manufacturers to rework batches, rather than accepting or rejecting them. A possible balancing metric might be Right First Time Rate, which will capture information relating to the rework or reprocessing of lots. Additional balancing metrics might include Lot Disposition Rate or Time and Lot Yield, among others.11 Given the high degree of variability between the companies, sites, and products regulated by FDA, the agency will likely want to supplement these initial metrics with additional contextual data, which can help to provide a fuller picture of quality within an organization. Participants suggested that the agency utilize existing data sources to provide contextual information, including information regarding:
Recalls/Seizures
Product Type
Facility Type
Time Since Last Inspection
Inspection Outcome
Establishment Size
Product Market Share
Number of Products Produced by Site Participants also noted that the consensus set of metrics are somewhat rudimentary, and provide limited information about the culture of quality at a given organization. Many remarked that a strong quality culture is a critical component in driving the systems and processes that underpin the quality control and assurance infrastructure at an organization. However, quality culture is also difficult to capture through metrics. Some suggested quality culture metrics put forward by participants included customer service measures, supplier complaints, recall procedures, and training effectiveness. FDA representatives noted, however, that the agency will be limited to collecting information that would be obtainable through routine regulatory inspections, which may constrain their ability to request those measures.
11
See Attachment 2 for the list of metrics put forward by FDA, along with the accompanying definitions. It should be noted that these documents are outdated—FDA is in the process of refining the proposed metrics in light of the workshop discussion.
Engelberg Center Meeting Summary 5.1.2014: Pharmaceutical Quality Metrics
6
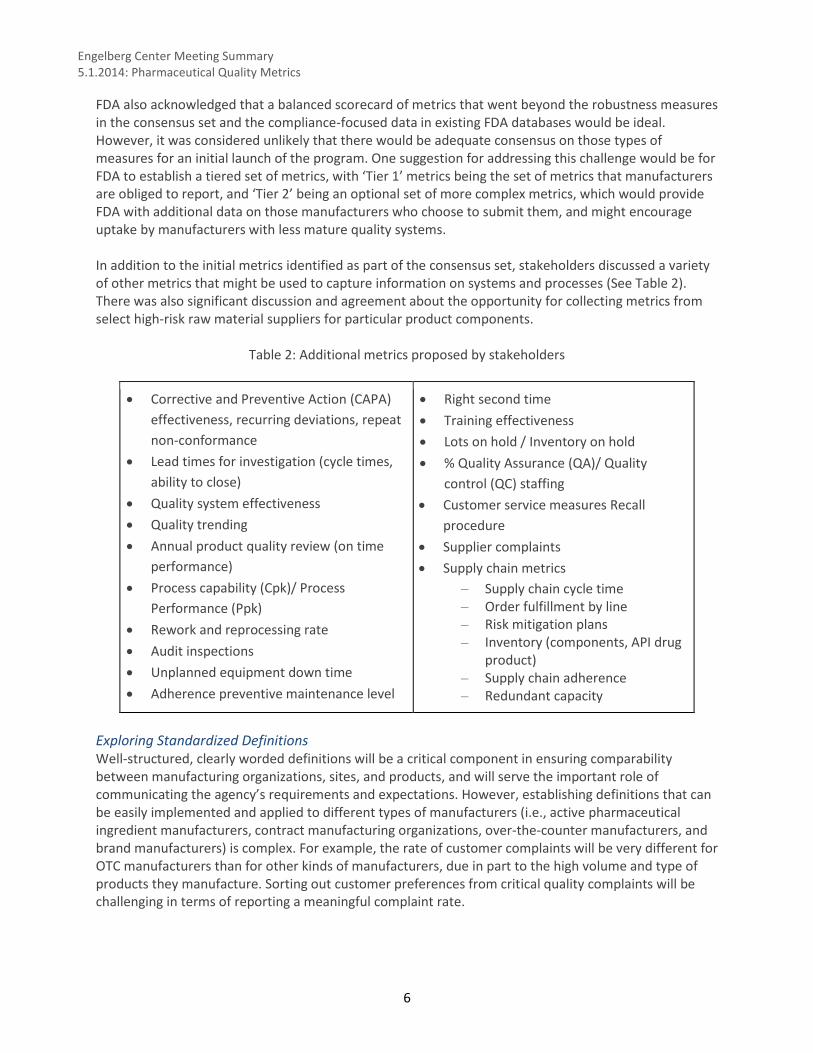
FDA also acknowledged that a balanced scorecard of metrics that went beyond the robustness measures in the consensus set and the compliance-focused data in existing FDA databases would be ideal. However, it was considered unlikely that there would be adequate consensus on those types of measures for an initial launch of the program. One suggestion for addressing this challenge would be for FDA to establish a tiered set of metrics, with ‘Tier 1’ metrics being the set of metrics that manufacturers are obliged to report, and ‘Tier 2’ being an optional set of more complex metrics, which would provide FDA with additional data on those manufacturers who choose to submit them, and might encourage uptake by manufacturers with less mature quality systems. In addition to the initial metrics identified as part of the consensus set, stakeholders discussed a variety of other metrics that might be used to capture information on systems and processes (See Table 2). There was also significant discussion and agreement about the opportunity for collecting metrics from select high-risk raw material suppliers for particular product components.
Table 2: Additional metrics proposed by stakeholders
Corrective and Preventive Action (CAPA)
effectiveness, recurring deviations, repeat
non-conformance
Lead times for investigation (cycle times,
ability to close)
Quality system effectiveness
Quality trending
Annual product quality review (on time
performance)
Process capability (Cpk)/ Process
Performance (Ppk)
Rework and reprocessing rate
Audit inspections
Unplanned equipment down time
Adherence preventive maintenance level
Right second time
Training effectiveness
Lots on hold / Inventory on hold
% Quality Assurance (QA)/ Quality
control (QC) staffing
Customer service measures Recall
procedure
Supplier complaints
Supply chain metrics
– Supply chain cycle time – Order fulfillment by line – Risk mitigation plans – Inventory (components, API drug
product) – Supply chain adherence – Redundant capacity
Exploring Standardized Definitions Well-structured, clearly worded definitions will be a critical component in ensuring comparability between manufacturing organizations, sites, and products, and will serve the important role of communicating the agency’s requirements and expectations. However, establishing definitions that can be easily implemented and applied to different types of manufacturers (i.e., active pharmaceutical ingredient manufacturers, contract manufacturing organizations, over-the-counter manufacturers, and brand manufacturers) is complex. For example, the rate of customer complaints will be very different for OTC manufacturers than for other kinds of manufacturers, due in part to the high volume and type of products they manufacture. Sorting out customer preferences from critical quality complaints will be challenging in terms of reporting a meaningful complaint rate.
Engelberg Center Meeting Summary 5.1.2014: Pharmaceutical Quality Metrics
7
FDA presented a set of hypothetical definitions as a starting point for the workshop discussion (See Attachment 2 for a list of these definitions), and participants proposed a range of adjustments and additional points to consider. Special focus was placed on Right First Time and Batch Failure Rate. In general, it was agreed that the discussion set of metrics were an acceptable starting point, though it may be unnecessary to collect all of them. The definitions proposed by FDA and stakeholders may also need to be refined through further discussion. Given the complexities in defining each metric, participants suggested that either workgroups be established to develop definitions for the final set of metrics, or that FDA consider making the metrics and their definitions available for broader public comment through formal channels (i.e. federal register announcement). This approach may help to define metrics appropriately and in a manner that avoids unintended consequences. FDA noted that it intends to seek broader stakeholder input on the final set of metrics.
Implementing Metrics across Industry and within FDA Oversight Processes Participants explored a range of considerations regarding the implementation and collection of metrics data, including potential mechanisms for collection, frequency of reporting, and level of reporting requirements for organizations, sites, and individual products. For the purpose of discussion, the agency proposed that all metrics data be reported annually by product sponsors. This reporting would be conducted at an organizational level; however each organization would collect and report data for each product and manufacturing site. A data portal and standard format could be made available for reporting by the sponsor/owner and collection by the agency. As the implementation of manufacturing metrics will involve new processes and practices for both industry and the agency, participants suggested the establishment of a “safe harbor” provision for reporting metrics during the first phases of implementation. During this period, FDA would collect metrics data to resolve any major issues in their collection and analysis, without industry concern regarding regulatory action from this initial data. This safe harbor period would allow the agency to better understand how the metrics perform and provide industry a chance to submit initial data without fear of regulatory consequences. Participants noted that manufacturers would benefit from an aggregate comparative benchmarking of the data collected by the agency. This information could provide manufacturers insight on their level of quality within the industry, as well as help to prioritize their internal resource allocation for quality purposes. The quality metrics will have greater value for manufacturers if they are provided with useful information regarding their quality systems, such as their system performance relative across the industry. This utility might drive more accurate self-reporting and greater buy-in from manufacturers. Participants also reported that there is skepticism within the industry regarding the use of metrics by the agency, particularly concerning the potential for this program to become a tool for regulatory compliance, penalties, or fines. FDA representatives reiterated that the metrics program is intended to allow the agency to monitor manufacturing quality without extensive regulatory oversight, and that this program is intended to facilitate regulatory ‘relief’ for industry, primarily through reduced inspection schedules. It was suggested that transparency within the design, implementation, and utilization of the quality metrics may help overcome industry concerns. Once implemented, consistency in the application, analysis, and utilization of the metrics will also be important in overcoming skepticism.
Engelberg Center Meeting Summary 5.1.2014: Pharmaceutical Quality Metrics
8
Integrating Metrics Data within FDA Oversight Participants discussed the importance of alignment between the various FDA agency departments involved in regulatory oversight and compliance activities, particularly between the Center for Drug Evaluation and Research (CDER) and Office of Regulatory Affairs (ORA). Alignment will ensure consistency in the analysis of the data and their application in regulatory decision-making, particularly with regards to inspections. Agency representatives noted the ongoing work in establishing the Office of Pharmaceutical Quality, the primary goal for which is to provide a single, unified agency voice on issues relating to quality. There was general agreement that FDA should focus less on procedural compliance and punitive enforcement, and that the metrics program will be most effective if the agency utilizes its metrics program to incentivize good behavior and continuous quality improvement. Participants noted that the agency will be able to do so through regulatory relief from reduced inspections, more streamlined post-marketing change requirements, and enhanced communication between agency and industry. While there should be consequences for any manufacturer who knowingly reports false or misleading information, participants cautioned against imposing penalties on industry for accurately reporting on quality problems, as this might drive gaming behavior. Industry and purchaser representatives also noted that transparency will be critical for the successful implementation of the metrics programs. Stakeholders will benefit from information on how the agency intends to use the metrics, methods for determining the agency’s quantification of risk, and how regulatory relief may be applied to those with the highest quality performance (i.e. through reduced inspection schedules). Transparency around how the agency will conduct benchmarking and risk assessment will prove similarly useful to manufacturers and purchasers.
Driving Quality Improvement in Pharmaceutical Manufacturing Role of Purchasers in Incentivizing Quality Improvement Pharmaceutical purchasers, such as group purchasing organization (GPOs), pharmaceutical distributors, and health systems, can serve an important function in incentivizing quality improvement of pharmaceutical manufacturers. Purchasers use quality data to varying degrees when making contracting decisions, making use of information from warning letters, inspectional observations (i.e., form 483), and other publicly available data sources. Participants noted that, while the market is a powerful lever to incentivize quality, there is little transparency around quality beyond those publically available documents. At present, purchasers have limited information on the level quality of pharmaceutical products, both within an individual organization and the industry as a whole. Purchaser representatives agreed that having access to more quality data would be helpful, and that certain steps could be taken to make existing quality data more accessible, comprehensible, and complete. Information may be more easily obtained and utilized by purchasers if manufacturer consent decrees, warning letters, and inspectional observations were made available in a centralized, searchable format that is available to stakeholders at a corporate level. Participants noted that clearer communication by the agency regarding regulatory actions would be helpful. Participants suggested that when regulatory actions occur, the agency could specify whether the quality issue exists at one manufacturing site or at the firm-level.
Engelberg Center Meeting Summary 5.1.2014: Pharmaceutical Quality Metrics
9
Public Availability of Metrics Data Participants shared a range of views on the benefits and challenges of making metrics data more broadly available. Some stakeholders suggested that industry could use this information as part of its marketing strategy, which could bolster competition around quality. However, a number of issues remain in the use of metrics data by purchasers, patients, and other stakeholders. It may be difficult to convey information on quality metrics in a way that is comprehensive and relevant to a non-technical audience. Misinterpretation of the data could lead to a number of unintended consequences. Additionally, participants raised the concern that broad availability of metrics-based data may undermine the role of the FDA, as the public generally assumes that any drug licensed for sale in the US is of high quality. Implying that there is a range of quality may raise concerns regarding FDA’s ability to protect the public’s health. FDA representatives noted that the agency does not intend to share metrics data publicly in part due to confidentiality considerations, though it is considering the possibility of reporting aggregated, de-identified metrics data back to manufacturers, which would then be free to use that information as part of their marketing strategy. The agency reiterated that the metrics also need to be further understood and characterized before such information could be made public. The extent to which quality metrics data can or should be reported to an external audience will continue to be explored by the agency in partnership with key stakeholders.
Next Steps in Implementing a Metrics Program The establishment of the manufacturing quality metrics program is an ongoing, multi-year process, and will continue to be informed by stakeholders in terms of the design, implementation, review, and revision of the metrics. The agency will seek broader consultation and input from stakeholders on the metrics discussion set through white papers, federal register notices, and public comments. Participants also noted that the pilot quality metrics programs currently under development by the International Society for Pharmaceutical Engineering, the Parenteral Drug Association, and others may yield important lessons for FDA as it moves forward with its own program.
Attachment 1:
FDA/CDER’s Evolving Approach to Quality Oversight
FDA/CDER’s Evolving
Approach to Quality Oversight
Theresa Mullin, PhD
Director, Office of Strategic Programs
FDA Center for Drug Evaluation and Research
1
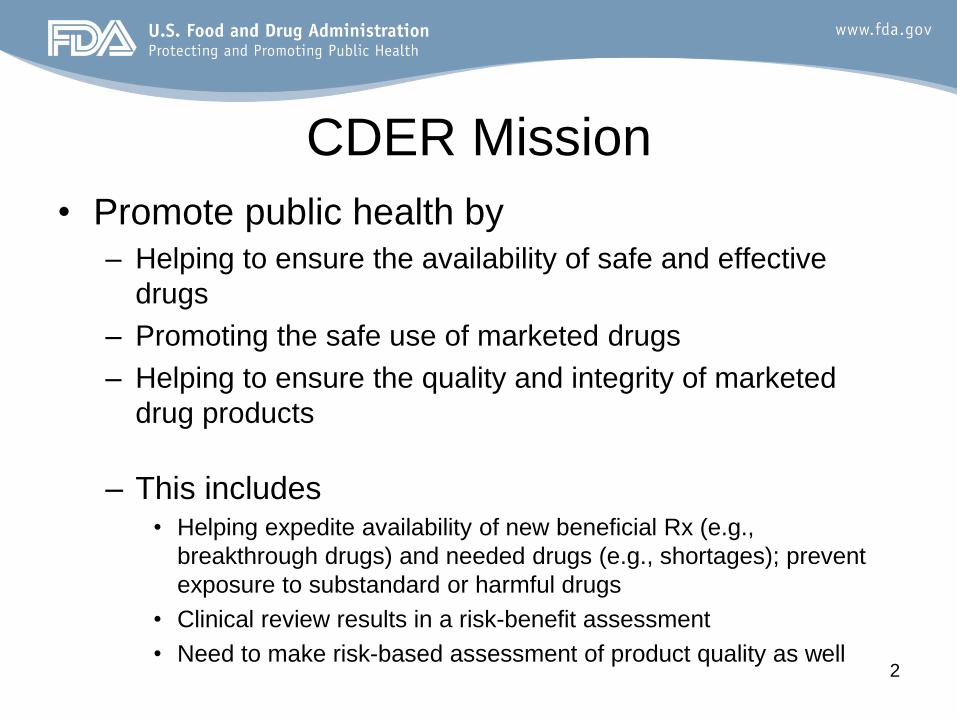
CDER Mission
• Promote public health by
– Helping to ensure the availability of safe and effective
drugs
– Promoting the safe use of marketed drugs
– Helping to ensure the quality and integrity of marketed
drug products
– This includes • Helping expedite availability of new beneficial Rx (e.g.,
breakthrough drugs) and needed drugs (e.g., shortages); prevent
exposure to substandard or harmful drugs
• Clinical review results in a risk-benefit assessment
• Need to make risk-based assessment of product quality as well
2
3
Vision for 21st Century
Manufacturing
“A maximally efficient, agile, flexible
pharmaceutical manufacturing sector that
reliably produces high quality drug products
without extensive regulatory oversight.”
Are we there yet?
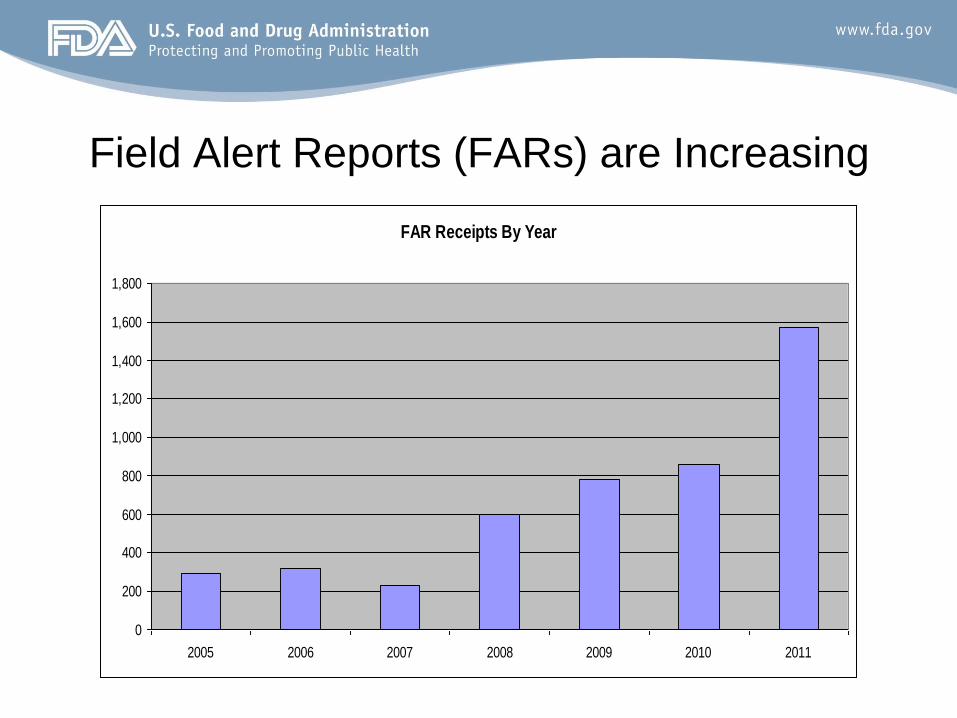
Field Alert Reports (FARs) are Increasing
FAR Receipts By Year
0
200
400
600
800
1,000
1,200
1,400
1,600
1,800
2005 2006 2007 2008 2009 2010 2011
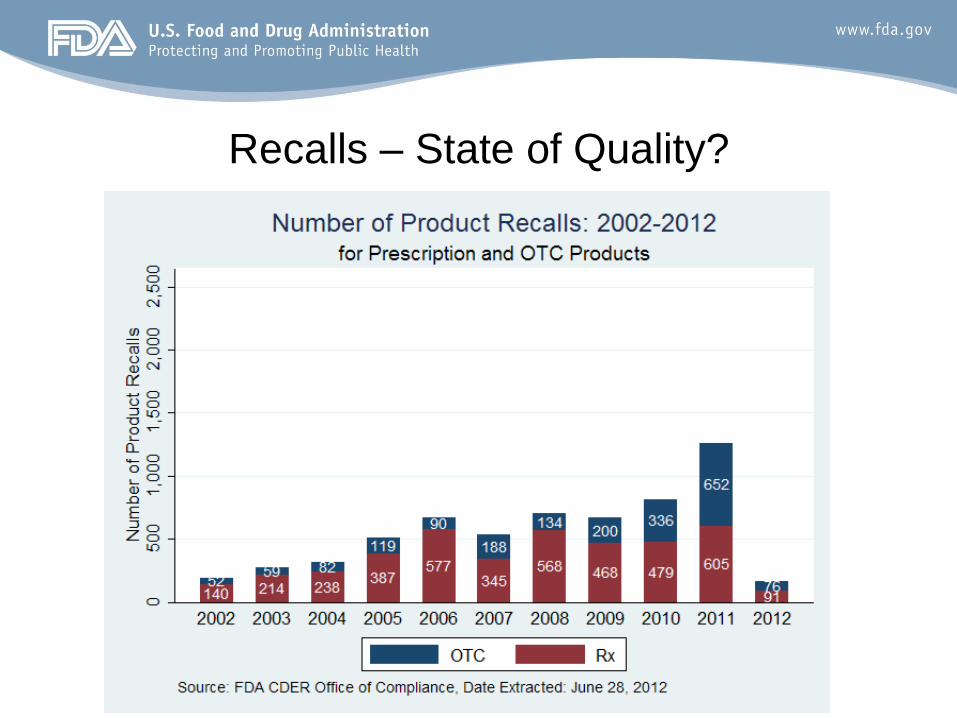
Recalls – State of Quality?
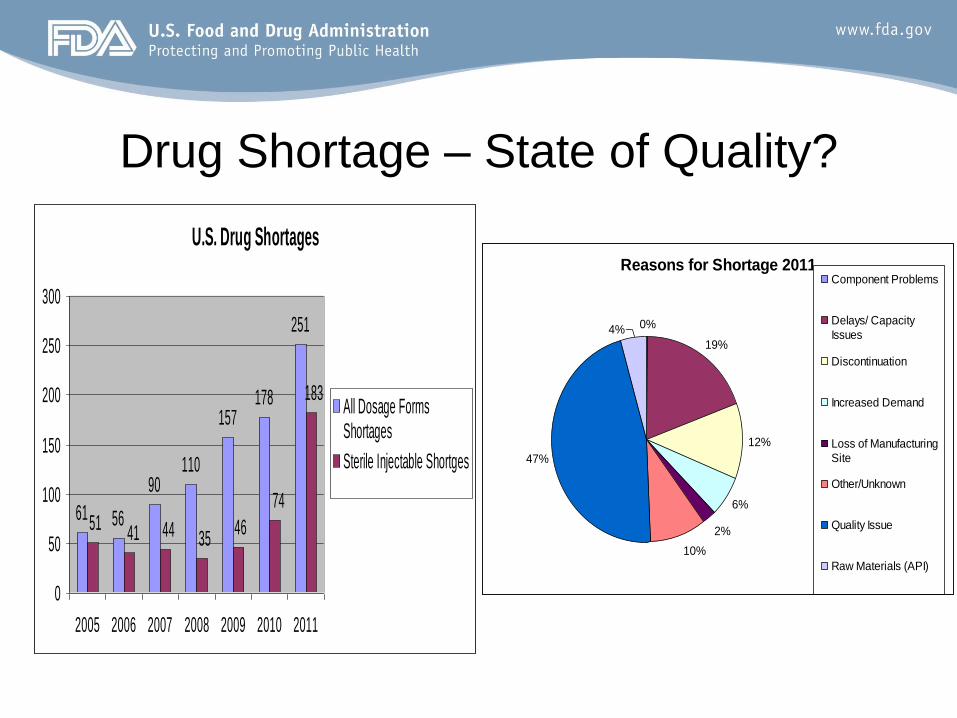
Drug Shortage – State of Quality?
U.S. Drug Shortages
61 56
90110
157178
251
183
74
464151 44 35
0
50
100
150
200
250
300
2005 2006 2007 2008 2009 2010 2011
All Dosage FormsShortages
Sterile Injectable Shortges
Reasons for Shortage 2011
0%
19%
12%
6%
2%
10%
47%
4%
Component Problems
Delays/ Capacity
Issues
Discontinuation
Increased Demand
Loss of Manufacturing
Site
Other/Unknown
Quality Issue
Raw Materials (API)
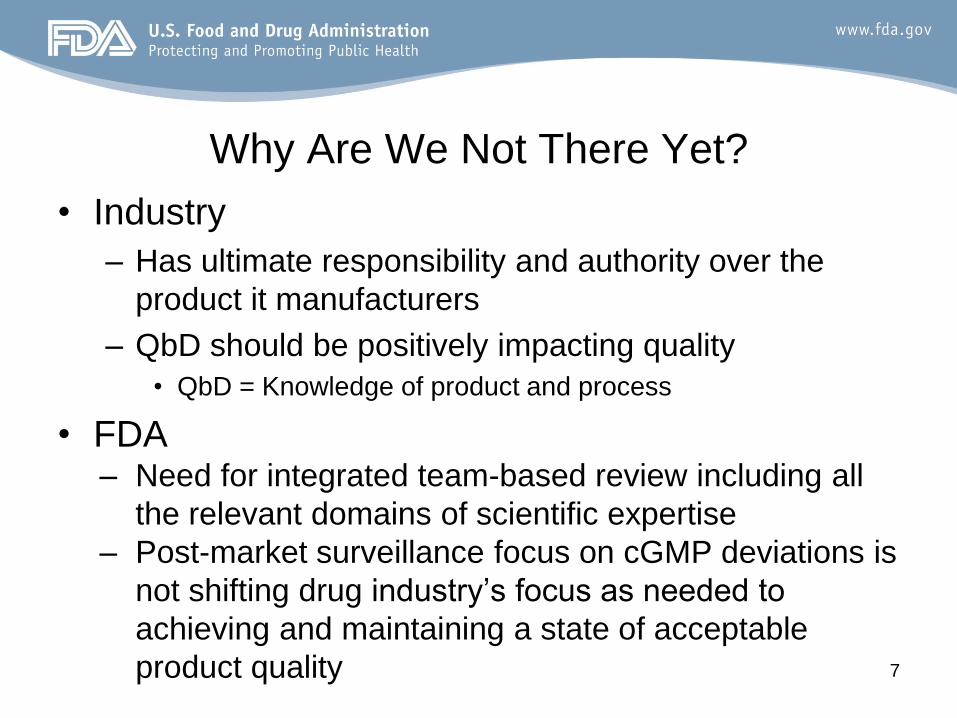
Why Are We Not There Yet?
• Industry
– Has ultimate responsibility and authority over the
product it manufacturers
– QbD should be positively impacting quality
• QbD = Knowledge of product and process
• FDA – Need for integrated team-based review including all
the relevant domains of scientific expertise
– Post-market surveillance focus on cGMP deviations is
not shifting drug industry’s focus as needed to
achieving and maintaining a state of acceptable
product quality 7
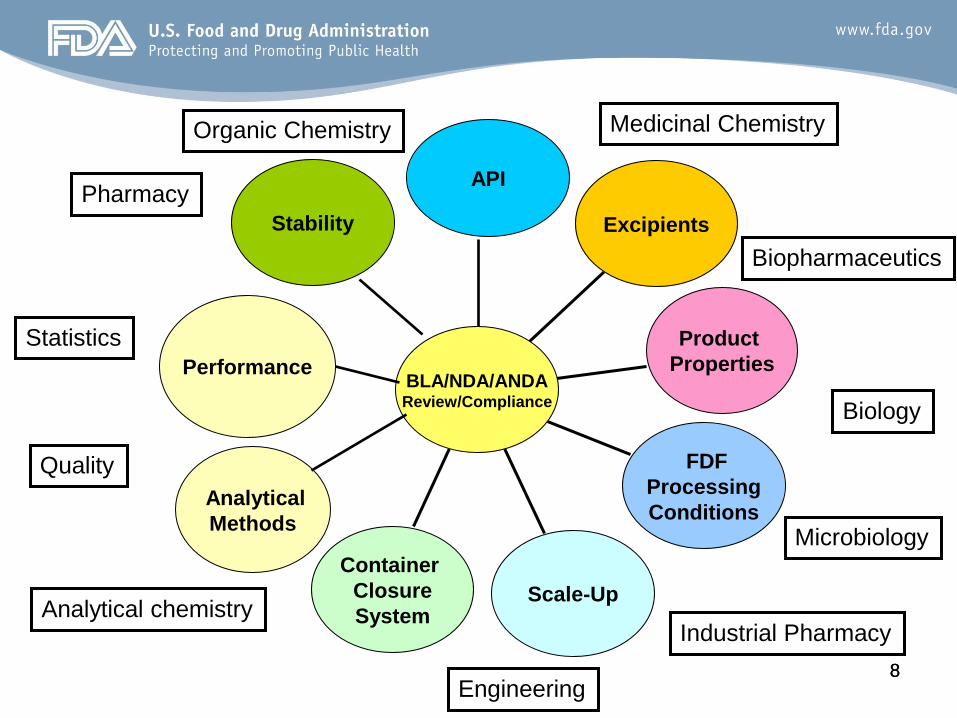
8 8
API
Excipients
Product
Properties
FDF
Processing
Conditions
Scale-Up
Container
Closure
System
Analytical
Methods
Stability
BLA/NDA/ANDA Review/Compliance
Performance
Organic Chemistry
Pharmacy
Industrial Pharmacy
Engineering
Biopharmaceutics
Analytical chemistry
Biology
Microbiology
Quality
Statistics
Medicinal Chemistry
9
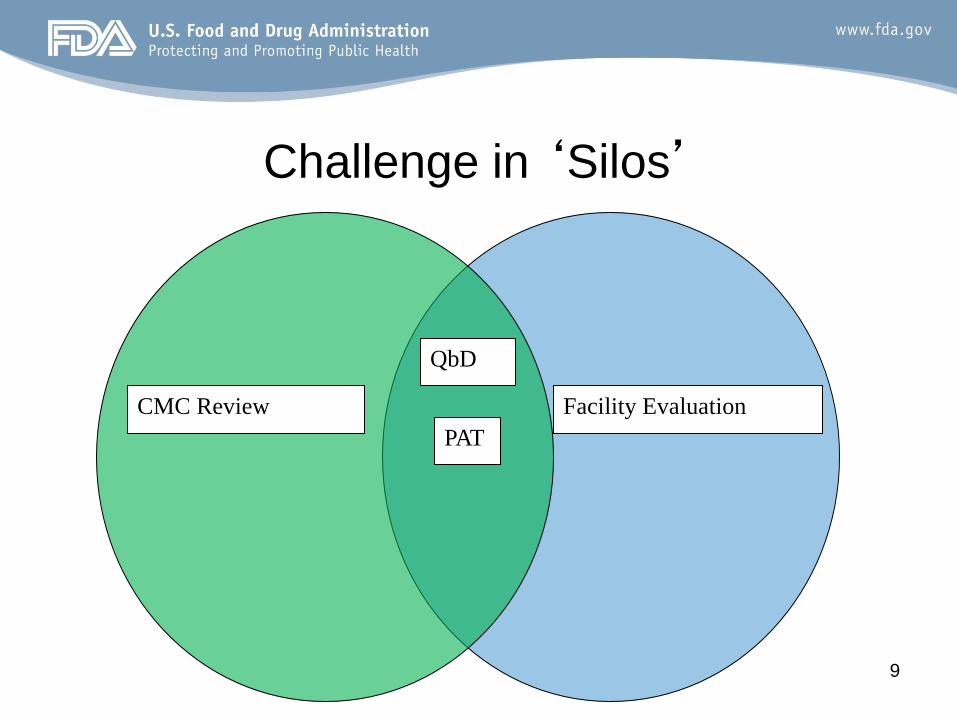
Challenge in ‘Silos’
QbD
PAT
CMC Review Facility Evaluation

10
Historical Focus of Staff
FDA Staffing vs. Patient Exposures
0
2000000
4000000
6000000
8000000
10000000
12000000
14000000
16000000
18000000
1 2 3 4 5 6 7 8 9 10 11 12 13 14 15 16 17 18 19 20 21 22 23 24 25 26 27
Year Post IND Submission
Pati
en
t E
xp
osu
res
0
2
4
6
8
10
12
14
FD
A S
taff
ing
Patients Exposed
FDA Staff
PRE-MARKET FOCUS
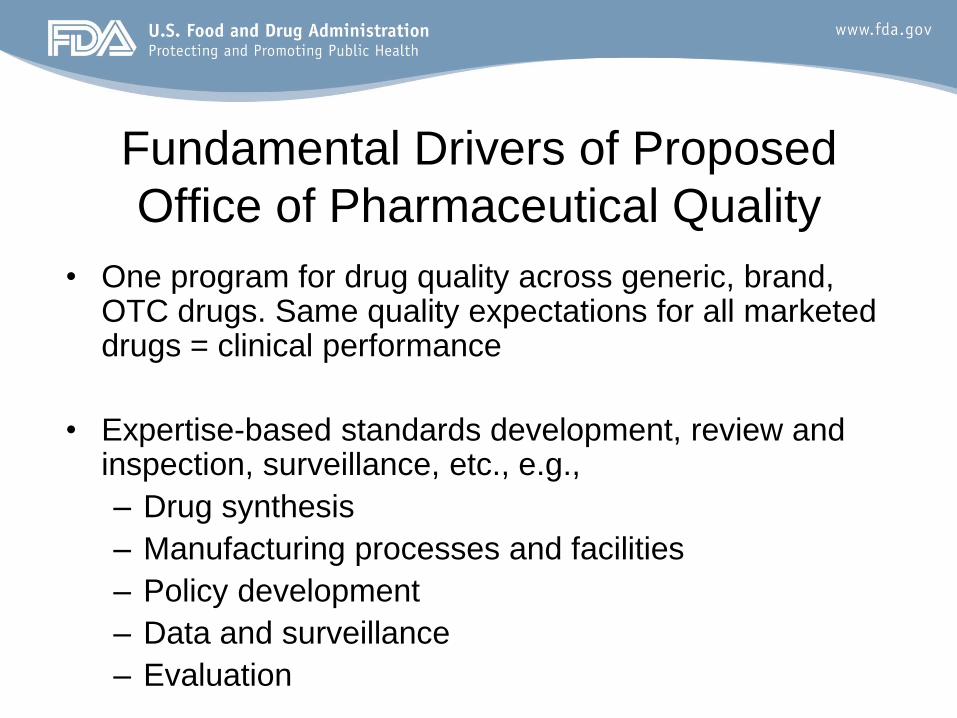
Fundamental Drivers of Proposed
Office of Pharmaceutical Quality
• One program for drug quality across generic, brand, OTC drugs. Same quality expectations for all marketed drugs = clinical performance
• Expertise-based standards development, review and inspection, surveillance, etc., e.g.,
– Drug synthesis
– Manufacturing processes and facilities
– Policy development
– Data and surveillance
– Evaluation
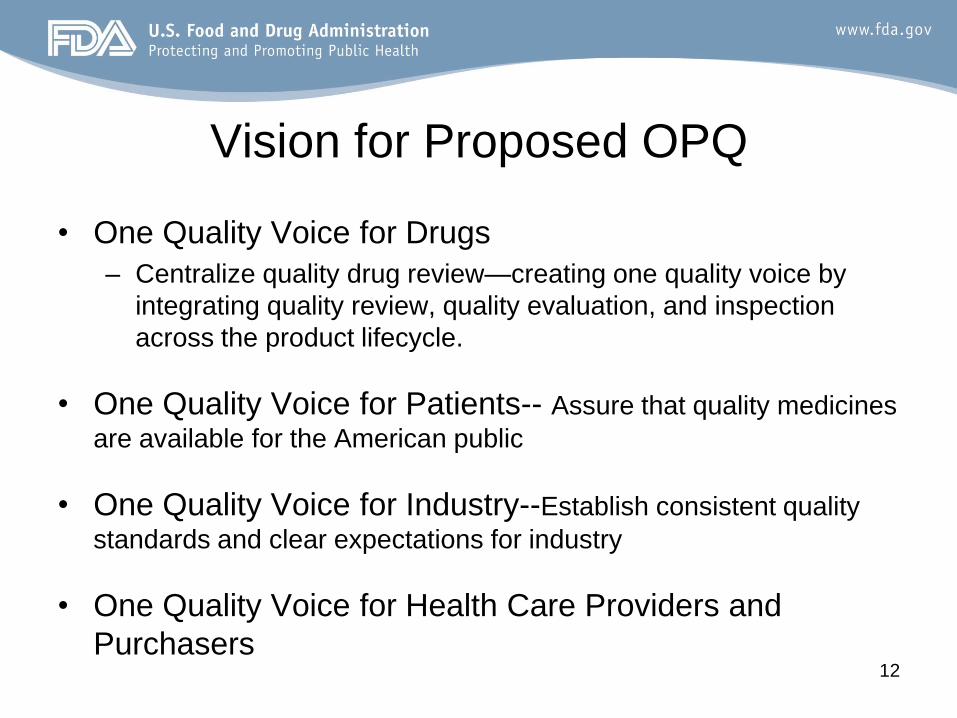
Vision for Proposed OPQ
• One Quality Voice for Drugs
– Centralize quality drug review—creating one quality voice by
integrating quality review, quality evaluation, and inspection
across the product lifecycle.
• One Quality Voice for Patients-- Assure that quality medicines
are available for the American public
• One Quality Voice for Industry--Establish consistent quality
standards and clear expectations for industry
• One Quality Voice for Health Care Providers and
Purchasers 12
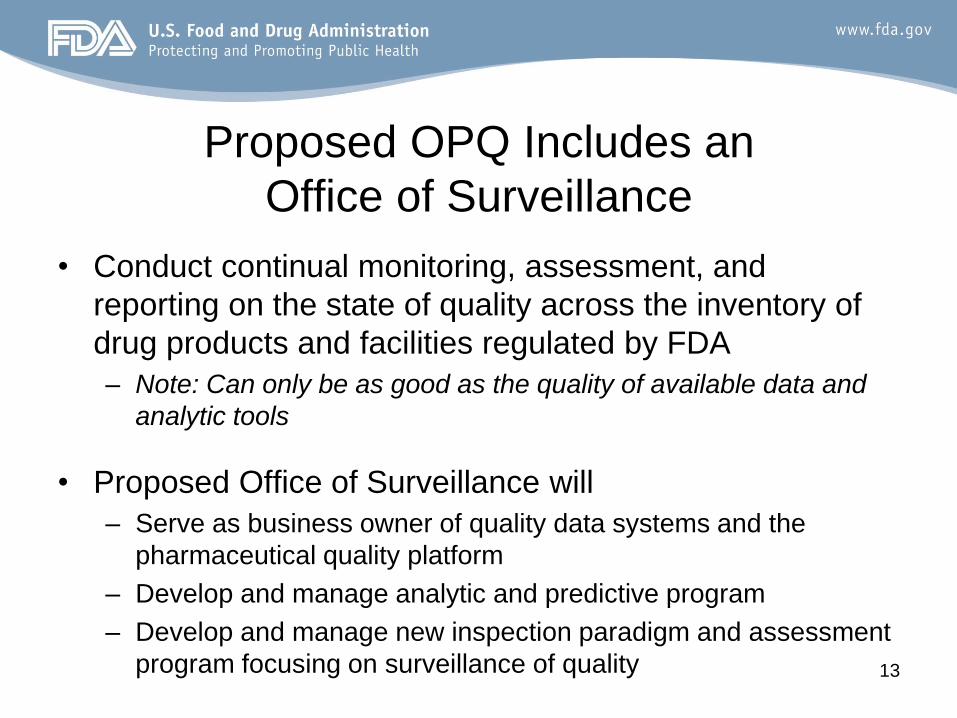
Proposed OPQ Includes an
Office of Surveillance
• Conduct continual monitoring, assessment, and
reporting on the state of quality across the inventory of
drug products and facilities regulated by FDA
– Note: Can only be as good as the quality of available data and
analytic tools
• Proposed Office of Surveillance will
– Serve as business owner of quality data systems and the
pharmaceutical quality platform
– Develop and manage analytic and predictive program
– Develop and manage new inspection paradigm and assessment
program focusing on surveillance of quality 13
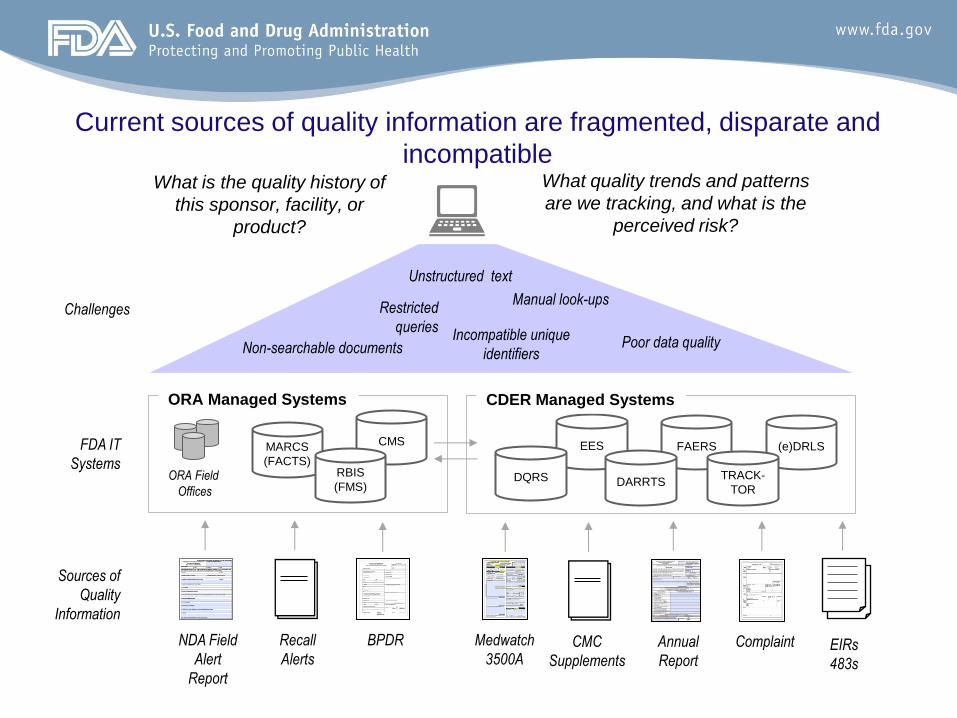
FAERS EES
Current sources of quality information are fragmented, disparate and
incompatible
NDA Field
Alert
Report
Annual
Report
Sources of
Quality
Information
BPDR Medwatch
3500A Complaint Recall
Alerts CMC
Supplements
ORA Managed Systems
MARCS
(FACTS)
ORA Field
Offices
CDER Managed Systems
DQRS DARRTS
CMS
RBIS
(FMS)
FDA IT
Systems (e)DRLS
TRACK-
TOR
EIRs
483s
Unstructured text
Incompatible unique
identifiers Poor data quality Non-searchable documents
Restricted
queries
Manual look-ups Challenges
What is the quality history of
this sponsor, facility, or
product?
What quality trends and patterns
are we tracking, and what is the
perceived risk?
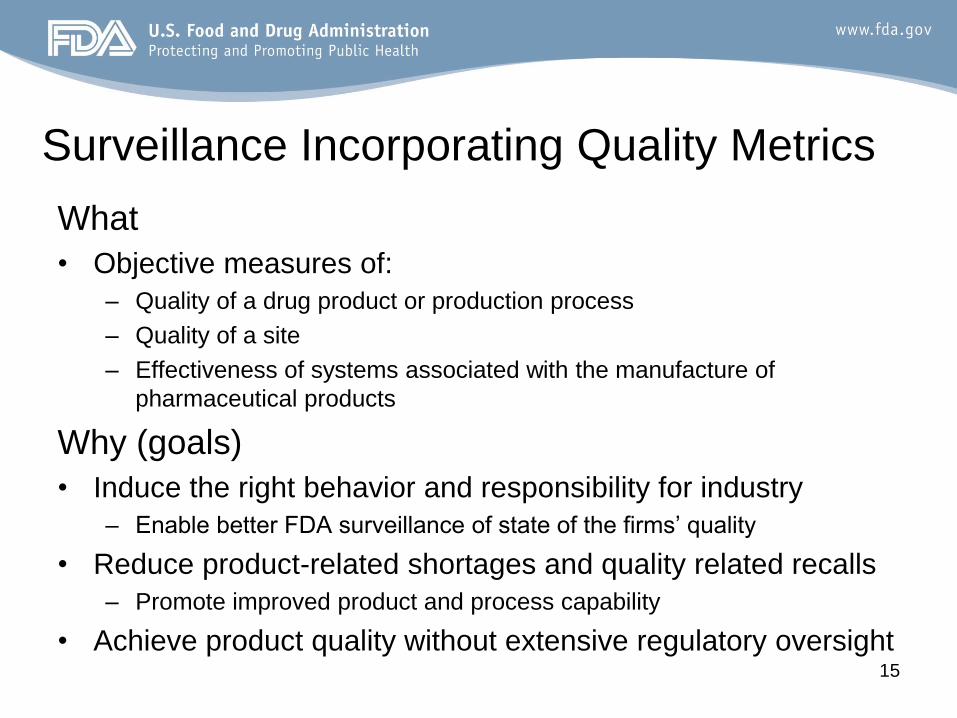
Surveillance Incorporating Quality Metrics
What
• Objective measures of:
– Quality of a drug product or production process
– Quality of a site
– Effectiveness of systems associated with the manufacture of
pharmaceutical products
Why (goals)
• Induce the right behavior and responsibility for industry
– Enable better FDA surveillance of state of the firms’ quality
• Reduce product-related shortages and quality related recalls
– Promote improved product and process capability
• Achieve product quality without extensive regulatory oversight
15
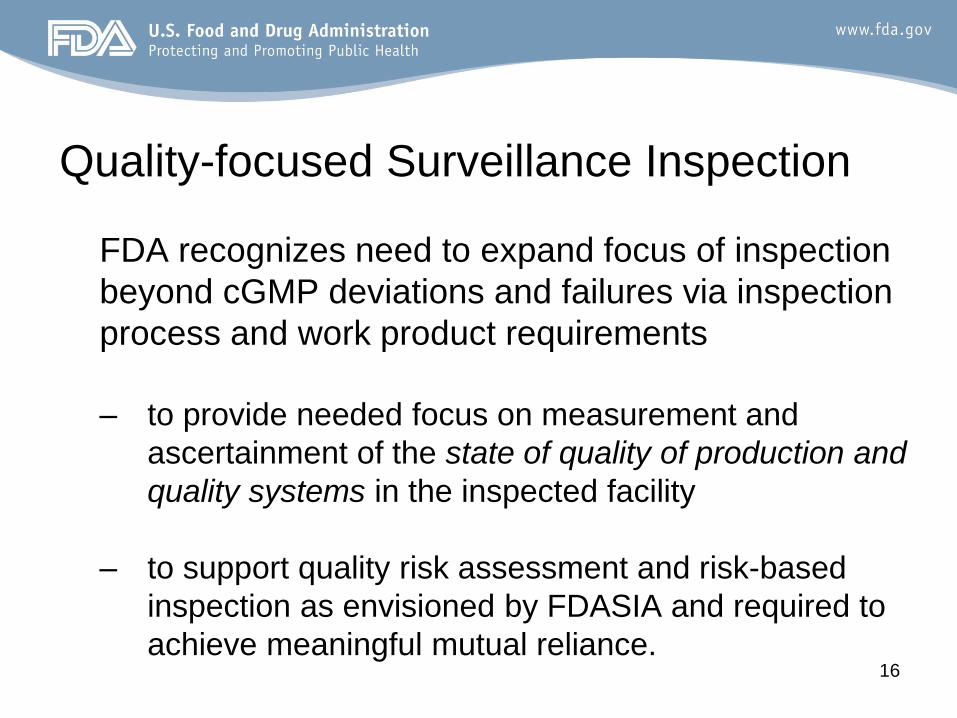
Quality-focused Surveillance Inspection
FDA recognizes need to expand focus of inspection
beyond cGMP deviations and failures via inspection
process and work product requirements
– to provide needed focus on measurement and
ascertainment of the state of quality of production and
quality systems in the inspected facility
– to support quality risk assessment and risk-based
inspection as envisioned by FDASIA and required to
achieve meaningful mutual reliance.
16
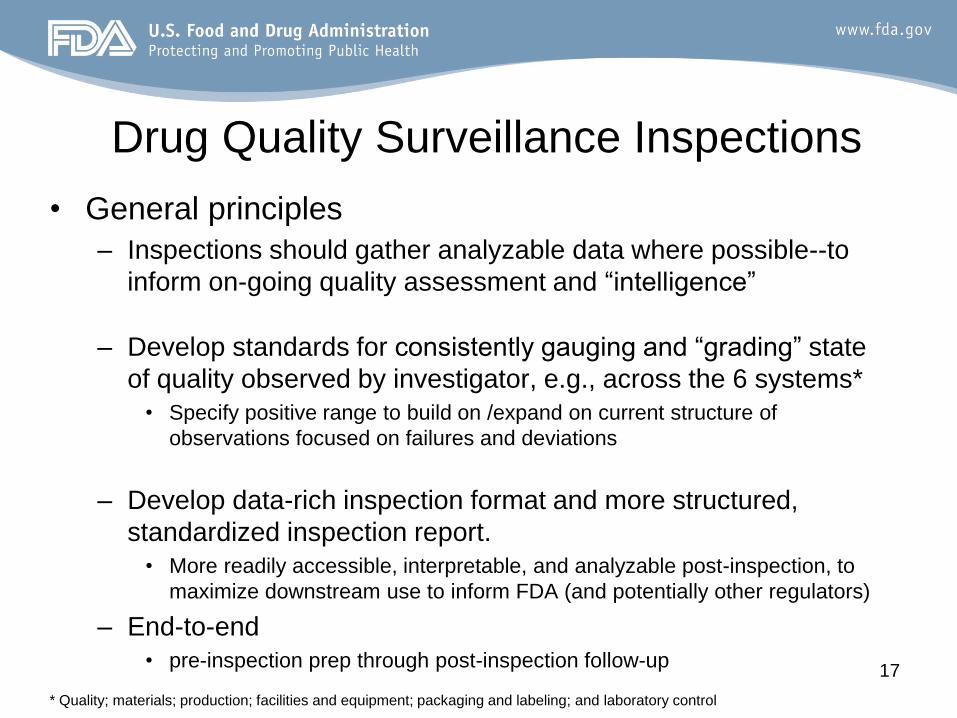
Drug Quality Surveillance Inspections
• General principles
– Inspections should gather analyzable data where possible--to
inform on-going quality assessment and “intelligence”
– Develop standards for consistently gauging and “grading” state
of quality observed by investigator, e.g., across the 6 systems*
• Specify positive range to build on /expand on current structure of
observations focused on failures and deviations
– Develop data-rich inspection format and more structured,
standardized inspection report.
• More readily accessible, interpretable, and analyzable post-inspection, to
maximize downstream use to inform FDA (and potentially other regulators)
– End-to-end
• pre-inspection prep through post-inspection follow-up
* Quality; materials; production; facilities and equipment; packaging and labeling; and laboratory control
17
Quality Metrics Update Stakeholder Feedback, Goals, and Gaps
Russell Wesdyk
CDER/OSP
May 1, 2014
18
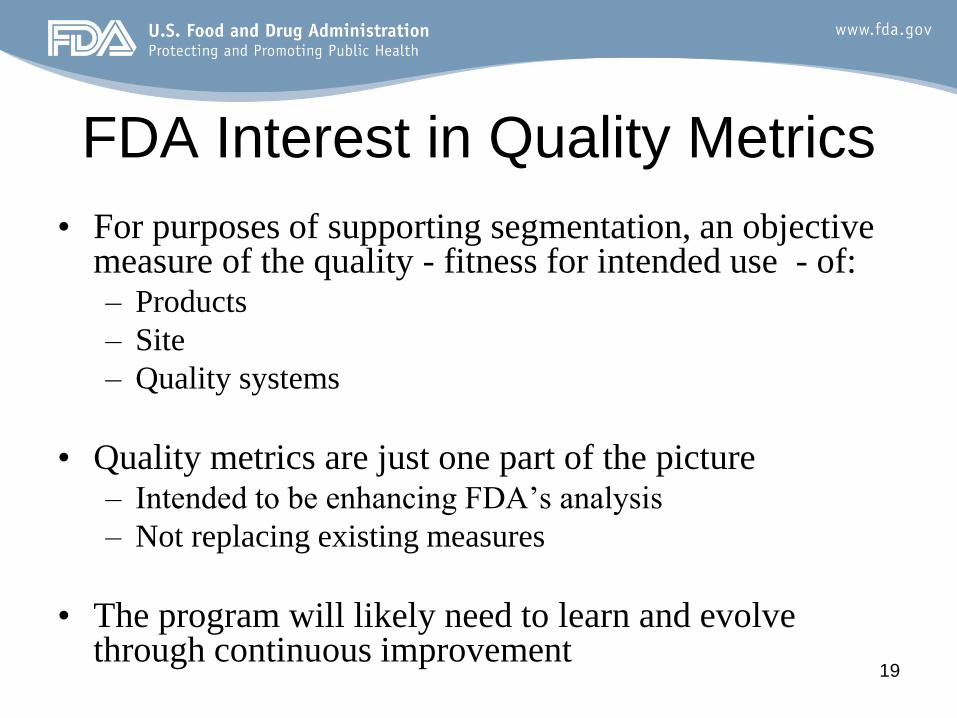
FDA Interest in Quality Metrics
• For purposes of supporting segmentation, an objective measure of the quality - fitness for intended use - of: – Products
– Site
– Quality systems
• Quality metrics are just one part of the picture – Intended to be enhancing FDA’s analysis
– Not replacing existing measures
• The program will likely need to learn and evolve through continuous improvement
19
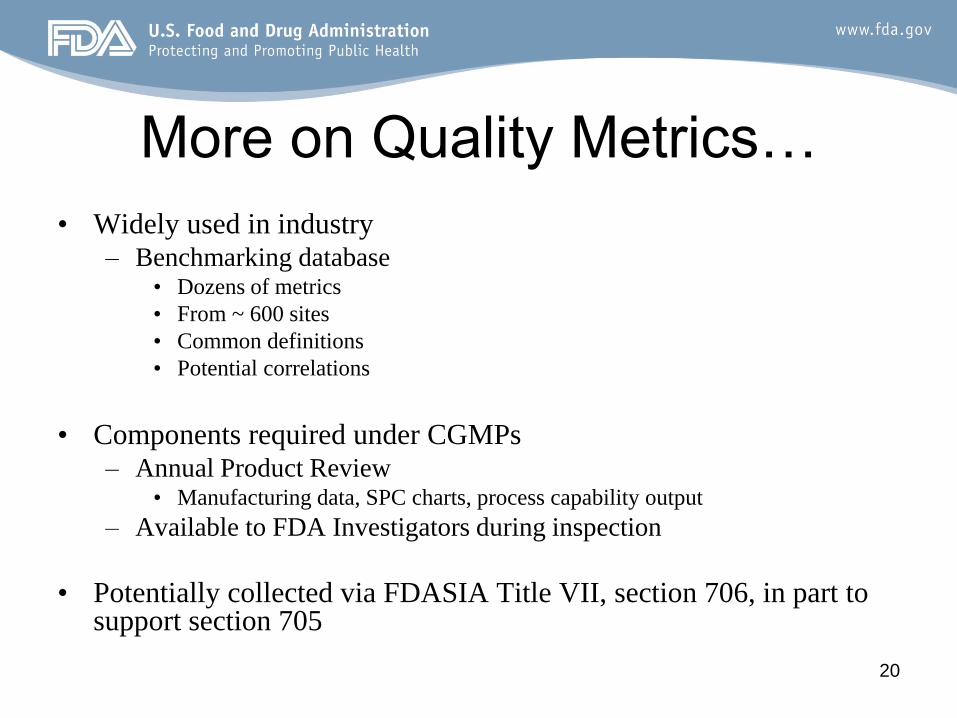
More on Quality Metrics…
• Widely used in industry – Benchmarking database
• Dozens of metrics
• From ~ 600 sites
• Common definitions
• Potential correlations
• Components required under CGMPs – Annual Product Review
• Manufacturing data, SPC charts, process capability output
– Available to FDA Investigators during inspection
• Potentially collected via FDASIA Title VII, section 706, in part to support section 705
20
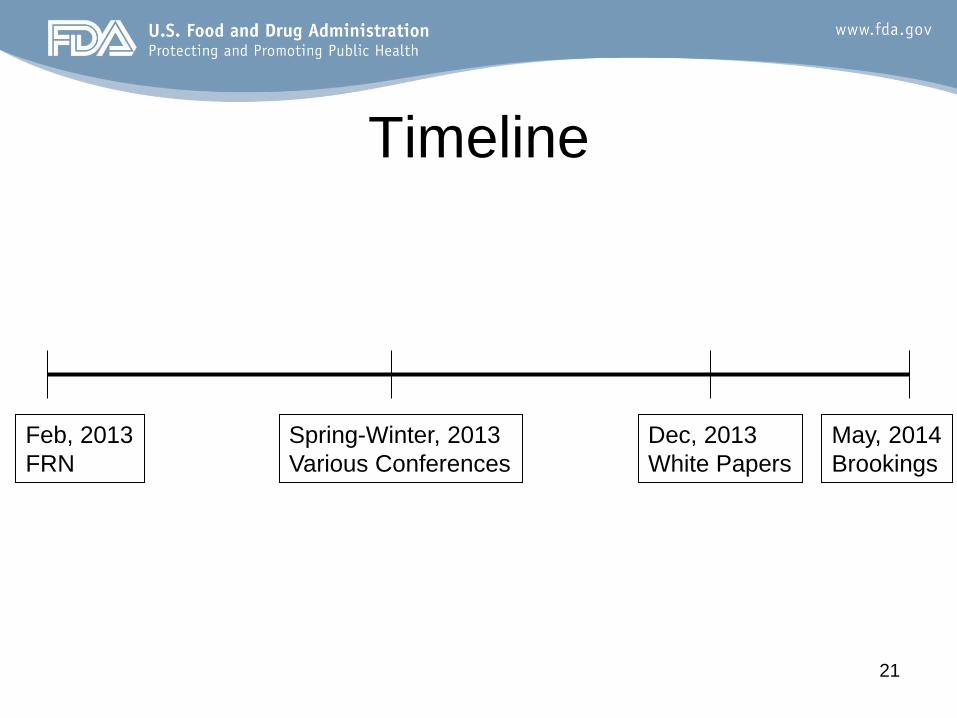
Timeline
21
Feb, 2013
FRN
May, 2014
Brookings
Dec, 2013
White Papers
Spring-Winter, 2013
Various Conferences
22
0%
10%
20%
30%
40%
50%
60%
70%
Opposed Historical RFT BF Complaints PPK Novel
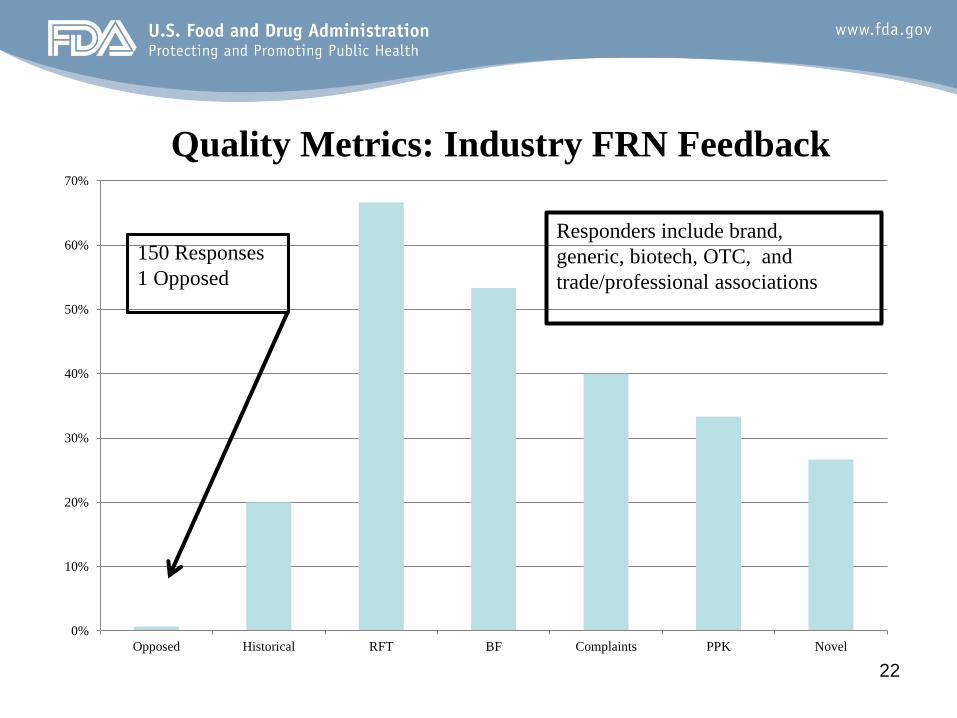
Quality Metrics: Industry FRN Feedback
150 Responses
1 Opposed
Responders include brand,
generic, biotech, OTC, and
trade/professional associations
23 23
Feb1
4
Jan1
4
Dec
13
Nov
13
Oct13
Sep1
3
A ug13
Jul13
Jun1
3
May
13
Apr13
Mar
13
Feb1
3
Jan1
3
0.06
0.04
0.02
0.00
Sample
Pro
po
rti
on
_P=0.01943
UC L=0.05927
LC L=0
1412108642
3
2
1
0
Sample
%D
efe
cti
ve
Upper C I: 2.2074
%Defectiv e: 1.94
Lower C I: 1.36
Upper C I: 2.68
Target: 0.00
PPM Def: 19428
Lower C I: 13643
Upper C I: 26796
Process Z: 2.0657
Lower C I: 1.9301
(95.0% confidence)
Summary Stats
180150120
6
4
2
0
Sample Size
%D
efe
cti
ve
43210
8
6
4
2
0
%Defective
Fre
qu
en
cy
Tar
Binomial Process Capability Analysis of Lots Rejected
P Chart
Tests performed w ith unequal sample sizes
Cumulative %Defective
Rate of Defectives
Histogram
Feb1
4
Jan1
4
Dec
13
Nov
13
Oct13
Sep1
3
A ug13
Jul13
Jun1
3
May
13
Apr
13
Mar
13
F eb13
Jan1
3
0.003
0.002
0.001
0.000
Sample
Pro
po
rti
on
_
P=0.000721
UC L=0.002174
LC L=0
1412108642
0.100
0.075
0.050
0.025
0.000
Sample
%D
efe
cti
ve
Upper C I: 3.3025
%Defectiv e: 0.07
Lower C I: 0.05
Upper C I: 0.10
Target: 0.00
PPM Def: 721
Lower C I: 479
Upper C I: 1042
Process Z: 3.1861
Lower C I: 3.0780
(95.0% confidence)
Summary Stats
300025002000
0.3
0.2
0.1
0.0
Sample Size
%D
efe
cti
ve
0.160.120.080.040.00
8
6
4
2
0
%Defective
Fre
qu
en
cy
Tar
Binomial Process Capability Analysis of OOS
P Chart
Tests performed w ith unequal sample sizes
Cumulative %Defective
Rate of Defectives
Histogram
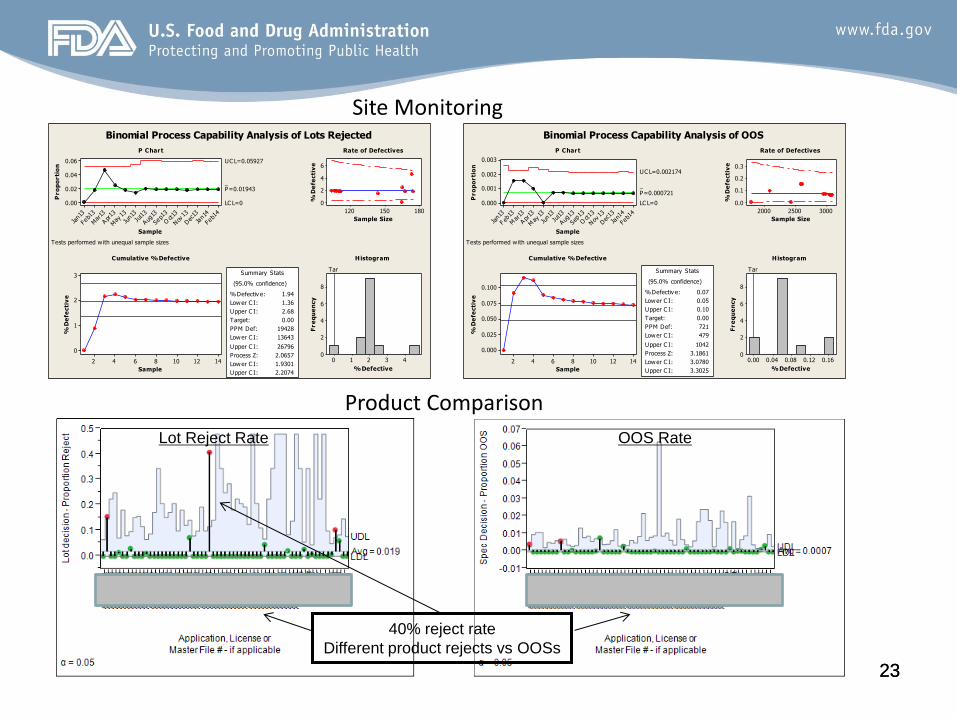
Site Monitoring
Product Comparison
Lot Reject Rate OOS Rate
40% reject rate
Different product rejects vs OOSs
Industry Engagement (White Papers and Conferences)
• BIO
• CHPA
• GPHA
• ISPE
• PDA
• PHRMA
• Individual Companies 24
Consensus Goals
• For firms, the use of quality metrics promotes
responsible practices and quality driven corporate
culture
• For public, a focus on quality leads to fewer recalls
and quality related shortages
• For FDA, industry achieves and is rewarded for
quality, without extensive regulatory oversight
25
26
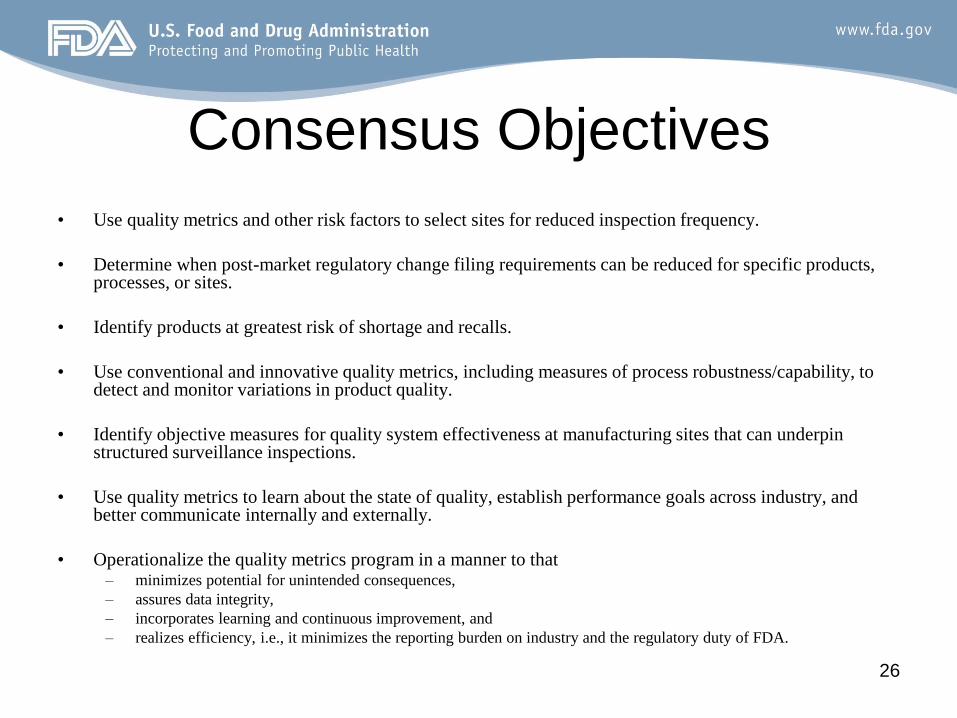
Consensus Objectives
• Use quality metrics and other risk factors to select sites for reduced inspection frequency.
• Determine when post-market regulatory change filing requirements can be reduced for specific products, processes, or sites.
• Identify products at greatest risk of shortage and recalls.
• Use conventional and innovative quality metrics, including measures of process robustness/capability, to detect and monitor variations in product quality.
• Identify objective measures for quality system effectiveness at manufacturing sites that can underpin structured surveillance inspections.
• Use quality metrics to learn about the state of quality, establish performance goals across industry, and better communicate internally and externally.
• Operationalize the quality metrics program in a manner to that – minimizes potential for unintended consequences,
– assures data integrity,
– incorporates learning and continuous improvement, and
– realizes efficiency, i.e., it minimizes the reporting burden on industry and the regulatory duty of FDA.
Categories for “Qualifying” Metrics
• Assess sites
• Assess products
• Assess systems
• Operationalize – Efficiency
– Avoid unintended consequences
• Adequacy for downgrading
27
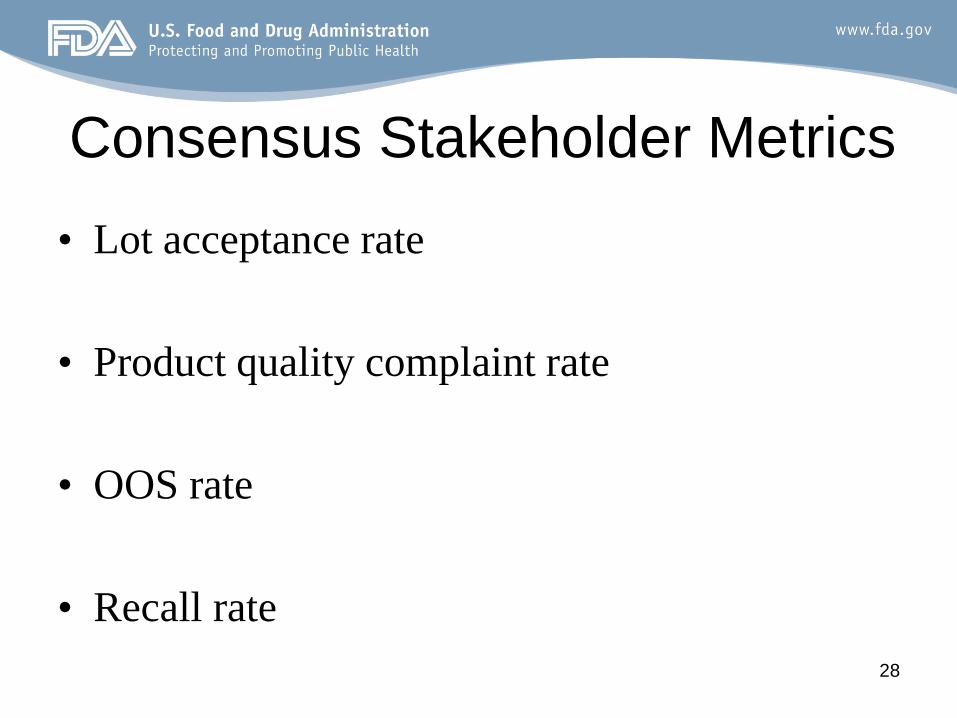
Consensus Stakeholder Metrics
• Lot acceptance rate
• Product quality complaint rate
• OOS rate
• Recall rate
28
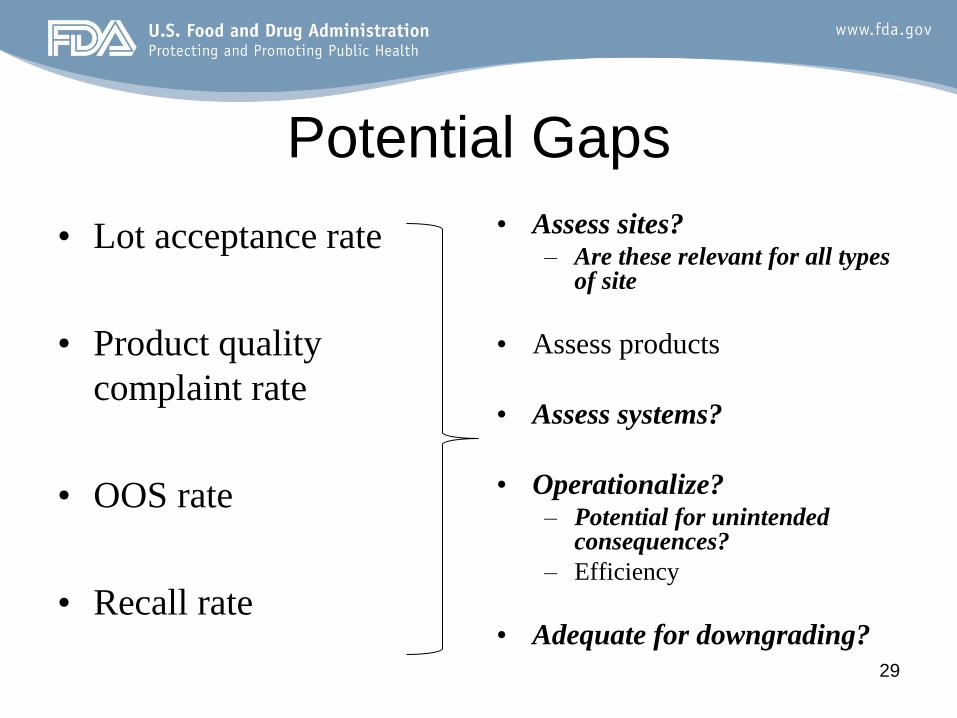
Potential Gaps
• Lot acceptance rate
• Product quality
complaint rate
• OOS rate
• Recall rate
• Assess sites? – Are these relevant for all types
of site
• Assess products
• Assess systems?
• Operationalize? – Potential for unintended
consequences?
– Efficiency
• Adequate for downgrading? 29
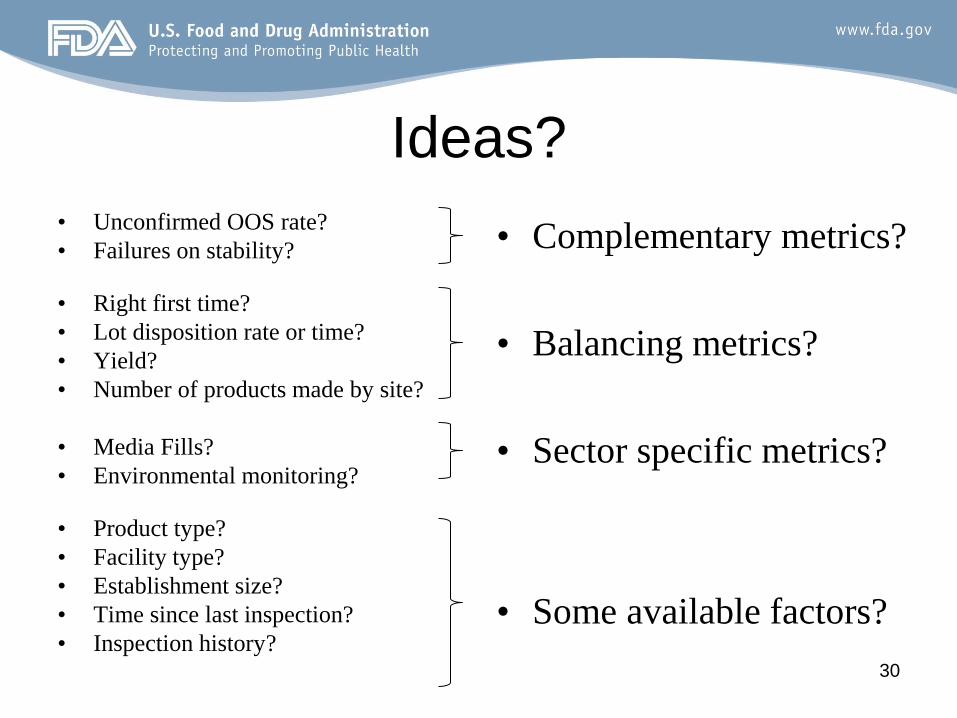
Ideas?
• Unconfirmed OOS rate?
• Failures on stability?
• Right first time?
• Lot disposition rate or time?
• Yield?
• Number of products made by site?
• Media Fills?
• Environmental monitoring?
• Product type?
• Facility type?
• Establishment size?
• Time since last inspection?
• Inspection history?
• Complementary metrics?
• Balancing metrics?
• Sector specific metrics?
• Some available factors?
30
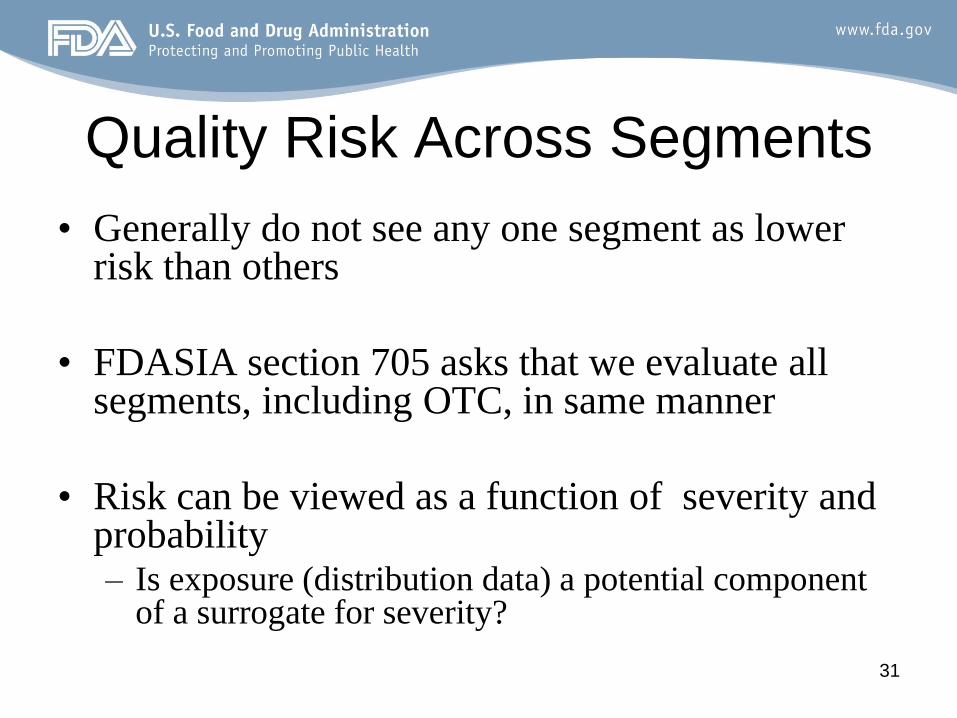
Quality Risk Across Segments
• Generally do not see any one segment as lower risk than others
• FDASIA section 705 asks that we evaluate all segments, including OTC, in same manner
• Risk can be viewed as a function of severity and probability – Is exposure (distribution data) a potential component
of a surrogate for severity?
31
Conclusion
• Received significant input and support from
stakeholders
• Progress on identifying potentially useful
metrics and path forward
• Continued feedback welcomed
32
Attachment 2:
Quality Metrics Discussion Set
Quality Metrics
Discussion Set
Russell Wesdyk
CDER/OSP
May 1, 2014
1
Discussion Set
• Derived and built from stakeholder feedback and regulatory considerations
• An attempt to outline a potential initial metric set to meet the consensus goals and objectives
• This DOES NOT represent current or final FDA views on the topic
• It is solely intended to facilitate discussion and drive towards consensus
2
Discussion Set
• Describes metrics in categories
• Provides inputs and utility description
• All metrics included were taken from stakeholder feedback
• Includes potential collection approach
• Possible definitions
• Outlines sector specific environmental monitoring tracking possibility
3
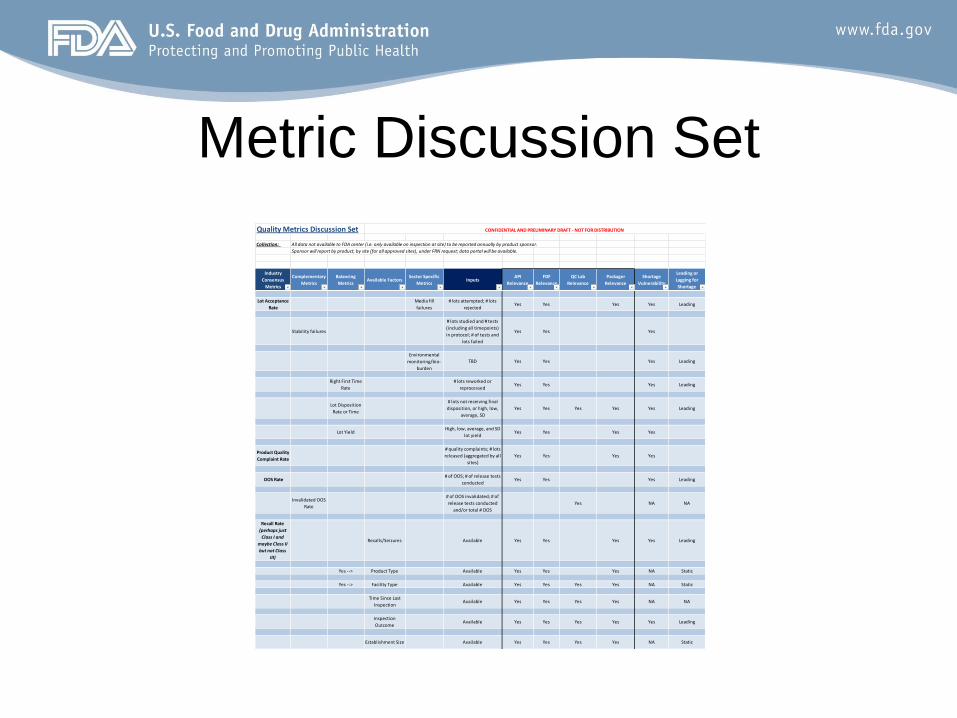
Metric Discussion Set
Quality Metrics Discussion Set
Collection: All data not available to FDA center (i.e. only available on inspection at site) to be reported annually by product sponsor.
Sponsor will report by product, by site (for all approved sites), under FRN request; data portal will be available.
Industry
Consensus
Metrics
Complementary
Metrics
Balancing
MetricsAvailable Factors
Sector Specific
MetricsInputs
API
Relevance
FDF
Relevance
QC Lab
Relevance
Packager
Relevance
Shortage
Vulnerability
Leading or
Lagging for
Shortage
Lot Acceptance
Rate
Media fill
failures
# lots attempted; # lots
rejectedYes Yes Yes Yes Leading
Stability failures
# lots studied and # tests
(including all timepoints)
in protocol; # of tests and
lots failed
Yes Yes Yes
Environmental
monitoring/bio-
burden
TBD Yes Yes Yes Leading
Right First Time
Rate
# lots reworked or
reprocessedYes Yes Yes Leading
Lot Disposition
Rate or Time
# lots not receiving final
disposition, or high, low,
average, SD
Yes Yes Yes Yes Yes Leading
Lot YieldHigh, low, average, and SD
lot yieldYes Yes Yes Yes
Product Quality
Complaint Rate
# quality complaints; # lots
released (aggregated by all
sites)
Yes Yes Yes Yes
OOS Rate# of OOS; # of release tests
conductedYes Yes Yes Leading
Invalidated OOS
Rate
# of OOS invalidated; # of
release tests conducted
and/or total # OOS
Yes NA NA
Recall Rate
(perhaps just
Class I and
maybe Class II
but not Class
III)
Recalls/Seizures Available Yes Yes Yes Yes Leading
Yes --> Product Type Available Yes Yes Yes NA Static
Yes --> Facility Type Available Yes Yes Yes Yes NA Static
Time Since Last
InspectionAvailable Yes Yes Yes Yes NA NA
Inspection
OutcomeAvailable Yes Yes Yes Yes Yes Leading
Establishment Size Available Yes Yes Yes Yes NA Static
CONFIDENTIAL AND PRELIMINARY DRAFT - NOT FOR DISTRIBUTION
Category Descriptions
• Consensus – Majority or unanimous recommendation
• Complementary – Extension of consensus to achieve goals
• Balancing – To address gaming or unintended consequences
• Some available factors – Other potentially relevant factors that arose 5
Inputs and Utility Descriptions
• Inputs describe the data FDA would collect from firms – FDA does all necessary calculations to determine rates, trends, etc…
where indicated/appropriate
• Relevance columns indicate when a metrics is relevant to segmenting a particular type of site
• Utility to shortage vulnerability is also noted
• Leading or lagging nature is indicated for information solely
• A lack of quality system/quality culture metrics is observed – An observation solely for information
6
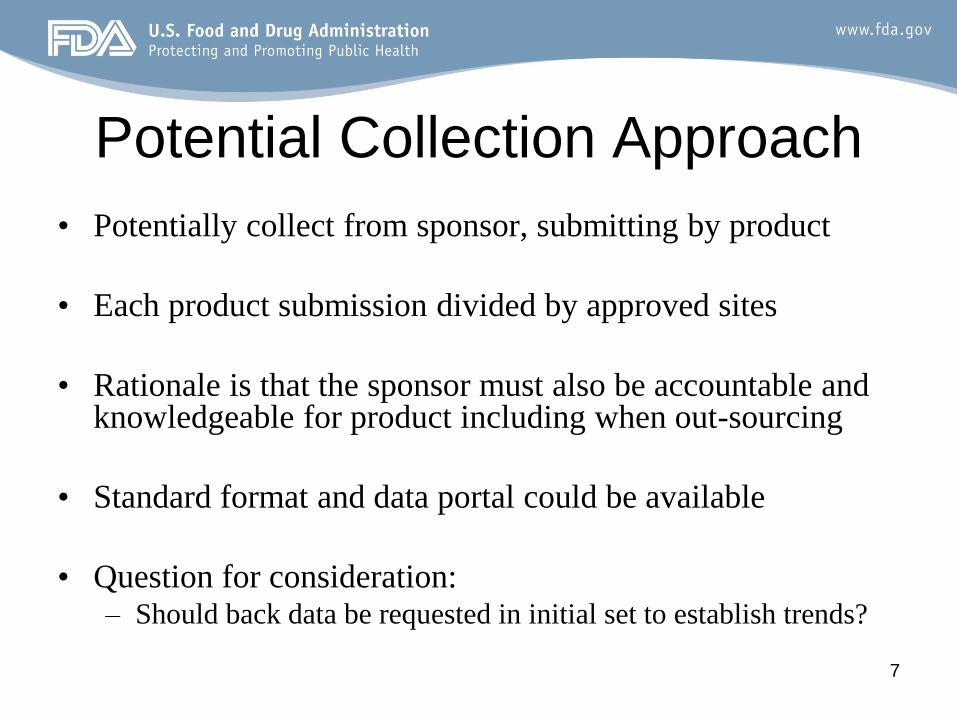
Potential Collection Approach
• Potentially collect from sponsor, submitting by product
• Each product submission divided by approved sites
• Rationale is that the sponsor must also be accountable and knowledgeable for product including when out-sourcing
• Standard format and data portal could be available
• Question for consideration: – Should back data be requested in initial set to establish trends?
7
Definitions
8
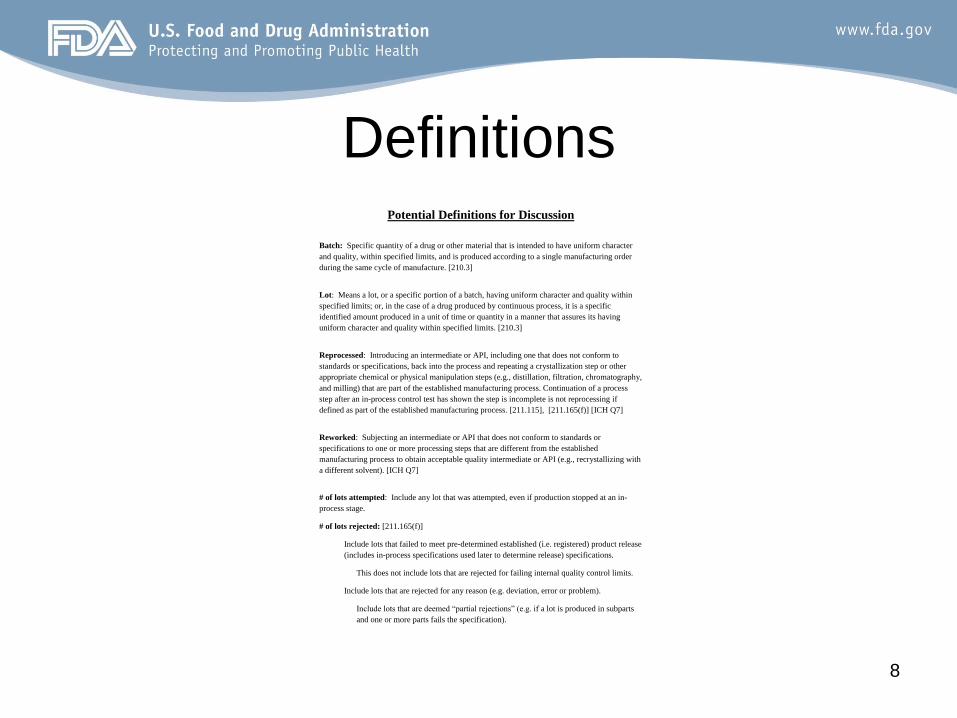
Potential Definitions for Discussion
Batch: Specific quantity of a drug or other material that is intended to have uniform character
and quality, within specified limits, and is produced according to a single manufacturing order
during the same cycle of manufacture. [210.3]
Lot: Means a lot, or a specific portion of a batch, having uniform character and quality within
specified limits; or, in the case of a drug produced by continuous process, it is a specific
identified amount produced in a unit of time or quantity in a manner that assures its having
uniform character and quality within specified limits. [210.3]
Reprocessed: Introducing an intermediate or API, including one that does not conform to
standards or specifications, back into the process and repeating a crystallization step or other
appropriate chemical or physical manipulation steps (e.g., distillation, filtration, chromatography,
and milling) that are part of the established manufacturing process. Continuation of a process
step after an in-process control test has shown the step is incomplete is not reprocessing if
defined as part of the established manufacturing process. [211.115], [211.165(f)] [ICH Q7]
Reworked: Subjecting an intermediate or API that does not conform to standards or
specifications to one or more processing steps that are different from the established
manufacturing process to obtain acceptable quality intermediate or API (e.g., recrystallizing with
a different solvent). [ICH Q7]
# of lots attempted: Include any lot that was attempted, even if production stopped at an in-
process stage.
# of lots rejected: [211.165(f)]
Include lots that failed to meet pre-determined established (i.e. registered) product release
(includes in-process specifications used later to determine release) specifications.
This does not include lots that are rejected for failing internal quality control limits.
Include lots that are rejected for any reason (e.g. deviation, error or problem).
Include lots that are deemed “partial rejections” (e.g. if a lot is produced in subparts
and one or more parts fails the specification).
Environmental Monitoring
9
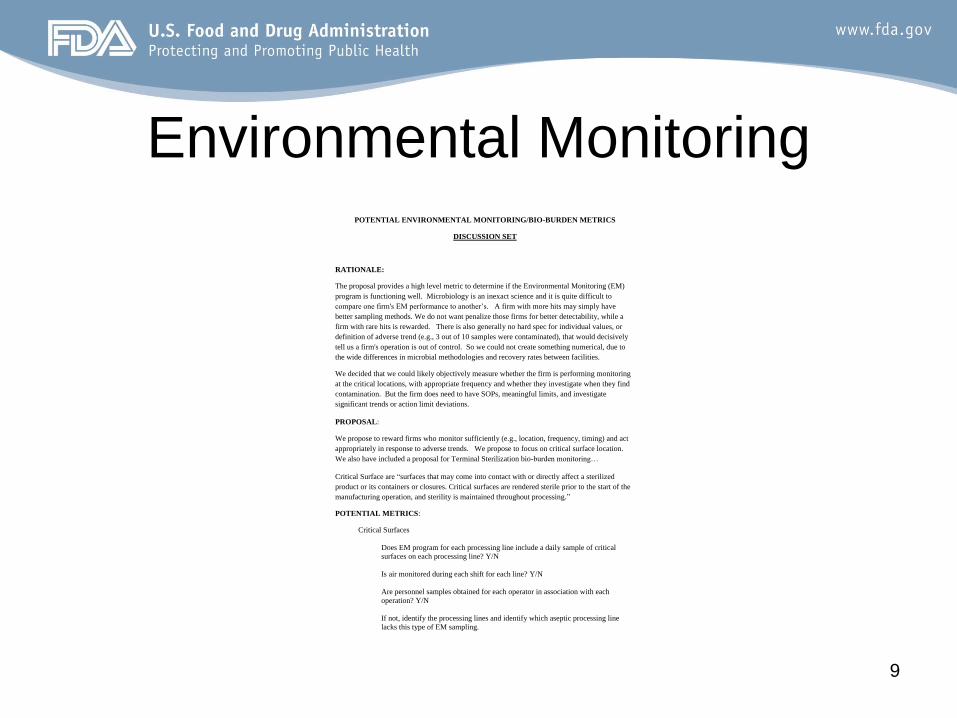
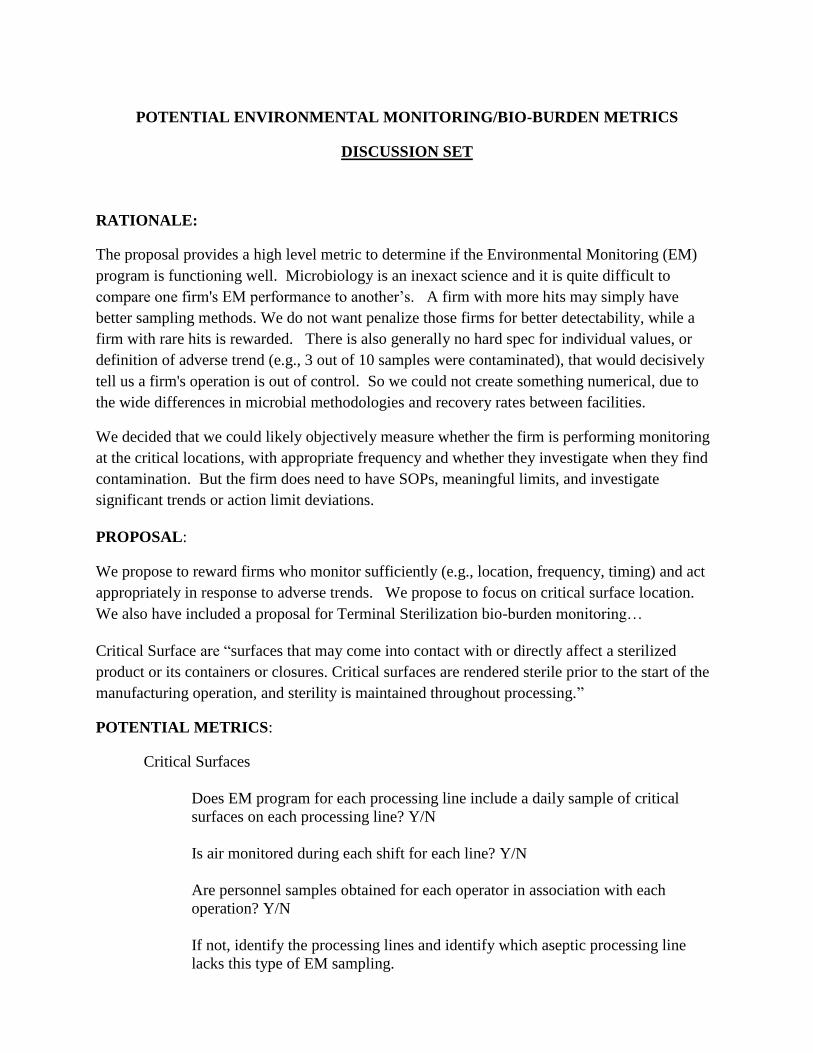
POTENTIAL ENVIRONMENTAL MONITORING/BIO-BURDEN METRICS
DISCUSSION SET
RATIONALE:
The proposal provides a high level metric to determine if the Environmental Monitoring (EM)
program is functioning well. Microbiology is an inexact science and it is quite difficult to
compare one firm's EM performance to another’s. A firm with more hits may simply have
better sampling methods. We do not want penalize those firms for better detectability, while a
firm with rare hits is rewarded. There is also generally no hard spec for individual values, or
definition of adverse trend (e.g., 3 out of 10 samples were contaminated), that would decisively
tell us a firm's operation is out of control. So we could not create something numerical, due to
the wide differences in microbial methodologies and recovery rates between facilities.
We decided that we could likely objectively measure whether the firm is performing monitoring
at the critical locations, with appropriate frequency and whether they investigate when they find
contamination. But the firm does need to have SOPs, meaningful limits, and investigate
significant trends or action limit deviations.
PROPOSAL:
We propose to reward firms who monitor sufficiently (e.g., location, frequency, timing) and act
appropriately in response to adverse trends. We propose to focus on critical surface location.
We also have included a proposal for Terminal Sterilization bio-burden monitoring…
Critical Surface are “surfaces that may come into contact with or directly affect a sterilized
product or its containers or closures. Critical surfaces are rendered sterile prior to the start of the
manufacturing operation, and sterility is maintained throughout processing.”
POTENTIAL METRICS:
Critical Surfaces
Does EM program for each processing line include a daily sample of critical
surfaces on each processing line? Y/N
Is air monitored during each shift for each line? Y/N
Are personnel samples obtained for each operator in association with each
operation? Y/N
If not, identify the processing lines and identify which aseptic processing line
lacks this type of EM sampling.

Quality Metrics Discussion Set
CONFIDENTIAL AND PRELIMINARY DRAFT - NOT FOR DISTRIBUTIONIndustry Consensus
Metrics
Complementary
MetricsBalancing Metrics Available Factors
Sector Specific
MetricsInputs API Relevance
FDF
RelevanceQC Lab Relevance
Packager
Relevance
Shortage
Vulnerability
Leading or
Lagging for
Shortage
Leading or Lagging
for Site Selection
Lot Acceptance
Rate Media fill failures
# lots attempted; # lots
rejectedYes Yes Yes Yes Leading Possibly both
Stability failures
# lots studied and # tests
(including all timepoints) in
protocol; # of tests and lots
failed
Yes Yes Yes
Environmental
monitoring/bio-
burden
TBD Yes Yes Yes Leading Leading
Right First Time
Rate
# lots reworked or
reprocessedYes Yes Yes Leading Leading
Lot Disposition
Rate or Time
# lots not receiving final
disposition, or high, low,
average, SD
Yes Yes Yes Yes Yes Leading Leading
Lot YieldHigh, low, average, and SD lot
yieldYes Yes Yes Yes Possibly both
Product Quality
Complaint Rate
# quality complaints; # lots
released (aggregated by all
sites)
Yes Yes Yes Yes Lagging
OOS Rate# of OOS; # of release tests
conductedYes Yes Yes Leading Possibly both
Invalidated OOS
Rate
# of OOS invalidated; # of
release tests conducted
and/or total # OOS
Yes NA NA Possibly both
Recall Rate
(perhaps just Class
I, maybe Class II)
Recalls/Seizures Available Yes Yes Yes Yes Leading Lagging
Yes --> Product Type Available Yes Yes Yes NA Static Static
Yes --> Facility Type Available Yes Yes Yes Yes NA Static Static
Time Since Last
InspectionAvailable Yes Yes Yes Yes NA NA NA
Inspection Outcome Available Yes Yes Yes Yes Yes Leading Lagging
Establishment Size Available Yes Yes Yes Yes NA Static Static
Product Market
ShareAvailable Yes Leading NA
Number of
Products
Produced by Site
Number of SKUs produced at
siteYes Yes Yes Yes NA NA Possibly both
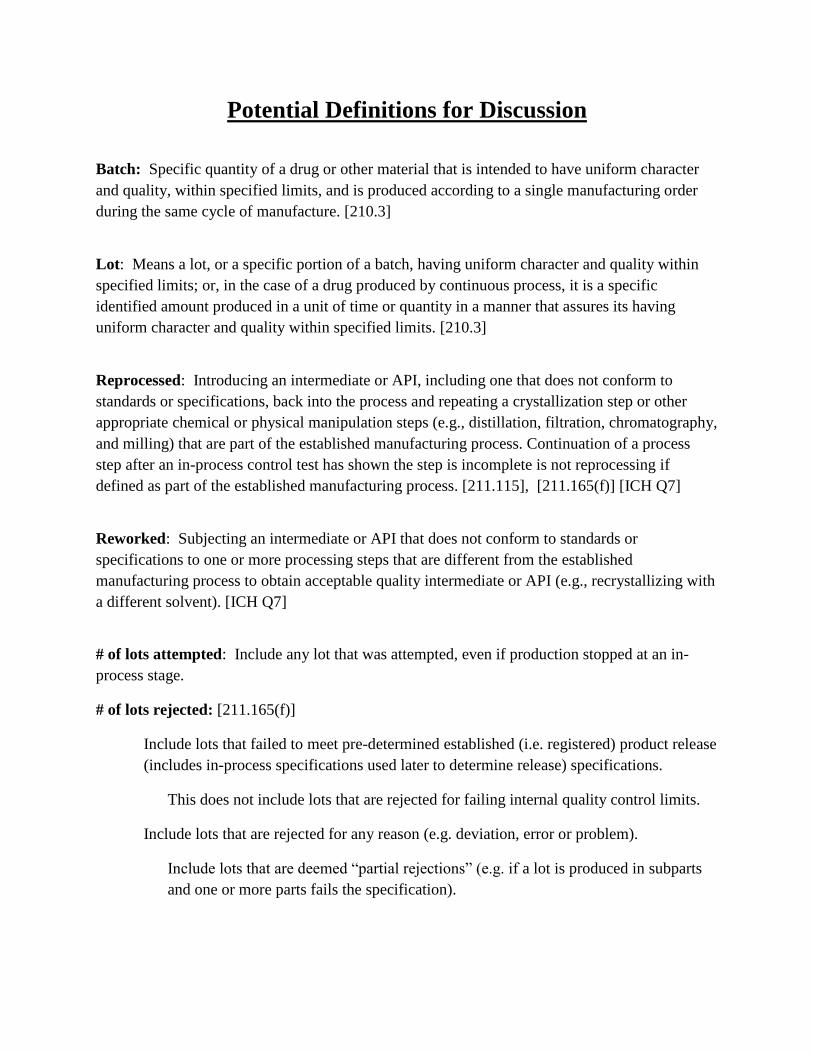
Potential Definitions for Discussion
Batch: Specific quantity of a drug or other material that is intended to have uniform character
and quality, within specified limits, and is produced according to a single manufacturing order
during the same cycle of manufacture. [210.3]
Lot: Means a lot, or a specific portion of a batch, having uniform character and quality within
specified limits; or, in the case of a drug produced by continuous process, it is a specific
identified amount produced in a unit of time or quantity in a manner that assures its having
uniform character and quality within specified limits. [210.3]
Reprocessed: Introducing an intermediate or API, including one that does not conform to
standards or specifications, back into the process and repeating a crystallization step or other
appropriate chemical or physical manipulation steps (e.g., distillation, filtration, chromatography,
and milling) that are part of the established manufacturing process. Continuation of a process
step after an in-process control test has shown the step is incomplete is not reprocessing if
defined as part of the established manufacturing process. [211.115], [211.165(f)] [ICH Q7]
Reworked: Subjecting an intermediate or API that does not conform to standards or
specifications to one or more processing steps that are different from the established
manufacturing process to obtain acceptable quality intermediate or API (e.g., recrystallizing with
a different solvent). [ICH Q7]
# of lots attempted: Include any lot that was attempted, even if production stopped at an in-
process stage.
# of lots rejected: [211.165(f)]
Include lots that failed to meet pre-determined established (i.e. registered) product release
(includes in-process specifications used later to determine release) specifications.
This does not include lots that are rejected for failing internal quality control limits.
Include lots that are rejected for any reason (e.g. deviation, error or problem).
Include lots that are deemed “partial rejections” (e.g. if a lot is produced in subparts
and one or more parts fails the specification).
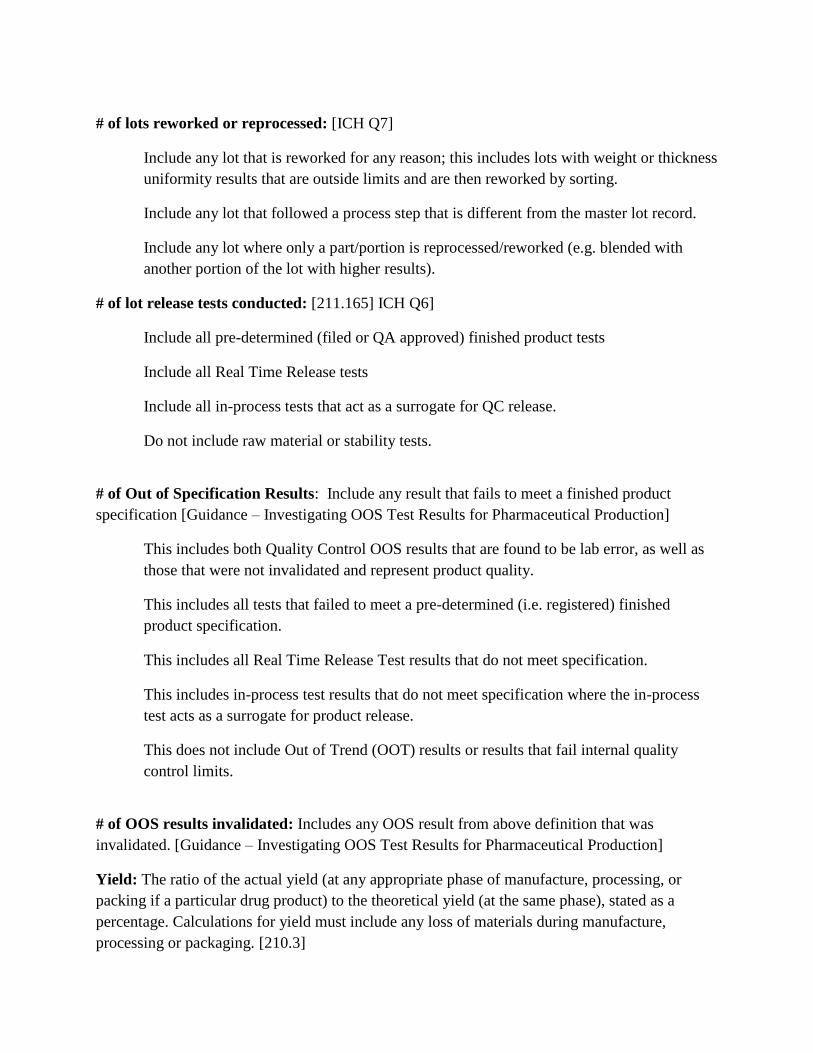
# of lots reworked or reprocessed: [ICH Q7]
Include any lot that is reworked for any reason; this includes lots with weight or thickness
uniformity results that are outside limits and are then reworked by sorting.
Include any lot that followed a process step that is different from the master lot record.
Include any lot where only a part/portion is reprocessed/reworked (e.g. blended with
another portion of the lot with higher results).
# of lot release tests conducted: [211.165] ICH Q6]
Include all pre-determined (filed or QA approved) finished product tests
Include all Real Time Release tests
Include all in-process tests that act as a surrogate for QC release.
Do not include raw material or stability tests.
# of Out of Specification Results: Include any result that fails to meet a finished product
specification [Guidance – Investigating OOS Test Results for Pharmaceutical Production]
This includes both Quality Control OOS results that are found to be lab error, as well as
those that were not invalidated and represent product quality.
This includes all tests that failed to meet a pre-determined (i.e. registered) finished
product specification.
This includes all Real Time Release Test results that do not meet specification.
This includes in-process test results that do not meet specification where the in-process
test acts as a surrogate for product release.
This does not include Out of Trend (OOT) results or results that fail internal quality
control limits.
# of OOS results invalidated: Includes any OOS result from above definition that was
invalidated. [Guidance – Investigating OOS Test Results for Pharmaceutical Production]
Yield: The ratio of the actual yield (at any appropriate phase of manufacture, processing, or
packing if a particular drug product) to the theoretical yield (at the same phase), stated as a
percentage. Calculations for yield must include any loss of materials during manufacture,
processing or packaging. [210.3]
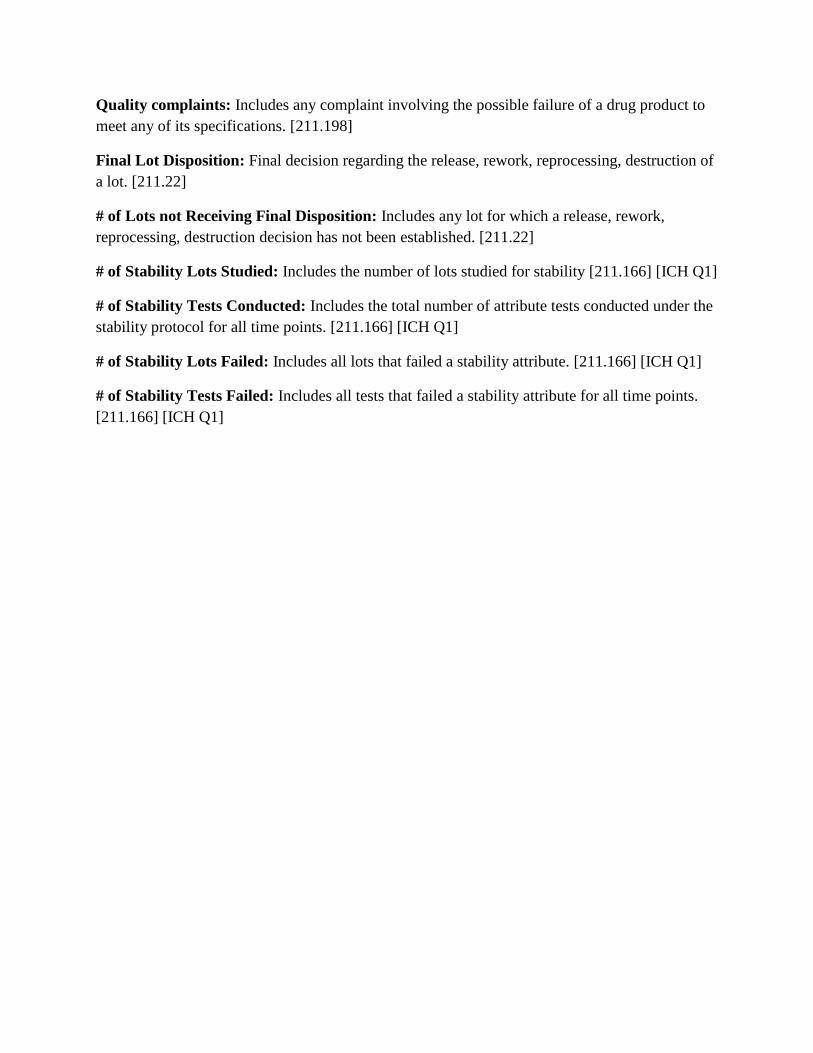
Quality complaints: Includes any complaint involving the possible failure of a drug product to
meet any of its specifications. [211.198]
Final Lot Disposition: Final decision regarding the release, rework, reprocessing, destruction of
a lot. [211.22]
# of Lots not Receiving Final Disposition: Includes any lot for which a release, rework,
reprocessing, destruction decision has not been established. [211.22]
# of Stability Lots Studied: Includes the number of lots studied for stability [211.166] [ICH Q1]
# of Stability Tests Conducted: Includes the total number of attribute tests conducted under the
stability protocol for all time points. [211.166] [ICH Q1]
# of Stability Lots Failed: Includes all lots that failed a stability attribute. [211.166] [ICH Q1]
# of Stability Tests Failed: Includes all tests that failed a stability attribute for all time points.
[211.166] [ICH Q1]
POTENTIAL ENVIRONMENTAL MONITORING/BIO-BURDEN METRICS
DISCUSSION SET
RATIONALE:
The proposal provides a high level metric to determine if the Environmental Monitoring (EM)
program is functioning well. Microbiology is an inexact science and it is quite difficult to
compare one firm's EM performance to another’s. A firm with more hits may simply have
better sampling methods. We do not want penalize those firms for better detectability, while a
firm with rare hits is rewarded. There is also generally no hard spec for individual values, or
definition of adverse trend (e.g., 3 out of 10 samples were contaminated), that would decisively
tell us a firm's operation is out of control. So we could not create something numerical, due to
the wide differences in microbial methodologies and recovery rates between facilities.
We decided that we could likely objectively measure whether the firm is performing monitoring
at the critical locations, with appropriate frequency and whether they investigate when they find
contamination. But the firm does need to have SOPs, meaningful limits, and investigate
significant trends or action limit deviations.
PROPOSAL:
We propose to reward firms who monitor sufficiently (e.g., location, frequency, timing) and act
appropriately in response to adverse trends. We propose to focus on critical surface location.
We also have included a proposal for Terminal Sterilization bio-burden monitoring…
Critical Surface are “surfaces that may come into contact with or directly affect a sterilized
product or its containers or closures. Critical surfaces are rendered sterile prior to the start of the
manufacturing operation, and sterility is maintained throughout processing.”
POTENTIAL METRICS:
Critical Surfaces
Does EM program for each processing line include a daily sample of critical
surfaces on each processing line? Y/N
Is air monitored during each shift for each line? Y/N
Are personnel samples obtained for each operator in association with each
operation? Y/N
If not, identify the processing lines and identify which aseptic processing line
lacks this type of EM sampling.
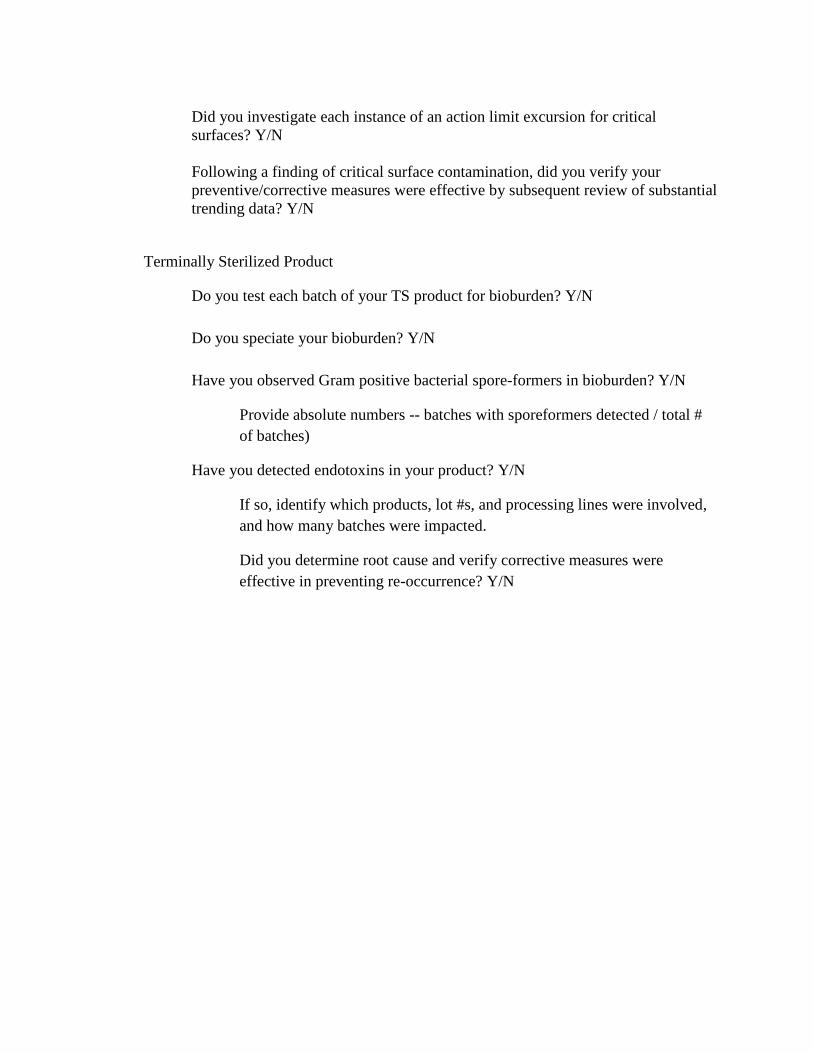
Did you investigate each instance of an action limit excursion for critical
surfaces? Y/N
Following a finding of critical surface contamination, did you verify your
preventive/corrective measures were effective by subsequent review of substantial
trending data? Y/N
Terminally Sterilized Product
Do you test each batch of your TS product for bioburden? Y/N
Do you speciate your bioburden? Y/N
Have you observed Gram positive bacterial spore-formers in bioburden? Y/N
Provide absolute numbers -- batches with sporeformers detected / total #
of batches)
Have you detected endotoxins in your product? Y/N
If so, identify which products, lot #s, and processing lines were involved,
and how many batches were impacted.
Did you determine root cause and verify corrective measures were
effective in preventing re-occurrence? Y/N