measuring innovation and smart specialisation – what have we learned? dirk pilat, oecd
TRANSCRIPT

Measuring Innovation and Smart Specialisation – What have we Learned?
Dirk Pilat, OECD

Outline
• What drives innovation performance?o Investment in education and knowledgeo Interactions and knowledge flowso Innovation dynamics
• Looking at outcomes and impacts• Linking innovation to policy• Innovation and smart specialisation• Gaps and a measurement agenda

Large disparities in education across regions …
56 54 53 5149 47 47 46
44 43 42 42 42 41 40 39 38 38 38 37 37 35 34 34 3430 29 29
2622
53
38
29
3537
32
40 38
34
41
3431 32
34 34
20 20
38
2828 29
32
25
18
2927
20 20 19 18
0
10
20
30
40
50
60Je
rusa
lem
Dis
tric
t (I
SR
)
Gre
ate
r Lo
nd
on
(G
BR
)
Dis
tric
t o
f C
olu
mb
ia (
USA
)
Basq
ue C
ou
ntr
y (
ES
P)
Oslo
an
d A
ke
rsh
us
(NO
R)
Au
str
ali
an
Ca
pit
al T
err
ito
ry (
AU
S)
Bru
sse
ls C
ap
ita
l R
egio
n (
BE
L)
He
lsin
ki-
Uu
sim
aa (
FIN
)
Ile
de
Fra
nce
(FR
A)
So
uth
ern
an
d E
ast
ern
(IR
L)
Sto
ckh
olm
(S
WE
)
Ma
ga
lla
ne
s y
An
tárti
ca
(C
HL)
Ca
pit
al
(DN
K)
Zu
rich
(C
HE
)
Ca
pit
al
Re
gio
n (
KO
R)
Pra
gu
e (
CZE
)
Bra
tisla
va
Re
gio
n (
SV
K)
No
rth
Isla
nd
(N
ZL)
Be
rlin
(D
EU
)
Ma
zovia
(P
OL)
Ath
en
s (
GR
C)
We
ste
rn N
eth
erl
an
ds (
NLD
)
Ce
ntr
al H
un
ga
ry (
HU
N)
An
ka
ra (
TU
R)
We
ste
rn S
love
nia
(SV
N)
On
tari
o (
CA
N)
Fe
de
ral
Dis
tric
t (M
EX
)
Vie
nn
a (
AU
T)
Lis
bo
n (
PR
T)
La
zio
(IT
A)
Regional value Country value
%
Top TL2 region within each country with the highest percentage of labour force with tertiary educational attainment compared to their country average, 2012
Source: OECD (2013), Regions at a Glance, http://rag.oecd.org/

.. and also in business investment in R&D
Zu
ric
h
Wy
om
ing
Ga
ng
wo
n R
eg
ion
So
uth
ern
De
nm
ark
Bra
nd
en
bu
rg
Co
rsic
a
Gre
ate
r L
on
do
n
Åla
nd
Ce
ntr
al N
orrla
nd
Sa
lzb
urg
No
rth
ern
No
rw
ay
Me
lill
a
Sa
rd
inia
No
rth
ern
Ne
the
rla
nd
s
Prin
ce
Ed
wa
rd
Isla
nd
Au
str
ali
an
C.T
.
Ma
de
ira
Re
g
-Bru
xe
lle
s
No
rth
we
st
So
uth
ern
Tra
nsd
an
ub
ia
Op
ole
re
gio
n
Ay
sé
n
Ae
ge
an
Isla
nd
s a
nd
Cre
te
Ce
ntr
al S
lov
ak
ia
So
uth
ern
an
d E
aste
rnN
orth
we
ste
rn
Sw
itze
rla
nd
Wa
sh
ing
ton
Ca
pit
al
Re
gio
n (
KR
)
Ca
pit
al
(DK
)
Ba
de
n-W
ürtt
em
be
rg
Mid
i-P
yré
né
es
Ea
st
of
En
gla
nd
We
ste
rn
Fin
lan
d
So
uth
Sw
ed
en
Sty
ria
Trø
nd
ela
g
Ba
sq
ue
Co
un
try
Pie
dm
on
t
So
uth
ern
Ne
the
rla
nd
s
Qu
eb
ec
We
ste
rn
Au
str
ali
a
Lis
bo
n
Wa
llo
nia
So
uth
ea
st
Ce
ntr
al H
un
ga
ry
Po
dk
arp
acia
Lo
s L
ag
os
Ath
en
s
Bra
tisla
va
Re
gio
n
Bo
rd
er,
Mid
lan
d a
nd
We
ste
rn
-4
-2
0
2
4
6
8
Sw
itze
rla
nd
Un
ite
d S
ta
te
s
Ko
re
a
De
nm
ark
Ge
rm
an
y
Fra
nce
Un
ite
d K
ing
do
m
Fin
lan
d
Sw
ed
en
Au
str
ia
No
rw
ay
Sp
ain
Ita
ly
Ne
th
erla
nd
s
Ca
na
da
Au
str
ali
a
Po
rtu
ga
l
Be
lgiu
m
Cze
ch
Re
pu
bli
c
Hu
ng
ary
Po
lan
d
Ch
ile
Gre
ece
Slo
va
k R
ep
ub
lic
Ire
lan
d
National value Minimum Maximum
%
Source: OECD (2013), Regions at a Glance, http://rag.oecd.org/
Range of TL2 regional business R&D intensity, 2010

But education is not the same as skills …
Share of young and old adults at the two highest proficiency levels in “problem solving in technology-rich environments”
Source: OECD Survey of Adult Skills, October 2013.

… and R&D is only one element of investment in innovation
Business investment in knowledge-based assets(as % of business sector value added, 2010)
Source: OECD calculations based on INTAN-Invest, Eurostat and multiple national sources.

An innovative economy is also about creative destruction …
7
Role of different firms in employment growth, average over 18 countries, 2001-2011, in %
Source: Criscuolo, Gal and Menon (2014), www.oecd.org/sti/dynemp.htm
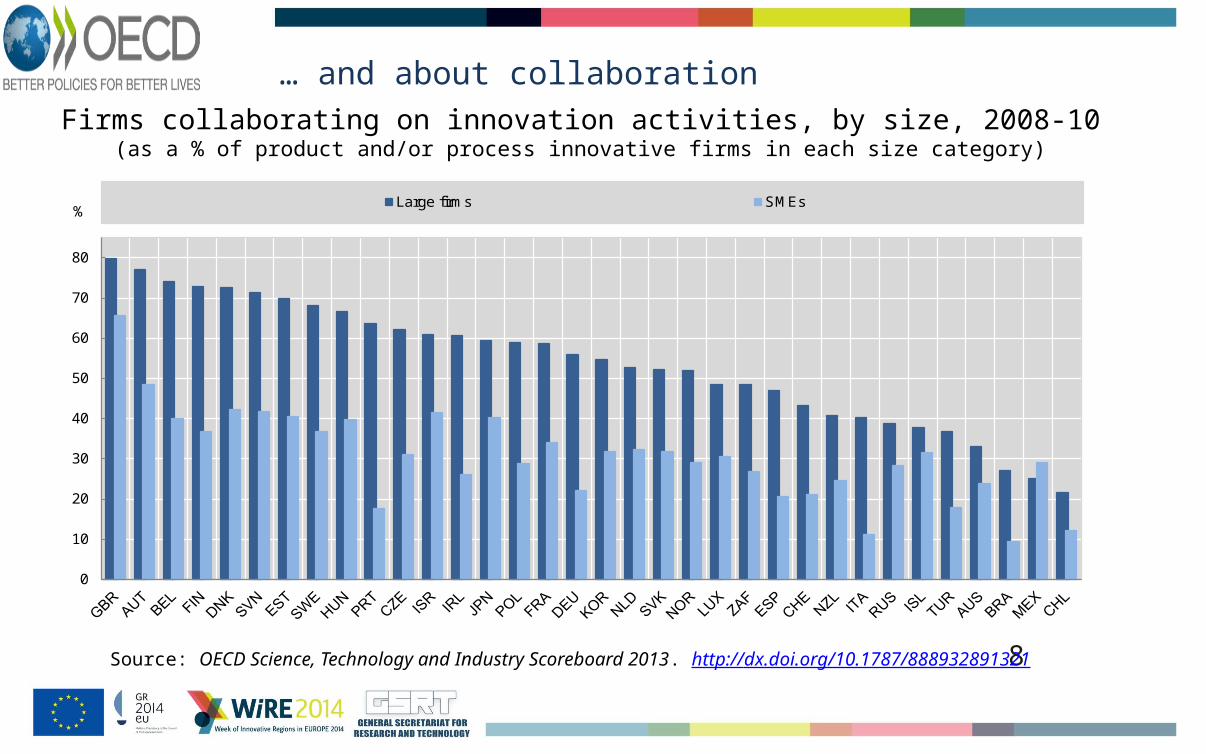
… and about collaboration
8
Firms collaborating on innovation activities, by size, 2008-10(as a % of product and/or process innovative firms in each size category)
Source: OECD Science, Technology and Industry Scoreboard 2013. http://dx.doi.org/10.1787/888932891321
0
10
20
30
40
50
60
70
80
%Large firms SMEs

We have some indicators on innovation outcomes …
Southern-Kanto (JPN) California (USA)
Capital Region (KOR)
Guangdong (CHN)
Kinki (JPN)
Bayern (DEU)
New York(USA)
Texas(USA)
Baden-Württemberg
(DEU)
Washington (USA)
île de France (FRA)
Northern-Kanto, Koshin (JPN)
Toukai (JPN)
Beijing (CHN)
Zuid-Nederland (NLD)
Ontario (CAN)New Jersey (USA)
Illinois (USA)
Stockholm (SWE)
Pennsylvania (USA)
West-Nederland (NLD)
North Carolina (USA)
Nordrhein-Westfalen (DEU)
Florida (USA)
Hovedstaden (DNK)
0.0
0.5
1.0
1.5
2.0
0.0 0.5 1.0 1.5 2.0
Total patents, 2008-10 Total patents, 1998-2000
Massachusetts (USA)
Biotechnology and nanotechnology patents (normalised region's share)
Maryland (USA)(0.9-3.5)
ICT-related patents (normalised region's share)
Total patents by region
1 000 patents
5 000 patents
50 000 patents
Source: OECD Science, Technology and Industry Scoreboard 2013. http://dx.doi.org/10.1787/888932890238
Innovation hotspots in ICT, biotechnology and nanotechnology, 1998-2000 and 2008-10

… but lack a good link to impacts
• Ultimately, innovation is about increasing productivity (and thus economic growth), about new job creation, improved health outcomes, greener growth, etc.
• But the links between investment in innovation and these impacts are complex, often not linear and can take a long time to emerge.
• Some progress is being made:o R&D is now considered an investment in the national accounts, and therefore part
of GDP, enabling a stronger link to economic growth.o A lot of work is going on in countries to better understand impacts of science and
innovation.

Indicators of innovation policy are lacking, with some exceptions …
Implied tax subsidy on R&D expenditures, 2013
Source: OECD Science, Technology and Industry Scoreboard 2013. http://dx.doi.org/10.1787/888932891150

… and we need a stronger focus on policy evaluation
• Need an explicit commitment – at a high level - to the importance of evaluation.
• Insist on the development of data and evaluation strategies before programmes begin.
• Choose a evaluation technique appropriate to the programme concerned.
• Insist on full disclosure in evaluation reports.
• Robust governance to ensure evaluation is objective and free of political influence.
• Good mechanisms for policy learning.

Smart specialisation – what is it?
• Focus on a limited number of priority areas for knowledge-based investments, linked to a region's strengths and comparative advantages on the basis of:o More effective spending of public resources.o The creation of synergies between public support mechanisms for R&D and
innovation, industrial promotion and training institutions.o The elimination of fragmentation and duplication of policy interventions.o The identification of the most promising domains for entrepreneurship and growth
through a careful analysis of existing capabilities, assets and competences.o Mechanisms to enable strategic development.o Mapping and benchmarking of clusters.o Evidence-based monitoring and evaluation systems.
Smart specialisation – what is required (1)?
• Need for government interventions on a solid market basis – which implies robust framework conditions, that allow market driven allocation of innovation, capital and labour: only competitive and open markets are amenable to innovation.
• Government needs to listen to market signals when allocating its own budgets for innovation - entrepreneurial discovery – interventions should meet the market test.
• Avoid capture by vested interest – which implies transparency, accountability and evaluation of policies.
• Stand ready to terminate projects that don’t pass the evaluation test.

Smart specialisation – what is required (2)?
• Strong leadership and stakeholders‘ involvement.
• Ensuring mechanisms or structures for new ‘entrepreneurial bottom-up initiatives’ to emerge and to help mobilise the relevant stakeholders.
• Existing quantitative data can provide an overall picture of the situation, but it is limited to past and present specialisation.
• To capture the ‘entrepreneurial knowledge’ embedded in the region (e.g. to identify emerging activities, synergies and complementarities) may require new diagnostic tools.

Finally: A measurement (and analysis) agenda to support policies for innovation
• From education to skills – where are the gaps?
• From R&D to the full range of investments in innovation
• Better understanding the dynamics of an innovative economy – understanding the enormous heterogeneity in an economy, across regions, across firms, across …
• Better indicators of outcomes and impacts – and the link to investment
• Linking policy to performance – better policy indicators, more evaluation
• Complementing quantitative tools with qualitative analysis

For further reading – with all data available on-line
www.oecd.org/sti/scoreboardwww.oecd.org/regional/regions-at-a-glance.htm

18
Follow us on Twitter: @OECDinnovation
Website: www.oecd.org/sti
Newsletter: www.oecd.org/sti/news.htm
Contact: [email protected]
Read more about our work
Thank you!