measuring innovation and intangibles: a business perspective
TRANSCRIPT
IDA Document D-3704Log: H 08-001855
December 2008
Measuring Innovation and Intangibles:A Business Perspective
Alexandra StoneSusan RoseBhavya Lal
Stephanie Shipp, Project Leader
S C I E N C E & T E C H N O L O G Y P O L I C Y I N S T I T U T E
INSTITUTE FOR DEFENSE ANALYSESSCIENCE & TECHNOLOGY POLICY INSTITUTE
1899 Pennsylvania Ave., Suite 520Washington, DC 20006-3602
Approved for public release;distribution is unlimited.

This work was conducted under cont rac t OIA-0408601,Task OSTP 20-0002.37, for the Bureau of Economic Analysis. The views expressed in this paper are solely those of the authors and not necessarily those of the U.S. Bureau of Economic Analysis or the U.S. Department of Commerce. Moreover, the publication does not indicate an endorsement by the White House Office of Science and Technology Policy (OSTP), nor should the contents be construed as reflecting the official position of that office.
© 2008, 2009 Institute for Defense Analyses (Science and Technology Policy Institute), 1899 Pennsylvania Avenue, Suite 520, Washington,DC 20006-3602 • (202) 419-3737.
This material may be reproduced by or for the U.S. Government.

IDA Document D-3704
Measuring Innovation and Intangibles:A Business Perspective
Alexandra StoneSusan RoseBhavya LaL
Stephanie Shipp, Project Leader
S C I E N C E & T E C H N O L O G Y P O L I C Y I N S T I T U T E


iii
PREFACE
This document was prepared by the Science and Technology Policy Institute of the Institute for Defense Analyses under a task titled “Designing an Innovation National Account.” This work was done in support of the Department of Commerce, Bureau of Economic Analysis. The publication does not indicate an endorsement by the Department of Commerce, nor should the contents be construed as reflecting the official position of that office.


v
CONTENTS
I. Introduction ........................................................................................................... I-1 II. Defining Innovation .............................................................................................II-1
Attribute 1. Innovation involves the combination of inputs in the creation of outputs..........................................................................II-1
Attribute 2. Inputs to innovation can be tangible and intangible .........................II-2 Attribute 3. Knowledge is a key input to innovation. ..........................................II-3 Attribute 4. The inputs to innovation are assets. ..................................................II-4 Attribute 5. Innovation involves activity for the purpose
of creating economic value. .....................................................................II-4 Attribute 6. The process of innovation is complex. .............................................II-5 Attribute 7. Innovation involves risk. ..................................................................II-6 Attribute 8. The outputs in innovation are unpredictable. ...................................II-7 Attribute 9. Knowledge is a key output of innovation. ........................................II-7 Attribute 10. Innovation involves research, development,
and commercialization. ............................................................................II-7 III. Measuring Innovation ........................................................................................ III-1
A. Computing Aggregate Innovation Indices ............................................. III-2 B. Monetizing Innovation ........................................................................... III-5 C. Understanding Intangibles ..................................................................... III-5 D Measuring the Investment in Intangibles ............................................... III-7 E. Accounting Methods for Measuring Intangibles ................................. III-10
IV. International Efforts in Measuring Innovation .................................................. IV-1 A. Introduction ............................................................................................ IV-1 B. The Oslo Manual-Guidelines for Conducting Innovation Surveys ....... IV-2 C. Categorizing Innovation ......................................................................... IV-3 D. Innovation Activities .............................................................................. IV-4 E. Types of Innovation Data....................................................................... IV-6
V. Firm–Level Efforts to Measure and Evaluate Innovation ................................... V-1 A. Introduction ............................................................................................. V-1 B. Company Perspectives on Measuring Innovation and Intangibles ......... V-3

vi
1. Human Capital ............................................................................ V-5 2. Intellectual capital ....................................................................... V-6 3. Organizational Capital ................................................................ V-6 4. Relational capital ........................................................................ V-8 5. Open Innovation........................................................................ V-10
VI. Recommendations and Future Work ................................................................. VI-1 References .................................................................................................................... Ref-1 Appendix A—Government Initiatives to Examine Innovation Measurement ............... A-1 Appendix B—Business Strategies and Tools for Measuring Innovation Capacity and
Intangible Assets ..................................................................................................B-1 Appendix C—International Surveys on Innovation ........................................................C-1 Appendix D—International Accounting Standards for Intangible Assets. ..................... D-1 Appendix E—Business Perspectives on Measuring Innovation: Summaries of
Discussions with Companies ............................................................................... E-1

vii
FIGURES
Figure 1: Relating Intangible and Tangible Assets to Innovation ...................................II-5 Figure 2: Models of traditional and relational company structures .................................II-6 Figure 3: Components of Innovation/Competitiveness Indices ..................................... III-3 Figure 4: Categories Typically Used in Computing
Innovation/Competitiveness Indices .................................................................. III-3
TABLES
1 Innovation Definitions .........................................................................................II-2 2 Examples of Tangible and Intangible Assets .......................................................II-3 3 Evolution of Innovation Metrics by Generation ................................................ III-1 4 Summary of Innovation Activities in Innovation
and Related Surveys based on Oslo Manual (OECD 2005) .............................. IV-5 5 Summary of the Types of Data collected through
National Innovation Surveys (OECD, 2005) ..................................................... IV-7 6 Types of Innovations Pursued and Formally Assessed
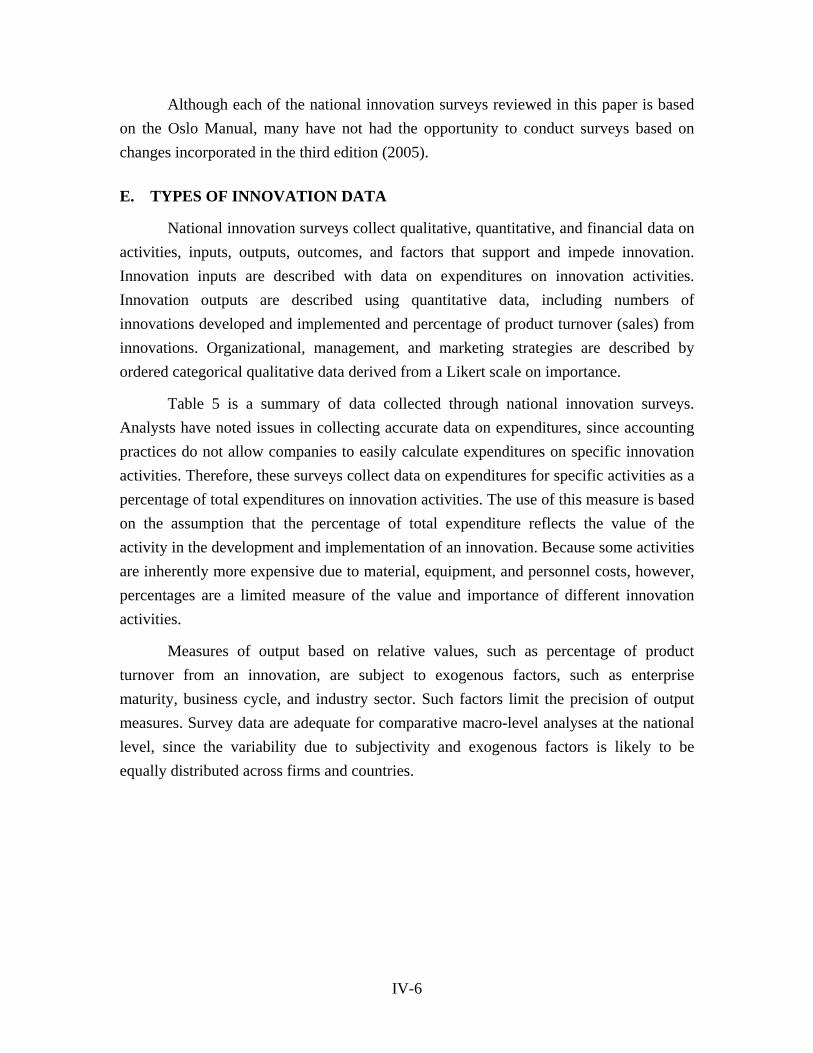
by Businesses, 2008 ............................................................................................ V-2 A-1 A Summary of Selected Government Initiatives to Measure Innovation ........... A-1 B-1 Intangible Asset Monitor Monetary Indicators ....................................................B-2 B-2 Monetary Indicators Used in the Skandia Navigator ...........................................B-4 B-3 IC-dVal Measurements of Intangible Assets Based on Expenditures .................B-5 C-1 Community Innovation Survey Data Categorized by Type of Data ....................C-4 C-2 European Innovation Scoreboard Indicators ........................................................C-6 C-3 Australia’s IBCS Categorized by Type of Data ...................................................C-8 C-4 Data Collected by Canadian Survey of Innovation (2005) ................................C-16 C-5 Topics Addressed in Canadian Survey
on Commercialization and R&D Impacts ..........................................................C-18 C-6 Data Collected through the Survey of Intellectual Property Commercialization
in the Higher Education Sector (Statistics Canada 2006a) ................................C-20

viii
C-7 Data Collected by Japanese National Innovation Survey (2003) Categorized by Data Type .................................................................................C-24
C-8 Information Technology Innovation Survey Data Categorized by Type of Data .................................................................................................C-30
D-1 Existing ISAB Guidelines Related to Measuring Intangible Assets ................... D-1

I-1
I. INTRODUCTION
This report presents the findings of research undertaken by the Science and Technology Policy Institute (STPI), at the request of the Bureau of Economic Analysis, to explore the business perspectives of innovation. The goals were to create a compendium of the logic and methods businesses use in measuring and monetizing innovation, to identify sources of innovation data as well as gaps in the data, and to outline critical areas for future research.
In conducting this research STPI:
• Reviewed the business and financial literature relating to business measurement of innovative activities (primarily intangibles).
• Examined the methods other countries use to measure the innovation process and innovative activities.
• Met with business leaders to obtain insight into how businesses measure and evaluate innovation-related activities.
The results of those activities are presented in this report. The focus is on (1) the business aspects of innovation, (2) describing business and international methods for measuring innovation, and (3) evaluating those methodologies as tools for understanding the impact of innovation.
Innovation has long been recognized as an important driver of economic growth (Romer 1990, Grossman and Helpman 1994, Bloom and Van Reenen 2002, Bosworth and Collins 2003). Empirical research and surveys of business activities show that innovation leads to new products and services, better quality, and lower prices. Economies that have consistently high levels of innovation also tend to have high levels of growth. Businesses that have a strong track record of successful innovation also tend to enjoy significant competitive advantages and increasing firm value. Recognizing these relationships, political leaders, business leaders, and economists have become intensely interested in understanding how to foster innovation and how to exploit innovation in the creation of economic growth.
Innovation has received unprecedented interest in recent years with over 3 million hits in a Google Scholar search and 140 million hits on mainstream Google. Despite the

I-2
abundance of empirical findings and the unprecedented interest, researchers still lack a fundamental understanding of the factors that create innovation and the mechanisms through which innovation creates growth. Perhaps most frustrating has been the failure to find an empirical measure of innovative activity that offers deep insight into the underlying factors and mechanisms.
In the flurry of theoretical and empirical investigations, most researchers have used intangible assets and total factor productivity growth as proxies for innovative activities. These studies have consistently shown innovative activities to be a major factor in the economy. For example, Nakamura (2001) estimated investment in intangibles at approximately $1 trillion per year, and Corrado, Hulten, and Sichel (2006) estimated those investments at approximately $1.2 trillion per year. Recent reports show that “multifactor productivity”—an index that measures the changes in output per unit of combined inputs—accounted for 45% of productivity gains between 1987 and 2007
(Landefeld 2008). The sheer size of these proxy measures indicates the importance of innovation in driving economic growth, but they do not give enough insight into the underlying mechanisms of how innovation yields growth to advance theories and models of innovation. Appendix A presents a brief description of efforts currently underway to measure innovative activity.
Empirical research and surveys of firms show that innovation leads to new products and services, better quality, and lower prices. Despite this recognition and interest in the topic, how innovation occurs and how it affects growth is poorly understood. This report provides a review of the business literature on innovation. The paucity of data (especially in the United States) leads to questions about the ability of any new surveys to successfully collect the needed information. To explore those issues, STPI reviewed the innovation literature, examined Community Innovation Surveys conducted by other countries, and engaged in conversations with several firms to find out how they measure innovation and intangibles internally to assess how difficult it might be to obtain such information through a survey instrument. The summaries of these discussions provide compelling evidence that firms do not track this kind of information in any systematic way and that even those that do have very different methods and perspectives. This underscores the need for research and pilot surveys to learn more about how best to collect the needed data.
Section II presents multiple definitions and key attributes of innovation. Sections III and IV discuss issues associated with measuring the primary components of

I-3
innovation, namely intangible and tangible assets. Section V summarizes innovation surveys conducted in other countries. Section VI reviews the business literature and discussions with business leaders in firms that represent large and small companies in a variety of fields. Section VII presents recommendations for future work.


II-1
II. DEFINING INNOVATION
To understand the factors and mechanisms that underlie innovation, one must first be able to specify what is innovation and what is not, and describe the boundaries of what is being studied. For that reason, this study of innovation begins with a review of definitions of the term.
There are likely as many definitions of “innovation” as there are experts. The term covers a broad spectrum of business activity and can be applied to new or improved products (as at Microsoft and Nintendo), processes (as at Toyota, Walmart, Procter & Gamble), experience (as at Disney, Google, Target), or business models (as at Hewlett Packard, Reliance, or Goldman Sachs).1
Table 1 presents seven definitions of innovation from researchers and organizations heavily involved in studying it. These definitions take different perspectives, depending upon the needs of the organization or researcher, and over time include more nuances as the process becomes better understood.
Rather than add to the list or anoint one definition as being more appropriate than another, the approach taken here is to break innovation into its critical attributes. Innovation is defined here as the sum of a series of attributes describing the boundaries of what we know is or is not innovation.
Attribute 1. Innovation involves the combination of inputs in the creation of outputs.
Something novel is created during innovation. The crucial inputs must be available for innovation to occur, and the exact nature of those inputs differs depending upon the desired outputs and outcomes.
1 While innovation is not just restricted to the commerical sector (e.g., social innovation, as with
microlending or civil disobedience, has been transformative), in this report, firms are the focus.

II-2
Table 1. Innovation Definitions. (Source: Adapted from “Defining ‘Innovation’: A New Framework to Aid Policymakers,” pp. 3–4, http://www.usinnovation.org/files/
Defining_Innovation807.pdf, accessed 3 December 2008.)
Innovation Definitions
Innovation is “the commercial or industrial application of something new—a new product, process or method of production; a new market or sources of supply; a new form of commercial business or financial organization.” Schumpeter, Theory of Economic Development
Innovation is the intersection of invention and insight, leading to the creation of social and economic value. Council on Competitiveness, Innovate America, National Innovation Initiative Report, 2004
Innovation covers a wide range of activities to improve firm performance, including the implementation of a new or significantly improved product, service, distribution process, manufacturing process, marketing method or organizational method. European Commission, Innobarometer 2004
Innovation—the blend of invention, insight and entrepreneurship that launches growth industries, generates new value and creates high value jobs. The Business Council of New York State, Inc., Ahead of the Curve, 2006
The design, invention, development and/or implementation of new or altered products, services, processes, systems, organizational models for the purpose of creating new value for customers and financial returns for the firm. Committee, Department of Commerce, Federal Register Notice, Measuring Innovation in the 21st Century Economy Advisory, April 13, 2007
An innovation is the implementation of a new or significantly improved product (good or service), or process, a new marketing method, or a new organizational method in business practices, workplace organization or external relations. Innovation activities are all scientific, technological, organizational, financial and commercial steps which actually, or are intended to, lead to the implementation of innovations. OECD, Oslo Manual, 3rd Edition, 2005
Innovation success is the degree to which value is created for customers through enterprises that transform new knowledge and technologies into profitable products and services for national and global markets. A high rate of innovation in turn contributes to more market creation, economic growth, job creation, wealth and a higher standard of living. 21st Century Working Group, National Innovation Initiative, 2004
Attribute 2. Inputs to innovation can be tangible and intangible
Innovation activities draw upon a variety of inputs. Those inputs can be both tangible and intangible (see Table 2). Tangible inputs have a physical embodiment and cost. Intangible inputs do not have a physical embodiment (Blair and Wallman 2001; Jarboe and Furrow 2008; Lev, 2001). Intangible inputs are commonly referred to as knowledge assets in the economic literature and as intellectual assets in the business

II-3
management literature. Inputs are considered assets if they engender future benefits (Lev 2001).
An obvious implication of this attribute is that any measure of innovation based on an assessment of changes in the accumulation of inputs will have to account for changes in both the tangible and intangible inputs. As a later discussion will show, this approach has its difficulties.
Table 2: Examples of Tangible and Intangible Assets Tangible Assets Intangible Assets
Information and communications technology infrastructure Production materials Production machinery and facilities
Patents Databases R&D progress Organizational processes Knowledge and skills of labor force
Attribute 3. Knowledge is a key input to innovation.
Innovation involves the application of knowledge in creative activities. Innovation cannot take place without an understanding of the resources, tools, technologies, materials, markets, and needs in the situation at hand. In recognition of the tremendous importance of knowledge to the innovative process, innovating organizations willingly spend incredible amounts of resources on research and the acquisition of knowledge (e.g., intellectual property).
Still knowledge is no guarantee of success. A company may invest heavily in research and not develop a single practical or profitable innovation. In a survey conducted by the Economist Intelligence Unit, almost half the respondents said that their best ideas came from changes in industry and market structure, and only 21% said that they came from scientific breakthroughs or R&D (Cisco 2007). Another recent study found that more R&D typically leads to more patents, but not necessarily more innovation or more contribution to a firm’s bottom line (Booz Allen Hamilton 2007).
Amar Bhide, a professor at Columbia University, supports these findings (2008).2 He opposes the conventional view that more scientists and engineers and more spending on research are needed and contends that this view is “needlessly alarmist and based on a
2 Amar Bhide’s book is reviewed in Steve Lohr, “Do We Overrate Basic Research?” New York Times,
30 November 2008.
II-4
widely held misunderstanding of how technological innovation yields economic growth.” The economic payoff lies in how technologies are used to create innovations, not in the production of new technological ideas. The U.S. competitive advantage is based on the creative use of information technology, especially in the service sector. One prominent example is Walmart’s inventory system.
Attribute 4. The inputs to innovation are assets.
Most innovation inputs are considered assets because they are used repeatedly in a single innovation pipeline or are used in a pipeline resulting in a different product (Arundel 2007). Intangible assets, which typically are not reported (simply because they are difficult to measure), are increasingly being recognized as critical. For example, when Google Inc. published its 2007 annual report, the assets listed on its financial statements did not include the value of the Google Network—the thousands of third-party Web sites that use Google’s advertising programs to deliver advertisements to their sites, and from which the company derived nearly $6 billion, or 35% of its total revenues that year. Nor did it include the company’s gifted workforce, whose freedom to experiment with new product ideas (on company time and equipment) has contributed demonstrably to the company’s bottom line (Caruso 2008).
Intangible assets are not innovations, but they may lead to innovations. We propose, as Figure 1 shows, a relationship between intangibles and innovation. Innovation is driven by a firm’s (or any entity’s) investment in tangible capital (such as computer networks) or intangible capital (such as organizational structure, human capital/training). These innovative activities could lead to tangible outputs (e.g., new or improved products or processes) and intangible ones (e.g., more experienced employers likely to engage in future innovations).
Attribute 5. Innovation involves activity for the purpose of creating economic value.
Fundamental to the concept of innovation is the innovator’s intent to create something of economic value, something that offers benefits to the consumers and provides economic returns to the innovator. It is because of this intent to create economic value that commercialization—the mechanism through which the consumer obtains the benefits of innovation and the innovator obtains the return—is so important to the innovative process.

II-5
Relating Intangibles to Innovation
Tangible Inputs-Knowledge embodied in
technologies - Production facilities
- etc
Intangible Inputs−R&D
−Intellectual property− Organizational Structures
− Core competencies− Business Processes
− etc.
Innovation Activities
- R&D- Design
- Prototyping- Pre-production activities
- Market research- Marketing- Training
Final Outputs& Outcomes
− New/improved products and services
− New/improved productionand delivery methods
Innovative capital− Intellectual property− Competencies− Human capital
Figure 1: Relating Intangible and Tangible Assets to Innovation
Attribute 6. The process of innovation is complex.
Innovation is a complex process not easily reduced to measurable elements (i.e., dollars of R&D, number or value of patents, etc.). In fact, according to a recent article in Business Week, the traditional components of innovation are increasingly viewed as inadequate for explaining the process:
Since 2000, the nation’s public and private sectors have poured almost $5 trillion into research and development and higher education, considered the key contributors to innovation. Nevertheless, employment in most technologically advanced industries has stagnated or even fallen. The number of domestic jobs in the computer and electronics sector continues to plunge while pharmaceutical and biotech companies lay off as many workers as they hire. And even the industry category that includes Google—Internet publishing and Web search portals—has added only 15,000 jobs since 2003 (Mandel 2008).
Innovation is not a simple linear process. Instead, the process is often iterative—the outputs of early activities become the inputs for later processes. Innovation is also not a linear combination of component factors or limited within the boundaries of firms. It may happen within an entire supply chain network (see the Cisco example below) or even be entirely outsourced (see the Innocentive example below).

II-6
In a recent article in Science magazine, Lewis Branscomb (2008) gives several examples of relational (i.e., cooperative agreement) innovations that do not emerge in R&D labs. Figure 2 conveys the feedback loops that occur in the nonlinear nonhierarchal relational model shown on the right. He discussed CISCO as an example of this model:
Cisco built a sophisticated process network in 1996 called Cisco Connection Online (CCO), open to all of the firms to whom Cisco customers look for their solutions. Already in 2003, some 80% of all products were built and shipped without Cisco’s ever taking ownership. Thus, Cisco shares with thousands of customers, suppliers, and competitors a peer-to-peer “e-learning” platform. Cisco introduced perhaps its biggest innovation of 2006, the Cisco Telepresence, a new technology solution that provides brand new in-person experiences between people, places, and events, whether they are across town or across the world, making CCO even more productive. With Cisco’s acquisition of WebEx in March 2007, Telepresence is already halfway to being the quickest Cisco product to reach $1 billion in annual sales. Cisco is passionate about innovations, but far from “not invented here,” Cisco’s most important innovation is its partnership with both customers and competitors, making it a true networked enterprise.
Figure 2: Models of traditional and relational company structures. (Source: Branscomb 2008.)
Attribute 7. Innovation involves risk.
The combination of inputs often fails to produce the desired innovation and returns. There is always some probability that the innovation process will not be successful. Innovation is not for the risk averse. Societies, organizations, and individuals

II-7
who seek to undertake innovative activities must be willing to accept some measure of risk.
The level of risk a firm is willing to accept determines whether the firm will seek innovation that is new to the firm, new to the region, new to the industry, or new to the world. The last would be considered revolutionary innovation (such as the first Apple computer or creation of browser technology at CERN). The others would represent incremental innovation.
Attribute 8. The outputs in innovation are unpredictable.
The inputs to innovation are easy to characterize; they will always be resources and assets. The outputs, however, are difficult to characterize, especially before the process is complete. Once the process is complete, the outputs can be categorized as tangible or intangible. Until that time—especially in revolutionary innovation—even the innovators often cannot predict what the outputs will be.
Because innovation is complex, nonlinear, and risky; responds to opportunities; and inherently includes aspects of serendipity, the outputs are difficult to predict. As the focus moves from the innovation process at one firm to the outputs of innovation in the larger society, the outputs become more difficult to predict, and the artifacts of innovation more difficult to discern in the noise of business activity. Where patents might be the output of innovation in one firm, they may be the weapons of defense in another. As a result, it is difficult to use outputs as a measure of innovation.
Attribute 9. Knowledge is a key output of innovation.
Whatever the outputs of innovation may be, they incorporate the firm’s knowledge at the time. Every tangible and intangible (process and product) output reflects the firm’s knowledge of the resources, technologies, markets, and consumers. The telephone reflected the state of knowledge about electronics at the time of its invention, and at the time of its invention, the Internet reflected the state of knowledge about networks, packets, and communication technology. As archaeologists have long realized about artifacts, the knowledge that goes into the innovation as an input is reflected in the outputs.
Attribute 10. Innovation involves research, development, and commercialization.
Innovation typically involves three interconnected stages (Lev, 2001):

II-8
1. Learning and discovery, whether internal to an organization or externally in networks or with partners, focused on the generation and acquisition of knowledge and skills (the research stage).
2. Implementation demonstrating technical feasibility (the development stage).
3. Commercialization promoting product diffusion and facilitating financial and economic returns.
Activities that lead to learning and discovery provide both novel ideas that inspire and propel innovation and knowledge that enables problem solving in the implementation activities. Commercialization activities, which include market identification and exploration, provide insight into the socioeconomic context of the market and thereby indicate how products should be designed and adapted to maximize returns. In the movement from stage to stage, the complexities of the innovative process become obvious as outputs from different phases become inputs for others.
This section has been an exploration into the fundamental nature of innovation through definitions and attributes. As governments and firms around the world seek to measure and ultimately manage innovation for competitive advantage, recognizing the attributes discussed in this section is crucial for reaching those goals. Whatever methodology selected to measure innovation will be limited in strength and utility by its compatibility with these attributes. A key area for future work will be determining what aspects of these attributes businesses can measure and using that information to develop stronger and more adaptive data sources.

III-1
III. MEASURING INNOVATION
The attributes of innovation discussed in the preceding section illustrate why innovation is such a difficult activity to measure. It is complex, nonlinear, multidimensional, and unpredictable. No single measure is likely to characterize innovation adequately in its totality. Further, important aspects of innovation such as knowledge cannot be measured directly.
Despite these difficulties, researchers persist in their search for the one true indicator of innovation. Milbergs and Vonortas (n.d.) portrayed innovation metrics as evolving through four generations (see Table 3):
• The first generation of metrics reflected a linear conception of innovation focusing on inputs such as R&D investment, and the like.
• The second generation complemented input indicators by accounting for the intermediate outputs of S&T activities.
• The third generation focused on a richer set of innovation indicators and indexes based on surveys and integration of publicly available data.
• The fourth generation metrics of the knowledge-based networked economy remain ad hoc and are the subject of measurement.
Table 3: Evolution of Innovation Metrics by Generation. (Source: Table 1 in Milbergs and Vonortas n.d.)
In general the attempts to measure innovation follow two approaches—aggregate indices and monetization. In the aggregate indices approach, a number of factors are

III-2
combined to create an overall innovation score or indicator. In the monetization approach, innovation is measured as a dollar value of the innovation activities. The strengths and weaknesses of these approaches are discussed below.
A. COMPUTING AGGREGATE INNOVATION INDICES
The aggregate indices approach is frequently used in evaluating the level of innovation within a nation or other political unit. This approach focuses on applying an understanding of the innovation process and assessing the factors that play a critical role in innovation. Special emphasis is given to those aspects that highlight the nation’s level of international competitiveness.
This approach has gained in popularity as governments, policymakers, and industry associations recognize the importance of innovation and step up their efforts to measure it effectively. The European Union’s European Innovation Scoreboard ranks the innovation of European nations, while the Global Innovation Index, by the French business school INSEAD, includes the United States and other nations.
The EU Scoreboard includes indicators such as:
• Broadband penetration rate (lines per 100 people).
• Participation in lifelong learning (percentage of population age 25 to 64).
• Investment in people and business R&D expenditures.
• Early stage venture capital.
• Employment in high technology industries.
• New patents issued.
• New trademarks approved.
The EU’s Community Innovation Survey also follows this approach. The survey measures the nature and intensity of innovation and tries to identify the determinants of innovation by correlating inputs and outputs. In the EU Scorecard, the correlates are combined to create rankings and indices. The breadth of factors allows these measures to often make fine discriminations between nations. However, because the measures are based on correlations (and correlation does not imply causation), these measures are primarily limited to descriptive functions.
The factors used to compute innovation indices are shown in Figure 3, and some typical indicators are shown in Figure 4. While from a theoretical perspective, one would think that a nation’s S&T infrastructure (factors such as business/government expenditure

III-3
on R&D, high-technology exports, total R&D personnel, etc) should be crucial and consistent component of the indicators, as Figure 5 shows, the share of S&T in estimating a nation’s innovation or competitiveness varies dramatically.
Figure 3: Components of Innovation/Competitiveness Indices. (Source: STPI Analysis of Indices, 2007.)
Figure 4: Categories Typically Used in Computing Innovation/Competitiveness Indices. Note: Area shaded in royal blue (and with percentage) represents the contribution of S&T
(Source: STPI Analysis of Indices, 2007.)
Aggregate indices are being used at the subnational level as well. The Massachusetts Technology Collaborative computes the Massachusetts Innovation

III-4
Economy Index that compares Massachusetts’ innovation index using parameters such as key industry cluster growth, growth in R&D spending, export and immigration flows, and human capital dynamics to countries in the regions of Asia-Pacific, the BRIC countries (Brazil, Russian Federation, India, and China), North America, and Western Europe.3 Regional indices are calculated in other parts of the world as well (province of Alberta in Canada, the Flanders region in Belgium, etc).
Aggregate indices are also used at the firm level. The Porter diamond cluster model focuses on an array of qualitative data elements as it attempts to explain the process of innovation as it occurs within individual firms (Porter 1998). Similarly, measures like the Skandia Navigator use qualitative data to link inputs such as human and organizational capital with outputs such as innovative products, market share, and profits.4
As a tool for studying innovation, the aggregate indices approach is useful only in a very narrow range of applications. On the positive side, this approach typically collects data about a wide variety of innovation factors. In making comparisons among political units, this approach can allow for fine discriminations. On the negative side, only limited financial data are typically collected. The primary focus of the data-collection effort is on qualitative data. Further, the indices are typically created based on correlation analyses. As a result, the data are for the most part limited to producing scorecards or providing descriptive analyses of the innovation within a firm, political unit, or country.
While developing innovation indices is not a trivial exercise, and benchmarking across nations could be a useful activity especially in managing an organization of nations such as the EU, the aggregate indices approach does little to foster any understanding of the contribution of innovation to growth or actual wealth creation. This approach applies current knowledge of the factors involved in innovation but is very weak in providing insight into management of the innovation process. The insights from this approach are more likely to be correlative than causative.
3 http://web3.streamhoster.com/mtc/Index020108.pdf. 4 See Appendix B for more information.

III-5
B. MONETIZING INNOVATION
A second approach to measuring innovation focuses on measuring the dollar value of innovative activities. Some researchers, such as Lev (2001), measure intangibles as a proxy for innovation and estimate the value of intangible assets as the residual left when book value is removed from the firm’s market value. This residual is a catchall for intangible assets and does not reflect the importance of various assets to a firm’s innovative productivity. Others, such as Nakamura (2001); Corrado, Hulten and Sichel (2006); Hill and Youngman (2003), and Arundel (2007), treat expenditures on intangible assets as investments in innovation capacity. Investments in intangibles are not direct investments in innovation, however. New knowledge may not lead directly to innovation. New knowledge can be used to develop an invention, which only has economic value when it has been commercialized and introduced into the market and yields financial returns.
The monetization approach offers the potential for revealing deep insight into the innovation process. Theory and models drive the selection of innovation factors and the factors are “weighted” by the actual spending or investment, not a complex process of factor analysis or correlations. As a result, the monetization approach may seem more transparent. The opacity, however, has simply moved from the weighting of factors in the aggregate indices to the monetization process. Monetizing tangible assets is usually not a problem since accounting assigns a cost or market value. The problem is primarily with the intangibles where the appropriate process for assigning a dollar value is not always obvious. Thus, the monetization approach is only as strong as the methodology behind the process for monetizing the intangibles.
C. UNDERSTANDING INTANGIBLES
Since intangible assets do not exist in physical form, they present a set of difficult measurement problems that arise primarily from the inability to measure intangible assets directly. Researchers are forced to resort to proxies and techniques for indirect measurement. To guide those indirect techniques, researchers have devised a variety of ways to characterize intangible assets. This subsection will look at some of the ways that intangibles have been characterized and the next subsection will review some of the methods for measuring intangible assets.
Intangible assets can be divided into three subcategories based on the degree to which they can be controlled and/or sold by the firm (Blair and Wallman 2001):

III-6
• Assets that can be controlled and owned by the firm and can be separated and sold, for example, patents and databases.
• Assets that can be controlled and owned by the firm but not separated out and sold, for example, R&D and organizational processes.
• Assets that may not be wholly controlled by the firm and are therefore not owned by the firm, for example, knowledge and skills of labor force.
These differences in degree of controllability and ownership not only influence business strategies, they have strong implications for measurement and accounting.
While intangible assets represent the knowledge and skill sets of the organization, they are the vehicle for integrating knowledge into an innovative product, service, or process. They can be categorized by the mechanism through which the asset is developed and used in innovation activities (Jarboe 2007):
• Human capital includes the knowledge and skills of individual employees.
• Structural capital (also called organizational capital) refers to the knowledge and skills owned by the firm and include databases, intellectual property, trade secrets, business routines and processes, and organizational competencies. (Organizational competencies are the collective knowledge and skills of employees that are coordinated and leveraged by the technological and management infrastructure.)
• Relational capital is the knowledge and resources embodied in external stakeholders, including R&D collaborators, suppliers, and customers.
Each category contains assets with different degrees of controllability (as described above). Focusing on the innovation process supports a conceptual understanding of the relationships between activities with respect to inputs and intermediate outputs as inputs into subsequent activities.
Innovation activities develop and apply tangible and intangible assets that integrate knowledge, skills, and technologies in the development and commercialization of products and processes. These activities provide another way to categorize intangible assets. The OECD Oslo Manual (2005) identified five specific activities that result in the design, development, and commercialization of innovations:
• Generation and acquisition of knowledge through R&D and testing and evaluating prototypes. (OECD 2002 defines R&D as systematic creative work undertaken to increase the knowledge stock).
• Acquisition of disembodied knowledge as intellectual property.

III-7
• Acquisition of knowledge embodied in technologies and materials used in development and production processes.
• Development of infrastructure and capabilities for producing innovative product or implementing innovative process.
• Identification and exploration of markets for innovative products.
Intangible (and tangible) assets can also be differentiated based upon where the assets fall in the innovative process and the timing of returns. Innovation activities generate intangible outputs, which are used as inputs into other innovation activities. These intermediates include knowledge generated through R&D, databases and software applications that collate and analyze information and knowledge, human capital developed through individual training and experience, and organizational competencies that leverage individual competencies through a technological and management infrastructure. The returns on intermediates are not realized as they are produced. Rather, financial and economic returns are realized further down the innovation pipeline with the production of the final tangible innovation output.
Moreover, intangible assets have increasing returns to scale since they can be used as inputs into multiple activities within and across innovation pipelines (OECD 2007). Investments in intangible assets are difficult to value because of the time frame in which financial returns are realized.
These different characterizations of intangibles offer insight into the different approaches to measuring intangibles. The measures applied to intangibles typically make use of these characterizations in applying their monetization or measurement scheme.
D. MEASURING THE INVESTMENT IN INTANGIBLES
The following paragraphs review several methods for measuring intangible capital or assets (the terms are used interchangeably).5 Although the focus here is on the intangibles, the broader goal is to find measures that accurately reflect the contribution of both the tangible and intangible assets in innovation and growth. To better understand innovation and the mechanisms for creating growth through innovation, metrics that fully account for the contributions of all assets in the innovation process are needed. As a result, interest has turned to more accurately capturing the value of the intangible assets.
5 Also see Appendix B for specific measures of intangibles used by businesses.

III-8
Note that most authors measure all intangible capital, not just intangible capital that feeds back into the innovation process. With this measurement technique, the value of a company’s brands is included in the measure of its innovation, though brand awareness probably plays a minor role in innovation. Thus, even these estimates, though more inclusive, are still flawed approximations.
Lev (2001) used a residual method to compute the value of intangible capital. His residual method measured intangible capital as the difference between a firm’s market value and its accounting book value. The quintessential example of a company where this difference is high is Amazon, which (in June 2007) had a book value of $550 million and market capitalization of $35 billion.6
This approach has two major weaknesses. First is the lack of detail about the composition of the intangible capital. As a residual, this value is truly a catchall category. Second, this approach measures the stock of intangible capital rather than the flow of investment. Dynamic aspects of innovation are lost. Despite these weaknesses, this method has been effectively used to explain why some companies are more successful than others and to guide investors.
Nakamura (2001) focused on measuring the total investment in intangible assets and its contribution to growth. He used several methods to estimate the investment in intangible assets. First, he estimated the number of employees in innovative occupations such as engineering, science, and the arts and then used their median pay to estimate the amount of investment. Second, he estimated the decline in the percentage of revenues attributable to the cost of goods sold. He argued that the decline is due to increased investment in intangible assets. Next, he used an indirect method. Evidence shows that the ratio of consumption to GDP is relatively stable, assuming all investment is properly measured. If true, this implies that a rise in consumption indicates some investment (such as intangibles) is not being counted. The rise in the consumption ratio allowed Nakamura to estimate the amount of intangible investment. Finally, he measured the direct expenditures used to develop intangible assets. All of Nakamura’s measures are considered conservative and thus provide a lower bound for intangible investment. He estimated that $1 trillion per year is invested in intangible capital.
6 From http://lloydsinvestment.blogspot.com/2007/09/are-stocks-with-high-price-to-book.html

III-9
In 2006, Corrado, Hulten and Sichel extended the expenditure method used by Nakamura in an attempt to make it more comprehensive. They expanded the definition of scientific and creative property to include the development of motion picture, radio, and television programs; sound recordings; and books. They also expanded Nakamura’s coverage of intangibles in financial institutions beyond banks and nondepository institutions to include other financial services such as securities brokers. At $1.2 trillion, their estimate of yearly investment in intangibles was 20% higher.
The expenditure method is typically used to explain growth in a macroeconomic context. It measures the amount spent developing the intangible capital rather than the value of the intangible asset. The advantage of the expenditure method is that it allows researchers to measure the flow of capital, not the stock. This method is currently being used in efforts to add intangible capital to the national accounts primarily for that reason.
Growth models generally model output as a function of capital, labor, and technology. A goal of growth theory is to understand the relative importance of each of these factors to long-term economic growth, with an emphasis on capital accumulation and technological change. In their 2006 paper, Corrado, Hulten and Sichel argued that this traditional view of capital is wrong and results in a distorted understanding of the sources of growth. They expanded their growth model to explicitly account for intangible capital, and estimated that firms’ investment in intangible capital equals or exceeds their investment in tangible capital.
A report by the OECD Secretariat (1998) discusses the efforts of six countries to measure intangible investment. The countries, Finland, France, Netherlands, Norway, Sweden, and the U.K., covered research and development, employer-sponsored training, software, and some form of marketing. Only three considered business organization or management.
The countries focused on the expenditure approach to measuring intangibles. The OECD reports that “[t]otal intangible investment in the knowledge base amounts to at least half of total tangible investment by enterprises and government together…” (OECD Secretariat 1998). This estimate is much lower than the Nakamura (2001) and Corrado, Hulten and Sichel (2006) estimates, which suggests that intangible investment is larger than tangible investment, but Corrado, Hulten and Sichel (2006) and Nakamura (2001) include more categories of intangibles. Both Corrado, Hulten and Sichel (2006) and the OECD Secratariat (1998) include only employer-sponsored training as their proxy for human capital development, rather than total investment in education and training.

III-10
E. ACCOUNTING METHODS FOR MEASURING INTANGIBLES
Accounting guidelines traditionally treat funds spent on intangible assets as expenses, not as investments that are expected to yield future returns. As a result, these funds are not capitalized on the balance sheet. This should not be taken as evidence that businesses do not recognize the investment nature of intangibles, as they do. But since the accounting data are relied upon by managers and outside investors, the accounting rules favor objective, verifiable valuations such as arm’s-length, market-based transactions.
As discussed earlier, intangible assets vary in the degree to which they can be controlled and separated out from the firm. Firms do not have clear property rights to human capital investments because the intangible assets (knowledge and skills) are embodied in the firm’s employees. With a firm’s management capability dependent on the knowledge and skills of its employees, it is difficult to provide objective estimates of the future benefits of intangible investment because employees cannot be compelled to continue working for that firm. Since management capability cannot be separated, traded, bought, or sold, there are no clear market-based transactions with which to assign value on the balance sheet.
When firms are purchased, the catchall term “goodwill” is used to capture the value of the intangible assets purchased. If the purchase price exceeds the book value of the assets, then the difference is considered to be the value of the intangibles (the value of the tangibles is captured in the original book value). Thus, the purchase puts a value on the intangibles and allows them to be added to the balance sheet. By contrast, patents do have clear property rights and are separable, but there may be no market (or a very thin market) for patents.7 This contrast indicates how accountants who want to include intangibles on the balance sheet must look beyond the generally accepted accounting rules for guidance in assigning values.
Lack of a consistent accounting framework is perhaps the biggest issue in measuring intangible capital. Recent papers in the accounting literature address this issue. [See for example Høegh-Krohn and Knivsflå (2000) and Hunter, Webster and Wyatt (2005)]. Independent accounting standards boards such as the International Accounting Standards Board (IASB) are beginning to develop guidelines for accounting for
7 Patent markets are beginning to develop, but progress is slow. See Jarboe and Furrow (2008) for more
details.

III-11
intangible assets.8 (The U.S. Financial Accounting Standards Board is also addressing intangible assets. We only discuss the IASB because on 27 August 2008, the Securities and Exchange Commission announced a plan that requires U.S. companies to follow international guidelines beginning in 2014.9)
Although the IASB has established several guidelines pertaining to the identification, recognition, and valuation of intangible assets, the IASB has not resolved many of the conceptual issues involved in measuring them. (Refer to Appendix D for more information regarding the guidelines.) As a result, guidelines on the recognition and reporting of intangible assets are conceptually inconsistent. This lack of guidance hinders consistent data collection, as is apparent in our interviews with firms (see Section V and Appendix E).
8 The IASB is a private-sector organization that establishes international standards for financial
reporting. The development of standards is a collaborative effort that involves engaging investors, regulatory entities, business leaders, and the global accounting profession. These standards harmonize the generally accepted accounting principles of over 100 participating countries. The Securities and Exchange Commission recognizes IASB as an international standards setting body. See www.iasb.org.
9 See C. Hewitt, J. White, P. Dudek, “Speech by SEC Staff: Opening Remarks before the Commission Open Meeting,” Washington, D.C., 27 August 2008, http://www.sec.gov/news/speech/2008/ spch082708ch-jw-pd.htm, accessed 3 December 2008.


IV-1
IV. INTERNATIONAL EFFORTS IN MEASURING INNOVATION
A. INTRODUCTION
This section reviews international efforts in measuring innovation. Most have focused on the aggregate indices approach. Whether this focus is a result, or an indication of the competition of economic globalization is unclear.
The first documented government efforts to measure innovation started in the 1960s. The result of the early efforts was the Frascati Manual, a document that specifies the methodology for collecting and using statistics about R&D for OECD countries.10 However, it was not until the 1980s that OECD countries, the Unites States, and other began to carry out innovation surveys. In 1992, twelve European countries conducted a coordinated survey of innovation activities, based on the Oslo Manual (Godin 2002; OECD 1991). Currently, the Oslo manual is used as a guide for preparing, conducting, and analyzing innovation surveys in over 50 OECD and non-OECD countries, including members of the European Union, Canada, Mexico, Australia, New Zealand, Norway, Switzerland, Russia, Turkey, Argentina, Brazil, Chile, Columbia, Peru, Uruguay, Venezuela, Japan, Malaysia, Singapore, South Korea, Taiwan, Thailand, Tunisia, and South Africa (Mairesse and Mohnen 2007).
The Community Innovation Surveys are designed to provide data by sectors and regions. The surveys collect information about product and process innovation as well as organizational innovation. Most questions cover new or significantly improved goods or services or the implementation of new or significantly improved processes, logistics, or distribution methods. To date, five Community Innovation Surveys have been carried out, with a sixth planned for 2009.
10 In June 1963, OECD experts met with the NESTI group (National Experts on Science and Technology
Indicators) at the Villa Falconieri in Frascati, Italy. The result of their work was the first version of Frascati Manual. Over the past 40 years, the NESTI group has developed a series of documents, known as “Frascati Family,” that include manuals on R&D (Frascati Manual), innovation (Oslo Manual), innovation in developing countries (Bogota Manual), human resources (Canberra Manual), and a manual on technological balance of payments and patents as science and technology indicators.

IV-2
The Community Innovation Surveys have evolved from the initial CIS1 and CIS2, which found a large number of firms to be “innovative” due to the broad way in which innovation was defined, to more recent surveys that asked questions about service innovations (STEP Economics 2000). The CIS5 and future surveys are beginning to include management techniques, organizational change, design and marketing issues.
B. THE OSLO MANUAL-GUIDELINES FOR CONDUCTING INNOVATION SURVEYS
The Organization for Economic Co-operation and Development established a standardized methodology for collecting and analyzing data related to innovation activities and innovative productivity in the Oslo Manual (OECD 2005). The Oslo manual provides a framework for collecting data over a range of innovation activities and expenditures other than R&D, including intellectual property, product design, personnel training, prototype testing, trial production, market analysis, and commercialization. The United States does not conduct an innovation survey on a regular basis, although the National Science Foundation has piloted an information technology and other innovation surveys during the 1980s and 1990s. Recently, the National Science Foundation added an innovation component to its new Business R&D and Innovation Survey.11 Detailed descriptions of selected international surveys are in Appendix C.
Data collected through national innovation surveys are used to calculate indicators of productivity and competitiveness (Australian Bureau of Statistics 2005, Eurostat 2008). These data typically provide five general types of indicators:
1. Knowledge drivers
2. Knowledge creation
3. Innovation and entrepreneurship
4. Application of innovation
5. Intellectual property
Several countries and the EU compile indicators in a national innovation “scorecard.” These scorecards are used to track trends in innovation productivity over time and facilitate international comparisons. Most countries also calculate indicators that relate to specific policy initiatives, in order to evaluate the effectiveness of those policies.
11 http://www.nsf.gov/statistics/srvyindustry/about/brdis/summary.cfm.

IV-3
Academics and policymakers use survey data to develop a better understanding of the differences in innovation programs.
C. CATEGORIZING INNOVATION
In the Oslo Manual, OECD (2005) defines innovation as the implementation of new or significant improved products, operational processes, organizational processes and structures, and marketing methods. The manual loosely defines an innovation as something that is new to the firm. According to this definition, firms can develop innovations through several different mechanisms that reflect different processes of discovery, invention, and technology diffusion. To distinguish between different processes of developing innovations, the Oslo Manual recommends questions regarding an innovation’s degree of novelty. Degree of novelty refers to the scope of the market in which the firm introduces the innovation. There are four degrees of novelty:
• New to the firm.
• New to a national market.
• New to a regional market (non-global, multi-country markets, such as the European Union).
• New to the global market.
Innovations that are new to the firm and new to national and regional markets refer to technology diffusion. Innovations that are new to global markets are the result of invention and commercialization activities. The scope of the firm’s market is used to characterize the level of innovation and its role as either a technological leader or follower.
The Oslo manual included organizational and marketing innovations for the first time in the third edition (2005). Organizational innovations involve new business practices and inter- and intra-organizational relationships that increase performance, reduce administrative costs, improve labor productivity, and enable access to non-tradable assets. Marketing innovations involve changes in product design, packaging, product placement, promotion, and pricing to better address customer needs, gain access to new markets, and launch new products.
Several national innovation surveys, among them the 2003 Australian survey, 2005 Canadian survey, and 2003 Japanese survey, included organizational and marketing innovations before they were in the Oslo Manual. There are subtle differences in the definitions of marketing and organizational innovations and associated activities, and a

IV-4
result, the data cannot be compared with each other or later surveys that use the OECD definition. The OECD used the analyses of these preliminary data on organizational and marketing innovations to develop definitions for the Oslo Manual.
The Oslo Manual provides a framework for collecting and analyzing data to facilitate a better understanding of innovation processes at the micro and macro level. While focusing on innovation activities performed by individual firms, the manual also addresses the environment in which firms are able to successfully innovate or fail to innovate. The Oslo Manual addresses the following broad topics:
• Innovation activities.
• Organizational linkages in the innovation process such as collaborative R&D, acquisition of intellectual property, outsourcing, and supply and distribution channels.
• Drivers of innovation activities.
• Barriers to innovation.
• Outcomes of innovation activities, including products, changes in productivity and efficiency, financial returns, and economic outcomes such as market entry and market share.
Within each category, countries develop specific questions relating to the nature of their national innovation ecosystem, policies to promote innovation, structure of industries and markets, and general position in global markets. (The business environment in which firms develop and commercialize innovations is commonly referred to as the innovation ecosystem. It includes the structure and competitive nature of the industry, opportunities for collaboration, market demand, and policies that affect opportunities and incentives to innovate.)
D. INNOVATION ACTIVITIES
National innovation surveys based on the Oslo Manual focus innovation activities as value generating activities contributing to the development of a novel product. The Oslo Manual outlines the range of scientific, technological, organizational, and commercial activities involved in the development and implementation of an innovation. Table 4 presents a summary of innovation activities included in surveys based on the Oslo Manual. The third edition includes design activities for the first time, although some countries, such as Australia and Japan, included them in earlier surveys. The activities included in these surveys reflect the importance of non-R&D activities in developing and

IV-5
commercializing innovations. Thus, innovation surveys complement and extend national R&D surveys.
Table 4: Summary of Innovation Activities in Innovation and Related Surveys based on Oslo Manual (OECD 2005)
Innovation activities EU CIS Australia Canada Japan
Intramural R&D x x x x
Extramural R&D x x x
Design a x x
Acquisition of equipment, materials, and capital goods x x x x
Acquisition of external knowledge x b c x
Acquisition of intellectual property x x
Intellectual property management c
Training x b x
Marketing x x
Project feasibilityc
x
Market researchc
Profitability analysisc
Launch advertisingc
Consumer acceptance testingc
Distribution agreementsc
Marketing partnershipsc
Pre-market preparation for production or process implementation (tooling up)
x x
Human capital development
Hire employees with new skill setsb
Employ consultantsb
Business mergers and acquisitionsb
Contracted R&Db
a. Design activities are included as an innovation activities in the third edition of the Oslo Manual, but not in prior editions (OECD 2005).
b. Data collected through Survey of Patenting and Commercialization Activities of Australian Universities (Australian Bureau of Statistics 2008a, 2008b).
c. Data collected through Survey on Commercialization and R&D Impacts (Statistics Canada 2006b).
IV-6
Although each of the national innovation surveys reviewed in this paper is based on the Oslo Manual, many have not had the opportunity to conduct surveys based on changes incorporated in the third edition (2005).
E. TYPES OF INNOVATION DATA
National innovation surveys collect qualitative, quantitative, and financial data on activities, inputs, outputs, outcomes, and factors that support and impede innovation. Innovation inputs are described with data on expenditures on innovation activities. Innovation outputs are described using quantitative data, including numbers of innovations developed and implemented and percentage of product turnover (sales) from innovations. Organizational, management, and marketing strategies are described by ordered categorical qualitative data derived from a Likert scale on importance.
Table 5 is a summary of data collected through national innovation surveys. Analysts have noted issues in collecting accurate data on expenditures, since accounting practices do not allow companies to easily calculate expenditures on specific innovation activities. Therefore, these surveys collect data on expenditures for specific activities as a percentage of total expenditures on innovation activities. The use of this measure is based on the assumption that the percentage of total expenditure reflects the value of the activity in the development and implementation of an innovation. Because some activities are inherently more expensive due to material, equipment, and personnel costs, however, percentages are a limited measure of the value and importance of different innovation activities.
Measures of output based on relative values, such as percentage of product turnover from an innovation, are subject to exogenous factors, such as enterprise maturity, business cycle, and industry sector. Such factors limit the precision of output measures. Survey data are adequate for comparative macro-level analyses at the national level, since the variability due to subjectivity and exogenous factors is likely to be equally distributed across firms and countries.

IV-7
Table 5: Summary of the Types of Data collected through National Innovation Surveys (OECD, 2005)
Type of data EU CIS Australia Canada Japan
Qualitative Dichotomous
Input Participation in collaborative innovation activities x x x x
Types of collaborative partners x x x x
Acquisition of intellectual property from external source x x
Organizational change x
Government funding for innovation activities x x x
Methods for protecting intellectual property c
Output Product innovation x x x x
Operational (process) innovation x x x x
Organizational innovation x x
Marketing innovation x x
Unfinished or abandoned innovations x x x
Qualitative categoricala
Input External sources of information x x x x
Types of collaborative partners x x x
Intellectual property management strategies x x
Drivers of innovation x
Barriers to innovation x x x
Factors affecting failure to commercialize intellectual property b
Output Degree of novelty • Firm • Country
• Region • World
x x x
Effects of innovation • productivity • proficiency • profitability
• market position
x x x
Organizational change x x
Meet regulatory requirements x x x

IV-8
Type of data EU CIS Australia Canada Japan
Quantitative Input Percentage of employees involved in R&D x
Percentage of employees involved in innovation activities x
Time to develop innovations x
Output Turnover from product innovation x x x x
Share of products involving • patents • copyrights
• trademarks
Share of sales from patent protected innovation x x x
Financial Input R&D expenditures x x x x
Total expenditures on innovation activities x x x x
Expenditures on specific innovation activities x x
Estimated percentage of innovation expenditures for specific activities x x x
Output Percentage of revenue from new-to-market product innovations x
a. Most qualitative categorical data is based on a Likert scale of importance or value. b. Data collected through Survey of Patenting and Commercialization Activities of Australian Universities
(Australian Bureau of Statistics 2008a, 2008b). c. Data collected through Survey on Commercialization and R&D Impacts (Statistics Canada 2006b).

V-1
V. FIRM–LEVEL EFFORTS TO MEASURE AND EVALUATE INNOVATION
I don’t think people appreciate how much money, time and good technical research goes into what we do. Sometimes, people think the idea is the thing. I think the idea can be the easy part.
—Dr. Darryle Schoepp. Eli Lilly (New York Times, 24 February 2008, Business section, p. 10).
A. INTRODUCTION
Surveys from the leading business consultants—Boston Consulting Group, McKinsey & Company, and Booz Allen Hamilton—indicate that innovation is a high priority for corporate leaders around the world. While Sections III and IV revealed that nation-based organizations tend to be interested in competitive rankings for the level of innovative activity, businesses are more interested in the results of their innovative activities, the efficiency of their operations in getting innovations to market, and the returns on their investments in innovation.
Businesses are also keenly interested in measuring intangible assets to better understand the contribution of those assets in generating innovations. Understanding the contribution of intangible assets, and the returns from those assets, enables managers to strategically invest in the development of those assets and thereby improve their innovative capacity, increase market share and profit, and gain competitive advantages. Firms have used their measures of intangible assets to improve stakeholder and investor relations (Bontis 2001, Lev 2001), and some, such as Skandia and Dow Chemicals, have begun to publish intangible asset reports as addendums to form financial reports (Bontis 2001).
A recent McKinsey (2008) survey found that companies that use innovation metrics and assess innovation more comprehensively had the highest return from innovation. About two-thirds of the firms interviewed in that study considered innovation among their top three priorities in their organization’s strategic agenda. Respondents reported using innovation metrics to provide strategic direction for innovation activities, to guide the allocation of resources to innovation projects, and to diagnose and improve

V-2
overall innovation performance. Companies in the study tended to rely more on metrics for outputs than metrics for inputs, suggesting that these companies were focused more on the outputs than on evaluating the entire innovation process.
Two good examples of firms using metrics are 3M and Proctor & Gamble. 3M has long been a user of innovation metrics. The company is well known for allowing employees to devote 15% of their time to experimentation with new opportunities and for requiring that 35% of corporate revenues come from products introduced within the past four years (Palmer and Kaplan 2007). Proctor & Gamble is similarly famous for its emphasis on innovation metrics. Proctor & Gamble uses an organizational capability input metric focused on “the percentage of external sourcing of ideas and technology” as a way to drive its Connect and Develop strategy for open innovation. The metric appears to be driving strategy: in 2000, 10% of the company’s R&D was outsourced, and in 2006, half of all ideas and technology came from the outside (Palmer and Kaplan 2007).
The McKinsey survey found that companies pursue four types of innovation: product, service, process, and business model. As might be expected, fewer companies measure innovation than pursue it (see Table 6 below).
Table 6. Types of Innovations Pursued and Formally Assessed by Businesses, 2008. (Source: McKinsey 2008.)
Types of innovations pursued Percent reporting types pursued
Percent reporting types formally assessed
Product innovation 71 54 Service innovation 65 37 Process innovation 62 37 Business model innovation 51 28
Companies use these outcome metrics:
• Revenue growth due to new products or services.
• Customer satisfaction with new products or services.
• Percentage of sales from new products/services in a given time period.
• Number of new products or services launched.
• Return on investment in new products or services.
• Profit growth dues to new products or services.
• Potential of entire new product/service portfolio to meet growth targets, changes in market share resulting from new products and services.
• Net present value of entire new product/service portfolio.

V-3
Companies use these input metrics:
• Number of ideas or concepts in the pipeline.
• R&D spending as a percentage of sales.
• Number of R&D projects.
• Number of people actively devoted to innovation.
The McKinsey study concludes that companies would gain a deeper understanding of their innovation performance if they paid more attention to input metrics as well as output metrics. Further, the metrics would be more useful if the firms had a way to standardize the metrics so that they could benchmark their performance against their competitors.
B. COMPANY PERSPECTIVES ON MEASURING INNOVATION AND INTANGIBLES
To develop an understanding of innovation from the perspective of a firm, current and former senior leaders of 11 private-sector firms were interviewed. The goal was to gather information about how firms think about and measure innovative activities, investments in the inputs to innovation, innovation infrastructures, and methods for measuring the value of intermediate and final outputs. These interviews focused on frameworks, methods and data that could be used to measure innovation, and the manner in which measures of innovation are used at the firm level.
The selection of the firms was based on the personal networks of the authors rather than a systematic data collection from a representative set of firms. Our intent was to get fast directional insight about the firms’ perspectives on concepts and measures of intangibles and innovation. As a result, the interviews were not protocol-driven or standardized. Individual telephone interviews were conducted from July to August 2008. All but one interview was conducted by phone. The one interview was in person. Each interview took about 1 hour and involved two to three follow-ups by email.
The firms interviewed can be divided into three categories. The first category consisted of large, well-known companies that represent a variety of industries—chemicals, insurance, consumer products, retail supplies, and information technology. The second category consisted of small firms that are developing and commercializing high-risk technologies. The third category consists of what may be called “innovation facilitators,” companies that span industries in assisting other companies with innovation—one that facilitates open innovation, one venture capitalist firm, and a

V-4
business-consulting firm. Each firm provided different perspectives on measuring innovative activities internally and at the firms of their clients. The firms are:
• Large companies
Chemicals—Dow Chemicals [VP of R&D]
Insurance and Banking—(insurance company [firm’s name withheld] [former senior manager])12
Consumer Products—Procter & Gamble [former head, Innovation]
Retail—Staples [VP of Emerging Markets]
Information Technology—Sun Microsystems [Senior VP Global Storage]
• Small innovative companies
The Pom Group [CEO]
Relion [Vice-President, R&D]
wTe [CEO]
• Innovation facilitators
Open Innovation—Innocentive [Founder]
Consulting—McKinsey & Company [Partner]
Venture Capital—xSeed Capital Management [Partner]
The firms were asked for their views on a national survey to collect data on innovation activity. All the firms agreed that measuring innovation at the national level would provide valuable information about economic productivity and growth. They believed that these data could also be used to inform policymakers about the importance of innovation to the economy. The respondents noted that although expenditures for most inputs could be obtained, determining what portion was devoted to “innovation inputs” would be difficult. The smaller three firms had less difficulty with this, in part because their products depend on highly focused innovation activities.
The interviews showed that it would be difficult to collect data on innovation, but not impossible. The major difficulty in collecting data on outputs lies in the long time to develop innovations and, as a result, the long wait to measure the rates of returns on those investments. From the firms’ perspectives, measuring expenditures on innovative
12 Anonymous at request of former employee being interviewed.

V-5
activities would require a revamping of their accounting and record keeping systems. An additional issue from a survey design perspective is that each input would have to be specifically defined to ensure that the data were consistent across firms and industries.
Interviews with the companies used the framework developed by other organizations to measure intangible assets that support business innovation strategies and objectives. The focus was on human, intellectual, organizational, and relational capital:
• Human capital refers to the knowledge, skills, and competencies of individuals.
• Intellectual capital refers to the knowledge and technological capabilities of the firm, such as intellectual property (patents, copyrights, and trade secrets), databases, software, and equipment that lead to specialized technological capabilities, and including human capital, organizational knowledge, and information stored in institutional databases.
• Organizational or structural capital encompasses processes, databases, software, and organizational competencies.
• Relational capital refers to relationships with external stakeholders, including customers and suppliers.
Insights about each of these types of capital obtained from the interviews with the companies are discussed below. The role of open innovation is also discussed.
1. Human Capital
Companies universally mentioned human capital as a critical input into all their activities but especially their R&D and innovation activities. Alternative ways of measuring human capital were discussed. Some companies (Proctor & Gamble, The Pom Group, wTe) estimate their investments in human capital by multiplying the number of employees involved in innovation activities, their time spent on innovation activities, and their salaries. Another (the insurance company) measures novel expertise as the number of new hires with expertise not found elsewhere in the company. A third group (Sun, The Pom Group) would estimate the cost of developing human capital by multiplying the training expenditures by the wages of employees for time spent in training. Some companies (Sun, wTe) noted that using a cost-based approach to measure of the value of human capital may underestimate the value of the work force.

V-6
2. Intellectual capital
Because intellectual capital is a critical input into innovation activities throughout the product-development pipeline and provides commercial opportunities, the companies interviewed strategically manage their intellectual property portfolios. All companies agreed that measuring intellectual property is extremely difficult. They confirmed that the value of intellectual capital could be estimated as the cost of creating intellectual property, or the sum of R&D expenditures. However, cost-based estimates of intellectual property value significantly underestimate the value of intellectual property for all types of companies across industries. Often the costs of creating and maintaining intellectual property are less than the value of the contribution of the intellectual property to the innovation process. Since the value of intellectual property can only be determined upon successful commercialization of the innovation, estimations of the value of early-stage intellectual property are fairly speculative. The smaller companies suggested that the costs of managing intellectual property should be included in estimating its value. intellectual property management costs include application fees, maintenance fees, intellectual property insurance, and legal costs. Intellectual property management is a significant investment in resources and represents the value of intellectual property in its innovation strategy and potential for growth, especially for smaller companies where all resources are limited.
3. Organizational Capital
Organizational or structural capital encompasses processes, databases, software, and organizational competencies. Information technology systems are an especially critical part of organizational capital. It is difficult, however, to measure the value of information technology infrastructure because it enables the development of multiple commercial products. information technology systems are used to catalogue, share, and manage new ideas. Information technology helps ideas develop across business lines and S&T focus areas. It helps to develop ideas with collaborative partners, suppliers, customers, etc. Innovation activities require investments in complementary information technology infrastructures that enable innovation to be implemented. These innovation activities generate intermediate outputs that are used as inputs into subsequent innovation activities. Internally developed software and technology platforms support the development of commercial products.

V-7
Firms perform R&D to build a technological knowledge base. Companies can easily and precisely calculate expenditures for all types of R&D in accordance with U.S. and international accounting standards. This measure would not necessarily capture all of the contribution of R&D to a firm, however, because how the firm organizes its R&D activities can also be important, and R&D may not necessarily be tied to a product or set of products. The scope of research performed depends on the breadth of the firm’s innovation strategy and portfolio of innovations. All science- and technology-based companies perform applied research to support product development. In larger companies such as Dow Chemicals, Sun Microsystems, and Proctor & Gamble, applied research is aligned with business lines and supports the improvements to existing products and development of related products. Small, specialized, technology-oriented firms, such as the Pom Group, wTe, and ReliOn, conduct applied research within product-development pipelines. Large firms with multiple complementary product lines also perform basic research to develop a platform of knowledge that can be leveraged across product lines. Core basic research is performed independently of business lines. Moreover, R&D simultaneously contributes to human capital and intellectual capital by enabling individual employees to learn and develop skills and by enhancing the company’s knowledge stocks.
Firms construct and test prototypes in the final stages of product development. The value of organizational capital developed through prototype testing and of the commercial insights gained cannot easily be calculated, even though the costs of constructing prototypes and conducting tests can readily be broken out by product. Dow, Proctor & Gamble, and ReliOn described health, safety, and environmental durability testing requirements in several industries, including chemicals, pharmaceuticals, and energy infrastructure. The results of these tests are used to refine products and pre-market regulatory requirements. Some companies, such as wTe, Pom, ReliOn, and Sun Microsystems, develop their products as components to be integrated into specialized systems. Companies that develop components and systems usually test prototypes in the customer’s systems. Customers provide feedback on system performance and technical needs that is used to improve existing products and fulfill customer specifications. Small companies in narrow and emerging markets, such as Pom Group, wTe, and ReliOn, use customer feedback to gain a better understanding of the market and opportunities for growth. In this manner, prototype testing supports technical product development and facilitates commercialization by identifying customer needs.

V-8
An important part of organizational capital is commercialization of innovations. Successful commercialization depends on understanding the market, but measuring marketing research is not always straightforward. Several firms, including insurance companies and small, technology-based companies, perform market-exploration activities. Traditional market research activities include market segmentation studies to characterize customer populations to identify market opportunities, inform marketing strategies, and identify the specific needs of subgroups within the population. Companies in customer service industries, such as insurance companies, conduct extensive traditional market research. Companies also engage in customer networking activities, such as conference and trade show participation, to better target commercialization and marketing efforts. Networking activities are especially important to firms operating in emerging markets. Market exploration is essential for developing innovation strategies, developing commercialization capabilities for introducing new products, and facilitating diffusion.
Expenditures on traditional market research can readily be obtained from the annual operating budget. Because market research budgets are typically only available for business lines, however, it would be difficult to estimate expenditures for activities related to innovative products. The small companies that rely on networking to explore market opportunities do not include a budget item for market research, but they could estimate expenditures by summing the cost of attending conferences and adding to that the time spent at conferences multiplied by salaries. Thus, expenditures on market research and exploration related to innovations can be calculated accurately, but not directly from operational budgets.
4. Relational Capital
Relational capital refers to the relationships that firms have with external organizations involved in innovation, including technological development, prototype construction and testing, market research, production, supply and distribution chains, and launch marketing. Relational capital also includes internal mechanisms for leveraging these relationships effectively. Relational capital provides access to open-source networks (discussed below). This form of capital enables firms to focus their resources on the innovation activities in which they have the intellectual capital and for which they are best suited. It is especially important for smaller firms with highly specialized and narrow niche capabilities.

V-9
To access knowledge and capabilities not available internally, firms collaborate in all stages of development and commercialization. The mechanism and structure of the collaboration is a function of the activity performed, and includes collaboration on research, marketing, sourcing and production collaboration, and innovation. Dow and Pom described research collaborations with universities and government labs in which the companies funded basic research related to technological barriers in product development at the universities. University and government partners have broad scientific knowledge bases and access to technologies that enable them to perform research for which the companies are not suited. Proctor & Gamble, Sun Microsystems, Dow, wTe, Pom, and ReliOn described joint ventures with other companies in which both provide resources and perform activities to develop specific products. The roles of each company in the joint venture are related to their specific niche competencies and capabilities. Insurance companies collaborate with marketing firms to perform market research and exploration, because most insurance companies lack deep marketing expertise and resources to perform extensive research. Staples and ReliOn have collaborated with suppliers and manufacturers to produce branded products or component parts. In production collaborations, the company pays the manufacturer to produce the product according to specification.
An innovating company participates in collaborations because it lacks the expertise and resources to exploit an innovation, develop the needed technology, or produce a new product efficiently. Sun Microsystems, Staples, and the insurance company described collaborations to develop and implement information technology infrastructures that enable innovation and improve efficiency. Companies like Staples and the insurance company understand the opportunities for innovation and improved performance enabled by an enhanced information technology infrastructure and are able to articulate their needs, but do not have the resources and capabilities to develop technology internally. Companies like Sun Microsystems have the capability to tailor their generic technologies to meet customer specifications.13
All companies identified collaborations as a critical component of innovation. None of the firms interviewed have developed a current quantitative measure of the value
13 Adapting generic technologies to fulfill specific needs is considered an innovation if it is new to
company, new to a market, or new to an industry.

V-10
of collaborations for their annual reports, and none could propose a feasible method. Expenditures on collaborative activities can be obtained from budgets. However, cost-based estimates of the value of collaborations underestimate the strategic value. Since companies participate in collaborations to leverage knowledge available elsewhere, the companies interviewed offered several approaches to measure the value of collaboration. Some suggested that the value of collaborations should include the value of intellectual property generated and used. The value of that intellectual property could be calculated according to licensing fees and royalties paid in using the intellectual property. Another way to estimate the value of collaborations could be the marginal cost savings from outsourcing the activity as opposed to performing it internally. A third approach could be to estimate the opportunity costs of having to develop the expertise and capabilities saved by collaborating. Such cost-saving measures would accurately reflect the value of the collaboration. It would be extremely difficult to reliably determine savings in resources and time, however, because such calculations are based on subjective estimates of what it would cost to develop the knowledge and expertise to perform the activity internally.
5. Open Innovation
Several companies have begun to integrate open innovation into their innovation strategy. Open innovation strategies explore a broader solution space, while reducing R&D risks and costs compared with conventional “closed” collaborations and partnerships. Companies post R&D and commercialization challenges on Web-based forums or “marketplaces,” such as Innocentive, which are accessible to communities of scientists, engineers, and entrepreneurs. “Solvers” propose solutions that leverage their unique expertise and skills. Companies evaluate all of the alternative solutions and only pay for the most feasible and successful solutions.
Open innovation is a supplement to internal R&D and commercialization activities, not a replacement for them. Companies need to develop their own knowledge stocks to effectively leverage solutions provided by outside solvers. Moreover, companies must develop internal organizational structures and problem-solving approaches to effectively leverage open innovation. Some companies, such as Proctor & Gamble, have established their own open innovation network. Others use established marketplaces, such as Innocentive. The cost of performing open innovation can be calculated based on the cost of posting to innovation marketplaces and networks and prizes awarded for successful solutions. Such cost-based measurements do not include the strategic value of evaluating multiple alternatives simultaneously. Because open

V-11
innovation is a new strategy, companies were not able to propose robust quantitative measures of the value of open innovation activities.
In summary, the companies that we interviewed were keenly aware of the role of innovation both to their own success and to the competitiveness of the United States. Key insights were gleaned from our discussions with these companies. In particular, they felt that they could quantitatively measure innovation activities but would have to change their accounting frameworks to do so. There was a sense that they would be willing to do this, although it would not be easy.


VI-1
VI. RECOMMENDATIONS AND FUTURE WORK
This report builds on the premise that innovation, defined broadly as the application of knowledge in a novel way primarily for economic benefit, is becoming increasingly important, not just to firms but also to nations. Governments around the world view innovation as a prerequisite for competitive advantage in a globalized economy and wish to measure and, more important, manage innovation and its impact explicitly.
The problem in trying to develop measures of innovation is that multiple definitions are being used. Some define innovation as products and processes that result from R&D and related activities, and others define it as the R&D and related activities themselves (Godin 2002). Because of the difficulty in defining and therefore measuring innovation, many have turned to measuring intangible assets, which include R&D and related intellectual property, human capital, organizational capital, and relational or collaborative capital. This classification scheme has been outlined and elaborated on by international organizations, such as the OECD and Eurostat, and individual countries, such as Canada, Australia, and Japan. This classification scheme developed to measure and assess innovation and intangible assets by these organizations and countries provides a basic framework for organizing data collection on innovation and intangibles.
Many firms do not track inputs and outputs that result from innovation activities, but some have begun to do so (McKinsey 2008). Interviews with firms underscore the difficulties in developing concepts and measures of innovation and intangible assets:
• Some firms are able to measures investments in innovation by business line with accuracy (80% to 90%). Some of the companies that we had discussions with (P&G, Dow, Sun) tend to have explicit innovation strategies. Small firms that focus on developing core competencies can break out expenditures for innovation activities related to the development of competencies (wTe).14
• In general, firms do not track expenditures on innovation activities. If management strategies do not focus on innovation, it is difficult for managers
14 This is based on information gleaned from conversations with the companies noted (see Appendix E).

VI-2
to track expenditures on innovation activities within in their operational budgets.15
Current approaches focus on developing and using metrics of innovation, combining both qualitative and quantitative measures of innovation and intangible assets, or making rough estimates of the value of innovation inputs and outputs that set some lower bounds on their value. Future work should focus on defining which intangibles are inputs and outputs in the innovation process. To be able to measure investment expenditures on innovation and intangible assets would require significant changes in accounting practices and methods. While accounting practices are evolving to consider the role of innovation activities, it may take a while for them to meet the needs of innovation researchers.
Other innovative approaches are also being suggested. For example, at a recent workshop sponsored by The Conference Board and the National Science Foundation, participants proposed new methods (Corrado 2008). These include creating innovation frames based on data from National Organization Surveys, of which three have been fielded using data derived from the General Social Survey. Another approach is called “scraping the Web.” A Cornell project called “Next Generation Cyber Tools” captures and stores snapshots of the Web every 2 months and has been doing so for the last 10 years. A front-end search engine is being built to conduct advanced searches that allow for natural-language processing, machine-learning algorithms, and confidentiality approaches to pull out and synthesize data on businesses. Yet another approach involves developing new approaches to collect, analyze, and visualize qualitative and quantitative data on organizations (Corrado 2008).
Future work in developing estimates of innovation would focus on improving knowledge of what businesses can and cannot measure, using in-depth and systematic protocol-driven interviews of a representative set of firms. This information could be used to develop data sources. In addition, work with international organizations, including the OECD, Eurostat, and the IASB, is a necessary part of this effort.
15 Anonymous former employee of an insurance company. See note 12.

Ref-1
REFERENCES
Advisory Committee on Measuring Innovation in the 21st Century Economy. 2008. Innovation measurement: Tracking the state of innovation in the American economy. Report to the Secretary of Commerce.
Andrew, J. and H. Sirkin. 2007. Using the cash curve to discuss and discipline innovation investments. Strategy and Leadership 35:11–17.
Arundel, A. 2007. Innovation survey indicators: What impact on innovation policy? Science, Technology, and Innovation Indicators in a Changing World: Responding to Policy Needs. OECD.
Atrostic, B. K. 2008. Measuring U.S. innovation activity. Journal of Technology Transfer 33(2), April.
Australian Bureau of Statistics. 2005. Innovation in Australian Business. Commonwealth of Australia. http://www.ausstats.abs.gov.au/ausstats/subscriber.nsf/0/ F3D82F80A28513D2CA25723C000E991F/$File/81580_2005.pdf, accessed 15 December 2008.
———. 2008a. Measuring Innovation: Towards Developing a Scorecard. Commonwealth of Australia.
———. 2008b. Innovation in Australian Business. Commonwealth of Australia. Australia Department of Education, Science and Training. 2004. National survey of
research commercialisation, years 2001 and 2002: Selected measures of commercialisation activity in universities and publicly funded research agencies. October. http://www.dest.gov.au/NR/rdonlyres/98AE3EC9-62DF-4B3F-98D4-4C08363E7F55/4484/part_a.pdf, accessed 15 December 2008.
Bhide, A. 2008. The Venturesome Economy. Princeton University Press. Blair, M.. and S. M. H. Wallman. 2001. Unseen Wealth: Report of the Brookings Task
Force on Intangibles. Washington, D.C.: Brookings Institution Press. Bloom, N., and Van Reenen, S. 2002. Patents, real options and firm performance.
Economics Journal 7(4): 629–632. November. Bontis, N. 2001. Assessing knowledge assets: A review of the models used to measure
intellectual capital. International Journal of Management Reviews March: 41–60. Booz Allen Hamilton. 2007. Measuring innovation: identification of firm-specific data
items that can enable comparisons and aggregation. Public Comment Submission to DoC Advisory Committee on Measuring Innovation in the 21st Century.
Bosworth, B., and S. Collins, 2003. The empirics of growth: An update. Brookings Institution and Georgetown University.

Ref-2
Bounfour, A. 2003. The IC-dVAL approach. Journal of Intellectual Capital 2003:396–412.
Branscomb, L. 2008. Research alone is not enough. Science 321 (5891): 915–916. Caruso, D. 2008. The real value of intangibles. Strategy + Business, reprint No. 08302. Cisco, 2007. Innovation: Transforming the way business creates. An Economist
Intelligence Unit white paper, sponsored by Cisco Systems. CIS IV. 2004. The Fourth Community Innovation Survey, (CIS IV): The Harmonized
Survey Questionnaire. 20 October. http://www.oecd.org/dataoecd/52/35/ 40140021.pdf, accessed 23 December 2008.
Corrado, Carol. 2008. Workshop on Developing a New Research Data Infrastructure for the Study of Organizations and Innovation (23 July 2008). Workshop Report. New York: The Conference Board, November 10.
Corrado, C., C. Hulten, and D. Sichel, 2006. Intangible Capital and Economic Growth. Cambridge, Massachusetts: National Bureau of Economic Research.
Earl, L., F. Gault, and M. Bordt. 2004. Summary: Meeting on commercialization measurement, indicators, gaps and frameworks, Ottawa. Statistics Canada.
Edvinsson, L. 1997. Developing intellectual capital at Skandia. Long Range Planning 30:366–373.
European Commission. 2008. Science, Technology, and Innovation in Europe. Eurostat Pocketbooks.
Fukao, K. et al. 2008. Intangible investment in Japan: New estimates and contribution to economic growth. Global COE Hi-Stat Discussion Paper Series. Tokyo: Institute of Economic Research, Hitotsubashi University.
Godin, B. 1996. The state of science and technology indicators in the OECD countries. INRS/CIRST, submitted to Statistics Canada.
———. 2002. The Rise of innovation surveys: Measuring a fuzzy concept. Project on the History and Sociology of STI Statistics, Paper no. 16.
———. 2003. The rise of innovation surveys: Measuring a fuzzy concept. Project on the History and Sociology of STI Statistics, Working Paper No. 16.
Grossman, G., and E. Helpman. 1994. Endogneous innovation in the theory of growth. The Journal of Economic Perspectives 8(1) (Winter): 23–44.
Hill, P., and R. Youngman. 2003. The measurement of intellectual capital formation in the system of national accounts. PRISM WP5.
Hoegh-Krohn, N., and Knivsfla, K. 2000. Accounting for intangible assets in Scandinavia, the UK, the US, and by the IASC: Challenges and a solution. The International Journal of Accounting 35(2): 243–265.
Hunter, L., E. Webster, A. Wyatt. 2005. Measuring intangible capital: A review of current practice. Australian Accounting Review 15:4–21.
Huston, L. and N. Sakkab. 2007. Connect and develop. Harvard Business Review 84(3): 47–55.

Ref-3
International Accounting Standards Board. 2007. Initial accounting for internally generated intangible assets.
IASB. n.d. Technical summary: framework for the preparation and presentation of financial statements. http://www.iasb.org/NR/rdonlyres/E366C162-17E4-4FBE-80EB-7A506A615138/0/Framework.pdf, accessed 15 December 2008
IASB. 2008. Using judgement to measure the fair value of financial instruments when markets are no longer active. October. http://www.iasb.org/NR/rdonlyres/ F3AFDA4D-6605-42CE-858F-23BBB9044355/0/IASB_Staff_Summary_ October_2008.pdf, accessed 15 December 2008.
IAS 38. n.d. IASC Foundation. IAS 38 intangible assets. http://www.iasb.org/NR/rdonlyres/149D67E2-6769-4E8F-976D-6BABEB783D90/0/IAS38.pdf , accessed 15 December 2008
IFRS 3. n.d. IASC Foundation. IFRS 3 business combinations. http://www.iasb.org/NR/rdonlyres/73E562FE-F581-4DD4-8365-B17E228955C9/ 0/IFRS3.pdf , accessed 15 December 2008.
IASC 36. n.d. IASC Foundation. IAS 36 impairment of assets. http://www.iasb.org/NR/rdonlyres/A288C781-7D39-4988-BA71-9AB77A263BA0/0/IAS36.pdf , accessed 15 December 2008.
Japanese National Innovation Survey. 2003. http://www.nistep.go.jp/nistep/about/ thema/thema2-e.html, accessed 15 December 2008.
Jarboe, K. P. 2007. Measuring Intangibles: A Summary of Recent Activity, Alliance for Science and Technology Research in America (ASTRA), April.
Jarboe, K. P. and R. Furrow. 2008. Intangible asset monetization: The promise and the reality. Working Paper #03, Athena Alliance, April.
Landefeld, J. S. 2008. Measuring innovation’s role in GDP & productivity growth. Embassy of Sweden, 11 February.
Lev, B. 2001. Intangibles: Management, Measurement, and Reporting. Washington D.C.: Brookings Institution Press.
Mairesse, J., and P. Mohnen. 2007. A survey of innovation surveys: Taking stock of a growing literature. Paper prepared for presentation at the CEPR-Banque de France conference on innovation, Enghien-les-Bains, 5–6 July 2007. http://www.cepr.org/meets/wkcn/6/6658/ papers/Mairesse_Mohnen.pdf (accessed 17 December 2008.
Mandel, M. 2008. Can we invent its way back? Business Week, September 22. McKinsey. 2008. McKinsey global survey results: Assessing innovation metrics. The
McKinsey Quarterly, October. Milbergs, E., and N. Vonortas. n.d. Innovation metrics: Measurement to insight. Center
for Accelerating Innovation and Nicholas Vonortas, George Washington University for the National Innovation Initiative 21st Century Working Group. http://www.innovationtools.com/pdf/Innovation-Metrics-NII.pdf, accessed 17 December 2008.

Ref-4
Massachusetts Technology Collaborative, John Adams Innovation Institute. 2007. 2007 index of the Massachusetts innovation economy. http://web3.streamhoster.com/ mtc/Index020108.pdf, accessed 15 December 2008
Moris, F., J. Jankowski, and P. Perrolle. 2008. Advancing measures of innovation in the United States. Journal of Technology Transfer 33(2) (April).
National Research Council. 2004. Measuring Research and Development Expenditures in the U.S. Economy. Lawrence D. Brown, Thomas J. Plewes, and Marisa A. Gerstein, Editors. Panel on Research and Development Statistics. Washington, DC: National Academy Press.
Nakumura, L. 2001. What is the U.S. gross investment in intangibles? (At least) one trillion dollars a year! Working Paper No. 01-15. Federal Reserve Bank of Philadelphia, October.
National Science Foundation. n.d.. Survey methodology and questionnaires, 2001 information technology innovation survey. Obtained from L. Rausch at NSF, 14 August 2008 e-mail.
OECD. 1991. OECD Proposed Guidelines for Collecting and Interpreting Innovation Data (Oslo Manual). Paris, France: OECD.
———. 1995, The Measurement of Scientific and Technological Activities: Manual on the Measurement of Human Resources Devoted to S&T “Canberra Manual.” Paris, France: OECD. http://www.oecd.org/dataoecd/34/0/2096025.pdf, accessed 17 December 2008.
———. 2002. Frascati Manual: Proposed Standard Practice for Surveys on Research and Experimental Development. Paris, France: OECD. http://europa.eu.int/ estatref/info/sdds/en/rd/rd_frascati_manual_2002.pdf, accessed 17 December 2008.
———. 2005, Oslo Manual: Guidelines for Collecting and Interpreting Innovation Data (3rd edition). Paris, France: OECD.
———. 2006. Community innovation statistics: From today’s community innovation surveys to better surveys tomorrow. http://www.oecd.org/dataoecd/37/39/ 37489901.pdf, accessed 17 December 2008.
———. 2007, Science, Technology, and Innovation in a Changing World: Responding to Policy Needs. OECD Blue Sky II Forum.
———. 2008. Intellectual assets and value creation: Synthesis report. OECD. http://www.oecd.org/dataoecd/36/35/40637101.pdf, accessed 17 December 2008.
OECD Secretariat. 1998. National Efforts to Measure Intangible Investment. Paris Palmer, D., and S. Kaplan. 2007. A framework for strategic innovation: Blending strategy
and creative exploration to discover business opportunities. Innovation Point. http://www.scribd.com/doc/8948959/strategic-innovation-white-paper, accessed 17 December 2008.
Porter, M. 1998. The Competitive Advantage of Nations. New York: The Free Press.

Ref-5
Rausch, L. M. 1996. R&D continues to be an important part of the innovation process. Data Brief 1996(7). http://www.nsf.gov/statistics/databrf/sdb96313.htm, accessed 17 December 2008.
Romer, P. 1990. Endogenous technical change. Journal of Political Economy 7 (4) (November): 71–103.
Statistics Canada. 2005. Survey of innovation 2005. http://www.statcan.gc.ca/imdb-bmdi/instrument/4218_Q1_V5-eng.pdf, accessed 23 De¬cember 2008.
Statistics Canada. 2006a. Survey of intellectual property commercialization in the higher education sector. http://www.statcan.ca/cgi-bin/imdb/p2SV.pl?Function= getSurvey&SDDS=4222&lang= en&db=imdb&dbg=f&adm=8&dis=2, accessed 15 December 2008.
Statistics Canada. 2006b. Survey on Commercialization and R&D Impacts. STEP Economics. 2000. The analysis of CIS II data: Towards an identification of
regional innovation systems. Final Report. December/ Sveiby, K. E. 1997. The intangible assets monitor. Journal of Human Resource Costing
and Accounting. 2(1). Sun Microsystems Corporate Backgrounder. 2008. http://www.sun.com/aboutsun/
media/presskits/SunCorporateBackgrounder.pdf. June. Accessed 17 December 2008.
van Ark, B., and C. Hulten. 2007. Innovation, intangibles and economic growth: Towards a comprehensive accounting of the knowledge economy. Economics Program Working Paper Series, EPWP #07 – 02.
Wolfe, R. 2008. NSF announces new U.S. business R&D and innovation survey. National Science Foundation, NSF 09-304, November. http://www.nsf.gov/ statistics/infbrief/nsf09304/, accessed 22 December 2008.


A-1
APPENDIX A—GOVERNMENT INITIATIVES TO EXAMINE INNOVATION MEASUREMENT
Table A-1: A Summary of Selected Government Initiatives to Measure Innovation Sponsor Initiative Description
Congress COMPETES Act (P.L. 110-69) (August 2007)
Establishes a President’s Council on Innovation and Competitiveness. In addition to policy monitoring and advice, the Council’s duties include “developing a process for using metrics to assess the impact of existing and proposed policies and rules that affect innovation capabilities in the United States,” as well as “developing metrics for measuring the progress of the Federal government with respect to improving conditions for innovation, including through talent development, investment, and infrastructure development.”
Office of Science and Technology Policy
Science of Science Policy (SoSP) Interagency Task Group
Established in October 2006, the task group is analyzing federal and international efforts in science and innovation policy, identifying tools needed for new indicators, and charting a strategic road map to improve theoretical frameworks, data, models, and methodologies. a
National Science Foundation
Science of Science and Innovation Policy (SciSIP)
Established in 2006, the initiative is expected to develop the foundations of an evidence-based platform from which policymakers and researchers may assess the nation’s S&E enterprise, improve their understanding of its dynamics, and predict its outcomes. The research, data collection, and community development components of SciSIP’s activities will:b
• develop theories of creative processes and their transformation into social and economic outcomes;
• improve and expand science metrics, datasets, and analytical tools; and
• develop a community of experts on SciSIP.
National Science Foundation
Workshop on Advancing Measures of Innovation: Knowledge Flows, Business Metrics, and Measurement Strategies (2006)
The workshop was in response to the challenge set forth by Dr. John H. Marburger III, the president’s S&T adviser, for better data, models, and tools for understanding the U.S. S&E enterprise. A number of strategies for data development were discussed:
• survey-based methods,
• data linking and data integration,
• nonsurvey-based methods (such as mining of administrative data), and
• using case studies and qualitative data. These diverse strategies are not mutually exclusive.
OECD Blue Sky Forum (OECD 2007)
The forum discussed the development of new and better indicators of science, technology, and innovation and developed a synthesis of findings toward an agenda for the next decade.
Department of Commerce
Innovation Measurement: Tracking the State of Innovation in the American Economy (2008)
This committee of business and academic leaders was charged to develop new and improved measures of innovation in three areas: how innovation occurs in different sectors of the economy, how it is diffused across the economy, and how it affects economic growth.
a “The Science of Science Policy Roadmap: A Federal Research Roadmap,” November 2008 (Washington, DC: NSTC, OSTP), http://scienceofsciencepolicy.net/uploads/SoSP_Report.pdf, accessed 22 December 2008.
b Science of Science and Innovation Policy Newsletter, Volume 1, Issue 1 October 2008, http://www.nsf.gov/sbe/scisip/scisipnews1.pdf, accessed 22 December 2008.


B-1
APPENDIX B—BUSINESS STRATEGIES AND TOOLS FOR MEASURING INNOVATION CAPACITY AND INTANGIBLE
ASSETS
Intangible Asset Monitor
The Intangible Asset Monitor is a framework for measuring intangible assets and knowledge flows using non-monetary metrics (Bontis 2001; Sveiby 1997). It is based on the premise that firms accumulate intangible assets to enable knowledge and tangible inputs to be converted into tangible outputs and financial outcomes. The framework focuses on three categories of intangible assets:
• External structure—brand assets and relationships to outside stakeholders.
• Internal structure—management and organizational processes, legal resources, R&D, and software.
• Individual competencies—the knowledge and skills of professional employees who are involved in product design, development, commercialization, and production.16
Internal structural assets relate directly to operational efficiency and are readily measured in traditional accounting frameworks. External structural and individual competencies do not correlate directly with financial outcomes, however, and consequently are not easily evaluated with conventional monetary measures. The Intangible Asset Monitor does not specifically measure innovation inputs and activities.
The values of intangible assets are evaluated according to three categories of metrics:
• Growth and renewal metrics reflect the firm’s propensity to innovate and adapt to market changes, including customer demand and supply of inputs.
16 The Intangible Asset Monitor classifies employees as either professional or support. Professional
employees are involved in the design, development, and production of products. Support employees are involved in the development and maintenance of the organization of the business entity. While professional employees directly interact with customers, support employees do not. Accordingly, professional employees are the focus of measurements of knowledge, skills, and competencies, and support employees are included in the analysis of internal intangible assets, which includes organizational capital.

B-2
• Stability metrics reflect the firm’s past performance in meeting customer demand and adapting to market changes.
• Efficiency metrics reflect the firm’s ability to perform in a cost-effective and timely manner.
The Intangible Asset Monitor presents an array of monetary and non-monetary metrics, which comprehensively describe the value of intangible assets. However, most quantitative metrics can be converted into monetary metrics by calculating the metric as a function of a financial outcome. Table B-1 provides examples of monetary indicators for each category of intangible asset in each type of indicator. Firms develop specific indicators in accordance with strategic objectives and business processes.
Table B-1: Intangible Asset Monitor Monetary Indicators Growth and Renewal Efficiency Stability
Internal Structure Investments in R&D Training costs for support employees
Sales per staff employee
Market share
External Structure Proportion of sales from new customers
Proportion of sales (or profit) per individual customer
Proportion of sales (or profit) from repeat customers
Individual Competencies
Training costs for professional employee
Proportion of sales per professional employee
Experience of professional employees expressed as salary
Skandia Navigator
Skandia, a Swedish financial and accounting services firm, was the first large company to produce an intellectual capital report as an addendum to traditional financial reports. Numerous other companies have adopted Skandia’s r methods for measuring and reporting intellectual capital (Bontis, 2001).
The Skandia Navigator is a framework for relating the knowledge and skills underlying organizational competencies to outcomes. It is based on the premise that intellectual capital is a set of “hidden factors” that drive tangible outcomes, including innovative products, market share, and profits. Intellectual capital is the sum of human and structural capital. Human capital refers to the knowledge, skills, and innovativeness of individual employees. Structural capital consists of all the tangible and intangible assets that support employee productivity. There are four types of structural capital:

B-3
1. Customer capital—relationships with customers and knowledge generated through market research.
2. Organizational capital—the intellectual property and businesses processes owned by the company and comprising innovation and process capital.
3. Innovation capital—the knowledge and assets that enable the development and commercialization of new products.
4. Process capital—the business processes and routines involved in the design, development, commercialization, production, and distribution of new products.
The Skandia Navigator applies a balance sheet approach to link the human and structural capital underlying organizational competencies to financial and economic outcomes related to strategic objectives and goals.
The Skandia Navigator framework comprises five components:
1. Financial resources.
2. Customer relations.
3. Processes.
4. Renewal and development.
5. Human capital.
This framework reflects the firm’s organization and fundamental business processes. Within each component, intellectual assets are evaluated using monetary and non-monetary quantitative metrics. Most quantitative metrics can be transformed into monetary metrics by expressing the measurement as a function of revenues, sales, or profits. Table B-2 provides examples of the quantitative metrics featured in the Skandia Navigator (Bontis 2001; Hunter, Webster, and Wyatt 2005). Firms develop idiosyncratic metrics based on their activities and strategic goals.
The Navigator describes the firm’s total intellectual capital using two composite metrics:
1. The intellectual capital value is a composite of investment measures that reflects the firm’s commitment to the future and its potential for innovation and growth.
2. The intellectual capital efficiency index is a composite of monetary and non-monetary indicators that reflects the firm’s current position and the direction and velocity of innovation and growth.

B-4
Table B-2: Monetary Indicators Used in the Skandia Navigator Human capital Structural capital
Financial assets Revenues per employee Market share Customer assets Proportion of employees involved
in commercialization activities expressed as salary
Proportion of total revenue resulting from repeat or “large” customers Marketing research
Processes Administrative and support expenses per employee
Profits resulting from new business operations Investments in information and communications technology
Renewal and Development
Expenditures for training Employees involved in R&D expressed as salary
Expenditures on total R&D
Human resources Value added per employee (marginal sales)
Pay structure of professional employees based on education and experience
Organizational intellectual capital is the product of the intellectual capital value and the intellectual capital efficiency indices. This approach can be applied at any level of aggregation, from business lines, to firms, to national innovation systems. Although the Skandia Navigator includes financial metrics, it does not calculate a dollar value for a firm’s total intellectual capital.
IC-dVal
IC-dVal applies a resource-based view of the firm, in which resources are accumulated and deployed through organizational processes to produce outputs and achieve economic outcomes, to correlate the financial value of intangible assets with economic performance (Bounfour 2003). The IC-dVal focuses on four intangible resources:
1. Human capital.
2. Innovation capital.
3. Structural (organizational) capital.
4. Market capital.
The IC-dVal is intended to be used as a tool for managing intangible resources at the firm level. It has also been used to benchmark the accumulation and use of intangible assets across countries (Bounfour 2003).

B-5
The IC-dVal evaluates the value of the four types of intangible assets described above within the context of four components of economic performance:
1. Resources.
2. Processes.
3. Asset accumulation.
4. Outputs.
Within each component the intangible assets are evaluated in terms of investments and performance. Table B-3 provides examples of metrics for each type of intangible asset with respect to each type of economic performance. Monetary metrics are used to calculate indices of value using conventional accounting and economic methods, including market-to-book value, value of replacement, and Tobin’s q.17
Table B-3: IC-dVal Measurements of Intangible Assets Based on Expenditures Human Capital Innovation capital Structural capital Market capital
Resources Training R&D Information and communications technology Joint ventures and collaborations
Brand
Processes (none included) Prototype test and evaluation
Internal activities related to development of innovations
Market research
Asset accumulation
(none included) Intellectual property (from internal R&D) acquired intellectual property
Intellectual property Software
Brand
Outputs Labor productivity
New products (none include) Proportion of revenues resulting from new products
17 Tobin’s q is the ratio comparing the value of the stocks of a company listed in a financial market with
the value of a company’s equity book value. It is calculated by dividing the market value of a company by the replacement value of the book equity. Tobin’s q = [(equity market value + liabilities book value) / (equity market value + liabilities book value)]. If Tobin’s q is greater than 1, then the market value is greater than the value of the company’s recorded assets. Another use for q is to determine the valuation of the market as a whole. The formula for this is q = value of stock market / corporate net worth.

B-6
Economic Value Added
Economic value added (EVA) measures the value added from the accumulation of intangible assets (Bontis, 2001). EVA reflects the change in market value added (MVA) over time. MVA, which is the difference between the capital invested and the net present value of a firm, is used as a proxy for the dollar value of intangible assets.18 Increases in market value reflect the accumulation of intangible assets, and the value added from the accumulation of intangible assets is estimated as the change in MVA. EVA represents the interest earned through the accumulation of knowledge and skills. Like MVA, EVA is based on the assumption that the value of intangible assets is approximately the difference between the cost of investments and the market value of the company.
EVA captures revenue, current costs, and capital investment in a single metric. It is calculated as net sales less operating expenses, taxes, and capitalized investments. The value of accumulated knowledge and intangible assets is estimated by dividing EVA by the costs associated with the development of knowledge, skills, and associated intangible assets. EVA (and MVA) is used for firm-level analyses. EVA can only be used to estimate the value of intangible assets collectively. It cannot be used to estimate the value of specific intangible assets, unless specific investments can be identified.
Cash Curve
A cash curve illustrates the cumulative flow of cash throughout the innovation process. It uses cash realized (referred to as payback) as a metric for evaluating the progress and success of the innovation process for a specific product. The cash flow at any point in the innovation process is a function of prior investments, current costs, and real and projected sales revenue (from the product). The cash curve provides estimates of cash flow based on assumptions about technical feasibility and the market.
The cash curve, which illustrates the cumulative cash flow over time, is defined by initial development and commercialization costs, the speed with which the product is brought to market, and time it takes to attain the intended market share. The cash curve is composed of four components:
18 Net present value is based on the firm’s operating profit or the amount for which it would be sold.

B-7
1. Start-up costs include all investments to develop the capabilities and acquire assets involved in an innovation project. These investments are sunk costs.
2. Commercialization costs (also referred to as support costs) include all investments and costs that support production, commercialization, and product diffusion, such as market research, production technologies and infrastructure, product improvements, and customer support.
3. Time-to-market refers to the time it takes to develop an innovation from discovery and conceptualization to production. It describes the speed with which a product is developed.
4. Time-to-volume refers to the time it takes to obtain the planned market share.
Time-to-market and time-to-volume indicate the speed with which returns to investments will be realized. The break-even point refers to production level at which the net cash flow is zero and is becoming positive. It is the inflection point on the cash curve at which start-up and commercialization costs are recovered, but the firm does not obtain a profit. Cash curves do not include investments in specific intangible assets and innovation activities.
Technology Factors
The Technology Factors is a tool for managing intellectual assets and evaluating the productivity of R&D and other activities that generate intellectual capital (Bontis 2001). The use of patents and other forms of intellectual property as proxies for intellectual capital is based on empirical evidence that firms with highly cited patents have higher market value. This measure is an improvement over traditional accounting methods, which value patents in terms of the cost incurred to obtain the patent. Such measures do not take into account R&D expenditures, potential marketability of producing products involving the patent, and the legal costs in maintaining and protecting the patent. Thus, this comprehensive patent-evaluation process is a more accurate measure of the value of intellectual capital generated by innovation activities. This approach was first used by Dow Chemicals and has since been adopted by other science-and-technology-intensive enterprises.
The technology factor is a composite index of a number of financial indicators, including:
• R&D expense per sales dollar.
• Income per R&D expense.

B-8
• Cost of patent maintenance per sales dollar.
• Project costs per sales dollar.
The resulting index is a measure of the impact of R&D efforts that result in the creation of intellectual property. Although the technology factor is a robust indicator, it can only be used to assess activities that result in formal intellectual property and cannot easily be used to asses the value of informal intellectual property, such as trade secrets.
Conductance
Firms create a portfolio of innovations by leveraging technological and commercialization capabilities across product lines. Some have developed and used an approach called “conductance” to evaluate innovation pipelines and measure the value of investments in innovation inputs and activities before actual returns are realized. Conductance describes the efficiency with which resources are used to produce an output or the productivity of a portfolio of innovation projects.19 It is measured as the ratio of outputs to costs invested in the development of a portfolio of innovations. Useful outputs may include the number of projects meeting a benchmark, number of innovative products introduced to the market, or revenues from products in that portfolio. Measures of conductance, which relate inputs to outputs, can be used to evaluate the efficiency of innovation activities at all stages of the innovation process. They can be adapted to measure the efficiency with which early stage activities yield intermediate outputs that are subsequently used as inputs into later stage processes.
19 Personal Communication with Alpheus Bigham. Further discussed at Innoblogger
(http://www.innoblogger.com).

C-1
APPENDIX C—INTERNATIONAL SURVEYS ON INNOVATION
EUROPEAN UNION COMMUNITY INNOVATION SURVEY
The EU measures the nature and intensity of innovation through the Community Innovation Survey (European Commission 2008, Mairesse and Mohnen 2007).20 Since 1993, the EU has conducted five Community Innovation Surveys. Over time, the Survey has evolved to reflect an improved understanding of innovation and methods for measuring innovation. The Community Innovation Survey is a survey framework comprising a core set of questions and definitions of innovation inputs, activities, and outputs. The Community Innovation Survey is used to identify the national and regional determinants of innovation by correlating inputs and outputs of innovation activities. Although all 27 EU countries follow the core questionnaire, many add additional questions that relate to national policies and innovation strategies. National statistical agencies conduct the innovation survey every 2 years and publish a national report.21 The EU Commission uses data from the core questionnaire to construct the European Innovation Scoreboard (discussed below).
Types of innovations
The Community Innovation Survey collects data on four types of innovations:
• Product and services with characteristics, capabilities, and intended uses that differ significantly from existing products.
• Processes involving production methods, logistics systems, and support services that are intended to improve the quality, efficiency, and flexibility of production and logistics.
20 The material in this section is primarily from the European Commission 2008 report. 21 CIS was collected and disseminated every 4 years and covered the most recent 2 years. Beginning with
the fifth CIS, which was conducted in early 2007, surveys will be conducted approximately every 2 years (Mairesse and Mohnen 2007).

C-2
• Organizational changes relating to firm structure, management strategies, or external relations that are intended to improve the use of knowledge, quality of production and services, or efficiency (CIS IV 2004).
• Marketing strategies, including new and improved marketing and sales methods that involve changes in product design, packaging, product placement, and product promotion and pricing. Market innovations are intended to increase market share in existing markets and support entry into new markets (CIS IV 2004).
Previous surveys focused on technological changes that result in innovative products with new and improved characteristics and capabilities (European Commission 2008, OECD 2005). Starting with the fourth Community Innovation Survey, the survey includes organizational and marketing innovations, relating to commercialization activities such as product launch, market entry, and product diffusion.
Defining Novelty
In accordance with the Oslo Manual, the Community Innovation Survey defines an innovation as a product, process, organizational change, or marketing change that is new to the firm. To elucidate the degree of novelty of each innovation, the Community Innovation Survey has a set of questions addressing four degrees of novelty:
1. New to the firm.
2. New to a national market.
3. New to a regional market.22
4. New to the global market.
Degree of novelty refers to the scope of the market in which the firm introduces the innovation. The scope of the firm’s market is used to characterize the level of innovation and its role as either a leader or follower. The Community Innovation Survey analysts have found discrepancies in how innovation is defined, but have been able to remedy these issues by including questions about the degree of novelty.
22 Regional markets refer to non-global, multi-country markets, such as the EU.

C-3
Community Innovation Survey Topics
The Community Innovation Survey collects data on the following topics:
• Product innovations and product turnover.
• Process innovations.
• Ongoing and abandoned innovation activities.
• Intellectual property.
• Cooperation in innovation activities and sources of technical and market information.
• Effect of innovation on enterprise operations and productivity.
• Factors that hamper innovation activities.
• Organizational innovations.
• Marketing innovations.
These topics reflect the current understanding of the innovation process developed through empirical research and previous surveys. The survey was structured to elucidate correlations between inputs and outputs and economic growth. (See Table C-1 for a list of collected data.)
In addition to the above topics, the Community Innovation Survey focuses on seven specific innovation activities:
1. Internal R&D consisting of creative work undertaken within the enterprise to increase the stock of knowledge and the use of that knowledge to design and develop new and improved products and processes (including software).
2. External R&D consisting of creative work, as described above, performed by other entities, including other companies, universities, nonprofit research institutions, and government institutions.
3. Acquisition of equipment, machinery, and software.
4. Acquisition of other external knowledge as intellectual property or non-patented knowledge or know-how from entities outside of the enterprise.
5. Training relating specifically to developing and introducing innovations, including both internal and external training activities.
6. Market introduction, including market research and launch advertising.
7. Other procedures and preparations to implement innovations (not included elsewhere).

C-4
Table C-1: Community Innovation Survey Data Categorized by Type of Data Type of Data Specific Data
General information Scope of market Turnover (level and growth) Exports (level and growth) Age of enterprise / date of established Gross investment in physical assets Total number of employees
Dichotomous data (yes / no) Input Organizational change Marketing innovations Cooperative development of innovations Government support for innovation activities Intellectual property acquisition (patent, trademark, industrial design, copyright)
Output Introduction of new to the firm products Introduction of new to the market products Introduction of new processes Unfinished or abandoned innovations
Qualitative categorical data Input Sources of information for innovation Factors impeding innovation Importance of organizational changes Types of collaborative partners
Output Effects of innovation on productivity and performance
Quantitative data Input none Output Turnover from product innovation
Turnover from process innovation Share of sales from patent protected innovation
Financial data Input R&D expenditures Innovation activity expenditures
Output none
The survey collects data on the amount of expenditure for each of the seven activities in the previous year (CIS IV, 2004). Expenditures serve as a proxy for inputs into each activity. These activities reflect the spectrum of scientific, technological, organizational, and commercial steps involved in developing a concept into a commercially viable product that will yield financial and economic returns to the innovating enterprise.

C-5
For each topic, the Community Innovation Survey collects quantitative, financial, and qualitative data. Innovation output is described using quantitative data, including numbers of innovations and percentage of product turnover (sales) from innovations. Organizational, management, and marketing strategies are described by ordered categorical qualitative data derived from a Likert scale on importance. Most qualitative and some of the quantitative data (i.e., percentage of product turnover) are subjective. Moreover, variables based on relative measures, such as percentage of product turnover from an innovation, are subject to exogenous factors, such as enterprise maturity, business cycle, and industry sector. The data are adequate for comparative macro-level analyses at the national level because the variability due to subjectivity and exogenous factors is equally distributed across firms and countries.
Data collected through the Community Innovation Survey are used to calculate 7 of the 25 indicators in the European Innovation Scoreboard. The European Innovation Scoreboard comprises five categories of indicators:
1. Innovation drivers.
2. Knowledge creation.
3. Innovation and entrepreneurship.
4. Application.
5. Intellectual property.
These indicators reflect the inputs and outputs of innovation activities and thereby describe the intensity of innovation activities. (See Table C-2 for a complete list of indicators.)
The European Innovation Scoreboard indicators are integrated into a summary innovation index, which is an overarching measure of performance used to compare countries. Trends in innovation performance are tracked using the ratio of current summary innovation index to the average growth rate of the summary innovation index over a 5-year period. Thus, the Community Innovation Survey and European Innovation Scoreboard are useful for tracking broad trends in innovation performance.

C-6
Table C-2: European Innovation Scoreboard Indicators Type of Indicator Topics
Innovation drivers
Input S&E graduates per 1,000 population aged 20–29 Population with tertiary education per 100 population aged 25–64 Broadband penetration rate (number of lines per 100 population) Participation in lifelong learning per 100 population aged 25–64 Youth education attainment level (percentage of population who completed secondary education)
Knowledge creation
Input Public R&D expenditure (percentage of GDP) Business R&D expenditures (percentage of GDP) Share of medium high tech and high tech R&D (percentage of manufacturing R&D expenditures) Share of enterprises receiving public funding for innovation*
Innovation and entrepreneurship
Input Subject-matter experts (SMEs) innovating in-house (percentage of all SMEs) * Innovative SMEs co-operating with others (percentage of all SMEs) * Innovation expenditures (percentage of total turnover) * Early-stage venture capital (percentage of GDP) Information and communications technology expenditures (percentage of GDP) SMEs using organizational innovation (percentage of all SMEs) *
Application
Output Employment in high-tech services (percentage of total workforce) Exports of high technology products as a share of total exports Sales of new to market products (percentage of total turnover)* Sales of new to firm products (percentage of total turnover) * Employment in medium-high and high-tech manufacturing (percentage total workforce)
Intellectual property
Output European Patent Office patents per million population U.S. Patent and Trademark Office patents per million population Triadic patent families per million population New community trademarks per million population New community designs per million population
*Indicators based on data collected through the Community Innovation Survey.

C-7
AUSTRALIA
Innovation in Australian Business
The Australian National Innovation Survey is based on the Oslo Manual and is therefore comparable to the Community Innovation Survey. The innovation survey has been integrated with surveys on information and communications technology use and general business characteristics to form the Integrated Business Characteristics Survey (IBCS). The integrated format streamlines data collection and facilitates micro-level analyses of innovation activities, expenditures, and technology use. The IBCS focuses on the economic outcomes of innovation activities. The innovation survey provides data for constructing the Australian Business, Innovation and Growth Index.
Types of innovation
The survey collected data on three types of innovations:
• Products and services with new or improved characteristics or capabilities
• Operational processes involving the production and distribution of products and services
• Organizational and managerial processes involving the strategies, structures, and routines that affect performance
The 2005 survey did not include marketing innovations; however, they will be included in future surveys.
Defining Novelty
Like the Community Innovation Survey, the Australian survey includes a set of questions to elucidate the degree of novelty of each innovation. The survey includes three degrees of novelty:
1. New to the business.
2. New to Australia.
3. New to the world.
The degree of novelty is used to provide context about the level of innovation of individual firms. The Australian Bureau of Statistics (ABS) uses information about the
C-8
degree of novelty of innovations as members of the EU and the European Commission do.
Integrated Business Characteristics Survey (IBCS) Topics
In the innovation survey, the ABS collects data on the following topics:
• Product innovations.
• Process innovations.
• Operational innovations.
• Drivers of innovation.
• Barriers to innovation.
• Collaborative activities and partners.
• Sources of information used in innovation activities.
• Intellectual property protection methods.
• Human capital development.
• Expenditures on innovation activities.
• Sources of funds for innovation activities.
• Effects of innovation on performance, productivity, and market position.
• Financial returns.
These topics reflect the inputs, activities, outputs, and outcomes of the innovation process. (See Table C-3 for a list of topics.)
Table C-3: Australia’s IBCS Categorized by Type of Data Type of Data Specific Data
General information Scope of market Turnover (level and growth) Exports (level and growth) Age of enterprise / date of established Gross investment in physical assets Total number of employees
Dichotomous data (yes / no) Input Cooperative development of innovations Intellectual property Acquisition (patent, trademark, industrial design, copyright)
Output Introduction of new to the firm products Introduction of new to the market products Introduction of new processes

C-9
Type of Data Specific Data Organizational innovation Marketing innovation
Qualitative categorical data Input Sources of information for innovation Factors impeding innovation Importance of organizational changes Types of collaborative partners External sources of information (technical, market, etc) Intellectual property management strategies Drivers of innovation Barriers to innovation Factors affecting failure to commercialize intellectual property
Output Effects of innovation on productivity and performance Degree of novelty of product innovations (firm, country, region, world) Effect of innovation (productivity, proficiency, proftability, and market position)
Quantitative data Input none Output Turnover from product innovation
Turnover from process innovation Financial data Input R&D expenditures
Total expenditures on innovation activities Percent of innovation expenditures spent on specific activities
Output none
The IBCS focuses on the following six activities (Australian Bureau of Statistics 2005):
1. Research and experimental development.
2. Acquisition of machinery and equipment purchased to develop, introduce, or implement an innovative product, service, or process.
3. Acquisition of intellectual property.
4. Design work.
5. Marketing activities aimed at the introduction of new product or service innovations.
6. Other innovation-related activities.

C-10
The ABS collects data on total expenditures for innovation activities and expenditures on specific activities. Expenditures on each activity are calculated as a percentage of the total expenditures on innovation. Total expenditures on innovation activities are also broken out according to the three types of innovations described above. In previous surveys, the ABS collected detailed data on expenditures related to specific innovation activities. Because firms were unable to provide accurate information on specific expenditures, the ABS stopped collecting these data. The ABS integrates data on R&D expenditures collected from the national R&D survey. Firms are able to provide specific data on R&D expenditures due to accounting requirements. Thus, the ability to collect accurate data on expenditures related to innovation activities is limited by accounting procedures and regulations.
The ABS uses sales from innovative products and services as a measure of innovative productivity. Data on sales from innovations are characterized by significant variability due to exogenous factors, in the same manner as product turnover data in the Community Innovation Survey. This measure does not include increases in revenues associated with the implementation of improved processes or organizational changes. Thus, it is an incomplete measure of financial returns to innovation.
Human Capital Data
The ABS collects data related to the development of human capital for specific innovation activities.23 The ABS focuses on five methods (and other) used to acquire knowledge and skills:
1. Employ new skilled staff.
2. Interchange staff with another business.
3. Employ consultants (paid advisors).
4. Acquire new equipment or technology for producing goods and services.
5. Merge with another business
23 The Oslo Manual does not provide guidelines for collecting data on the development of human capital
for specific innovation activities. The OECD’s Canberra Manual presents guidelines for measuring human resources devoted to S&T activities (see http://www.oecd.org/dataoecd/34/0/2096025.pdf [accessed 15 December 2008]).

C-11
The survey also collects information on methods for acquiring knowledge and skills from higher education and research institutions:
• Employ new graduates.
• Employ academic or research staff.
• Use published research results.
• Use research facilities.
• Acquire intellectual property from universities and research institutions.
• Employ consultants from universities and research institutions.
• Contract out R&D to universities and research institutions.
• Other methods.
Human capital development data are qualitative. Specific investments in the development of human capital are estimated as a percentage of total investments in the development of human capital. These percentages reflect the relative importance of each investment as a strategy for developing human capital. The survey does not provide quantitative data concerning expenditures related to the development of human capital.
Australian Innovation Scoreboard (AIS)
The ABS uses sales from innovative products and services as a measure of innovative productivity. Data on sales from innovations are characterized by significant variability due to exogenous factors, in the same manner as product turnover data in the Community Innovation Survey. This measure does not include increases in revenues associated with the implementation of improved processes or organizational changes. Thus, it is an incomplete measure of financial returns to innovation. The ABS uses sales from innovative products and services as a measure of innovative productivity. Data on sales from innovations are characterized by significant variability due to exogenous factors, in the same manner as product turnover data in the Community Innovation Survey. This measure does not include increases in revenues associated with the implementation of improved processes or organizational changes. Thus, it is an incomplete measure of financial returns to innovation.
The Australian ICBS provides data for calculating 15 indicators in the AIS. These indicators are broken into six categories:
1. Knowledge creation.

C-12
2. Knowledge diffusion.
3. Human resources.
4. Collaboration.
5. Finance.
6. Market outcomes.
These indicators are comparable to those in the other innovation scoreboards, including the European Innovation Scoreboard, and thereby enable comparisons in innovative productivity. The AIS is also used to monitor trends in innovation productivity at the national level.
Survey of Patenting and Commercialization Activities of Australian Universities (Australia Department of Education, Science and Training. 2004)
The ABS conducts a survey on the commercialization of university research to better understand the factors that affect the flow of new inventions arising from university sectors to industry. The survey is oriented toward universities and does not collect data on private-sector efforts to access university research results and inventions. The survey focuses on exploitation of university patents through licensing and on factors that impede transfer of knowledge or technology embodied in intellectual property.
Universities provided the following quantitative patenting and commercialization data:
• Total number of patents granted.
• Percentage of patents commercialized.
• Year in which each patent was granted and the year in which it was subsequently commercialized.
The data were used to calculate the rate at which university research results in the form of intellectual property, are commercialized. The data were aggregated nationally to determine the national commercialization rate and evaluate national trends over time.
The commercialization survey includes the following topics:
• Factors that affect patenting at universities.
• Factors that affect patent commercialization at universities.
• Reasons why a patent is not commercialized.

C-13
• Factors that affect industry take-up of new patents from universities.
• Methods used by universities to protect or use intellectual property.
• Successful strategies for commercializing university intellectual property.
For each topic, a list of factors, reasons, or methods was provided. Respondents were asked to rate the importance of each using a Likert scale. Such qualitative data is useful for informing policy discussions, but not measuring the productivity of research, knowledge flows, or innovation activities.
CANADA
National Innovation Survey
Statistics Canada collects information on innovation activities and the characteristics of innovative business enterprises through the Canadian National Innovation Survey (CNIS) (Statistics Canada 2005). The survey follows the guidelines set forth in the Oslo manual and builds on the core questions of the EU Community Innovation Survey. Firms and trade associations use survey data to analyze market dynamics and industry productivity. Government entities use survey data to develop and evaluate regional and national economic policies.
Types of Innovation
The Canadian Innovation Survey focuses on three types of innovation:
1. Products and services.
2. Production, logistics, and distribution processes.
3, Organizational and operational processes.
These categories are the same as those outlined in the Oslo Manual (1997 edition) and used in the EU Community Innovation Survey and Australian Integrated Business Characteristics Survey.
Defining Novelty
The CNIS asks questions regarding the nature and scope of the firm’s market to determine the innovation’s degree of novelty. The survey includes five degrees of novelty:

C-14
1. New to the firm.
2. New to the province.
3. New to Canada.
4. New to North America.
5. New to the World.
CNIS topics
Statistics Canada also collects data on the percentage of total revenue from sales in the following regions:
• Firm’s province.
• Canada.
• United States.
• Mexico.
• Europe.
• Asia-Pacific.
• All other countries.
Qualitative data on the degree of novelty and quantitative data about the scope of the firm’s market enable analysis of the level of innovation at a national level and facilitate comparisons of national productivity with other countries.
Statistics Canada uses the innovation survey to collect data on the following topics:
• Product innovations.
• Production, logistics, and distribution process innovations.
• Organizational and operational process innovations.
• Ongoing and abandoned innovations.
• Time to develop innovations.
• Collaboration.
• Sources of information for innovation activities.
• Public and private sources of funding for innovation activities.
• Methods for protecting intellectual property.

C-15
• Factors related to innovative productivity and overall success of the enterprise.
• Barriers to innovation.
• Effects of innovation on performance, productivity, and market position.
• Acquisition of tangible inputs.
These topics include the core topics of the Community Innovation Survey and additional topics related to the characteristics of Canadian firms and national innovation policies.
Statistics Canada also collects data on the performance of these innovation activities:
• Within firm/plant R&D.
• Within enterprise R&D performed on the firm’s behalf by another entity within the enterprise.
• External R&D performed by another public or private entity and purchased by the firm.
• Acquisition of intellectual property from a public or private entity.
• Acquisition of machinery and equipment.
• Training.
The definitions of each activity refer to the purpose of the activity in the development of an innovation.
Marketing Data
Statistics Canada also collects information on specific marketing activities:
• Market research.
• Advertising to launch new products.
• Market planning.
• Product positioning and profiling.
• Profitability analysis.
• Project feasibility.
• Consumer acceptance testing.
• Post-introduction advertising.
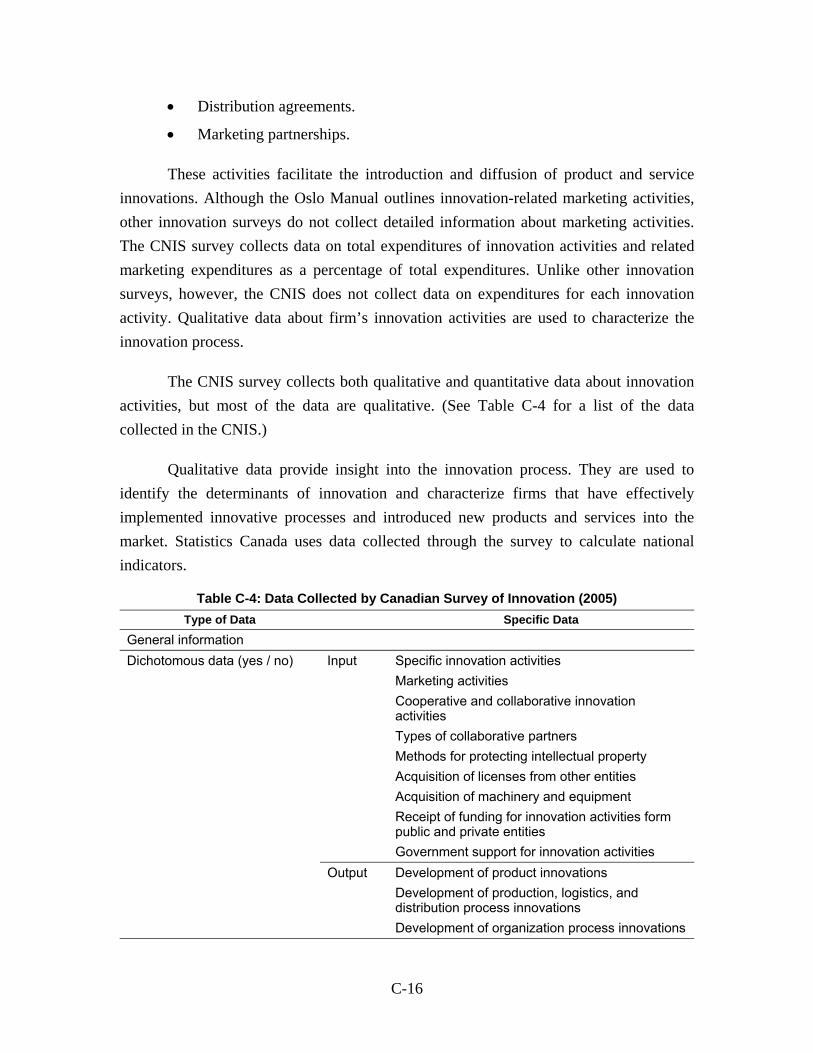
C-16
• Distribution agreements.
• Marketing partnerships.
These activities facilitate the introduction and diffusion of product and service innovations. Although the Oslo Manual outlines innovation-related marketing activities, other innovation surveys do not collect detailed information about marketing activities. The CNIS survey collects data on total expenditures of innovation activities and related marketing expenditures as a percentage of total expenditures. Unlike other innovation surveys, however, the CNIS does not collect data on expenditures for each innovation activity. Qualitative data about firm’s innovation activities are used to characterize the innovation process.
The CNIS survey collects both qualitative and quantitative data about innovation activities, but most of the data are qualitative. (See Table C-4 for a list of the data collected in the CNIS.)
Qualitative data provide insight into the innovation process. They are used to identify the determinants of innovation and characterize firms that have effectively implemented innovative processes and introduced new products and services into the market. Statistics Canada uses data collected through the survey to calculate national indicators.
Table C-4: Data Collected by Canadian Survey of Innovation (2005) Type of Data Specific Data
General information Dichotomous data (yes / no) Input Specific innovation activities
Marketing activities Cooperative and collaborative innovation activities Types of collaborative partners Methods for protecting intellectual property Acquisition of licenses from other entities Acquisition of machinery and equipment Receipt of funding for innovation activities form public and private entities Government support for innovation activities
Output Development of product innovations Development of production, logistics, and distribution process innovations Development of organization process innovations

C-17
Type of Data Specific Data Unfinished or abandoned innovations
Qualitative categorical data Input Sources of information for innovation Percentage of products protected by patent Percentage of products protected by trademarks Barriers to innovation
Output Effects of innovation on productivity and performance Meeting regulatory standards
Financial data Input R&D expenditures Innovation activity expenditures (total, but not at the detailed level) Percentage of total expenditures for all innovation activities
Output Percentage of revenue from new-to-market product innovations Percentage revenue from already-on-the-market products (but new to the firm innovations)
Quantitative data Input Percentage of employees involved in R&D Percentage of employees involved in marketing, sales, and client services Time to develop innovations
Output Percentage of total revenue by geographic market Percentage of total revenue from the most important customer/client Number of product innovations Percentage of total production carried out by the firm as subcontracted for other entities Turnover from product innovation Turnover from process innovation Share of sales from patent protected innovation
Commercialization and R&D Impacts
Statistics Canada and Industry Canada conduct a survey on the organizational aspects of commercialization and R&D activities in the private sector. In this survey, commercialization refers to activities undertaken to transform knowledge and technology into new products or processes in response to market opportunities (Statistics Canada 2006). The survey focuses on business plans and the mechanisms by which specific activities create market value.
They survey comprised 10 modules:
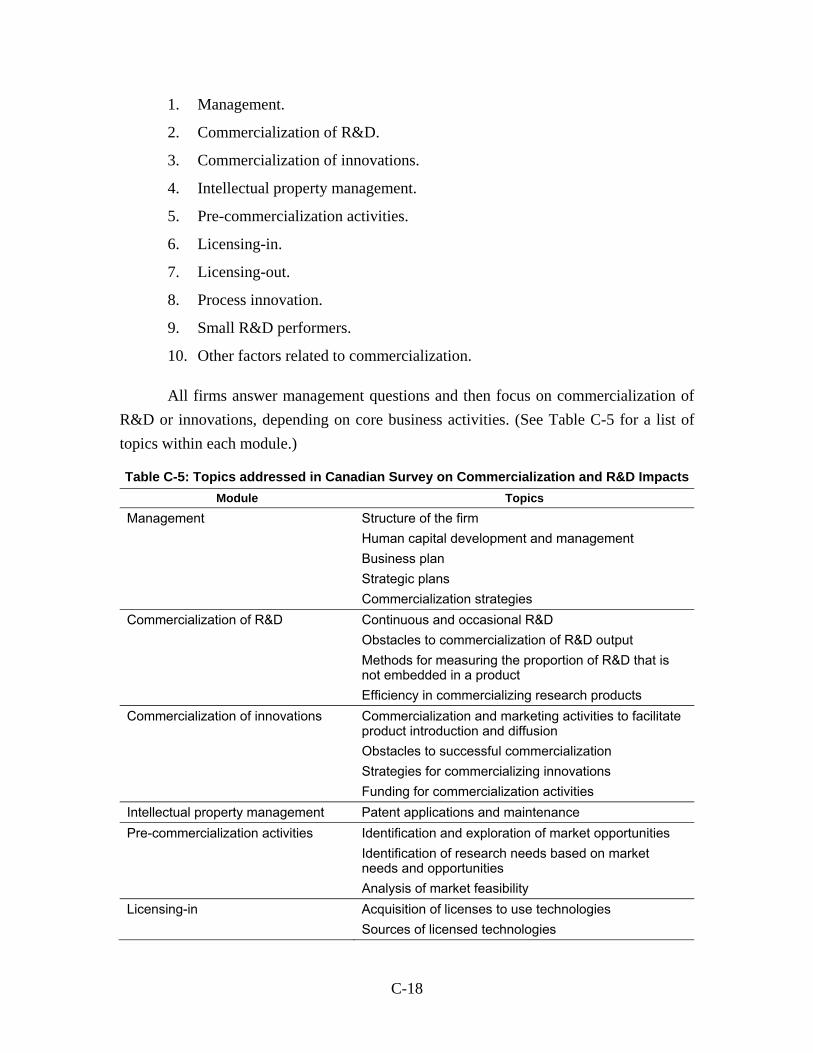
C-18
1. Management.
2. Commercialization of R&D.
3. Commercialization of innovations.
4. Intellectual property management.
5. Pre-commercialization activities.
6. Licensing-in.
7. Licensing-out.
8. Process innovation.
9. Small R&D performers.
10. Other factors related to commercialization.
All firms answer management questions and then focus on commercialization of R&D or innovations, depending on core business activities. (See Table C-5 for a list of topics within each module.)
Table C-5: Topics addressed in Canadian Survey on Commercialization and R&D Impacts Module Topics
Management Structure of the firm Human capital development and management Business plan Strategic plans Commercialization strategies
Commercialization of R&D Continuous and occasional R&D Obstacles to commercialization of R&D output Methods for measuring the proportion of R&D that is not embedded in a product Efficiency in commercializing research products
Commercialization of innovations Commercialization and marketing activities to facilitate product introduction and diffusion Obstacles to successful commercialization Strategies for commercializing innovations Funding for commercialization activities
Intellectual property management Patent applications and maintenance Pre-commercialization activities Identification and exploration of market opportunities
Identification of research needs based on market needs and opportunities Analysis of market feasibility
Licensing-in Acquisition of licenses to use technologies Sources of licensed technologies

C-19
Module Topics Types of licensing arrangements and payments
Licensing-out Licensing strategies Types of clients that license technologies from the firm Types of licensing agreements
Process innovations Production processes Logistics and distribution processes Organizational innovations Effect of process innovations on productivity and profitability Methods for evaluating the effectiveness of processes
Small R&D performers Role of R&D in the company Use of R&D to support innovation Factors affecting the performance of occasional R&D Sources of funding
Other factors (open-ended question)
This survey collected qualitative descriptions of commercialization strategies and activities. The data are used to characterize the commercialization processes and strategies, identify resources used, and summarize the determinants of successful R&D and product commercialization.
Survey of Intellectual Property in the Higher Education Sector (Statistics Canada 2006a)
Statistics Canada collects data biannually on intellectual property management strategies and commercialization activities of universities through the Survey of Intellectual Property in the Higher Education Sector. This survey focuses exclusively on activities performed by universities and does not include private-sector activities to acquire intellectual property from universities. Government entities use the results to develop and evaluate policies related to academic research and intellectual property.
This survey collects data on the following intellectual property management and commercialization topics:
• Intellectual property management infrastructure, expenditures, and personnel.
• Intellectual property policies.
• Faculty consulting activities.
• Research contracts.
• Intellectual property.

C-20
• Methods for protecting intellectual property.
• Licensing.
• Distribution of income from intellectual property.
• Spin-off companies.
These topics reflect different intellectual property management strategies, the financial factors that affect the choice of strategies, and opportunities associated with the commercialization of intellectual property. A University’s intellectual property commercialization strategies balance investments with opportunities to commercialize any potential income gained from licensing or selling intellectual property.
The survey collects qualitative, quantitative, and financial data for each topic. (See Table C-6 for specific data.) Government entities use qualitative and quantitative data on intellectual property management and commercialization to evaluate the productivity of academic research and the contribution of academic research to the national innovation system.
Table C-6: Data Collected through the Survey of Intellectual Property Commercialization in the Higher Education Sector (Statistics Canada 2006a)
Type of Data Topics Qualitative Dichotomous (yes / no)
Types of services used in intellectual property management In-house legal council Outside legal council In-house patent agent Outside patent agent Provision of space for start-ups Policies on ownership of intellectual property (individual and institutional) Policies related to the disposal of equity holdings for spin-offs Intellectual property protection activities Publicly traded spin-offs
Qualitative (Categorical)
Education level of employees involved in intellectual property management Policies for reporting the creation of intellectual property (always, sometimes, never)

C-21
Type of Data Topics Quantitative Number of employees involved in intellectual property management
Number of years of experience of employees in intellectual property management Number of start-ups Percentage of employees involved in external consulting activities Number of research contracts (by sector) Number of new intellectual property disclosed in past year Number of patents applied for and issued Number of new licenses executed Number of active licenses
Financial Operational expenditures for intellectual property management Employee salaries Patent and regular legal services Litigation expenditures Other Sources of operational expenditure (percentage of total expenditures) Institutional funding Institutional one-time allocation Intellectual property commercialization revenues External sources Value of research contracts (by sector, by type, by type of intellectual property provision) Income received from intellectual property (by type* and by recipient) Research funding from licensing agreements Percentage of spin-offs owned by the university Total value of cash dividends from spin-offs Cash received from equity holdings in spin-offs Amount of investments in spin-offs raised by the university
* Types of income from IP include running royalties, milestone payments, one time sales of IP, reimbursement of patent and legal costs, and licensing income.
JAPAN
National Innovation Survey
Japan conducts a national innovation survey to collect data on the productivity of innovation activities in the private sector (Japanese National Innovation Survey 2003) (Japanese National Innovation Survey 2003). The survey follows guidelines set forth in the Oslo manual. The Japanese National Innovation Survey (JNIS) includes core questions included in the EU Community Innovation Survey and additional questions

C-22
focusing on characteristics specific to Japanese firms and national policies. Accordingly, the results of JNIS can be compared with the Community Innovation Survey and other national innovation surveys based on the Oslo Manual. Japanese government entities use innovation survey data to develop and evaluate policies, while industry associations and businesses use the data to develop innovation strategies.
JNIS includes questions about the geographic region in which the firm’s product is sold. It asks whether the firm’s most significant market is local, national, or international. Firms indicate in which of the following nine regions they sell goods and provide services:24
1. Japan.
2. Korea.
3. China.
4. Taiwan.
5. Association of Southeast Asian Nations (ASEAN)—Brunnei Darussalam, Cambodia, Laos, Indonesia, Malaysia, Myanmar, Philippines, Singapore, Thailand, and Vietnam.
6. European Union—Belgium, Denmark, Germany, France, Spain, Ireland, Italy, Luxemburg, Netherlands, Austria, Portugal, Finland, Sweden, and the United Kingdom) and European Fair Trade Association—EU, Iceland, Lichtenstein, Norway, and Switzerland.
7. United States.
8. Other.
9. None.
Unlike the Community Innovation Survey, JNIS does not include specific questions about the innovation’s degree of novelty. However, the questions about geographic market could be used to elucidate degree of novelty and scope of market.
JNIS Topics
JNIS collected data on the following topics:
• Basic economic information.
24 List of countries as of 2003.

C-23
• Product innovation.
• Process innovation.
• Incomplete and abandoned innovation activities.
• Innovation activities.
• Impact of innovation on product range, productivity, and market position.
• Public funding for innovation.
• Collaborative innovation.
• Information sources for generating new ideas and enabling the development and implementation of innovations.
• Disincentives and barriers to innovation, including economic and organizational factors.
• Intellectual property protection methods.
• Strategic organizational and marketing changes.
These topics are core topics found in the Community Innovation Survey, but JNIS includes more detailed questions in some sections, including intellectual property management and sources of information. In the section on organization and marketing innovations, JNIS focuses on strategic changes that relate to overarching innovation capabilities, management, and productivity. These differences reflect Japan’s more holistic approach to innovation as opposed to the Community Innovation Survey’s focus on innovation activities.
JNIS collects data on expenditures for the following innovation activities:
• Internal R&D.
• Acquisition of R&D performed by entities outside of the firm.
• Acquisition of machinery and equipment for the production or implementation of an innovation
• Acquisition of external knowledge through the transfer of intellectual property
• Training directly aimed at developing or introducing an innovation
• Market introduction of an innovation, including market research, market testing, and launch advertising
• Design and other technical procedures that enable the production, delivery, and implementation of an innovation

C-24
Expenditures include personnel, materials, tangible assets, costs and other investments. Firms include expenditures for completed, ongoing, and abandoned activities. JNIS acknowledges that firms may not categorize expenditures according to innovation activity and as a result may not be able to provide precise expenditure data. To understand the distribution of expenditures, JNIS collects data on the composition ratio of innovation-related expenditures.25 Firms are likely to be able to calculate a composition ratio even if they cannot provide data on exact expenditures.
JNIS collects qualitative, quantitative, and financial data on the inputs and outputs of innovation activities. (See Table C-7 for a complete list of data.) Qualitative and financial data are used to develop a better understanding of the innovation process and strategies used by businesses in developing and commercializing innovations. Quantitative data are used to construct indicators of innovative productivity. These indicators are used for internal evaluations and to compare data across other countries.
Table C-7: Data Collected by Japanese National Innovation Survey (2003) Categorized by Data Type
Type of Data Specific Data General information Changes in product turnover greater than 10%
Lifetime of the most important product Total turnover of products Export sales Purchase of tangible fixed assets Number of persons engaged in tertiary education Number of persons employed (and percentage change) Number of employees with tertiary (graduate) education (and percentage change) Geographic location of R&D activities Geographic location of production
25 The composition ratio is the percentage of total innovation expenditures for each innovation activity.

C-25
Type of Data Specific Data Dichotomous data (yes / no) Input Ongoing or abandoned innovation activities
Continuous internal R&D Public funding for innovation activities Collaborative innovation activities Type of partner with which the firm collaborated (by geographic location) Disincentives to innovate Use of institutional and strategic methods to protect intellectual property Motivations for patent applications Strategic, management, organizational, and marketing activities
Output Product innovation Process innovation
Qualitative categorical data Input Importance of different types of collaborative partners Importance of different types of information sources (internal, market, university, government, other) Importance of disincentives to innovate (economic, organizational, regulatory standards, and laws) Effectiveness of institutional and strategic methods in protecting intellectual property Time to develop innovation without infringing competitors patents
Output Effects of innovation on product range, production capabilities, and satisfaction of regulatory requirements
Financial data Input Intramural R&D expenditures Acquisition of extramural R&D Total expenditures on innovation activities
Output Number of patent applications Number of valid patents
Quantitative data Input Intramural R&D composition ratio* Acquisition of extramural R&D composition ratio* Acquisition of machinery and equipment composition ratio* Acquisition of external knowledge composition ratio* Training composition ratio* Market introduction of innovations composition ratio* Design and other preparations composition ratio* Number of employees involved in R&D full time

C-26
Type of Data Specific Data Output Percentage of turnover from product innovations
Percentage of turnover from marginally improved products Percentage of turnover covered by patents
* The composition ratio is the percent of total expenditures on innovation activities for a specific activity.
UNITED STATES
Some states produce statistics on innovation. For example, the Index of the Massachusetts Innovation Economy (MIT 2007) compares Massachusetts’s key industry cluster growth, growth in R&D spending, export and immigration flows, and human capital dynamics with those in countries in the regions of Asia-Pacific, the BRIC countries (Brazil, Russian Federation, India, and China), North America, and Western Europe.
The United States does not conduct a comprehensive national innovation survey like the Community Innovation Survey, the Australian Innovation and Business Characteristics Survey, Canadian National Innovation Survey, or the Japanese National Innovation Survey (Moris, Jankowski, Perrolle 2008). Several federal agencies do collect data related to innovation inputs, outputs, and activities, however. The Census Bureau collects firm-level data on several innovation activities including use of advanced manufacturing technologies, computer networking, electronic business processes, management practices, and exports and imports through the business census and related surveys (Atrostic 2008). The National Science Foundation collects data from a variety of sources on R&D, science and engineering workforce, scientific publications, and patents. National Science Foundation compiles innovation related data in the biennial Science and Engineering Indicators report.
The National Science Foundation has conducted two one-time surveys on innovation and recently introduced an innovation section to its updated Survey of Industrial Research and Development:
1. Pilot national innovation survey (1994).
2. Information technology innovation survey (2001).
3. Business R&D and Innovation Survey (BRDIS) (Wolfe 2008).
These surveys provide insight into the type of data that may be collected through a national innovation survey.

C-27
National Science Foundation Pilot Innovation Survey (1994)
In 1994, the National Science Foundation piloted a national innovation survey to collect data on innovation activities, the innovation process, and the factors that affect decisions to develop innovations (Rausch 1996). About 1,000 firms in manufacturing industries and one service industry (computer programming, data processing, and computer-related services) were surveyed. The survey focused on innovation activities performed and strategies implemented over a 2-year period (1990–1992), but also included plans for future activities (1993–1995). The pilot was conducted to test and evaluate the survey instrument and data-collection methods. Data collected through the survey were used to estimate national levels of innovation activities.
The survey data were used to identify the characteristics of innovating firms in the United States. Firms were asked about activities to develop technologically new products and processes and methods. The survey included questions on previous activities successfully completed between 1990 and 1992, ongoing activities, and plans for future activities to be completed between 1993 and 1995. Data were used to characterize propensity to innovate, at the industry level. Questions were based on a Likert scale of importance. Data were aggregated at the industry and national level.
The survey collected qualitative data on the following topics:
• Sources of technical information.
• Collaborative innovation activities.
• Mechanisms for transferring technical knowledge and technologies to others.
• Collaborative partners.
• Role of internal and external R&D in the development of innovations.
• Methods for appropriating the benefits of R&D and innovation activities.
• Motivations and factors affecting the decision to innovate.
The survey collected qualitative information about the role of R&D in innovation strategies and the development of technological innovations. Firms were asked whether or not they performed R&D internally. In response to the 1993 Critical Technologies Report prepared by the Executive Office of Science and Technology Policy, the survey collected data on R&D activities in nine technology areas considered critical to national security and economic prosperity. The survey also collected data on future R&D plans.
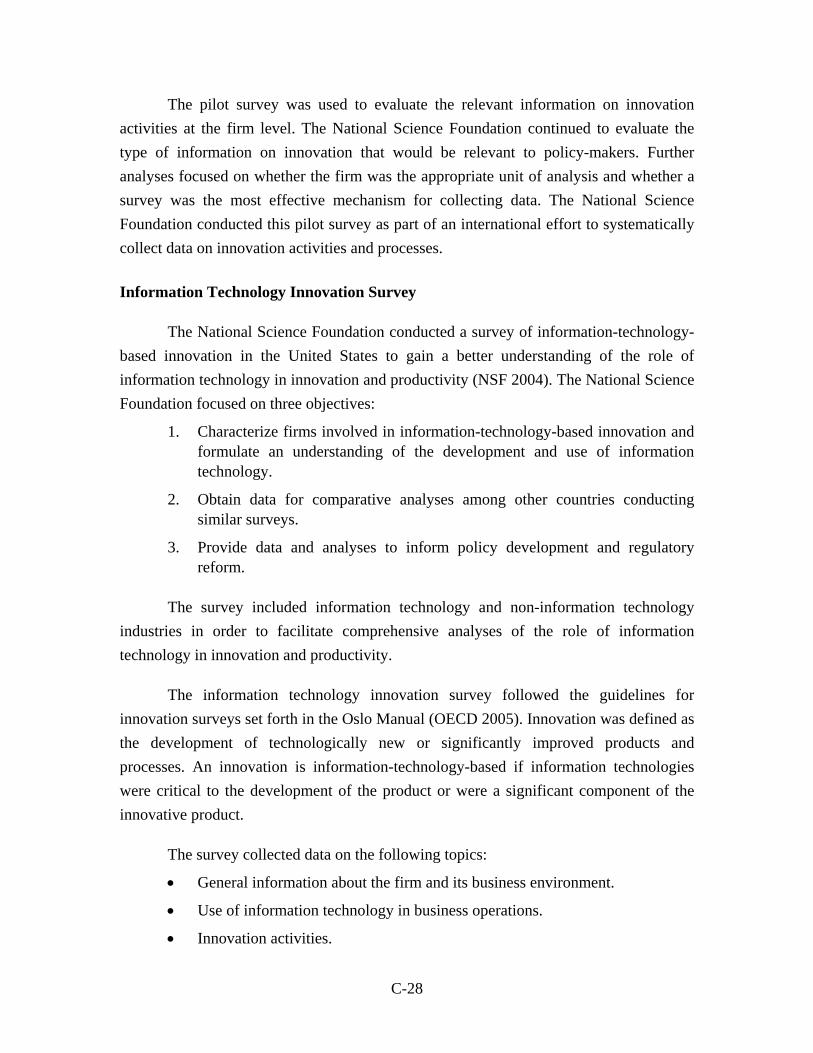
C-28
The pilot survey was used to evaluate the relevant information on innovation activities at the firm level. The National Science Foundation continued to evaluate the type of information on innovation that would be relevant to policy-makers. Further analyses focused on whether the firm was the appropriate unit of analysis and whether a survey was the most effective mechanism for collecting data. The National Science Foundation conducted this pilot survey as part of an international effort to systematically collect data on innovation activities and processes.
Information Technology Innovation Survey
The National Science Foundation conducted a survey of information-technology-based innovation in the United States to gain a better understanding of the role of information technology in innovation and productivity (NSF 2004). The National Science Foundation focused on three objectives:
1. Characterize firms involved in information-technology-based innovation and formulate an understanding of the development and use of information technology.
2. Obtain data for comparative analyses among other countries conducting similar surveys.
3. Provide data and analyses to inform policy development and regulatory reform.
The survey included information technology and non-information technology industries in order to facilitate comprehensive analyses of the role of information technology in innovation and productivity.
The information technology innovation survey followed the guidelines for innovation surveys set forth in the Oslo Manual (OECD 2005). Innovation was defined as the development of technologically new or significantly improved products and processes. An innovation is information-technology-based if information technologies were critical to the development of the product or were a significant component of the innovative product.
The survey collected data on the following topics:
• General information about the firm and its business environment.
• Use of information technology in business operations.
• Innovation activities.

C-29
• Factors affecting the decision to innovate.
• Costs of information-technology-based innovation.
• Expected benefits of information-technology-based innovations.
These topics were analogous to the topics of general innovation surveys. They reflect the determinants of innovation and were intended to facilitate an understanding of information-technology-based innovation issues.
The information technology innovation survey included innovation activities similar to those included in general innovation surveys. It focused on the following information-technology-related innovation activities:
• Development of information-technology-based products and processes.
• Internal R&D.
• Acquisition of information technology.
• Continuing education.
• Protection of intellectual property.
• Purchase of external R&D.
• Use of academic research.
• Use of federal programs.
• Use of state programs.
• Obtaining capital.
• Formation of partnerships, alliances, and joint ventures.
• Merging with or acquiring another company.
These activities reflect the complex nature of information-technology-based innovation. The questions were designed to elucidate the role of information technology in transforming innovation inputs into products, increasing productivity and economic returns, and satisfying regulatory requirements.
The survey collected qualitative and quantitative data (see Table C-8 for a list of data collected):
• Qualitative data included characteristics of the business environment, use of information technology in business operations, factors affecting decision to innovate, and innovation activities.
• Quantitative data included expected benefits from innovation activities.

C-30
• Financial data included costs of innovation activities and expected returns on investments in information-technology-based innovation. All financial data were expressed as a percentage of total revenues.
Data were aggregated across industry sectors to facilitate analysis of information-technology-based innovation in different industries.
Table C-8: Information Technology Innovation Survey Data Categorized by Type of Data Type of data Specific data
Qualitative (Dichotomous)
Input Factors affecting the decision to innovate
Output Development of products and processes as a result of information-technology-based innovation Development of an information-technology-based innovation that contributed most to revenue Expectations of developing a product or process as a result of information-technology-based innovation
Qualitative (Categorical)
General Geographic location of customers Geographic location of competitors Importance of business to business sales Importance of sales to consumers Availability of qualified staff Strategic importance of being first to market Strategic importance of expanding into new markets Strategic importance of conducting R&D Strategic importance of forming alliances and partnerships Strategic importance of business mergers and acquisitions Strategic importance of obtaining venture capital Strategic importance of e-commerce Contribution of internal R&D to information-technology-based innovation Contribution of continuing education to information-technology-based innovation Contribution of purchased external R&D to information-technology-based innovation Contribution of academic research to information-technology-based innovation Contribution of federal programs to information-technology-based innovation Contribution of state programs to information-technology-based innovation Contribution of alliances, partnerships and joint ventures to information-technology-based innovation Largest expenditure on information technology-innovation (R&D, acquisition of equipment, protection of intellectual property)
Input Use of information technology in conducting business
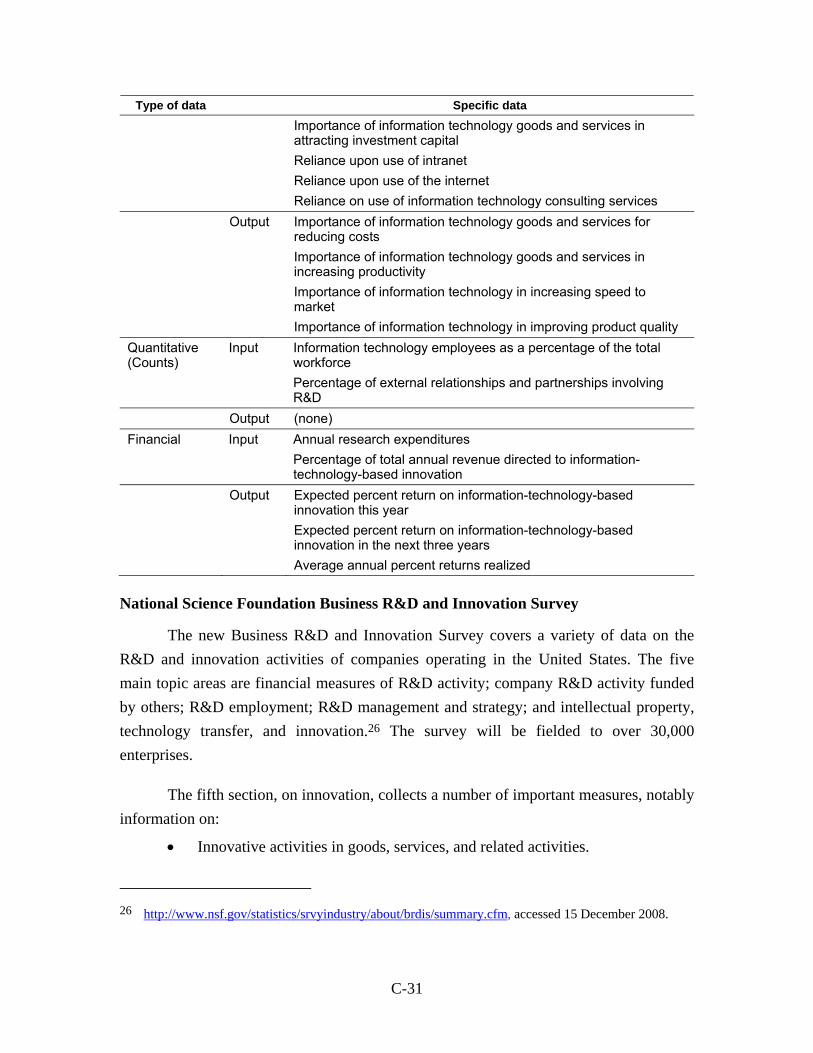
C-31
Type of data Specific data Importance of information technology goods and services in attracting investment capital Reliance upon use of intranet Reliance upon use of the internet Reliance on use of information technology consulting services
Output Importance of information technology goods and services for reducing costs Importance of information technology goods and services in increasing productivity Importance of information technology in increasing speed to market Importance of information technology in improving product quality
Quantitative (Counts)
Input Information technology employees as a percentage of the total workforce Percentage of external relationships and partnerships involving R&D
Output (none) Financial Input Annual research expenditures
Percentage of total annual revenue directed to information-technology-based innovation
Output Expected percent return on information-technology-based innovation this year Expected percent return on information-technology-based innovation in the next three years Average annual percent returns realized
National Science Foundation Business R&D and Innovation Survey
The new Business R&D and Innovation Survey covers a variety of data on the R&D and innovation activities of companies operating in the United States. The five main topic areas are financial measures of R&D activity; company R&D activity funded by others; R&D employment; R&D management and strategy; and intellectual property, technology transfer, and innovation.26 The survey will be fielded to over 30,000 enterprises.
The fifth section, on innovation, collects a number of important measures, notably information on:
• Innovative activities in goods, services, and related activities.
26 http://www.nsf.gov/statistics/srvyindustry/about/brdis/summary.cfm, accessed 15 December 2008.

C-32
• Patent activity and returns.
• Intellectual property transfer activities.
• Intellectual property protection.
The revised survey is based on a report from the National Academies Committee on National Statistics (2004), which recommended that the Survey of Industrial Research and Development be redesigned. The National Science Foundation sought industry input for this. An Industry Expert Panel provided input at three meetings in 2006.27 A Business Expert Panel provided advice in May and November 2008. This panel consisted of large corporations that represent diverse industries.28 The National Science Foundation also conducted over 100 visits to companies to see first hand how R&D is conducted, as well as to assess the types of information that companies maintain. And finally, the National Science Foundation held two workshops to ascertain the types of information needed by researchers and data users.
27 The Industry Expert Panel consisted of 16 high-level executives from A123Systems, Air Products &
Chemicals, Colgate-Palmolive, Corning, General Motors, Google/Regus, Hershey Foods Corporation, Hewlett-Packard, IBM, Lockheed Martin, North Carolina State University, Pfizer, Science Applications International Corporation (SAIC), T/J Technologies, the University of Arkansas at Little Rock, and Wachovia.
28 The Business Expert Panel consisted of representatives from Agilent Laboratories, Agilex Technologies, Alcatel-Lucent, Amgen, the Clorox Company, Ensemble Discovery Corporation, the Hershey Company, Hewlett-Packard, Johnson & Johnson, Lockheed Martin, Palo Alto Research Center (PARC), Stem Cells Inc., Symantec, T/J Technologies, Wachovia, Weyerhaeuser, New York University, and the University of Arkansas.

D-1
APPENDIX D—INTERNATIONAL ACCOUNTING STANDARDS FOR INTANGIBLE ASSETS
The International Accounting Standards Board (IASB) is a private-sector organization that establishes international standards for financial reporting. The development of standards is a collaborative effort that involves engaging investors, regulatory entities, business leaders, and the global accounting profession. These standards harmonize the generally accepted accounting principles of over 100 participating countries. The Securities and Exchange Commission recognizes IASB as an international standards setting body.
IASB has established several guidelines pertaining to the identification, recognition, and valuation of intangible assets. (See Table D-1 for a list of relevant guidelines for preparing and presenting financial statements for intangible assets.) These guidelines refer to different contexts in which assets are identified, recognized, and valued. Each set of guidelines is complex and slightly ambiguous. Firms are often allowed to select accounting policies based on factors specific to the firm’s assets and business activities. As a result, guidelines on the recognition and reporting of intangible assets are conflicting and conceptually inconsistent. The IASB has not resolved many of the conceptual issues involved in measuring intangible assets.
Table D-1: Existing ISAB Guidelines Related to Measuring Intangible Assets Framework for the Preparation and
Presentation of Financial Statements for Intangible Assets
Establishes concepts for the preparation and presentation of financial statements for external
users IAS 38a Standards for recognizing intangible assets
that are not specifically dealt with in other guidelines Methods for measuring intangible assets
IFRS 3b Financial reporting requirements for business combinations (mergers and acquisitions)
IAS 39c
Defines fair value Framework for measuring fair value Intended to be used in other guidelines that allow fair value measurement
IAS 36d Procedures to ensure that assets are carried at no more than their recoverable amount Guidelines for recognizing an impairment loss
Notes: a IASC Foundation, “IAS 38 Intangible Assets,” http://www.iasb.org/NR/rdonlyres/149D67E2-6769-
4E8F-976D-6BABEB783D90/0/IAS38.pdf, accessed 15 December 2008.

D-2
b IASC Foundation, “IFRS 3 Business Combinations,” http://www.iasb.org/NR/rdonlyres/73E562FE-F581-4DD4-8365-B17E228955C9/0/IFRS3.pdf, accessed 15 December 2008.
c IASB, “Using judgement to measure the fair value of financial instruments when markets are no longer active,” http://www.iasb.org/NR/rdonlyres/F3AFDA4D-6605-42CE-858F-23BBB9044355/ 0/IASB_Staff_Summary_October_2008.pdf, accessed 15 December 2008.
d IASC Foundation, “IAS 36 Impairment of Assets,” http://www.iasb.org/NR/rdonlyres/A288C781-7D39-4988-BA71-9AB77A263BA0/0/IAS36.pdf, accessed 15 December 2008.
Defining and identifying intangible assets
Assets are resources controlled by a firm as a result of past events (IASB n.d.). Intangible assets are defined as identifiable nonmonetary assets without physical substance. An identifiable asset is an asset that can be disposed of without disposing of the entire business. To be identified, the intangible asset must meet one of the following two criteria:
• The asset must be separable from the firm and capable of being sold, rented, or licensed to another entity.
• The asset may arise from contractual or legal rights. An intangible item that is protected by legal rights is an asset regardless of whether the rights to the asset are transferable.
Intangible items may be developed internally, purchased, or acquired through a business combination, such as a merger. The manner in which an asset is developed or acquired does not affect whether the item is identified as an asset.
There are three approaches or identifying intangible items (IAS 38):
1. Hypothetical business merger—the entity acts as the acquiree to identify intangible items of market value in the same manner as it would in testing for impairment as set forth in guidelines on business combinations (IFRS 3) and the impairment of assets (IAS 36).
2. Indicators—the entity identifies intangible items based on the presence or indication of presence and value of an asset, such as management plans.
3. Management—entities use management plans and budgets to identify intangible items.
While the approaches that are based on indicators and management plans are bottom up, the hypothetical-business-merger approach is top down and a more comprehensive and holistic method for identifying intangible items. Accordingly, the business merger approach is likely to identify the greatest number of intangible items. The approaches based on indicators and management plans are likely to miss internally generated intangible items that satisfy the identification criteria. Nonetheless, these two

D-3
methods are used because they are less expensive and less time intensive than the hypothetical business merger approach.
There are two types of intangible assets:
1. Planned intangible assets are developed through projects intended to create the item. Assets that arise during the development of a planned intangible asset are referred to as interim assets. Examples of planned assets include R&D, intellectual property, and design plans.
2. Unplanned intangible assets are the result of daily activities. Examples of unplanned assets include brands and customer lists.
While the development of planned assets is managed and documented, the development of unplanned assets is not managed or documented. Managing planned items usually involves a budget that details cost of development and cash flows. Because unplanned assets are not managed, there is usually not a budget. Although planned and unplanned intangible assets are valuable business resources, only planned intangible assets are recognized.
Intangible assets can also be classified as either internally generated or acquired from an external source. Internally generated assets are the result of planned and unplanned in-house activities. Externally generated intangible assets may be acquired through separate purchase or as part of a business merger. The manner in which the intangible asset was developed or acquired determines the guidelines used to recognize and measure the value


E-1
APPENDIX E—BUSINESS PERSPECTIVES ON MEASURING INNOVATION: SUMMARIES OF DISCUSSIONS WITH
COMPANIES
INTRODUCTION
To understand innovation from the perspective of the firm, current and former senior leaders of 11 private-sector firms were interviewed. The goal was to seek information about (1) how firms think about and measure innovative activities, (2) investments in inputs to innovation activities, (3) innovation infrastructures, and (4) methods for measuring the value of intermediate and final outputs. These discussions covered frameworks, methods, and data that could be used to measure innovation and the manner in which measures of innovation are used at the firm level. The discussion focused on four areas: human capital; intellectual capital; organizational capital; and relational capital. Senior executives from three types of companies—large, small, and other—were interviewed. Each provided a different perspective on measuring innovative activities in their companies. A summary of the discussions follows.
• Large companies
Vice-President, R&D, Dow Chemicals
Senior Manager, Insurance Company29
Former Vice-President, Global Innovation, Proctor and Gamble
Vice-President, Emerging Markets, Staples
Vice-President, Global Storage, Sun Microsystems
• Small innovative companies (subset of firms that have received government grants to pursue innovative work)
Founder and CEO, The Pom Group, MI
Vice-President, R&D, Relion, Inc., WA
Founder and CEO, wTe, MA 29 Anonymized at request of former employee being interviewed.

E-2
• Other types of firms
Founder and Chairman, Innocentive, an open innovation company, MA
Partner, Consulting Firm
Partner, xSeed Capital Management, a Venture Capitalist firm, CA
All firms agreed that measuring innovation at the national level would provide valuable information about economic productivity and growth. Since firms gain competitive advantages by innovating, a national measure of innovation could be used to measure national competitiveness in global markets. Measuring investments in innovation and innovation productivity could be used to estimate returns on national investments in innovation, such as investments in R&D and technological infrastructure. These measurements could be used to develop policies to support innovation at the industry and firm level and promote economic growth.
Effective metrics at the firm level that can be meaningfully aggregated to a national level are needed. Potential metrics for innovation inputs include investments from venture capitalists and government funding. Potential metrics for outputs include number of jobs associated with innovation activities, revenue growth, increases in profitability, and productivity gains.
Although measurements of investments in innovation and associated outputs are likely to be imprecise, these metrics would illustrate the effectiveness of U.S. innovation activities and national progress in achieving innovation goals. Metrics focusing on specific innovation activities could be used to determine how innovation activities contribute to the national economy. Furthermore, such metrics could be used as benchmarks for international comparisons. Many countries are establishing strategic innovation goals and policies to promote economic growth.
LARGE COMPANIES
Dow Chemicals
The Dow Chemical Company provides innovative chemical, plastic, and agricultural products and services that include contract manufacturing and process technology licensing. It also provides venture capital for start-up companies with capabilities and products that align with Dow’s strategic objectives. Its core competency is a mastery of science and technology across disciplines. Dow strategically invests in

E-3
R&D and in an innovation infrastructure to support long-term productivity and growth. The overarching innovation and growth strategy focuses on product portfolio management, science and technology leadership, and strategic and emerging markets.
Dow’s size enables the company to organize its innovation activities on a scale and scope that other companies cannot. Dow funds basic and applied R&D across disciplines to develop a broad S&T base. This S&T base provides key capabilities that are leveraged throughout the company. Dow also organizes R&D to align with business lines. Other innovation activities include prototype development; pilot plant construction; pilot testing of production processes; testing to meet regulatory requirements for health, safety, and environmental sustainability; tooling up to commercial-scale production, market exploration; and launch advertising. Expenditures on innovation activities can be broken out by type of activity and business line. Dow can also determine expenditures for each phase of the stage-gate product development model.
Human capital is one of two critical inputs into Dow’s innovation activities. Human capital consists of a skilled workforce with expertise developed through formal education and professional experience.
The second critical input is intellectual capital. Intellectual capital refers to the knowledge gained through extensive R&D that serves as intermediate output of early-stage innovation activities and input into product development and late-stage innovation activities. Dow strategically manages its intellectual property portfolio to secure opportunities to innovation and protect potential market opportunities and revenues. The propensity to patent reflects strategic perceptions of the role of patents in innovation and differs across product lines. It is difficult to estimate the market value of intellectual property because it depends on subjective perceptions about the market value of the final product. Moreover, some patents may be used defensively to protect opportunities and provide leverage in negotiating joint ventures. Nonetheless, application and maintenance costs could be used as a proxy for the value for intellectual property, since they suggest perceived technical and commercial utility of the patent.
In terms of relational capital, Dow partners with government entities, universities, and independent laboratories to pursue research of strategic interest to partnering entities. Dow funds research at other entities, especially universities. It also receives funding to perform R&D and production services for other companies and government agencies. Research consortia and joint ventures are a mechanism for gaining access to expertise

E-4
and technological resources that are not available internally. Although partnerships are important to developing innovations, there is no effective method for measuring the value of collaborative innovation activities.
Dow has several measures used in evaluating its R&D and innovation activities, none of which is entirely satisfactory. Human and intellectual capital inputs may be measured as expenditures on labor, R&D, and acquisition of R&D equipment. However, such measures do not reflect the quality of the input and the contribution to innovation productivity.
Innovation can be rudimentarily measured as sales revenues from innovative products in the first 5 years after market introduction. The utility of this metric depends on the specificity of the definition of innovative products, since innovation is a “squishy” concept that can be interpreted differently. Percentage of sales or revenues from innovative products is not an completely satisfactory measure since it is also a function of multiple exogenous factors, such as product lines in the market, market structure, and product life cycle. The value of process innovations can be measured as the change in costs or revenues from implementing the new process. Changes in operating costs and revenue streams are closely analyzed when the implementation of the process involves capital outlays for new equipment. A more useful metric includes products that are based on sales of innovations protected by patents. Dow uses this metric as an estimate of return on investments in R&D and of the value of intellectual capital. The chief technology officer evaluates innovation activities to measure the return on investments in R&D and innovation activities.
The Insurance Company
This insurance company provides insurance products and services to individuals and companies through brokers and directly to customers through its Web site or call center. The insurance company operates four strategic business units: (1) personal markets for homeowners, auto, personal liability, and life insurance; (2) commercial markets for property, asset, re-insurance, and group life and disability insurance to mid-size and large companies; (3) agency markets to provide property and casualty insurance products through a network of independent agents; (4) international operations that provide personal, commercial, and specialty insurance products in 13 countries.

E-5
The insurance company performs seven core business functions across all business units:
1. Distribution to establish and maintain sales channels.
2. Consumer marketing to generate demand and create market potential.
3. Product organization, which includes activities to conceptualize and develop products.
4. Actuarial analyses to determine insurance product pricing.
5. Information technology infrastructure development to facilitate sales and services.
6. Publication and distribution of information materials to inform customers.
7. Communications activities to support marketing, sales, and customer relations.
Within each business unit, the insurance company performs innovation activities across all core business functions to develop new products, improve customer services, and increase market share.
The company’s innovation activities focus on developing new products, reducing the prices of existing products and services, and conducting market research. Its organizational capital includes two major teams, actuarial and marketing:
• Actuarial teams develop statistical models to enhance pricing models for existing products and develop new products.
• Marketing teams study the consumer space and define segments of the population to conceptualize and develop products targeting the needs of various portions of the population or for market differentiation.
The insurance company’s human capital is an important input into its innovation activities. Human capital includes expertise in actuarial modeling, insurance markets, and market segmentation. To support the sale of new products and enable effective customer support, the company provides formal training on the characteristics of innovative products and their value for potential customers.
The company’s intellectual capital depends heavily on its information technology infrastructure. The information technology infrastructure facilitates the sale of new products and enables customer support by collating customers’ personal and product information in a database. As insurance products and services have become customized to meet consumer needs, the information technology infrastructure, as well as related

E-6
analytical tools, has become an increasingly important input into the development of innovative products and services. Thus, the growing importance of the information technology infrastructure has required developing and implementing organizational changes to produce and sell innovative insurance products services.
The insurance company leverages its intellectual capital, including expertise, analytical models, and actuarial algorithms, in the development of innovative products, but does not protect intellectual assets through formal intellectual property mechanisms, such as patents and copyrights. Rather, intellectual assets are protected as trade secrets. It is extremely difficult to determine the value of trade secrets because they are not traded in the marketplace.
Its relational capital consists of collaborations to overcome gaps in expertise as it builds up in-house expertise. In particular, the company collaborates with market analysts to perform market research and commercialize customer-specific insurance products because it lacks deep expertise on market segmentation. It uses a New York marketing firm to identify emerging trends about consumer needs, to offer new ideas, and to test these ideas on consumers. They do not collaborate using open innovation tools, such as Innocentive, because of the proprietary nature of its statistical models used to develop and price products. As it develops the requisite in-house expertise, it is likely to reduce collaboration, since an understanding of the market serves as a competitive advantage in the development of products.
Measuring the company’s investments in innovation inputs and activities is extremely difficult. The company does not systematically track expenditures related to innovation activities as such. Operational budgets are organized by products and business lines, not activities, and management strategies do not focus on innovation. Therefore, expenditures on innovation activities within operational budgets cannot be easily tracked. On the other hand, human capital could be measured as the number of employees involved in innovation activities, time spent on such activities, and their salaries. The development of novel expertise may be measured by the number of new hires with expertise not found elsewhere in the company. However, how precisely investments in human capital as inputs into innovation are measured depends on the specificity of the definition of innovation activities.
Calculating returns on investments in products and linking product revenues with infrastructure investments are also difficult. The company primarily performs incremental

E-7
innovations that are developed and implemented over long time frames (4–5 years). Managers use stage-gate strategies to calculate the productivity of specific innovation activities, improvements in information technology infrastructure, and the results of organizational changes. Quantitative measures of business potential are used to estimate the market potential for products and services. Managers use estimated business potentials to make decisions about complementary investments in infrastructure and product development.
Despite the challenges in calculating returns on investments, managers would like to be able to calculate a return on investment metric that would enable them to understand the gains from infrastructure investments in information technology and human capital. To develop a return on investment metric would require large changes in the accounting system to code the human capital, information technology, and training associated with innovation. But measuring innovation in terms of GDP would help companies to understand innovation and the long lead times for innovations in their companies.
Proctor and Gamble30
Procter and Gamble (P&G) produces products in three global business units: beauty and healthcare; household care (fabric care, home care, baby care, family care, snacks, coffee, and pet care); and Gillette (blades, razors, Duracell, and Braun). To develop and market a broad range of products, P&G has focused on three main capabilities:31
1. Understanding consumer needs.
2. Acquiring, developing, and applying technologies across product categories.
3. Connecting to consumer needs with technological capabilities.
These capabilities are rooted in fundamental scientific, technological, and marketing competencies. P&G develops new products and improves existing products by integrating its S&T capabilities across product lines.
30 “Facts about P&G,” 2007, http://www.pg.com/content/pdf/01_about_pg/01_about_pg_homepage/
about_pg_toolbar/download_report/factsheet.pdf. 31 See http://www.pg.com/science/rd_formula_success.shtml.

E-8
P&G has invested heavily in R&D and intellectual capital. It invests approximately 4% of global sales in R&D, making it one of the top 20 R&D investors among U.S.-based companies. R&D activities focus on four technical areas:
1. Fat and oil materials.
2. Surface and phase chemistry.
3. Absorbent structures and materials.
4. Perfumes and odor management.
P&G has an organizational structure that enables its S&T competencies to be leveraged across product lines and to build on its existing human capital. Basic strategic research is performed in an independent R&D unit, and applied research within business units supports product development. Research activities build on each other by applying human capital expertise and intellectual property derived from previous research. Expenditures on R&D activities can be broken out by business line and investments in strategic research.
P&G also uses internal information technology networks to catalogue and share ideas and technical information (Huston and Sakkab 2007). The Eureka catalogue is a database of new ideas that uses a standardized template to organize characteristics of the new idea, including scientific and technical principles, intellectual property, related proprietary technologies, and related consumer needs. P&G also has a supplier network to develop new ideas and R&D results. These networks and databases are used to cross-fertilize ideas across business lines to develop innovative products. The vice president of design, innovation, and strategy develops and maintains the operation budget for innovation and strategy.
In terms of relational capital, P&G collaborates in the development of innovations through open innovation networks. Further, P&G solicits new ideas and solutions to technical problems from a network of scientists around the world from academia, entrepreneurial start-ups, and other researchers. It selects solutions that solve technical needs and leverage existing internal technical capabilities. The innovator is paid upon successful completion of the project. This strategy enables P&G to test multiple solutions simultaneously and thereby minimize financial and opportunity costs.
P&G performs several innovation activities to facilitate commercialization of technological advances. Commercialization activities have three orientations: customer
E-9
awareness, customer trial (initial use), and brand loyalty (continued use). P&G performs market research to understand consumer needs and identify market opportunities. It also performs product research to integrate consumer needs identified through market research and technical advances achieved in S&T R&D. Expenditures on commercialization activities can be broken out by product and business line. The returns on commercialization activities can be measured as product lift (that is, additional sales), resulting from commercialization and marketing expenditures.
At P&G, measuring investments in innovation is not difficult. Investments can be obtained from operational budgets for business lines that conduct R&D. Costs can typically be determined with 80% to 90% accuracy. Investments in human capital can be measured as the number of employees involved in innovation activities, their salaries, and time spent on innovation activities. The outputs can be measured as the marginal revenues from the sale of new innovation products. Managers evaluate the productivity of innovation activities using quantitative and qualitative metrics that are specific to the activities performed in their departments. Overarching measures of the output of innovation are based on consumer acceptance of innovative products and can be measured as sales and revenues.
In addition, the overall effectiveness of open innovation networks (as opposed to internal innovation investments) can be assessed by comparing investments needed to achieve technical benchmarks to investments needed to achieve analogous benchmarks through internal innovation activities. The inputs into open innovation networks are the number of scientists participating in the R&D. Intermediate outputs consist of number of new ideas generated. The outcome of open innovation activities are the revenues from products developed through these activities.
Staples
Staples’ core business activities include reselling office products and providing office supply services and preliminary customer support for digital devices. A significant component of the business is based on Internet sales. Staples’ core competencies include supply chain management, retail operations, and corporate customer account management, which includes ordering, billing, tracking, and delivery. Staples differentiates itself from competitors through superior customer services. As a reseller and service supplier, most of Staples innovations are related to purchasing and procurement, inventory management, and logistics and distribution.

E-10
As an operations business, Staples does not focus on innovation in the same manner as manufacturing businesses. Innovation is part of an overarching effort to improve efficiency and improve customer satisfaction. Accordingly, most innovations result in new or improved business processes.
Staples undertakes two types of innovation activities, incremental and radical:
1. Incremental innovation is a continuous process that results in moderate improvements in existing capabilities. Such innovations are developed and implemented as part of daily operations. The cost of developing incremental innovations cannot easily be estimated from operational budgets.
2. Radical innovations occur much less frequently and result in novel capabilities. These innovations are developed and implemented through strategic plans. When internal sources are not adequate, external technical experts and suppliers are used. The most recent radical innovation involved supply-chain redesign. The new system was designed by Accenture and cost $30 million. Staples typically spends 0.1%–0.2% of sales on external consultants in developing radical innovations.
Because incremental and radical innovations are developed and implemented by fundamentally different mechanisms, they are measured using different types of data and indicators. Staples supports the implementation of radical innovations by funding training that develops the skills needed. These training costs are included in the total costs of implementing the innovative capability. There is no formal training to support incremental innovation.32 Since incremental innovation is an implicit part of daily operations, it is not possible to estimate the costs of informal training.
Staples’ logistics and distribution processes greatly enhance customer service through incremental innovations. Innovation is an implicit part of the activities of these teams. The costs of these innovations are part of the operational budget. Although there is not a separate budget item, teams are able to closely monitor the returns on investments in new processes. A team dedicated to strategic evaluations of all business processes calculates a return on investments based on documented improvements in efficiency. Approximately $10 million is invested annually in these overarching strategic evaluations.
32 Staples trains all new employees, in order to maintain operational capabilities. Because of the high
employee turnover rate, the training budget is approximately $100 million.

E-11
The procurement team continually negotiates with vendors to improve costs and services. The team has 10 people and an annual budget of approximately $1.5 million. Although the team does not produce any product, service, or process innovations, its relationships with vendors are an important form of organizational capital that is leveraged to improve customer service. The value of this organizational capital is not easily estimated, but a portion of the team’s operating budget can be used as a proxy.
As resellers, Staples does not perform extensive market research. Most market research and commercialization activities are performed by the producer. However, Staples has a small strategy group that explores market opportunities at a corporate level. This group engages producers in identifying and scoping new opportunities. The value of market knowledge gained through interactions with producers cannot easily be calculated. Nonetheless, a portion of the strategy team’s $1.5 million operating budget could be used as a proxy for the value of the organizational capital leveraged market analysis.
Staples has invested in relational capital for its branded office supply products. A sourcing group manages the design, development, and packaging of Staples branded products, which are produced by contracted vendors. For example, the sourcing group works with 3M to design and produce Staples brand post-it notes. Branded products generate approximately $1 billion, which is 1.5% of total sales. These costs are tracked through a separate financial entity. Although Staples manages development and design, most branded product innovations are primarily performed by the producer.
It is extremely difficult to calculate the cost of developing such innovations. The value of organizational, management, and process innovations could be estimated as the change in operational expenditures needed to maintain (or improve) a level of sales.
Sun Microsystems
Sun Microsystems, Inc. provides network computing infrastructure solutions such as computer systems, software, storage, and services.33 Its core brands include the Java technology platform, the Solaris operating system, StorageTek, and the UltraSPARC
33 “Sun Microsystems Corporate Overview – November 2008,” http://www.sun.com/aboutsun/media/
presskits/SunCorporateBackgrounder.pdf.

E-12
processor. Sun performs R&D to support the development of innovative products that meet expanding demands for network access, bandwidth, and storage that have driven the explosive growth in network participation and sharing. Its products and computer infrastructure solutions are used primarily by individual developers and large enterprises in a variety of industries, including technical/scientific, business, engineering, telecommunications, financial services, manufacturing, retail, government, life sciences, media and entertainment, transportation, energy/utilities, and health care.
To support the development of innovative products and services, Sun performs three primary innovation activities:
1. Human capital development.
2. R&D at Sun Labs34 oriented toward product development and design.
3. Open source development in communities of collaboration composed of individuals and groups of researchers and engineers in the public and private sector.
These innovation activities serve as the mechanisms for generating and integrating intellectual inputs that spur the development of new products and enable technological development in all phases of the innovation pipeline.
Human capital is one of Sun’s most important inputs into innovation and product development. Sun supports human capital development by providing formal training and education on a regular basis, in addition to informal on-the-job training and recruitment of educated scientists and engineers. The Chief Learning Officer coordinates formal training and education programs and manages a training budget that includes all departments. The cost of developing human capital could be estimated as the sum of training expenditures and the wages of employees for time spent in training. However, this sum excludes the value of human capital derived from on-the-job experience. Thus, a cost-based calculation of the value of human capital may underestimate the value of the work force.
34 Sun Labs comprise independent business units. Research activities focus on promising technological
opportunities and addressing technical problems in product development. Sun Labs R&D programs are not influenced by perceived market opportunities.
E-13
Many of Sun’s innovation activities generate intellectual capital in the form of intermediate outputs that are used as inputs into subsequent innovation activities. The most important intermediates are intellectual property and internally developed software and technology platforms that are used internally to support the development of commercial products. Because an individual platform technology or intellectual property enables the development of multiple commercial products, the total value of an intermediate output is very difficult to measure. The monetary value of each could be estimated according to the historical cost of development. Alternatively, the fair market value may be estimated as a percentage of revenue from the sales of innovative products, processes, or services that were enabled by the internally generated platform technology.
Collaboration with other entities, or relational capital, forms a significant proportion of Sun’s overarching innovation strategy and activities.35 Sun employs a variety of collaborative strategies, including formal joint ventures and alliances, licensing technology and intellectual property from other entities, and open-source communities of collaboration. Joint ventures are formal agreements with another company in which the activities and contributions of each entity are specified in a contract. The value of a joint venture may be estimated based on the cost of performing specific activities, the value of intellectual property contributed, and other resources contributed to the venture. Sun uses licensing agreements to gain access to technology and intellectual property developed by another entity or to provide access to internally developed technologies and intellectual property to other entities. The monetary value of licensing agreements could be estimated according to royalties (or other payments) paid or received through the agreement.
Sun also uses open-source communities of collaboration to increase the number of applications in which software code or platform technology is developed. Through these communities, several individuals or entities may contribute to the development of a specific product. Accordingly, the value of these ad hoc open collaborations is difficult to estimate. Sun’s corporate budget does not include items directly related to the management of open-source communities. However, the stock market value of open-source management companies, such as Red Hat, normalized for the size of the company
35 Organizational capital refers to the knowledge, skill, and resources made available through interactions
with other entities in the development and commercialization of products and services. According to economic literature on innovation, Sun’s collaborative activities are considered organizational capital. Businesses are not always familiar with the term, however.

E-14
or its R&D activities, might be used as a proxy. Costs of legal resources used to enforce intellectual property rights may also be used as a proxy to estimate the value of complex and ad hoc collaborations.
Sun performs targeted commercialization activities to launch products and support product diffusion. Such activities include market research to identify and explore commercial opportunities, advertising to support the launch of a new product, and the development of innovative customer support services.36 Nonetheless, commercialization activities are specific to the product, based on the nature of the product and the market. While the cost of commercialization activities could be broken out by product line, it would be more meaningfully reported by aggregating costs across the firm.
Sun could provide data on costs associated with its innovation activities. These activities can be valued according to historical cost or fair market value. However, historical costs are not likely to accurately reflect the fair market value of outputs of innovation activities, especially intermediate outputs that serve as inputs into other innovation pipelines. Sun typically measures and evaluates innovation activities using productivity measures that describe the efficiency with which inputs are translated into outputs. Similarly, any historical cost method for estimating the value of collaborative activities is likely to underestimate the strategic value of the collaboration.
Small innovative companies that received government funding to pursue high-risk innovative projects
The Pom Group
The Pom Group invented the Direct Metal Deposition (DMD) system, a novel laser-based computer-aided-design technology used to fabricate functional metal products and tools. DMD technology enables novel manufacturing capabilities in several industries, including automotive, aerospace, mining, oil and gas, nuclear, and defense. Pom is the only full-service provider of DMD technologies.
36 An example of Sun’s innovative customer support programs is the remote monitoring and management
of Sun network and storage systems.

E-15
Pom’s core competency is the development of DMD systems and processes through applied R&D. The group is currently developing next-generation systems with improved accuracy and remote operational capabilities. It also constructs and installs DMD systems according to customer specifications and provides training and technical support. Because it is a small company, engineers that perform R&D also construct and install systems and provide technical support. This organizational structure has advantages and disadvantages. While most of the engineering staff is not trained to provide client services, direct interaction with customers results in a better understanding of their technical needs and market opportunities. In this manner, customers are informal collaborators that provide insight for product enhancements and novel capabilities.
Human capital is critical to the Pom’s innovative capacity. Pom’s workforce consists of engineers, who develop systems and perform research, and technicians, who assist the engineers in operating production systems and performing research. The engineers have advanced degrees in engineering disciplines and extensive research experience. Most are hired from the mechanical engineering department at the University of Michigan, because of the relevance of the academic and research programs. Technicians do not have the same level of expertise. Because DMD is a completely novel technology, Pom provides formal on-site technical training to technicians. The core engineering staff spends approximately 2 weeks training new technicians and provides regular training to ensure that technicians have the needed skills. Training costs can be determined using the number of hours spent on training activities by engineers who provide training and the number of participating technicians and their salaries. The total value of Pom’s human capital cannot easily be determined, however, since the expertise and skills of the engineers are the result of academic and on-the-job training.
Pom’s engineers develop innovations through the application of technical knowledge and skills. Innovation activities include internal R&D, system design, software development, prototype construction and testing, tooling up for production of new systems, and technical services to support system implementation at user facilities. Critical inputs to innovation activities include human capital and knowledge gained through internal R&D. Since each innovation activity is a core operational activity, expenditures for each activity can easily be obtained from the operating budget.
Pom strategically manages intellectual property to support the development of new products. Currently, it holds 14 patents and is applying for 30 more. Its patent portfolio includes two patents purchased from the University of Michigan and a licensed

E-16
patent from the Department of Energy. Pom licenses rights to internally developed technologies and software and receives royalty payments for their use. Pom’s management suggested a cost-based method for valuing intellectual property that includes cost of patent applications, maintenance, intellectual property insurance, and associated legal fees. Such, a cost-based measurement might understate the value of intellectual property in developing new technologies and services, however.
Pom’s patent portfolio has been critical in obtaining venture capital funds to support further development and commercialization. Venture capitalist investors have estimated the value of Pom’s intellectual property portfolio at seven times the company’s book value. Although Pom’s management team does not fully understand the investors’ method for estimating the value of the patent portfolio (it is a “black box”), it is an indicator of innovative productivity and potential growth.
In terms of relational capital, Pom participates in numerous collaborative R&D projects to leverage expertise and resources available at universities and software-development firms. The University of Michigan serves as a strategic partner by performing basic engineering research that has enabled the development of DMD. Pom subcontracted specific researchers at the university because of their expertise and access to expensive technologies and facilities. It also contracted a software-development firm to write a program, according to its specifications, to run the DMD systems. Pom contracted the software firm to write a program according to its specifications. It then tested and evaluated the program in its DMD systems. None of these collaborations involved the transfer of intellectual property. Pom also collaborates with users to develop DMD systems that meet their specific needs. The value of these collaborations could be estimated using cost-based approaches, since each involved contracted work. However, expenditures for contracted research are likely to be lower than the value of the research output in developing an innovative DMD system.
Although Pom is the sole producer of DMD systems, it performs market-oriented activities to facilitate market entry and technology diffusion. These marketing activities include market exploration and identification and technology diffusion. Its marketing department performs most of these activities. To support technology diffusion, Pom’s engineers attend professional conferences and trade shows to present DMD technology. Expenditures for all these commercialization activities can easily be obtained from operational budgets.

E-17
As a developer of novel technologies, Pom routinely measures innovation as a function of its ability to generate and apply knowledge. It uses qualitative indicators associated with intermediate outcomes of innovation activities to evaluate innovative productivity and overarching innovation strategies. However, it is difficult to estimate the value of intermediate outputs since their value is a function of their contribution to final innovative output and the market value of the final output. Venture capitalists measure innovative capacity by estimating the value of the intellectual property portfolio. Upon successful commercialization, venture capitalists evaluate innovative productivity as increases in market share. The Pom Group’s and venture capitalists methods of measuring innovation are largely speculative estimations of future returns on early-stage investments.
ReliOn, Inc.
ReliOn Inc. of Spokane, Washington, is a late-stage startup company that produces stationary backup proton exchange membrane fuel cell power systems for telecommunications and government applications. ReliOn’s commercial certified products include hydrogen fuel storage, and they are scalable from 1 kW to 12 kW. To date, ReliOn has installations at 550 sites worldwide totaling 1.8 MW of capacity.
To facilitate commercialization, ReliOn conducts market research to identify, characterize, and quantify new market opportunities. Through these activities, it develops a detailed understanding of the customer base, individual customer needs, and the nature of the sales cycle. ReliOn also performs field tests as required by customers and certification agencies. Its products support network connectivity for remote monitoring and fuel management.
ReliOn’s innovation programs are directed primarily toward the materials, processes, and assemblies that form the heart of its fuel cells. Starting with the electrochemical components that make up the membrane electrode assembly, the core technology also includes gas-diffusion layers, current collectors, heat sinks, specialized sensors, seals, and cell containment frames. ReliOn’s core competencies include R&D to identify and characterize electrochemical materials that enhance system performance.
ReliOn’s innovation activities are technologically driven and depend on a well-educated and skilled workforce. ReliOn hires scientists and engineers to conduct research and perform technical innovation activities. It provides specific proficiency training as

E-18
necessary and promotes continuing professional education through a corporate tuition aid program. Funding for training activities is included in the operating budget.
The company’s strategy for innovation asserts value creation through generation of new intellectual property, including patents and trade secrets, and encourages continuous core technology improvements through novel materials and designs. Accordingly, deliverables from key innovative programs maintain competitive advantage throughout the entire product roadmap.
The R&D team is devoted to enhancing and protecting its core technology. Through an aggressive program of theoretical and applied materials science and electrochemical engineering, the team develops and optimizes new materials and assemblies for future generation products. Each laboratory proof of concept generates potential for additional intellectual property for ReliOn. ReliOn has a comprehensive trade secret policy and documentation control program that fully covers all proprietary development and inventive activities. ReliOn retains legal counsel for guidance and implementation of their intellectual property strategy.
The core team employs state-of-the-art tools in molecular modeling, mechanical solids modeling, thermodynamic process simulation, etc. The team also has access to a broad range of laboratory analytical equipment and to a well-equipped prototyping machine shop. The team frequently contracts with outside firms (and universities) for analytical support, and ReliOn utilizes contract manufacturers for all manufacturing except for fuel cell cartridges, which are produced in-house. ReliOn closely monitors production and product quality, and it provides specialized test equipment for use on production lines. Contract manufacturers are preferred for their ability to manage costs through economies of scale. Furthermore, they can ramp up quickly to product demand. By contracting manufacturing, ReliOn is able to focus key resources on internal technology development.
Another important part of ReliOn’s relational capital is its customers. Its product line management group works extensively with customers to ensure that the product roadmap meets existing and future customer needs. In addition, it develops strategic channels to markets that provide customers with integrated solutions and a variety of maintenance and fueling support programs. ReliOn’s commercial terms include warranty coverage on all products.

E-19
ReliOn maintains supply agreements with specific companies that provide essential subsystems and components to its integrated power systems. Since it prefers to build expertise around its core technology, strategic alliances may be developed to provide customers with a broader range of complementary product offerings and support services. Such alliances and collaborations add value through reduced development costs and accelerated time to market.
ReliOn maintains a comprehensive business plan designed to guide the company to becoming a sustainable commercial business entity. The executive management team sets goals and budgets that facilitate all company operations and resource management. Annual expenditures on innovative activities are well planned and well managed. As ReliOn attains significant traction in the marketplace and positive margin outcomes, the company expects to be able to measure the value of its intellectual property and the real return on innovation investment.
wTe
wTe is a technology-driven, value-added metals and plastics recycler. The company has internally developed and commercialized three critical technologies: high-speed X-ray transmission analyzer (Spectramet DXRT), X-ray fluorescence analyzer (Spectramet XRF), and a molten metal analyzer (Melt Cognition). These technologies identify and separate recyclable metals and convert them into reusable materials. wTe uses these technologies at its recycling facilities around the country and has licensed the rights to use some of its technologies to metal alloy producers. These technologies enable the use of low-grade scrap materials by increasing production and operating efficiencies.
wTe actively promotes the development of core competencies related to the operation of recycling facilities and development and application of new technologies. These activities are distributed across management groups. Current accounting methods attribute investments by technology area. As a result, it is possible to estimate total investment in core competencies, but it would be difficult to specify investments in specific activities to develop core competencies. Thus, the ability to measure overarching investments is a function of the firm’s management structure and accounting policies.
wTe’s innovation strategy is based on a balanced management approach that integrates technical, operational, and financial inputs in market-oriented technology development and commercializing innovation activities. The wTe management team

E-20
defines innovation as the transformation of knowledge into commercial products with social and economic value. Accordingly, innovation inputs include human capital, technology, and financial capital, and innovation activities include both technology development and commercialization. To develop technologies, wTe maintains a well-educated and highly skilled workforce and collaborates with academic researchers and other small firms to leverage cutting-edge scientific expertise. Investments in innovation activities can be readily apportioned according to the product, but it would be more difficult to estimate investments by activity. Commercialization activities include market identification and exploration.
Intellectual property is a critical component of innovation. It is the codified output of research and an intermediate input into technology development and commercialization. The cost of creating intellectual property can be calculated as the sum of research costs, application fees, and maintenance costs; however, it is extremely difficult to measure the value of intellectual property. Often the costs of creating and maintaining intellectual property are less than the value of the contribution of the intellectual property to the innovation process. Since the value of intellectual property can only be determined upon successful commercialization of the innovation, early-stage estimates of the value of intellectual property are fairly speculative.
wTe strategically uses collaborations to access knowledge and skills not available internally. wTe collaborates with other firms to leverage organizational competencies and expertise. These collaborations often involve the exchange of intellectual property. The synergistic effects of leveraging complementary intellectual property and technical capabilities benefit both collaborative partners. wTe collaborates with large firms involved in recycling waste materials for the production of new materials to facilitate commercialization. These collaborations may involve licensing the rights to use a technology for a trial period and result in a technology that fits the user’s precise needs. These collaborative commercialization activities facilitate product diffusion. Although collaborations have been critical to the successful development and commercialization of innovations, it is difficult to determine the value of collaborative activities.
Collaborations could be valued according to the costs associated with the collaborative activities and licensing payments. The value of intellectual property used in the collaboration is not a good proxy since its value is largely speculative, as described above. The value of the output of the collaboration is usually far greater than the initial

E-21
investments. It is difficult to measure the value of a collaboration until the returns on collaborative investment are realized.
OTHER TYPES OF COMPANIES
Innocentive
Innocentive is an open innovation marketplace that enables private and public entities to solicit solutions for technical and commercialization problems from a network of scientists, inventors, and entrepreneurs across six major disciplines, including chemistry, life sciences, physics, math and computer science, engineering and design, and business and entrepreneurship. Through Innocentive, companies engage a community of scientists to explore a diverse array of possible solutions. Open innovation provides a low-risk strategy to exploring alternative solutions because companies only pay for successful solutions. By posting R&D and commercialization challenges on the Innocentive Web-based marketplace Web site, companies are able to evaluate multiple solutions simultaneously and only pay for successful ones.
Innocentive started in 2000 as e.Lilly, an in-house incubator for the pharmaceutical company Eli Lilly.37 Today, 34 companies have posted more than 200 challenges in 40 scientific disciplines. The awards for solving challenge problems are typically $10,000 to $100,000. To date, over $3 million in awards have been given out for successful solutions.38
Open innovation is a supplement to internal R&D and commercialization activities, not a replacement for them. Innocentive provides companies with the opportunity to use open innovation strategies that explore a broader solution space, while reducing R&D risks and costs compared to conventional “closed” collaborations and partnerships.
Innocentive classifies technical and commercialization problems through the innovation pipeline into the following four types of challenges:
37 Dean, Cornelia, “If you have a problem, ask everyone,” The New York Times, July 22, 2008. 38 Wikipedia, “InnoCentive,” http://en.wikipedia.org/wiki/Innocentive, accessed 16 December 2008.

E-22
1. Ideation challenges serve as a global brainstorm to produce ideas for new products, new commercial applications for existing products, and new marketing strategies.
2. Theoretical challenges involves the development of detailed designs for implementing ideas within manufacturing parameters or other specifications.
3. RTP challenges involve the development and testing of prototypes that demonstrate feasibility within the specified parameters.
4. eRFP challenges are requests for partners or suppliers that have the expertise or technologies needed for complex innovation activities.
The inputs into the Innocentive marketplace are the network of scientists, inventors, and entrepreneurs and the formal and informal intellectual property they control. Innocentive has established mechanisms for transferring all types of intellectual property that support successful open collaborations.
Innocentive provides support services to companies posting problems and to the network of solvers:
• For companies posting problems, Innocentive provides ONRAMP services (Open Innovation Rapid Adoption Methods and Practices) to facilitate planning, implementating, and monitoring posted problems.
• For companies offering solutions, Innocentive supports solvers by providing technical assistance in ensuring that the proposed solution meets submission requirements.
In this manner, the Innocentive serves as an intermediary between the company seeking a solution and the solver.
Investments in open innovation are not easily measured. In addition to the cost of posting problems to the marketplace and accessing external ideas, firms must invest in an organizational infrastructure that enables the firm to leverage external ideas. Open innovation is an attractive strategy because it enables companies to explore multiple solutions simultaneously, while only paying for successful solutions. Thus, open innovation strategies reduce risks, opportunity costs, and financial costs.
Most innovation metrics are based on returns on investment. These are static measurements that reflect costs incurred at the time of measurement and projected returns based on perceived risks. Static ROIs are not effective metrics because they don’t reflect the changes in risk as an innovation moves towards market implementation.

E-23
A more meaningful metric, which has been used at Innocentive and Eli Lilly, is based on the “momentum” with which a product moves through the innovation pipeline.39 Project momentum is measured as the net present value of investments divided by the estimated time to market. This metric reflects the effectiveness of innovation strategy and the potential to realize financial returns on earlier investments in developing the innovation.
The productivity of a portfolio of innovation projects can be evaluated using a measure of “conductance.” Conductance describes the efficiency with which resources are used to produce an output. It is measured as the ratio of outputs to costs invested in the development of a portfolio of innovations. Useful outputs may include the number of projects meeting a benchmark, the number of innovative products introduced to the market, and revenues from products in that portfolio. An organization’s conductance for a portfolio of projects affects the momentum of individual projects within the portfolio.
Conductance and momentum can be institutionalized at the firm, industry, and national level as metrics of innovation productivity. These metrics are based on data that can be obtained from operating budgets and financial reports, and their magnitude provides an indication of an organization’s productivity and potential for growth.
Business Consulting Company
This business consulting company supports corporate management efforts to develop strategies that drive long-term performance and increase shareholder value. The company’s approach to developing strategies focuses on its capabilities and competencies, market opportunities, and management practices. To develop strategies, the business consulting company helps firms define their portfolio of intangible assets, including intellectual property, brands, networks, and human capital. Strategies based on organizational competencies, assets, and market opportunities enable firms to identify opportunities to innovate in a manner that increases growth potential and firm value.
At the business consulting company, innovation capacity refers to activities and assets that support the development and commercialization of innovations. At firms dedicated to innovation, the activities and assets that underpin the innovation capacity
39 http://www.innoblogger.com/category/metrics/.

E-24
should be items in their operational budgets. Most firms do not think of innovation as a core competency, however. As a result, innovation activities are not likely to be a part of operational activities. Firms that perform incremental innovation through daily activities cannot provide expenditures on innovation activities. Innovative capacity cannot easily be measured based on operational expenditures for specific innovation activities across all industries.
Innovation should be measured as outlays and revenues. Firms construct an infrastructure to support innovation. This may include information technology systems, R&D equipment, test and evaluation equipment, and databases. They develop human capital by hiring personnel with the relevant skills and expertise to perform innovative activities. Outlays for infrastructure and human capital are measurements for innovation inputs.
Expenditures on inputs can be used as a basic estimate the value of intermediate outputs, such as intellectual property. The outputs of innovation can be measured as revenues from innovative products or the implementation of an innovative production process. Measuring innovation outputs as revenues is consistent with management practices and shareholder reporting.
Intellectual capital is an important intermediate input to the innovation process. Most firms do not think of intellectual capital outside of the context of intellectual property. It is extremely difficult to measure the value of intellectual capital in general. It is equally difficult to estimate the value of intellectual property outside of arm’s-length transactions involving intellectual property. Estimating the value of intellectual property involves speculation of the value of the resulting product and the value of the contribution of the intellectual property. The number of patents itself cannot be used as measure of innovative activity, since not all patents contribute to the development of an innovation. Because such speculations tend to be optimistic they thereby overly value the intellectual property.
Some firms develop innovations through partnerships and joint ventures. The decision to participate in a joint venture involves numerous factors, including direct costs, opportunity costs, and potential revenues. Development costs and potential revenue streams depend on the collaborative strategies used to develop the innovation. Accordingly, the value of a partnership or joint venture may be estimated as the marginal

E-25
difference of costs and revenue streams relative to internally developed innovations. Such estimates are very subjective and consequently of limited value.
Measuring innovation is tricky because firms innovate differently. Innovation inputs and activities vary across industries. Some can easily be measured as outlays in operational or overhead budgets and revenues. Firms that perform incremental innovation usually do not have a budget for innovation activities. The value of innovation activities and intermediate outputs cannot be measured objectively with precision. Since measuring innovation at the firm level is challenging, it would be particularly difficult to measure innovation at a macro level in GDP.
Most innovation occurs at the periphery of existing markets. For truly innovative products, there is no active market before the commercialization of the product. Emerging markets are small, with few producers and consumers. Consequently, the economic activity of emerging markets is difficult to measure.
X/seed Capital Management
X/Seed Capital Management is an early stage venture fund that provides de-novo start-up funding for entrepreneurial firms pursuing breakthrough innovations. X/seed works with companies to commercialize new technologies and exploit market opportunities. Most of the firms supported by X/Seed are spin-offs from universities and other research institutions. X/Seed’s investment portfolio includes companies with information technology, energy, materials, and life sciences innovations.
X/Seed, and venture capital management firms in general, do not systemically measure innovation. Rather, they measure changes in the technical risks as an innovation is developed and commercialized. Risks are measured in terms of cost and time to meet technical-development milestones. The metrics used to develop evaluate milestone achievements are based on:
• Expenditures.
• Development and acquisition of enabling platform technologies.
• Personnel involved in development.
• Time to meet milestones.
Although milestones are oriented toward market entry and diffusion, intermediates produced at each milestone are not valued based on the market value of the final

E-26
product—milestones represent critical technical achievements and intermediate steps, but they do not have market value.
Venture capitalists do not quantitatively measure human capital at the firm level. When investing in a firm, venture capitalists evaluate the quality of the personnel involved in technical development, based on education and experience. There is no attempt to quantitify or assign market value to a firm’s human capital. However, venture capitalists strategically monitor the number of graduates in technical fields and research activities at universities to identify emerging technical opportunities for innovation. Thus, the number and type of graduates could be used as an indicator of national innovation capacity.
Venture capitalists do not assign a market value to intellectual property. Intellectual capital, which includes technical knowledge and skills, are important inputs to innovation, but it does not need to be codified as intellectual property to enable innovation. Most formal intellectual property is not the most significant value-adding input into the development of an innovative product. Estimates of the market value of a patent based on the market value of the product are speculative. Accordingly, intellectual property is not considered a good measure of innovative capacity by venture capitalists.
Formal intellectual property provides “freedom to operate.” It is an organizational resource that can be leveraged to assess a firm’s position in emerging markets. Firms use their patent portfolios to negotiate cross-licensing agreements and partnerships. Cross-licensing agreements, and associated payments and royalties, may be used as a proxy to measure the value of strategic partnerships and organizational capital. However, the value of cross-licensing agreements as a quantitative proxy to measure financial value of partnerships is subject to the inherent weaknesses of using intellectual property to measure innovative capacity.
At the national level, measurements of innovation capacity could be used as a leading indicator of growth potential and as a proxy for competitiveness. The utility of such measurements is limited by the availability of quality quantitative data, however. Firms generally do not collect quantitative and financial data on specific innovation activities and inputs. Moreover, it is extremely difficult to assign an objective value to the intermediate outputs that reflects the productivity of innovation activities. Although qualitative data may be more readily collected over all industries, such data are not as useful in calculating national measures of innovation capacity. The ultimate usefulness of

E-27
a national measure of innovation capacity depends on availability of precise quantitative data that can be collected at the firm level.

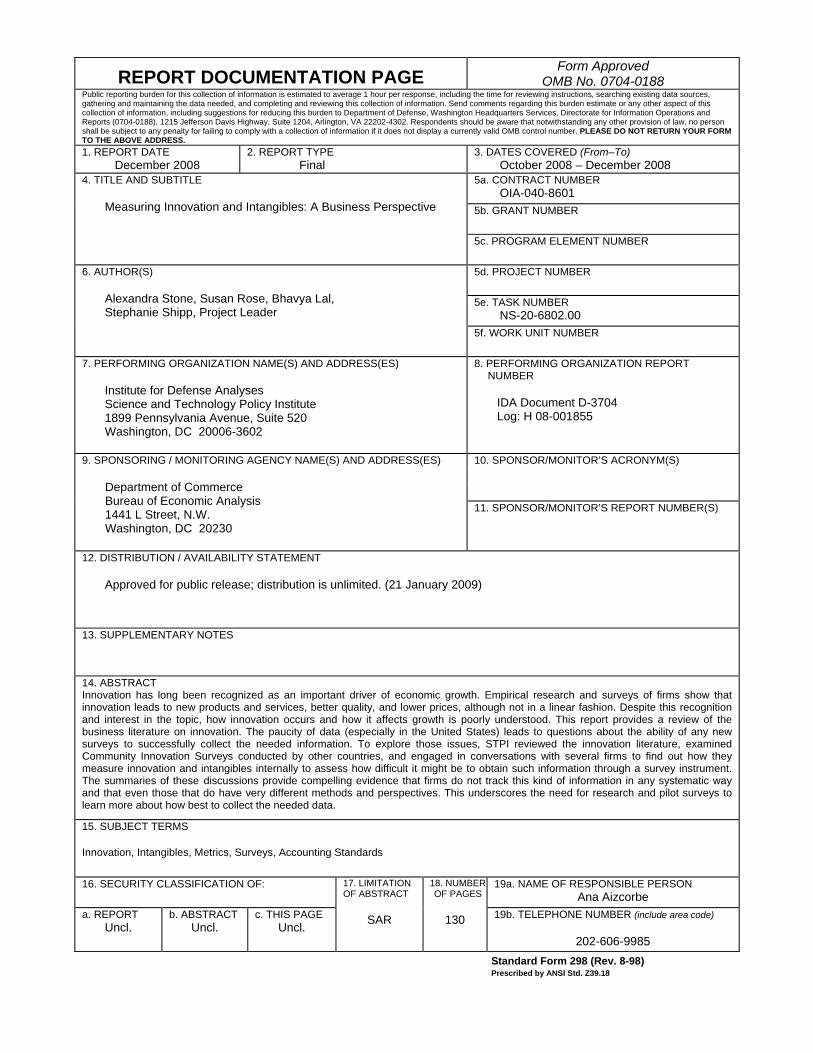
REPORT DOCUMENTATION PAGE Form Approved
OMB No. 0704-0188 Public reporting burden for this collection of information is estimated to average 1 hour per response, including the time for reviewing instructions, searching existing data sources, gathering and maintaining the data needed, and completing and reviewing this collection of information. Send comments regarding this burden estimate or any other aspect of this collection of information, including suggestions for reducing this burden to Department of Defense, Washington Headquarters Services, Directorate for Information Operations and Reports (0704-0188), 1215 Jefferson Davis Highway, Suite 1204, Arlington, VA 22202-4302. Respondents should be aware that notwithstanding any other provision of law, no person shall be subject to any penalty for failing to comply with a collection of information if it does not display a currently valid OMB control number. PLEASE DO NOT RETURN YOUR FORM TO THE ABOVE ADDRESS. 1. REPORT DATE
December 2008 2. REPORT TYPE
Final 3. DATES COVERED (From–To)
October 2008 – December 2008 4. TITLE AND SUBTITLE
Measuring Innovation and Intangibles: A Business Perspective
5a. CONTRACT NUMBER OIA-040-8601
5b. GRANT NUMBER
5c. PROGRAM ELEMENT NUMBER
6. AUTHOR(S) Alexandra Stone, Susan Rose, Bhavya Lal, Stephanie Shipp, Project Leader
5d. PROJECT NUMBER
5e. TASK NUMBERNS-20-6802.00
5f. WORK UNIT NUMBER
7. PERFORMING ORGANIZATION NAME(S) AND ADDRESS(ES) Institute for Defense Analyses Science and Technology Policy Institute 1899 Pennsylvania Avenue, Suite 520 Washington, DC 20006-3602
8. PERFORMING ORGANIZATION REPORT NUMBER
IDA Document D-3704 Log: H 08-001855
9. SPONSORING / MONITORING AGENCY NAME(S) AND ADDRESS(ES) Department of Commerce Bureau of Economic Analysis 1441 L Street, N.W. Washington, DC 20230
10. SPONSOR/MONITOR’S ACRONYM(S)
11. SPONSOR/MONITOR’S REPORT NUMBER(S)
12. DISTRIBUTION / AVAILABILITY STATEMENT Approved for public release; distribution is unlimited. (21 January 2009)
13. SUPPLEMENTARY NOTES
14. ABSTRACT Innovation has long been recognized as an important driver of economic growth. Empirical research and surveys of firms show that innovation leads to new products and services, better quality, and lower prices, although not in a linear fashion. Despite this recognition and interest in the topic, how innovation occurs and how it affects growth is poorly understood. This report provides a review of the business literature on innovation. The paucity of data (especially in the United States) leads to questions about the ability of any new surveys to successfully collect the needed information. To explore those issues, STPI reviewed the innovation literature, examined Community Innovation Surveys conducted by other countries, and engaged in conversations with several firms to find out how they measure innovation and intangibles internally to assess how difficult it might be to obtain such information through a survey instrument. The summaries of these discussions provide compelling evidence that firms do not track this kind of information in any systematic way and that even those that do have very different methods and perspectives. This underscores the need for research and pilot surveys to learn more about how best to collect the needed data.
15. SUBJECT TERMS
Innovation, Intangibles, Metrics, Surveys, Accounting Standards
16. SECURITY CLASSIFICATION OF: 17. LIMITATION OF ABSTRACT
SAR
18. NUMBER OF PAGES
130
19a. NAME OF RESPONSIBLE PERSONAna Aizcorbe
a. REPORT Uncl.
b. ABSTRACT Uncl.
c. THIS PAGE Uncl.
19b. TELEPHONE NUMBER (include area code)
202-606-9985 Standard Form 298 (Rev. 8-98) Prescribed by ANSI Std. Z39.18


The Institute for Defense Analysesis a non-profit corporation thatadministers three federally fundedresearch and development centersto provide objective analyses of
national security issues, particularly those requiring scientific and technical expertise, and conduct related research on other national challenges.
