a new perspective to measuring employee growth: …
TRANSCRIPT

Personnel Assessment and Personnel Assessment and
Decisions Decisions
Volume 6 Issue 1 Article 5
2020
A New Perspective to Measuring Employee Growth: Developing a A New Perspective to Measuring Employee Growth: Developing a
Successful Aging at Work Scale Successful Aging at Work Scale
Stanimira K. Taneva University of Nottingham
Georgi P. Yankov Development Dimensions International (DDI)
Follow this and additional works at: https://scholarworks.bgsu.edu/pad
Part of the Developmental Psychology Commons, Industrial and Organizational Psychology
Commons, Organizational Behavior and Theory Commons, Organization Development Commons,
Quantitative Psychology Commons, and the Training and Development Commons
Recommended Citation Recommended Citation Taneva, Stanimira K. and Yankov, Georgi P. (2020) "A New Perspective to Measuring Employee Growth: Developing a Successful Aging at Work Scale," Personnel Assessment and Decisions: Number 6 : Iss. 1 , Article 5. DOI: https://doi.org/10.25035/pad.2020.01.005 Available at: https://scholarworks.bgsu.edu/pad/vol6/iss1/5
This Measurement and Measures is brought to you for free and open access by the Journals at ScholarWorks@BGSU. It has been accepted for inclusion in Personnel Assessment and Decisions by an authorized editor of ScholarWorks@BGSU.

Personnel Assessment And decisions
492020 • Issue 1 • 49-62 http://scholarworks.bgsu.edu/pad/
MeasureMent and Measures
A New PersPective to MeAsuriNg eMPloyee growth: DeveloPiNg A successful AgiNg At work scAle
Stanimira К. Taneva1 and Georgi P. Yankov2
1. University of Nottingham, UK2. Development Dimensions International (DDI)
The emerging concept of successful aging at work (SAW) is rooted in the contemporary interpretations of the organizational and lifespan developmental theories. It emphasizes the important role of workplaces for success-ful aging (Olson & Schultz, 2019), implying that long and positive work-related experiences can be sustained through successful adaptation to both intra-individual (e.g., age-re-lated) and external (e.g., environmental) changes (Kooij, 2015; Olson & Schultz, 2019; Zacher, 2015a). Kooij (2015) described SAW as the sustainable maintenance of an in-dividual’s work ability, health, and motivation across the working life cycle. In this definition, the active role of the employee for the creation of work resources and securing an ongoing person–environment fit is of key importance. Zacher (2015a, b) pointed out that SAW is not limited to maintaining current levels of functioning and may refer to a worker’s development or growth. Thus, SAW can be viewed as an intra-individual age-related trajectory to a work outcome (e.g., well-being or job performance) that deviates positively from the average age-related trajectory. Even an employee who has experienced a decline in a work outcome over time may be aging successfully at work when his/her trajectory is more positive than the average age-re-lated trajectory (Zacher, 2015a, b).
In a systematic way, Zacher, Kooij, and Beier (2018) outlined the factors contributing to active aging at work (AAW), which is a construct that somewhat overlaps with
SAW (cf. Zacher, 2015a). AAW is described as workers’ ability to “maintain or improve (1) their physical, mental, and social well-being; (2) continue to show high levels of work engagement and performance; and (3) experience fair treatment and employment security” in the aging process (Zacher et al., 2018, p. 37). Because development is a life-long process, AAW refers to workers of all ages and career stages. Multilevel factors (individual, team, organization-al, and wider societal) contribute to AAW/SAW (see also Kooij, Zacher, Wang, & Heckhausen, 2019). The idea of understanding AAW/ SAW in relation to both internal (e.g., person) and external (e.g., environmental) factors is in line with the ongoing criticism that being focused mostly on the process of intra-individual development, lifespan theories overall are likely to neglect the effects of the context on the
ABSTRACT
KEYWORDS
The aging of the world’s population has become a grand societal challenge, which requires an urgent response from researchers, professionals, and the wider society. One way to respond to this challenge is by supporting individuals in sustaining longer and healthier working lives, that is, age successfully. Although the advantages of promoting and enabling successful aging at work have been widely acknowledged, no single instrument for measuring this construct has been published so far. We develop and test in three consecutive samples a two-dimensional successful aging at work scale. This novel instrument is rooted conceptually in the most recent theoretical developments and is applicable to a variety of work settings and groups of workers. It can be used by both employees and employers for the purposes of individual and organizational development. We also propose directions for future research.
successful aging at work, growth, development,
lifespan, scale, measurement
Corresponding author: Stanimira TanevaUniversity of Nottingham, Room B42, Law & Social Sciences Build-ing, University Park, Nottingham, NG7 2RD, United KingdomEmail: [email protected]
This study follows a 2-year fellowship program (“THRIVING IN THE WORKPLACE - SUPPORTING PEOPLE AT THE AGE OF 55 YEARS AND OVER IN SATISFYING AND PRODUCTIVE WORK”) funded by the European Commission under its Marie Curie Intra-European Fel-lowship scheme.
502020 • Issue 1 • 49-62Published By ScholarWorks@BGSU, 2020
Personnel Assessment And decisions develoPing A sAW scAle
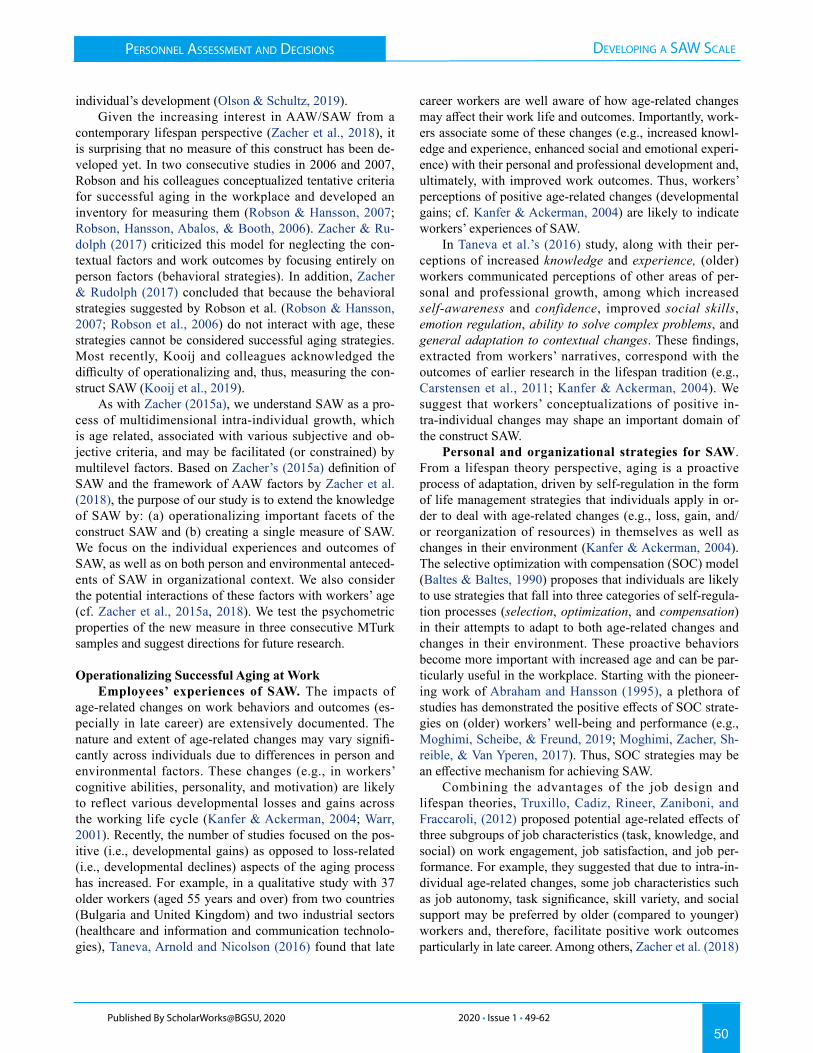
individual’s development (Olson & Schultz, 2019).Given the increasing interest in AAW/SAW from a
contemporary lifespan perspective (Zacher et al., 2018), it is surprising that no measure of this construct has been de-veloped yet. In two consecutive studies in 2006 and 2007, Robson and his colleagues conceptualized tentative criteria for successful aging in the workplace and developed an inventory for measuring them (Robson & Hansson, 2007; Robson, Hansson, Abalos, & Booth, 2006). Zacher & Ru-dolph (2017) criticized this model for neglecting the con-textual factors and work outcomes by focusing entirely on person factors (behavioral strategies). In addition, Zacher & Rudolph (2017) concluded that because the behavioral strategies suggested by Robson et al. (Robson & Hansson, 2007; Robson et al., 2006) do not interact with age, these strategies cannot be considered successful aging strategies. Most recently, Kooij and colleagues acknowledged the difficulty of operationalizing and, thus, measuring the con-struct SAW (Kooij et al., 2019).
As with Zacher (2015a), we understand SAW as a pro-cess of multidimensional intra-individual growth, which is age related, associated with various subjective and ob-jective criteria, and may be facilitated (or constrained) by multilevel factors. Based on Zacher’s (2015a) definition of SAW and the framework of AAW factors by Zacher et al. (2018), the purpose of our study is to extend the knowledge of SAW by: (a) operationalizing important facets of the construct SAW and (b) creating a single measure of SAW. We focus on the individual experiences and outcomes of SAW, as well as on both person and environmental anteced-ents of SAW in organizational context. We also consider the potential interactions of these factors with workers’ age (cf. Zacher et al., 2015a, 2018). We test the psychometric properties of the new measure in three consecutive MTurk samples and suggest directions for future research.
Operationalizing Successful Aging at WorkEmployees’ experiences of SAW. The impacts of
age-related changes on work behaviors and outcomes (es-pecially in late career) are extensively documented. The nature and extent of age-related changes may vary signifi-cantly across individuals due to differences in person and environmental factors. These changes (e.g., in workers’ cognitive abilities, personality, and motivation) are likely to reflect various developmental losses and gains across the working life cycle (Kanfer & Ackerman, 2004; Warr, 2001). Recently, the number of studies focused on the pos-itive (i.e., developmental gains) as opposed to loss-related (i.e., developmental declines) aspects of the aging process has increased. For example, in a qualitative study with 37 older workers (aged 55 years and over) from two countries (Bulgaria and United Kingdom) and two industrial sectors (healthcare and information and communication technolo-gies), Taneva, Arnold and Nicolson (2016) found that late
career workers are well aware of how age-related changes may affect their work life and outcomes. Importantly, work-ers associate some of these changes (e.g., increased knowl-edge and experience, enhanced social and emotional experi-ence) with their personal and professional development and, ultimately, with improved work outcomes. Thus, workers’ perceptions of positive age-related changes (developmental gains; cf. Kanfer & Ackerman, 2004) are likely to indicate workers’ experiences of SAW.
In Taneva et al.’s (2016) study, along with their per-ceptions of increased knowledge and experience, (older) workers communicated perceptions of other areas of per-sonal and professional growth, among which increased self-awareness and confidence, improved social skills, emotion regulation, ability to solve complex problems, and general adaptation to contextual changes. These findings, extracted from workers’ narratives, correspond with the outcomes of earlier research in the lifespan tradition (e.g., Carstensen et al., 2011; Kanfer & Ackerman, 2004). We suggest that workers’ conceptualizations of positive in-tra-individual changes may shape an important domain of the construct SAW.
Personal and organizational strategies for SAW. From a lifespan theory perspective, aging is a proactive process of adaptation, driven by self-regulation in the form of life management strategies that individuals apply in or-der to deal with age-related changes (e.g., loss, gain, and/or reorganization of resources) in themselves as well as changes in their environment (Kanfer & Ackerman, 2004). The selective optimization with compensation (SOC) model (Baltes & Baltes, 1990) proposes that individuals are likely to use strategies that fall into three categories of self-regula-tion processes (selection, optimization, and compensation) in their attempts to adapt to both age-related changes and changes in their environment. These proactive behaviors become more important with increased age and can be par-ticularly useful in the workplace. Starting with the pioneer-ing work of Abraham and Hansson (1995), a plethora of studies has demonstrated the positive effects of SOC strate-gies on (older) workers’ well-being and performance (e.g., Moghimi, Scheibe, & Freund, 2019; Moghimi, Zacher, Sh-reible, & Van Yperen, 2017). Thus, SOC strategies may be an effective mechanism for achieving SAW.
Combining the advantages of the job design and lifespan theories, Truxillo, Cadiz, Rineer, Zaniboni, and Fraccaroli, (2012) proposed potential age-related effects of three subgroups of job characteristics (task, knowledge, and social) on work engagement, job satisfaction, and job per-formance. For example, they suggested that due to intra-in-dividual age-related changes, some job characteristics such as job autonomy, task significance, skill variety, and social support may be preferred by older (compared to younger) workers and, therefore, facilitate positive work outcomes particularly in late career. Among others, Zacher et al. (2018)

Personnel Assessment And decisions
512020 • Issue 1 • 49-62 http://scholarworks.bgsu.edu/pad/
MeasureMent and Measures
emphasized the importance of job autonomy, social embed-dedness, and sense of meaning for aging workers. There-fore, allowing opportunities for higher job autonomy, task significance, skill variety, and social support may foster SAW across the lifespan (see also Cadiz, Rineer, & Truxil-lo, 2019).
Both formal (e.g., Strategic Human Resource Manage-ment) and informal (e.g., i-deals between employees and their supervisors) human resource management (HRM) approaches are shown to be important for supporting work-ers’ well-being and performance (Bal, 2015; Kooij, Jansen, Dikkers, & De Lange, 2014). Some formal HRM practices (also referred to as “age-friendly,” cf. Zacher et al., 2018) are viewed as having desirable effects especially for older workers. Kooij et al. (2014) conceptualized four bundles of HRM practices for aging workers, and among these are maintenance and development practices. Taneva and Arnold (2018) reported that a specific combination between some maintenance and development HRM practices predicted experiences of high work well-being (thriving at work) and high job performance in a large sample of older workers in the United Kingdom. These practices, most valued by the older workers, refer to access to training, recognition and respect, meaningful assignments, feedback from the super-visor, flexible working, and opportunities to work longer. In addition, there is considerable evidence about the value of informal work arrangements and the role of supervisors in late career. For example, Bal (2015) concluded that “in-dividualization of career arrangements will be increasingly important in the sustainability of contemporary careers” (Bal, 2015, p. 1). Based on this evidence, we suggest that workers’ access to a combination of certain HRM practices with informal work agreements (i-deals) may be instrumen-tal for achieving SAW in organizations.
Outcomes of Successful Aging at WorkTheoretically, SAW has been positively associated
with various individual-level work outcomes, among which work motivation, job performance, health, and well-being (Zacher, 2015a). So far, only a few studies have provided empirical support for some of these associations. For exam-ple, Taneva and Arnold (2018) reported three pathways to SAW in organizations that demonstrate the role of personal (SOC) and organizational (HRM) strategies for achieving high job performance. Moreover, they found that employ-ees’ psychological well-being mediated the relationships of personal and organizational strategies with self-rated job performance (task proactivity, extra- and in-role per-formance). Therefore, workers’ well-being is an important and, perhaps more direct (compared to job performance), outcome of SAW.
Thriving at work is described as “the joint sense of vi-tality and learning, which communicates a sense of progress or forward movement in one’s self-development” (Spreitzer,
Sutcliffe, Dutton, Sonenshein, & Grant, 2005, p. 538). Ex-periences of thriving at work can be driven by both person and organizational factors (Spreizer, Porath, & Gibson, 2012). Thriving at work is positively related to outcomes such as high job and career role performance, positive work behaviors, work-related, and overall well-being (Porath, Spreitzer, Gibson, & Garnett, 2012). Two studies by Tane-va and colleagues (Taneva et al., 2016; Taneva & Arnold, 2018) demonstrated that high levels of thriving at work are also common among older workers. Hence, experiences of thriving at work can happen at all career stages. Moreover, thriving at work can be viewed as both a form of psycho-logical well-being (cf. Spreitzer et al., 2005; Warr, 2007) and a criterion for SAW (Taneva & Arnold, 2018).
As opposed to thriving, the emerging construct of sur-viving at work is described as the individual’s tendency to preserve one’s mental and physical resources by limiting one’s work activities and perspectives to cope with work conditions that are perceived as highly demanding (Taneva et al., 2016). Such a preservation experience may indicate reduced levels or lack of SAW. However, Taneva and Ar-nold (2018) discovered that, at least in some circumstances, experiences of surviving at work may be indeed a sign of sustained person–environment fit and, ultimately, of SAW. This is also in line with Kooij’s definition of SAW as sustainable maintenance (Kooij, 2015) and the definition of AAW by Zacker and colleagues (Zacher et al., 2018). Hence, surviving at work may be another indicator of SAW.
Furthermore, as outlined in the previous sections, in-dividuals’ experiences of SAW can be enhanced using per-sonal (e.g., SOC) or organizational (e.g., HRM, i-deals, and job design) strategies that facilitate the regulation of one’s resources. The concept of work ability (WA) describes the balance (fit) between work and personal resources (Tuomi, Ilmarinen, Jahkola, Katajarinne, & Tulkki, 1998). Recent lifespan research has demonstrated that certain work (e.g., job control, feedback, and social support) and person (e.g., proactive behaviors) characteristics can support the mainte-nance and even the increase of WA, especially in late career (e.g., Weigl, Müller, Hornung, Zacher, & Angerer, 2013). In this context, it has been suggested that WA may be a useful criterion for SAW in late career (and beyond) (Kooij, 2015; Weigl et al., 2013).
METHOD
ParticipantsWe used three consecutive samples of overall 417
MTurk workers based in the United States (see Table 1) to pilot and validate our projected scale. We screened all responses for inattention with an instructive item (“Please, respond to this item with strongly disagree”) and for speed-iness by requiring that respondents spent a minimum time of four seconds times the number of items in their survey.

522020 • Issue 1 • 49-62Published By ScholarWorks@BGSU, 2020
Personnel Assessment And decisions develoPing A sAW scAle
In line with previous theoretical conceptualizations that SAW refers to workers of all ages and career stages (cf. Zacher et al., 2018), we suggest that SAW can be explored and validated as a construct with workers at all career stag-es. However, for this study using MTurk samples, we set the minimal age for participation to 30, anticipating that workers with longer work experience would be more like-ly to provide valid responses regarding their perceptions of SAW. In our pilot and calibration samples we strived to collect equal numbers of respondents in the age groups of 30–49 years and 50 years and over, so that we could explore potential differences between mid- and late-career groups.
MeasuresWe used adapted versions of six established measures:
SOC strategies (Freund & Baltes, 2002), five subscales from the Work Design Questionnaire (Morgeson & Hum-phrey, 2006), Age-friendly HR practices (Taneva & Arnold, 2018), Thriving at Work (Porath et al., 2012), Surviving at Work (Taneva & Arnold, 2018), and the Work Ability Index (Tuomi et al., 1998). The first three measures refer to con-structs similar to aspects of SAW as operationalized in the current paper and were used for evaluating the convergent validity of the new instrument. The last three measures are associated with outcomes of SAW and served for evaluating the SAW scale’s criterion-related validity. Table 2 provides
Sample characteristicsSamples
Prepilot Pilot Calibration
Number of administered items 58 67 45
Initial sample size 80 263 188
Sample size after cleaning 68 223 126
Age 58 (SD = 6.0) 44.7 (SD = 11.5) 46.1 (SD = 11.1)
Percent female 59% 58% 45%
Percent White 79% 81% 86%
Tenure at current organization - 8.3 (SD = 6.5) 9.8 (SD = 8.0)
TABLE 1.Demographic Characteristics of Collected Samples
Measure Authors Variables No. Items Rating scale
Thriving at WorkPorath, Spreitzer, Gibson & Garnett (2012)
Thriving at work (energy and learning) 10 7-pt. strongly disagree to
strongly agree
Surviving at Work Taneva & Arnold (2018) Surviving at work 3 5-pt. strongly disagree to
strongly agree
Age-Friendly HR Practices
Taneva & Arnold (2018) Age-friendly practices (set of eight) 8 5-pt. strongly disagree to
strongly agree
SOC Strategies Freund & Baltes (2002)
Selection, optimization and compensation strategies 12 4-pt. a little to exactly
Work Ability Index Tuomi et al. (1998) Work ability 110-pt. completely unable to work to overall capacity at its best
The Work Design Questionnaire (subscales)
Morgeson & Humphrey (2006)
Autonomy, task significance, skill variety, social support, feedback from others
14 5-pt. strongly disagree to strongly agree
TABLE 2.Validation Scales

Personnel Assessment And decisions
532020 • Issue 1 • 49-62 http://scholarworks.bgsu.edu/pad/
MeasureMent and Measures
more information on these measures. We also collected data about participants’ chronological age, gender, and organiza-tional tenure via single items for each of these variables.
ProcedureGuided by Boateng, Neilands, Fronillo, Melgar-Qui-
nonez, and Young’s (2018) recommendations of best prac-tices for scale development and validation, we worked through three main phases: item development, scale devel-opment, and scale evaluation. We outline the item develop-ment in this section, and in the Results section we outline the scale development and evaluation.
Item development. In line with the discussion in the previous sections of this paper, we identified three pri-mary domains of the construct SAW: (a) experiences (of SAW), (b) personal, and (c) organizational strategies (for SAW). We used a combination of deductive and inductive approaches to generate an initial pool of 58 items. Most of the items were based on a review of the recently published lifespan literature on SAW. Where possible, we focused especially on the results of qualitative studies with older workers (e.g., Taneva et al., 2016). Workers’ own interpre-tations of SAW are perhaps the best example of how SAW is understood and communicated in nonacademic terms. Hence, they can be a valuable source of items for measur-ing this construct and a prerequisite of high content validity.
In 2018, we used the online surveying platform Qual-trics to collect three samples of Mturk respondents: a prep-ilot, pilot, and calibration sample. Because in the literature published up-to date the construct SAW is most often asso-ciated with older workers (e.g., Robson et al., 2006; 2007), in our prepilot sample we included only participants aged 50 years and over. In the pre-pilot sample, we included the initially developed 58 items and the validation scales (Table 2). Based on reliability coefficients (alphas of Cronbach), item-total correlations (ITCs), and item-level correlations with the validation scales, we found preliminary support for the three conceptual domains.
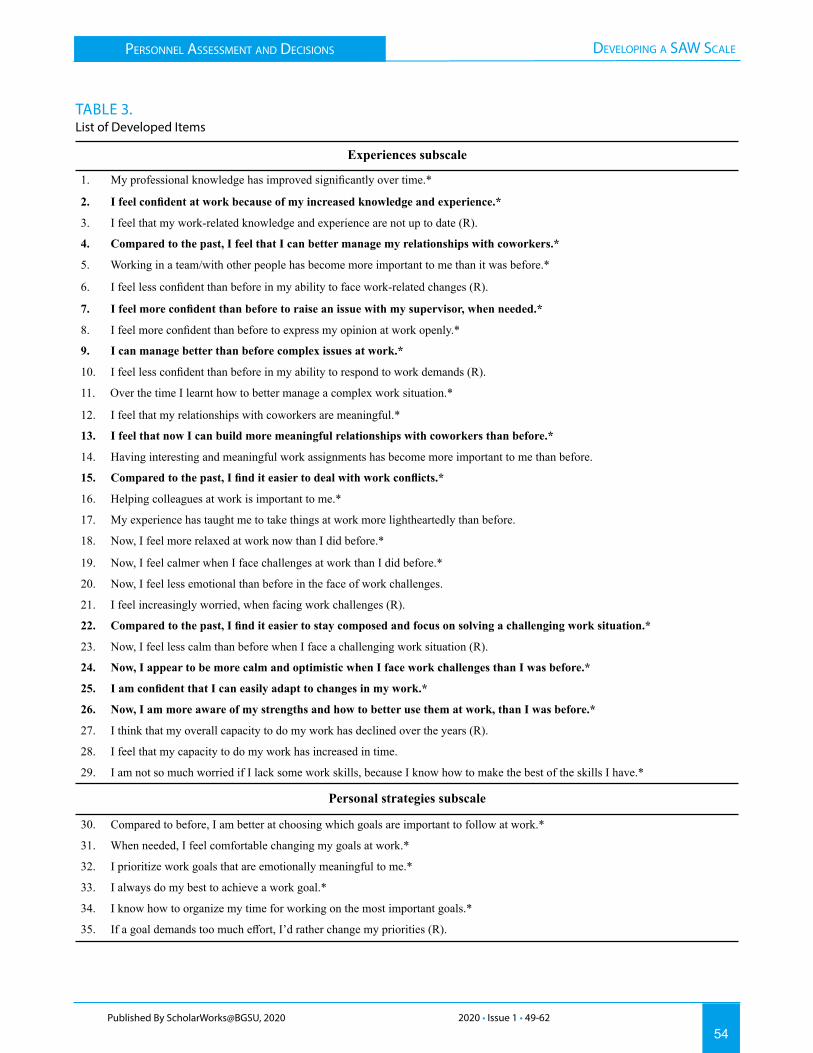
To further evaluate the content validity of the initial item pool, we consulted an external expert on lifespan development and SAW. We provided the expert with op-erational definitions of each domain and asked him/her to evaluate each item from the initial pool with regard to its relevance to the domains. We compared the results of the expert evaluation with our own version. The two versions largely overlapped, and there were also suggestions for ad-ditional items. Considering the expert’s recommendations, we added nine items to the initial pool, thus bringing it up to 67 items (Table 3).
We used the 67 items for all subsequent analyses. In the pilot study we administered the items and explored each item’s ITC with its suggested subscale. For the calibration sample we conducted series of exploratory factor analyses (EFA) with principal-axis factoring and Oblimin rotation.
We used parallel analyses (Horn, 1965), and Velicer’s (1976) very simple solution (VSS) criterion to determine the number of latent factors to extract. This is because Cat-tell’s (1966) scree test and the eigenvalue greater than 1 rule are less reliable criteria (Ruscio & Roche, 2012). We did this for each subscale separately, dropped items to make the subscales unidimensional, and then did an EFA across all retained items. All analyses were conducted with the packages psych (Revelle, 2019) and paran (Dinno & Dinno, 2018) in an R programming environment.
After establishing the reliability of the scale, we pro-vided proof of its construct validity via relationships with established scales measuring similar constructs (convergent validity) and group comparisons (differentiation of known groups; cf. Boateng et al., 2018). We also evaluated the instrument’s criterion-related validity with respect to three outcomes of SAW.
RESULTS
Scale DevelopmentBased on the pilot data, we eliminated items with low
ITCs, as well as items with duplicating content (columns ICC and Decision in Table 4). This brought the 67 items to 45. Both parallel analyses and the VSS criterion indicated 2, 1, and 2 factors to extract from Experiences, Personal, and Organizational Strategies. We had to remove three items loading strongly or negatively on the secondary extracted factors (items 5 and 29 from Experiences, and item 53 from Organizational Strategies) to eliminate these redundant fac-tors. The Loadings 1 columns in Table 4 presents the pat-tern matrix loadings before removing the items, whereas the Loadings 2 columns after the removal. Then, another round of parallel and VSS analyses confirmed both subscales’ uni-dimensionality.
When the three subscales were entered simultaneously (columns Loadings 3), the Personal Strategies items loaded mostly on the same factor as the Experiences items. Based on Personal Strategies’ mixed pattern loadings, we dropped the Personal Strategies subscale and pursued only the Ex-periences and Organizational Strategies (which we renamed to Strategies) subscales. We conducted an EFA only on Ex-periences and Strategies (Loadings 4) and removed items (column Final Decision in Table 4) that loaded strongly on the wrong factor (items 8 and 64), had low loadings (items 1, 16, and 54), cross-loaded (item 52), or repeated an item with better psychometric properties (items 11, 12, 18, 19, 47, and 67). Item 7 cross-loaded but we kept it be-cause of content validity concerns, whereas items 2 and 25 had somewhat lower loadings and low secondary factor loadings, but we also kept them for the same reason. The columns Final Loadings present the final pattern matrix of the Experiences and (Organizational) Strategies scales. This final solution indicated that Experiences explained 22% and
542020 • Issue 1 • 49-62Published By ScholarWorks@BGSU, 2020
Personnel Assessment And decisions develoPing A sAW scAle
Experiences subscale
1. My professional knowledge has improved significantly over time.*
2. I feel confident at work because of my increased knowledge and experience.*
3. I feel that my work-related knowledge and experience are not up to date (R).
4. Compared to the past, I feel that I can better manage my relationships with coworkers.*
5. Working in a team/with other people has become more important to me than it was before.*
6. I feel less confident than before in my ability to face work-related changes (R).
7. I feel more confident than before to raise an issue with my supervisor, when needed.*
8. I feel more confident than before to express my opinion at work openly.*
9. I can manage better than before complex issues at work.*
10. I feel less confident than before in my ability to respond to work demands (R).
11. Over the time I learnt how to better manage a complex work situation.*
12. I feel that my relationships with coworkers are meaningful.*
13. I feel that now I can build more meaningful relationships with coworkers than before.*
14. Having interesting and meaningful work assignments has become more important to me than before.
15. Compared to the past, I find it easier to deal with work conflicts.*
16. Helping colleagues at work is important to me.*
17. My experience has taught me to take things at work more lightheartedly than before.
18. Now, I feel more relaxed at work now than I did before.*
19. Now, I feel calmer when I face challenges at work than I did before.*
20. Now, I feel less emotional than before in the face of work challenges.
21. I feel increasingly worried, when facing work challenges (R).
22. Compared to the past, I find it easier to stay composed and focus on solving a challenging work situation.*
23. Now, I feel less calm than before when I face a challenging work situation (R).
24. Now, I appear to be more calm and optimistic when I face work challenges than I was before.*
25. I am confident that I can easily adapt to changes in my work.*
26. Now, I am more aware of my strengths and how to better use them at work, than I was before.*
27. I think that my overall capacity to do my work has declined over the years (R).
28. I feel that my capacity to do my work has increased in time.
29. I am not so much worried if I lack some work skills, because I know how to make the best of the skills I have.*
Personal strategies subscale
30. Compared to before, I am better at choosing which goals are important to follow at work.*
31. When needed, I feel comfortable changing my goals at work.*
32. I prioritize work goals that are emotionally meaningful to me.*
33. I always do my best to achieve a work goal.*
34. I know how to organize my time for working on the most important goals.*
35. If a goal demands too much effort, I’d rather change my priorities (R).
TABLE 3.List of Developed Items

Personnel Assessment And decisions
552020 • Issue 1 • 49-62 http://scholarworks.bgsu.edu/pad/
MeasureMent and Measures
Strategies 26% of the total variance, and the two latent fac-tors correlated at .66 (p < .01).
Scale EvaluationTable 5 presents the descriptive statistics and intercor-
relations of the Experiences and Strategies subscales, the demographic variables, and the validation measures used for establishing our scale’s construct (convergent) and crite-rion-related (concurrent) validity.
The correlations of SAW’s total score with the HRM
36. I am actively looking to learn new skills that will help me achieve my goals.*
37. I have learned to split my work better between myself and my coworkers.*
38. Now I need to put more effort in completing the same tasks as before.
39. Now I try to use technologies and tools that will make my work easier.
40. When needed, I change parts of my job, so that I can use my skills best.*
41. Sometimes, if I can’t change my work tasks, I try to change the way I think about them.*
42. If I feel that my work is too difficult, I try to change the way the work is done.
43. I do not have enough opportunities to change the way I do my work. (R)
Organizational strategies subscale
44. When I need to, I can take additional or unpaid leave.
45. I have access to suitable training for updating my work skills.*
46. I feel that I don’t have good enough opportunities for learning new skills at work (R).
47. My organization encourages me to never stop learning.*
48. My organization provides me with opportunities to keep my work skills up to date.*
49. I feel recognized and respected at work.*
50. I feel confident that I can stay with this organization for as long as I’d like.*
51. I have a lot of flexibility at work.*
52. I often work on challenging and meaningful tasks.*
53. My work has significance for society and the life of others.*
54. My work involves learning new things.*
55. My work does not involve much variety (R).
56. I can always rely on prompt and helpful feedback from my supervisor.*
57. My supervisor helps me to improve my work.
58. I am free to decide how to do my job.*
59. I don’t have the freedom to do my work as I desire (R).
60. I have a great deal of autonomy at work.
61. My work involves meeting and getting to know a lot of people.
62. I get support and understanding from my coworkers.
63. I get support and understanding from my supervisor.*
64. My work team is one of the best things about my job.*
65. My organization is open to negotiating personalized work arrangements with employees.*
66. In my organization, supervisors are flexible with the needs of their employees.*
67. If necessary, I can negotiate with my supervisor special work arrangements that fit my skills and circumstances.*
Note. Items with asterisks (*) included in the calibration sample, items in bold retained in the final version of the scale.
TABLE 3. (CONT.)

562020 • Issue 1 • 49-62Published By ScholarWorks@BGSU, 2020
Personnel Assessment And decisions develoPing A sAW scAle
Pilo
t stu
dyC
alib
ratio
n st
udy
Alp
has
Item
ICC
Pilo
t de
cisi
onIC
CL
oadi
ngs 1
Loa
ding
s 2L
oadi
ngs 3
Loa
ding
s 4Fi
nal
deci
sion
Fina
l lo
adin
gs
Exp
1E
xp2
PSO
S1O
S2E
xpPS
OS
Exp
OS
Exp
OS/
SE
xpO
S/S
item
1.5
4
.54
.53
.05
.57
.55
.07
.48
.13
drop
-l
item
2.6
2
.61
.66
-.02
.64
.54
.15
.51
.18
keep
-c.5
4.1
6
item
3.2
7dr
op
item
4.6
6
.69
.41
.39
.71
.69
.01
.73
-.04
keep
.69
.01
item
5.4
0
.51
-.04
.72
item
6.4
0dr
op
item
7.5
2
.59
.60
.03
.62
.26
.46
.30
.43
keep
-c.3
3.3
9
item
8.5
9
.60
.61
.03
.63
.23
.50
.28
.46
drop
-w
item
9.6
6
.65
.73
-.04
.68
.77
-.10
.74
-.08
keep
.7
5-.0
7
item
10
.44
drop
item
11
.58
.5
7.6
0.0
0.5
9.7
0-.1
0.6
4-.0
6dr
op-r
item
12
.54
.6
3-.0
3.8
6.6
2.4
9.1
8.5
3.1
5dr
op-r
item
13
.65
.6
9.1
9.6
6.6
8.5
4.1
7.6
1.1
0ke
ep.5
6.1
4
item
14
.42
drop
item
15
.68
.6
9.7
2.0
1.7
2.5
9.1
2.6
6.0
7ke
ep.6
8.0
7
item
16
.49
.5
1.0
5.6
0.5
2.5
2.0
5.5
0.0
6dr
op-l
item
17
.53
drop
item
18
.69
.7
1.7
3.0
4.7
5.5
7.1
9.6
4.1
3dr
op-r
item
19
.76
.7
4.7
7.0
3.7
8.6
3.1
5.7
0.1
0dr
op-r
item
20
.57
drop
item
21
.46
drop
item
22
.61
.6
6.6
5.0
6.6
9.6
8-.0
1.7
4-.0
6ke
ep.7
3-.0
4
item
23
.48
drop
item
24
.73
.7
4.6
6.1
5.7
7.7
5.0
1.8
1-.0
5ke
ep
.76
.01
item
25
.64
.5
8.6
6-.0
4.6
1.5
4.1
2.5
2.1
3ke
ep-c
.55
.11
item
26
.62
.6
0.7
3-.1
1.6
2.7
7-.1
4.6
9-.0
9ke
ep.6
7-.0
8
item
27
.32
drop
item
28
.56
drop
item
29
.41
.3
0.4
7-.1
8
Experiences (initial alpha on all items = .93; final alpha = .89)
TABL
E 4.
Item
Ana
lyse
s

Personnel Assessment And decisions
572020 • Issue 1 • 49-62 http://scholarworks.bgsu.edu/pad/
MeasureMent and Measures
Pilo
t stu
dyC
alib
ratio
n st
udy
Alp
has
Item
ICC
Pilo
t de
cisi
onIC
CL
oadi
ngs 1
Loa
ding
s 2L
oadi
ngs 3
Loa
ding
s 4Fi
nal
deci
sion
Fina
l lo
adin
gs
Exp
1E
xp2
PSO
S1O
S2E
xpPS
OS
Exp
OS
Exp
OS/
SE
xpO
S/S
item
30
.52
.5
5.6
3.6
3.5
7.0
4
item
31
.57
.4
9.5
4.5
4.1
3.4
8
item
32
.41
.4
6.5
0.5
0.3
3.1
6
item
33
.42
.4
7.5
5.5
5.5
6-.0
1
item
34
.45
.4
9.5
7.5
7.6
2-.0
2
item
35
.04
drop
item
36
.53
.4
9.5
6.5
6.4
1.1
9
item
37
.29
.4
5.5
7.5
7.2
5.3
0
item
38
-.09
drop
item
39
.38
drop
item
40
.51
.5
5.6
1.6
1.2
0.4
6
item
41
.57
.5
2.5
9.5
9.5
4.0
0
item
42
.14
drop
item
43
.36
drop
item
44
.45
drop
item
45
.67
.6
5.3
6.3
9.6
8.0
8.6
1.0
7.6
1ke
ep.1
0.0
59
item
46
.60
drop
item
47
.74
.7
0.2
8.5
4.7
2.2
3.5
3.2
1.5
6dr
op-r
item
48
.75
.7
2.4
1.4
2.7
5.0
2.7
2.0
0.7
4ke
ep.0
0.7
3
item
49
.76
.7
2.5
5.2
6.7
5.1
9.6
1.2
0.6
1ke
ep.1
9.6
0
item
50
.67
.6
4.4
5.2
8.6
6.1
2.5
7.1
4.5
6ke
ep.1
4.5
6
item
51
.62
.6
3.7
3-.0
3.6
7-.0
9.7
4-.0
9.7
4ke
ep-.0
4.7
2
item
52
.62
.6
5.1
0.6
7.6
4.3
4.3
8.3
2.3
9dr
op-c
item
53
.46
.4
7-.1
5.7
6
item
54
.54
.5
8.0
0.7
1.5
7.1
7.4
3.1
4.4
6dr
op-l
item
55
.42
drop
item
56
.65
.66
.66
.08
.70
0.08
0.64
0.10
0.63
keep
0.11
0.65
item
57
.56
drop
item
58
.60
.55
.57
.04
.58
-0.0
60.
65-0
.06
0.64
keep
-0.0
10.
60
Personal strategies (initial alpha on all items = .72; No final alpha)
TABL
E 4.
(CO
NT.
)
Organizational strategies/strategies (initial alpha on all items = .93; final alpha = .91)

582020 • Issue 1 • 49-62Published By ScholarWorks@BGSU, 2020
Personnel Assessment And decisions develoPing A sAW scAle
Pilo
t stu
dyC
alib
ratio
n st
udy
Alp
has
Item
ICC
Pilo
t de
cisi
onIC
CL
oadi
ngs 1
Loa
ding
s 2L
oadi
ngs 3
Loa
ding
s 4Fi
nal
deci
sion
Fina
l lo
adin
gs
Exp
1E
xp2
PSO
S1O
S2E
xpPS
OS
Exp
OS
Exp
OS/
SE
xpO
S/S
item
59
.48
drop
item
60
.49
drop
.65
item
61
.25
drop
item
62
.65
drop
.70
item
63
.70
.7
2.7
1
.6
7.1
3.7
50.
020.
730.
020.
74ke
ep0.
040.
74
item
64
.47
.7
2.5
4
.0
8.5
6.5
30.
440.
210.
490.
18dr
op-w
item
65
.59
.6
4.6
2
.7
2-.0
4.6
6-0
.11
0.76
-0.0
90.
73ke
ep-0
.04
0.69
item
66
.72
.6
3.7
4
.8
6-.0
5.7
8-0
.10
0.85
-0.0
80.
85ke
ep-0
.10
0.88
item
67
.65
.5
5.6
9
.8
3-.0
7.7
30.
040.
730.
030.
73dr
op-r
Not
e. IC
C =
item
-tota
l cor
rela
tion;
Exp
= E
xper
ienc
es; P
S =
Pers
onal
stra
tegi
es; O
S =
Org
aniz
atio
nal s
trate
gies
; S =
Stra
tegi
es; d
rop-
r = d
rop
beca
use
repe
titiv
e; d
rop-
w
= dr
op b
ecau
se lo
ads
on th
e w
rong
fact
or; d
rop-
l = d
rop
beca
use
low
load
ing(
s); d
rop-
c =
drop
bec
ause
cro
ss-lo
adin
g; k
eep
= ke
ep; k
eep-
c =
keep
for c
onst
ruct
-cov
erag
e re
ason
s.
TABL
E 4.
(CO
NT.
)
Organizational strategies/strategies (initial alpha on all items = .93; final alpha = .91)
practices, the four SOC strategies, and the five job charac-teristics subscales were significant and of moderate (e.g., Task Significance, Skill Variety) to strong size (e.g., HRM practices, SOC, Autonomy). These positive relationships support the convergent validity of the SAW scale.
Regarding the differentiation of known groups (another aspect of construct validity), we tested for differences by age, gender, and organizational tenure. Two independent samples t-tests for age split into categories of 30–49 and above 50 years of age did not result in significant effects for Experiences (t(347) = -1.00, p = .32) or Strategies (t(347) = -.89, p = .38). In addition, series of independent samples t-tests uncovered no significant gender differences in both subscales and the validation scales. Last but not least, in Ta-ble 5 organizational tenure relates significantly only to age, indicating that the older (compared to younger) employees have longer organizational tenure. The lack of significant relationship of organizational tenure with SAW shows that organizational tenure might not relate to SAW and its no-mological network of constructs.
Finally, our scale correlated positively with the Thriv-ing at Work and WA scales, which provides criterion valid-ity evidence. However, the other scale, which we interpret as a criterion for SAW—Surviving at Work—did not relate significantly to the SAW scale score.
DISCUSSION
We developed and established the psychometric prop-erties of the first single measure for SAW in the contem-porary meaning of this construct (cf. Zacher, 2015a). We view SAW as a developmental process that may occur at all career stages and can be captured through individual-level outcomes such as improved WA and well-being. We oper-ationalized the construct SAW through two clusters of em-ployees’ perceptions: (a) individuals’ psychological expe-riences of age-related growth in the workplace (SAW), and (b) Strategies for achieving SAW. Experiences of growth may refer to various areas of perceived age-related positive changes, among which are improved knowledge and expe-rience, social skills, emotion regulation, and adaptability in work-related situations (cf. Taneva et al., 2016). Strate-gies (or facilitators) for SAW may include both employee (e.g., proactive self-regulation) and organizational (e.g., job design, formal HRM and informal work arrangements) be-haviors (cf. Bal, 2015; Baltes & Baltes, 1990; Kooij et al., 2014; Taneva et al., 2016; Truxillo et al., 2012).
Subsequent empirical analysis with data from three consecutive MTurk samples with overall 417 workers in or-ganizational setting revealed that the employees’ experienc-es of SAW largely overlapped with the employees’ percep-

Personnel Assessment And decisions
592020 • Issue 1 • 49-62 http://scholarworks.bgsu.edu/pad/
MeasureMent and Measures
Varia
ble
1.2.
3.4.
5.6.
7.8.
9.10
.11
.12
.13
.14
.15
.16
.17
.18
.19
.
1.To
tal s
core
.93
2. E
xper
ienc
es.8
9**
.89
3. S
trate
gies
.94*
*.6
7**
.91
4. T
hriv
ing
at w
ork
.72*
*.6
6**
.65*
*.9
3
5. S
urvi
ving
at w
ork
-.12
-.07
-.14
-.27*
*.7
3
6. H
RM
pra
ctic
es.7
4**
.52*
*.8
0**
.69*
*-.2
3*.8
8
7. S
OC
ele
ctiv
e se
lect
ion
.35*
*.4
2**
.25*
*.3
2**
.22*
.23*
*.7
3
8. S
OC
loss
-bas
ed se
lect
ion
.22*
.32*
*.1
2.2
2*.1
2.1
7.5
3**
.61
9. S
OC
com
pens
atio
n.4
6**
.54*
*.3
3**
.50*
*-.1
0.4
0**
.51*
*.3
8**
.86
10. S
OC
opt
imiz
atio
n.4
2**
.47*
*.3
2**
.44*
*-.0
7.3
4**
.42*
*.4
6**
.58*
*.5
9
11. S
OC
(tot
al)
.47*
*.5
6**
.33*
*.4
7**
.06
.36*
*.8
0**
.76*
*.7
8**
.78*
*.8
5
12. W
ork
abili
ty.3
0**
.23*
*.3
1**
.41*
*-.3
0**
.22*
.00
-.03
.25*
*.2
3**
.14
-
13. A
uton
omy
.74*
*.5
4**
.78*
*.5
6**
-.07
.68*
*.2
2*.1
2.3
0**
.26*
*.2
9**
.31*
*.8
5
14. T
ask
sign
ifica
nce
.50*
*.3
7**
.52*
*.4
1**
-.11
.55*
*.1
1.0
9.3
0**
.31*
*.2
5**
.06
.47*
*.8
0
15. S
kill
varie
ty.5
8**
.46*
*.5
9**
.49*
*-.1
0.5
1**
.12
-.01
.22*
.24*
*.1
8*.2
4**
.70*
*.4
7**
.84
16. S
ocia
l sup
port
.77*
*.6
5**
.74*
*.5
2**
-.17
.69*
*.2
4**
.11
.31*
*.3
5**
.32*
*.2
2*.5
8**
.52*
*.5
2**
.71
17. F
eedb
ack
from
oth
ers
.76*
*.5
8**
.78*
*.5
9**
-.20*
.74*
*.2
8**
.17
.32*
*.3
2**
.35*
*.1
9*.6
4**
.51*
*.4
5**
.72*
*.8
5
18. A
ge.0
7.0
90.
04.0
7.0
2.0
9.0
6.1
3.0
7.1
1.1
2-.0
2-.0
0.0
9.0
7.0
3.0
7-
19. O
rgan
izat
iona
l ten
ure
.06
.05
.07
-.03
.16
.04
.06
.12
.09
.08
.12
-.10
.00
.06
.06
-.05
.02
.43*
*-
Mea
n4.
003.
953.
745.
303.
153.
432.
572.
433.
132.
762.
728.
333.
733.
524.
033.
653.
6145
.28.
85
SD.6
3.6
1.7
81.
20.9
5.8
6.6
8.6
6.6
4.6
1.5
11.
33.9
21.
08.8
9.8
41.
0211
.35
7.11
Not
e. *
p <
.05;
**p
< .0
1. V
alue
s on
the
diag
onal
are
the
inte
rnal
con
sist
ency
coe
ffici
ents
(Cro
nbac
h’s a
lpha
s).
TABL
E 5.
Des
crip
tive
Stat
istic
s an
d In
ter-
Corr
elat
ions
with
Val
idat
ion
Scal
es

602020 • Issue 1 • 49-62Published By ScholarWorks@BGSU, 2020
Personnel Assessment And decisions develoPing A sAW scAle
tions of individual-level facilitators of SAW (i.e., personal strategies). A potential explanation may be that SAW could be also described as a process of active self-regulation, driven by the individual’s motivation to pursue person–en-vironment fit (Kooij et al., 2019). Thus, the employees’ per-ceptions of both positive age-related changes and proactive self-regulating behaviors (personal strategies) may reflect the construct SAW in the sense of perceived age-related growth (cf. Taneva et al., 2016).
Furthermore, we examined the construct and criteri-on-related validity of the new scale by exploring the associ-ations of the SAW scale’s total score with the scores of six established measures of personal (SOC) and organizational (job design, formal HRM) strategies, as well as subjective criteria for SAW (WA, thriving and surviving at work). The empirical analyses confirmed all anticipated relationships, apart from the association between the SAW score and the Surviving at Work score, which appeared to be lacking sta-tistical significance. This may be because we suggested sur-viving at work as a tentative criterion for SAW. Although employees’ experiences of surviving at work may indicate maintenance of resources and thus sustained work outcomes (e.g., well-being) (cf. Kooij, 2015; Taneva & Arnold, 2018), the construct surviving at work does not imply perceived growth as it is the case with SAW in Zacher’s definition (cf. Zacher, 2015a).
Contributions to Theory and PracticeThis study contributed to theory development in sever-
al ways. First, it systemized and further conceptualized key domains of the emerging construct SAW by linking person and environmental variables. Thus, it responded to recent calls for integrating multilevel factors when examining this construct (cf. Zacher, 2015a; Zacher et al., 2018). Second, it focused on the synergies between these domains and gained new insights into how they operate together, as well as sep-arately. Third, it translated into practical terms each domain and explored its construct and criterion-related validity with regard to other, well-known constructs and demographic variables. Thus, new information about the content of each domain was found and a new measurement instrument was developed. From a practitioner point of view, this instru-ment will help training and development professionals to capture workers’ experiences and potential to age success-fully in organizations. Moreover, this scale may help work-ers in monitoring and directing their own experiences of SAW. This, in turn, may inform organizational systems and initiatives aiming at supporting SAW and therefore ensure employees’ higher work well-being and performance. In the longer term, supporting SAW from both individual and or-ganizational perspectives may help in sustaining longer and healthier working lives.
Limitations and Avenues for Future ResearchFuture research needs to provide further evidence of
the validity of the SAW scale. For example, we found a significant positive relationship of age with organizational tenure, but we did not find evidence of age-related differ-ences regarding the employees’ self-perceptions of SAW. The lack of evidence of age-related differences may be because the age characteristics of our participant groups were not specified well enough or because generally there is no clear, definitive criterion for dividing workers into “older” and “younger” (cf. Zaniboni, Kmicinska, Truxillo, Kahn, Paladino, & Fraccaroli, 2019). Also, our pilot and calibration samples did not include any participants of over 60 years of age. It may be the case that people aged 60 years and over, who stay in the workforce, experience SAW differently compared to workers at younger ages. Future research should address this issue. In addition, it is possible that various moderators play a role in workers’ aging (cf. Felicitas, Goecke, & Kunze, 2016; Zacher et al., 2018). Im-portantly, the lack of evidence of age-related differences in the employees’ self-perceptions of SAW may indicate that the measure, which we suggest, captures SAW at all career stages (cf. Zacher et al., 2018).
Furthermore, at this stage of the scale’s development we focused on several job characteristics and a small range of demographic variables. We did not collect information about those work characteristics, which may be negatively associated with SAW at some career stages (e.g., high phys-ical demands in late career), the participants’ occupations, organizations, and industrial sectors. Such information would help contextualizing and understanding better the SAW construct and measure. Also, we relied on data from MTurk workers, which may limit the generalizability of the study results (cf. Walters, Christakis, & Wright, 2018). In the future, SAW researchers should seek to collect data from workers at all career stages and various occupational/industrial/cultural settings with non-MTurk samples. This will allow comparisons between groups of workers at dif-ferent career stages/occupations/sectors/cultures. To better understand the age dimension of SAW, investigators should consider other age constructs (e.g., subjective age) in addi-tion to workers’ chronological age (cf. Felicitas et al., 2016) and follow a longitudinal approach (cf. Kooij et al., 2019). In addition, in this study we captured the associations be-tween SAW and only three work-related outcomes (i.e., WA and psychological well-being, understood as both thriving at work and surviving at work), all of which self-rated. Data regarding other work outcomes (e.g., workers’ performance, health, other forms of well-being, job attitudes, work moti-vation, expectations, etc.; cf. Zacher, 2015a) and from mul-tiple sources will be most valuable in future research with the SAW scale.

Personnel Assessment And decisions
612020 • Issue 1 • 49-62 http://scholarworks.bgsu.edu/pad/
MeasureMent and Measures
REFERENCES
Abraham, J. D., & Hansson, R. O. (1995). Successful aging at work: an applied study of selection, optimization, and compensa-tion through impression management. Journals of Geron-tology, Series B: Psychological Sciences and Social Sciences, 50, 94–103. doi:10.1093/geronb/50B.2.P94
Bal, P. (2015). Sustainable careers: enabling older workers to con-tinue working through individualized work arrangements. In A. De Vos and B. Van der Heijden, (Eds.), Handbook of research on sustainable careers (pp. 304-318). Cheltenham, UK: Edward Elgar.
Baltes, P. B., & Baltes, M. M. (1990). Psychological perspectives on successful aging: The model of selective optimization with compensation. In P. B. Baltes & M. M. Baltes. (Eds.), Successful aging: Perspectives from the behavioral scienc-es (pp. 1–34). New York, NY: Cambridge University Press. doi:10.1017/CBO9780511665684.003
Boateng, G. O., Nielands, T. B., Frongillo, E. A., Melgar-Quinonez, H. R., & Young, S. L. (2018). Best practices for developing and validating scales for health, social, and behavioral research: A primer. Frontiers of Public Health, 6, 149, doi:10.3389/fpubh.2018.00149
Cadiz, D. M., Rineer, J. R., & Truxillo, D. M. (2019). Lifespan per-spectives on job and work design. In B. B. Baltes, C. W. Ru-dolph, & H. Zacher (Eds.), Work across the lifespan (pp. 263-290). London, UK: Academic Press, Elsevier
Carstensen, L. L., Turan, B., Scheibe, S., Ram, N., Ersner-Hersh-field, H., Samanez-Larkin, G. R.,…& Nesselroade, J. R. (2011). Emotional experience improves with age: evidence based on over 10 years of experience sampling. Psychology and Aging, 26, 21–33. doi:10.1037/a0021285
Cattell, R. B. (1966). The scree test for the number of factors. Multivariate Behavioral Research, 1, 245-276. doi:10.1207/s15327906mbr0102_10
Dinno, A., & Dinno, M. A. (2018). Package “paran.” Dortmund, Germany: R package version 1.5.2
Felicitas, T., Goecke, E., & Kunze, F. (2016). The moderation role of subjective age in the chronological age/absenteeism rela-tionship in teams. Academy of Management Proceedings, (1):12970. doi:10.1080/1359432X.2018.1485651
Freund, A. M., & Baltes, P. B. (2002). Life-management strategies of selection, optimization and compensation: Measurement by self-report and construct validity. Journal of Personality and Social Psychology, 82(4), 642-662. doi:10.1037/0022-3514.82.4.642
Horn, J. L. (1965). A rationale and test for the number of factors in factor analysis. Psychometrika, 30, 179-185. doi:10.1007/BF02289447
Kanfer, R., & Ackerman, P. L. (2004). Aging, adult development, and work motivation. Academy of Management Review, 29(3), 440-458. doi:10.2307/20159053
Kooij, D. T. A. M. (2015). Successful aging at work: The active role of employees. Work, Aging and Retirement, 1(4), 309-319. doi:10.1093/workar/wav018
Kooij, D. T. A. M., Jansen, P. G. W., Dikkers, J. S. E., & De Lange, A. H. (2014). Managing aging workers: a mixed methods study on bundles of HR practices for aging workers. The International Journal of Human Resource Management, 25(15), 2192-2212. doi:10.1080/09585192.2013.872169
Kooij, D. T. A. M., Zacher, H., Wang, M., & Heckhausen, J. (2019). Successful aging at work: A process model to guide future research and practice. Industrial and Organizational Psy-chology: Perspectives on Science and Practice. Retrieved on 13.08.2019 from ResearchGate.
Moghimi, D., Scheibe, S., & Freund, A. (2019). The model of selec-tion, optimization, and compensation. In B. B. Baltes, C. W. Rudolph, & H. Zacher (Eds.), Work across the lifespan (pp. 81 – 110). London, UK: Academic Press, Elsevier. eBook ISBN: 9780128127575
Moghimi, D., Zacher, H., Scheibe, S., & Van Yperen, N. W. (2017). The selection, optimization, and compensation model in the work context: A systematic review and meta-analysis of two decades of research. Journal of Organizational Behav-ior, 38(2), 247–275. doi:10.1002/job.2108
Morgeson, F. P., & Humphrey, S. E. (2006). The Work Design Questionnaire (WDQ): Developing and validating a compre-hensive measure for assessing job design and the nature of work. Journal of Applied Psychology, 91, 1321-1339. doi:10.1037/0021-9010.91.6.1321
Olson, D., & Shultz, K. (2019). Lifespan perspectives on success-ful aging at work. In B. B. Baltes, C. W. Rudolph, & H. Zacher (Eds.), Work across the lifespan (pp. 215 – 234). London, UK: Academic Press, Elsevier. eBook ISBN: 9780128127575
Porath, C., Spreitzer, G., Gibson, C., & Garnett, F. G. (2012). Thriv-ing at work: Toward its measurement, construct validation, and theoretical refinement. Journal of Organizational Be-havior, 33(2), 250–275. doi:10.1002/job.756
Revelle, W. (2019). psych: Procedures for personality and psy-chological research. Evanston, IL: Northwestern University, Evanston. R package version 1.8.12
Robson, S. M., & Hansson, R. O. (2007). Strategic self-devel-opment for successful aging at work. International Jour-nal of Aging and Human Development, 64(4), 331-359. doi:10.2190/Q303-171U-7686-8517
Robson, S. M., Hansson, R. O., Abalos, A., & Booth, M. (2006). Successful aging: Criteria for aging well in the work-place. Journal of Career Development, 33(2), 156-177. doi:10.1177/0894845306292533
Ruscio, J., & Roche, B. (2012). Determining the number of factors to retain in an exploratory factor analysis using comparison data of a known factorial structure. Psychological Assess-ment, 24(2), 282-292. doi:10.1037/a0025697
Spreitzer, G. M., Porath, C. L., & Gibson, C. B. (2012). Toward hu-man sustainability: How to enable more thriving at work. Organizational Dynamics, 41(2), 155-162. doi:10.1016/j.org-dyn.2012.01.009
Spreitzer, G. M., Sutcliffe, K. M., Dutton, J. Sonenshein, S., & Grant, A. M. (2005). A socially embedded model of thriving at work. Organization Science, 16(5), 537–549. doi:10.1287/orsc.1050.0153
Taneva, S. K., & Arnold, J. (2018). Thriving, surviving and perform-ing in late career: A mixed-method study of pathways to successful aging in organizations. Work, Aging and Retire-ment, 4 (2), 189–212. doi:10.1093/workar/wax027
Taneva, S. K., Arnold, J., & Nicolson, R. (2016). The experience of being an older worker in an organization: a qualitative analysis. Work, Aging and Retirement, 2(4), 396-414. doi: 10.1093/workar/waw011

622020 • Issue 1 • 49-62Published By ScholarWorks@BGSU, 2020
Personnel Assessment And decisions develoPing A sAW scAle
Truxillo, D. M., Cadiz, D. M., Rineer, J. R., Zaniboni, S., & Fraccaroli, F. (2012). A lifespan perspective on job design: Fitting the job and the worker to promote job satisfaction, engagement, and performance. Organizational Psychology Review, 2(4), 340–360. doi: 10.1177/2041386612454043
Tuomi, K., Ilmarinen, J., Jahkola, A., Katajarinne, L., & Tulkki, A. (1998). Work Ability Index 2nd Edition. Helsinki: Institute of Occupational Health.
Velicer, W. (1976). Determining the number of components from the matrix of partial correlations. Psychometrika, 41, 321-327. doi:10.1007/BF02293557
Walters, K., Christakis, D. A., & Wright, D. R. (2018). Are Mechan-ical Turk worker samples representative of health status and health behaviors in the U.S.? PloS one, 13(6), e0198835. doi:10.1371/journal.pone.0198835
Warr, P. (2001). Age and work behavior: Physical attributes, cog-nitive abilities, knowledge, personality traits and motives. In C. L. Cooper, & I. T. Robertson (Eds.), International review of industrial and organizational psychology (pp. 1–36). New York, NY: Wiley.
Warr, P. (2007). Work, happiness, and unhappiness. Mahwah, NJ: Erlbaum. eBook ISBN 9780203936856.
Weigl, M., Müller, A., Hornung, S., Zacher, H., & Angerer, P. (2013). The moderating effects of job control and selection, optimi-zation, and compensation strategies on the age–work abil-ity relationship. Journal of Organizational Behavior, 34(5), 607-628. doi:10.1002/job.1810
Zacher, H. (2015a). Successful aging at work. Work, Aging and Retirement, 1(1), 4-25. doi: 10.1093/workar/way002
Zacher, H. (2015b). The importance of a precise definition, comprehensive model, and critical discussion of successful aging at work. Work, Aging and Retirement, 1(4), 320-333. doi:10.1093/workar/wav020
Zacher, H., , Rudolph, W. (2017). Successful aging at work and beyond: A review and critical perspective. In S. Profili, A. Sammarra , L. Innocenti (Ed.) Age Diversity in the Workplace (Advanced Series in Management, Volume 17) (pp. 35 – 64). Bradford, UK: Emerald Publishing Limited. eISBN: 978-1-78743-073-0
Zacher, H., Kooij, D. T.A.M., & Beier, M. E. (2018). Active aging at work: Contributing factors and implications for organiza-tions. Organizational Dynamics, 47(1), 37-45. doi:10.1016/j.orgdyn.2017.08.001
Zaniboni, S., Kmicinska, M., Truxillo, D. M., Kahn, K., Paladino M. P., & Fraccaroli, F. (2019). Will you still hire me when I am over 50? The effects of implicit and explicit age stereotyping on resume evaluations, European Journal of Work and Orga-nizational Psychology, 28:4, 453-467, doi:10.1080/1359432X.2019.1600506
RECEIVED 05/02/19 ACCEPTED 11/05/19