measuring hr performance moving from reporting to predicting “we live in a society bloated with...
TRANSCRIPT

MEASURING HR PERFORMANCEMoving from reporting to predicting
“We live in a society bloated with data but starved for wisdom.” Elizabeth Lindsey, Ethnographer and National Geographic Fellow
KEVIN [email protected]

1st Premise
Successful organizations must achieve: • Operational Effectiveness – Is your organization
performing similar activities better than your competitors?
• Strategic Positioning – What actions can your organization take to distinguish itself from competitors? What does your organization consider to be its competitive differentiators in the marketplace?
Porter, M. (1996, November–December). What is strategy? Harvard Business Review, 74(6), 61–78.

2nd Premise
3
Vision
Business Strategy
Organizational Strategy
Human Strategy: Capability
Strategic HR increases an organization’s ability to achieve its vision, mission and strategic objectives. This is done by developing (not in a vacuum) HR strategies (initiatives) that align with the organization’s direction. - SHRM
HR can and should be both operational and strategic

4Table from Boston Consulting Group/WFPMA, From Capability to Profitability: Realizing the Value of People Management (July 2012).
3rd Premise Companies that leverage human capital well outperform those that do not
5
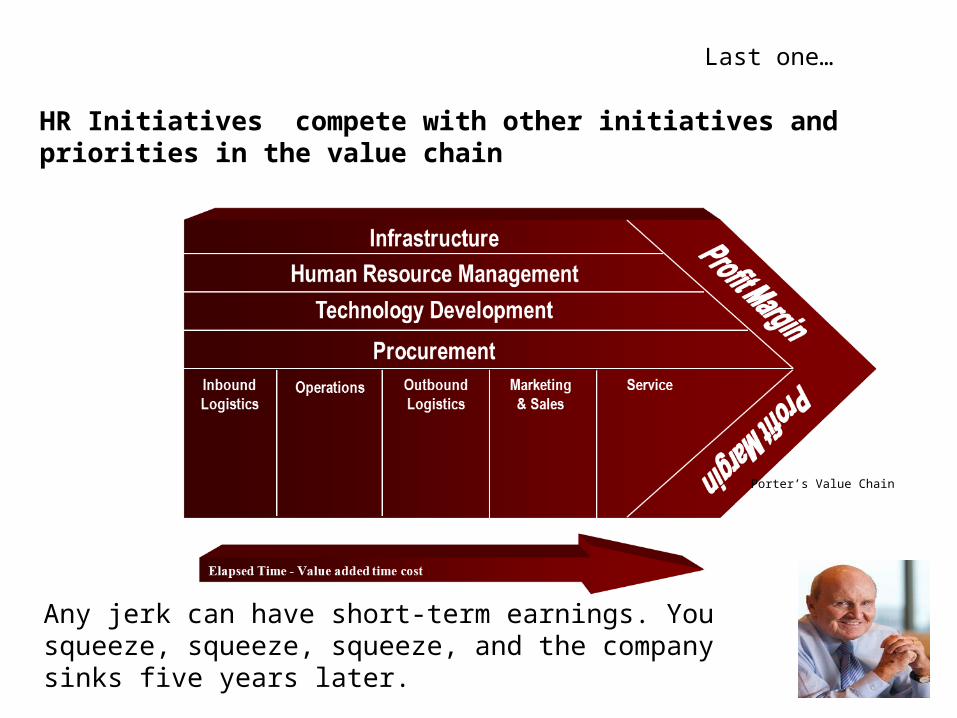
Any jerk can have short-term earnings. You squeeze, squeeze, squeeze, and the company sinks five years later. - Jack Welch
HR Initiatives compete with other initiatives and priorities in the value chain
Last one…
Porter’s Value Chain

6
THINKThe Human Resource department in my organization is focused on (operational effectiveness, strategic positioning, something else)___________________?
PAIR
SHARE
How can HR …..
• Contribute to Op. Effectivness & Strategic Positioning • Make the importance of human capital visible • Compete internally for time and resources

8
MEASUREMENT
• Develop new insights and understanding of business performance based on DATA and STATISTICAL METHODS .

9
Measurement (Analytics) help immunize firmsagainst short-termism.
Business analytics (BA) - skills, technologies, applications and practices for continuous iterative exploration and investigation of past business performance to gain insight and drive business planning.
Business analytics focuses on developing new insights and understanding of business performance based on DATA and STATISTICAL METHODS .
Analytics Competitor: A’S, Red Sox
• Moneyball by Michael Lewis – A’s consistently make the playoffs despite a low overall
payroll– New metrics for player selection: “on-base percentage”
and “on-base plus slugging percentage”
• Boston Red Sox– Example: Martinez easier for opposing batters after 7
innings or 105 pitches (ALCS 2003)
Analytics Competitor: Harrah’s Entertainment
• Customer loyalty card data used in near-real time to optimize yield, set prices for slots and rooms, and design traffic through the casinos– Predict the “pain point” and pull you away from
the slot machine
• Which marketing initiatives to move through which channels
• HR analytics used in recruiting process
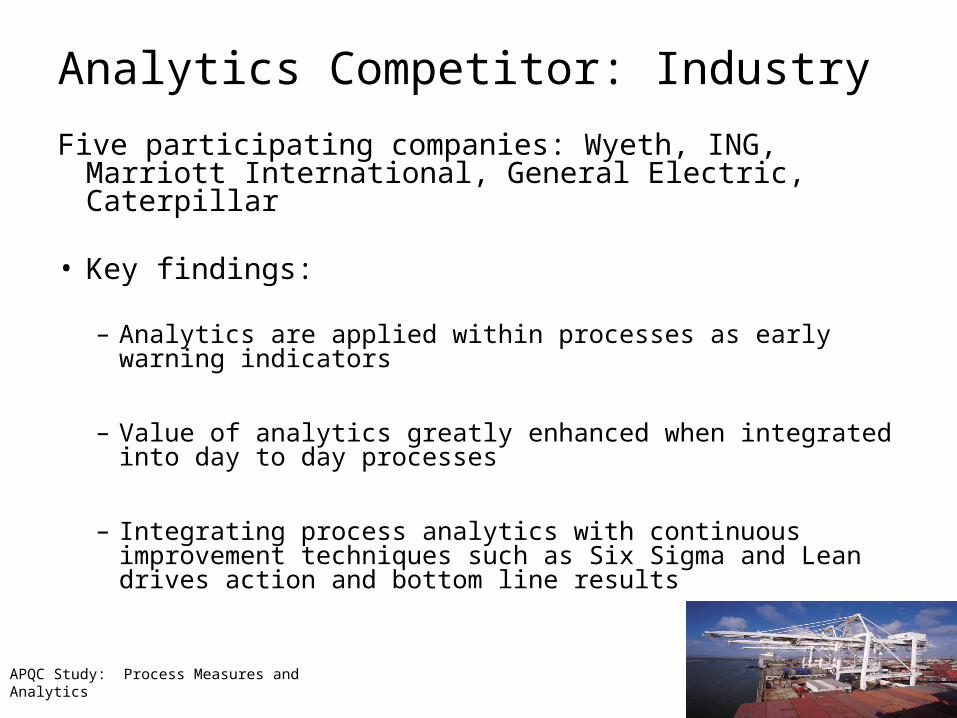
APQC Study: Process Measures and Analytics
Five participating companies: Wyeth, ING, Marriott International, General Electric, Caterpillar
• Key findings:
– Analytics are applied within processes as early warning indicators
– Value of analytics greatly enhanced when integrated into day to day processes
– Integrating process analytics with continuous improvement techniques such as Six Sigma and Lean drives action and bottom line results
Analytics Competitor: Industry

13
THINKIn my organization HR is evaluated based on the following measures/metrics (i.e. turnover, UI Claims, etc.) ____________________________________________________________
PAIR
SHARE
14
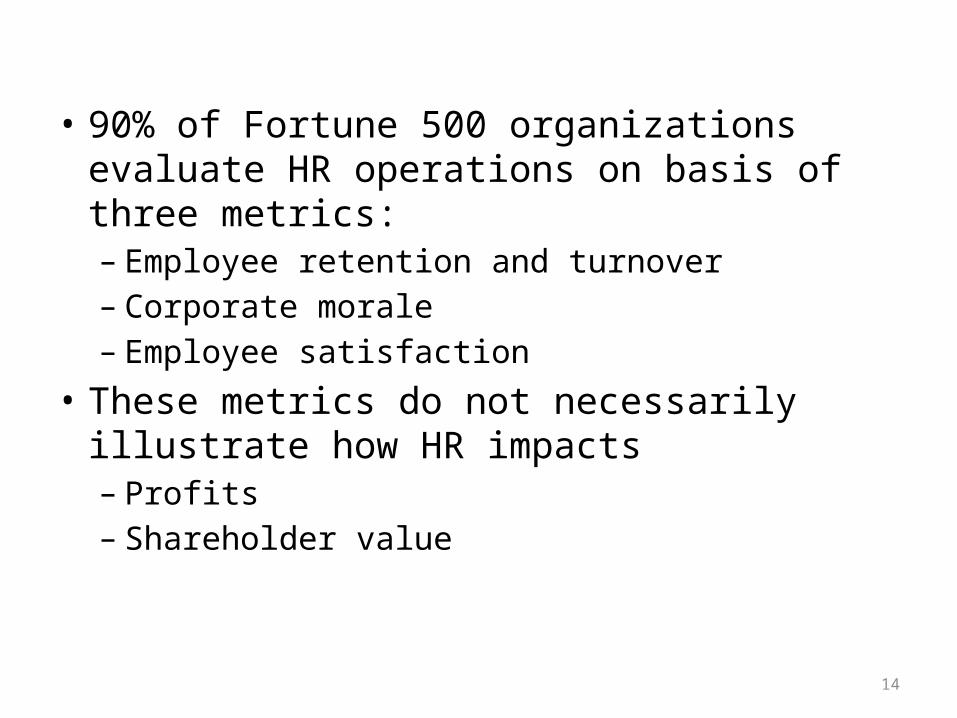
• 90% of Fortune 500 organizations evaluate HR operations on basis of three metrics:– Employee retention and turnover– Corporate morale– Employee satisfaction
• These metrics do not necessarily illustrate how HR impacts – Profits – Shareholder value

16
Getting Beyond the wall in HR measurement…..
ReportingTraining
Participation
Number of
chemistry
degrees
Headcount
Trending/Analyzing
Average YOS for
promotion to Director
Time to Hire by function
What factors contribute to the turnover of chemists?
What critical experiences
are needed to become a
Plant Manager?
Predicting

Requires a Shift in Mindset
• From “I think…” to “I know…”
• From reporting to predicting
17

PlanDesign or revise business process components to
improve results
DoImplement the plan
and measure its performance
CheckAssess the
measurements and report the results to
decision makers
ActDecide on changes needed to improve
the process
Applying PDCA
INPUT ValueAdded Tasks
OUTPUT
How does your department and your process add value to FM and
the customer?
4-18
Adopt an analytical view of HR

Measures of...
Who Cares? HR efficiencyHR
effectiveness
Business impact of
human capital
strategies
Human capability and risk
HR ● ● ● ●
Senior executives
● ● ●
Board of directors
● ●
Investors ●
ValueAdded Tasks
How does your department and your process add value to FM and
the customer?

“Bottom-Line” HR Metrics.Value
Added Tasks
WHAT SHOULD I MEASURE? It depends… What is the value added task?
21
HR Measurement
Hidden slides in the packet available to you digitallyTop Ten HR metrics list

25
A short detour to “ how-to”…

26
So where do I start……THE “BASIC SEVEN TOOLS OF QUALITY ” 105,000,000 results on gooogle
Cause-and-effect diagram : Identifies many possible causes for an effect or problem and sorts ideas into useful categories.
Check sheet: A structured, prepared form for collecting and analyzing data
Control charts: Graphs used to study how a process changes over time.
Histogram: Graph for showing frequency distributions
Pareto chart: Bar graph which factors are more significant.
Scatter diagram: Graphs pairs of numerical data, to look for a relationship.
Stratification: A technique that separates data gathered from a variety of sources so that patterns can be seen (some lists replace “stratification” with “flowchart” or “run chart”).
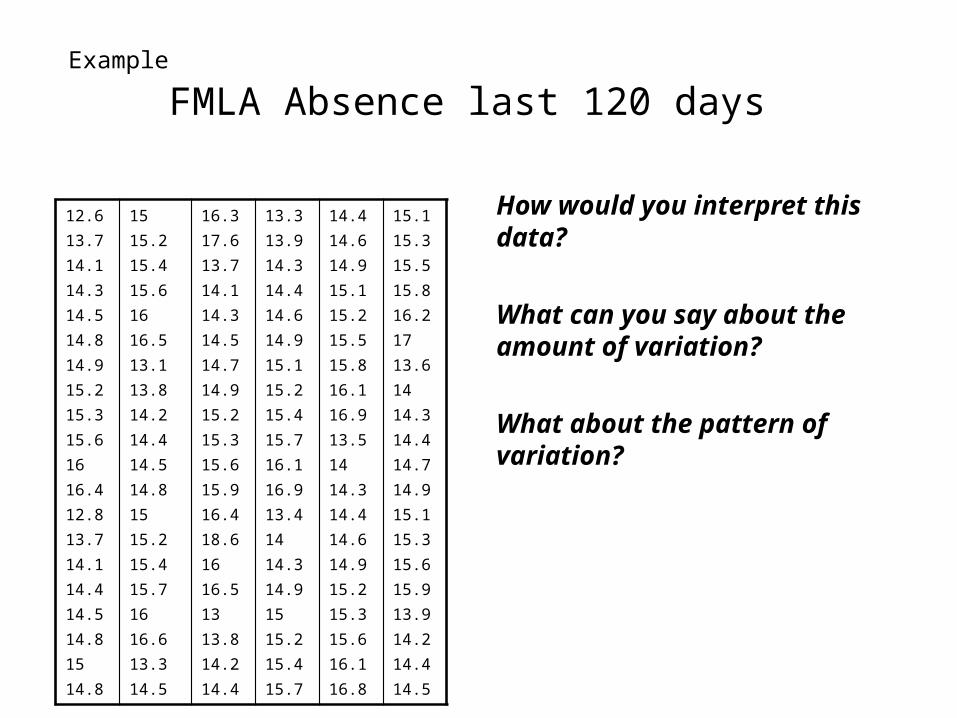
FMLA Absence last 120 days
12.613.714.114.314.514.814.915.215.315.61616.412.813.714.114.414.514.81514.8
1515.215.415.61616.513.113.814.214.414.514.81515.215.415.71616.613.314.5
16.317.613.714.114.314.514.714.915.215.315.615.916.418.61616.51313.814.214.4
13.313.914.314.414.614.915.115.215.415.716.116.913.41414.314.91515.215.415.7
14.414.614.915.115.215.515.816.116.913.51414.314.414.614.915.215.315.616.116.8
15.115.315.515.816.21713.61414.314.414.714.915.115.315.615.913.914.214.414.5
How would you interpret this data?
What can you say about the amount of variation?
What about the pattern of variation?
Example
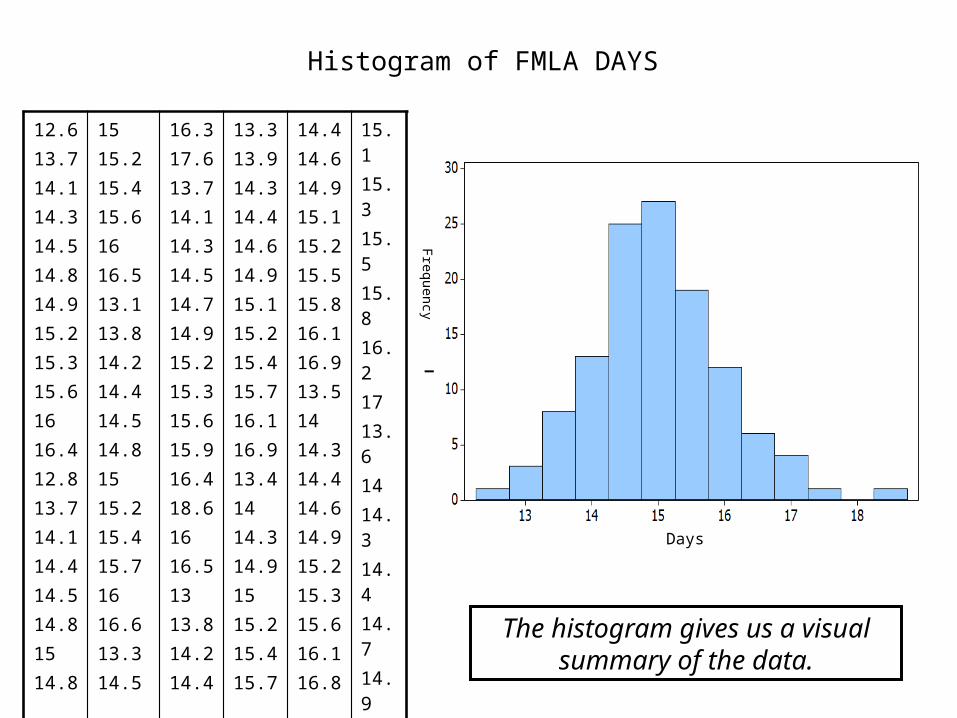
Histogram of FMLA DAYS
12.613.714.114.314.514.814.915.215.315.61616.412.813.714.114.414.514.81514.8
1515.215.415.61616.513.113.814.214.414.514.81515.215.415.71616.613.314.5
16.317.613.714.114.314.514.714.915.215.315.615.916.418.61616.51313.814.214.4
13.313.914.314.414.614.915.115.215.415.716.116.913.41414.314.91515.215.415.7
14.414.614.915.115.215.515.816.116.913.51414.314.414.614.915.215.315.616.116.8
15.115.315.515.816.21713.61414.314.414.714.915.115.315.615.913.914.214.414.5
The histogram gives us a visual summary of the data.
DaysF
requency

Histogram of sales measurements
What does the histogram show us?
Shape of the data
Spread of the data
Center of the data

30
Example – analytics drives better decisions
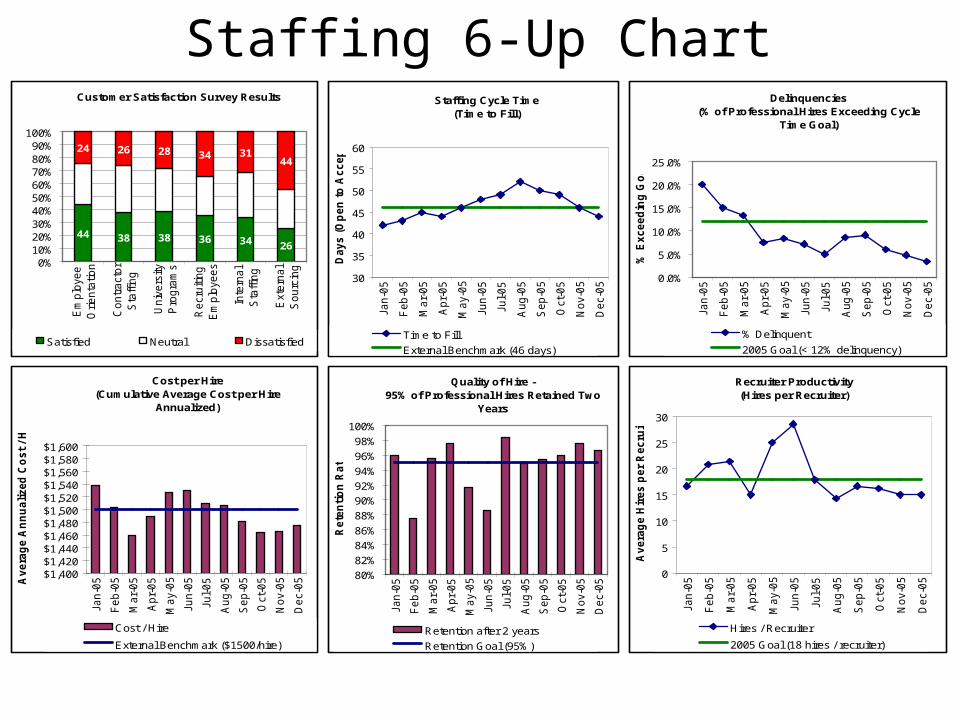
Staffing 6-Up ChartCustomer Satisfaction Survey Results
44 38 38 36 34 26
24 26 28 34 3144
0%10%20%30%40%50%60%70%80%90%
100%
Em
plo
yee
Orienta
tion
Contr
acto
r
Sta
ffin
g
Univ
ers
ity
Pro
gra
ms
Recru
iting
Em
plo
yees
Inte
rnal
Sta
ffin
g
Ext
ern
al
Sourc
ing
Satisfied Neutral Dissatisfied
Staffing Cycle Time(Time to Fill)
30
35
40
45
50
55
60
Jan-0
5
Feb-0
5
Mar-
05
Apr-
05
May-0
5
Jun-0
5
Jul-05
Aug-0
5
Sep-0
5
Oct-
05
Nov-0
5
Dec-0
5
Days (
Op
en
to
Accep
t)Time to Fill
External Benchmark (46 days)
Delinquencies(% of Professional Hires Exceeding Cycle
Time Goal)
0.0%
5.0%
10.0%
15.0%
20.0%
25.0%
Jan-0
5
Feb-0
5
Mar-
05
Apr-
05
May-0
5
Jun-0
5
Jul-05
Aug-0
5
Sep-0
5
Oct-
05
Nov-0
5
Dec-0
5
% E
xceed
ing
Go
al
% Delinquent
2005 Goal (< 12% delinquency)
Quality of Hire -95% of Professional Hires Retained Two
Years
80%
82%
84%
86%
88%
90%
92%
94%
96%
98%
100%
Jan-0
5
Feb-0
5
Mar-
05
Apr-
05
May-0
5
Jun-0
5
Jul-05
Aug-0
5
Sep-0
5
Oct-
05
Nov-0
5
Dec-0
5
Rete
nti
on
Rate
Retention after 2 years
Retention Goal (95%)
Cost per Hire(Cumulative Average Cost per Hire
Annualized)
$1,400$1,420$1,440$1,460$1,480$1,500$1,520$1,540$1,560$1,580$1,600
Jan-0
5
Feb-0
5
Mar-
05
Apr-
05
May-0
5
Jun-0
5
Jul-05
Aug-0
5
Sep-0
5
Oct-
05
Nov-0
5
Dec-0
5Avera
ge A
nn
uali
zed
Co
st
/ H
ire
Cost / Hire
External Benchmark ($1500/hire)
Recruiter Productivity(Hires per Recruiter)
0
5
10
15
20
25
30
Jan-0
5
Feb-0
5
Mar-
05
Apr-
05
May-0
5
Jun-0
5
Jul-05
Aug-0
5
Sep-0
5
Oct-
05
Nov-0
5
Dec-0
5
Avera
ge H
ires p
er
Recru
iter
Hires / Recruiter
2005 Goal (18 hires / recruiter)
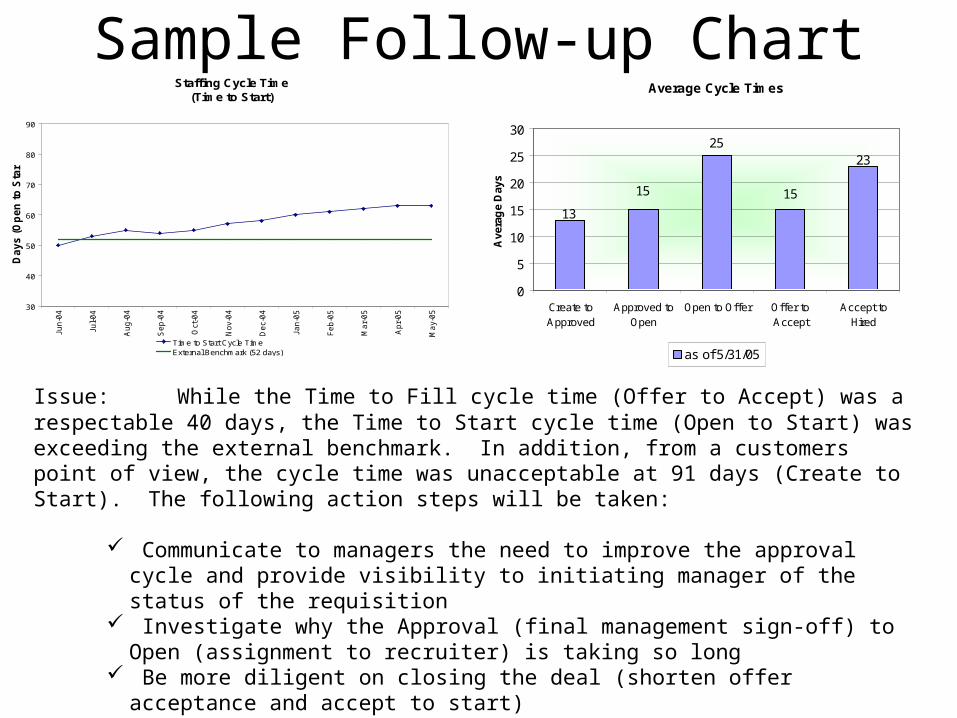
Average Cycle Times
2523
1515
13
0
5
10
15
20
25
30
Create toApproved
Approved toOpen
Open to Offer Offer toAccept
Accept toHired
Ave
rag
e D
ays
as of 5/31/05
Sample Follow-up ChartStaffing Cycle Time
(Time to Start)
30
40
50
60
70
80
90
Jun
-04
Jul-0
4
Au
g-0
4
Se
p-0
4
Oct
-04
No
v-0
4
De
c-0
4
Jan
-05
Fe
b-0
5
Ma
r-0
5
Ap
r-0
5
Ma
y-0
5
Da
ys
(O
pe
n t
o S
tart
)
Time to Start Cycle TimeExternal Benchmark (52 days)
Issue: While the Time to Fill cycle time (Offer to Accept) was a respectable 40 days, the Time to Start cycle time (Open to Start) was exceeding the external benchmark. In addition, from a customers point of view, the cycle time was unacceptable at 91 days (Create to Start). The following action steps will be taken:
Communicate to managers the need to improve the approval cycle and provide visibility to initiating manager of the status of the requisition
Investigate why the Approval (final management sign-off) to Open (assignment to recruiter) is taking so long
Be more diligent on closing the deal (shorten offer acceptance and accept to start)

33
QI Macros Fill-in-the-Blank Templates and Tools for Lean Six Sigma
• Drawing flowcharts, value stream maps and Ishikawa diagrams?• Updating monthly charts and dashboards?• Advanced analysis like Gage R&R, DOE, and so on?
QI Macros SPC Software for Excel Free 30-Day Trial for PC & Mac Users
A good tool to consider…..

34
• Charting – Some rules of thumb for constructing charts and
graphs– Hidden Slides in the packet available to you
digitally

39
THINKIn my organization HR use the following analytical tools and software to provide a predicative capability ____________________________________________________________
PAIR
SHARE

Does this sound familiar?
40
Evaluating enterprise products and services

41
An Evaluation of ‘Systems’ must include:
PEOPLE PROCESS TECHNOLOGY

Start with the end in mind…
Return on Investment• Why would the CxO write the
check for technology procurement?
• Don’t automatically accept the incumbent system due to investment – those are sunk costs
Return on Expectations• What is your strategy?• What are your drivers?• Does the system align with your
needs?• At the end of the day, how do
stakeholders expect the system to add value and improve their work life?
42
42

Items to consider for planning • Staffing
– Without an appropriately staffed HRIS group to deploy, own and continuously market the applications, the effort will die on the vine
– Hybrid skill set – high tech, high touch– If you depend on an internal IT group, what is their skill set? What type of technologies can
they support?• Define your key drivers
– Determine organizational direction– Global expansion?– Emphasis on talent management?
• Economics– Funding availability
• Timing– The world moves quickly; if process and technology rollouts don’t keep up you’ll set
yourself up to fail– Short term planning (up to 1 year) should be your target
43
Caveat Emptor• The 80/20 rule applies
– In most cases 80% of the functionality will be common– What’s that 20% difference and does it matter to you?– A long list of features doesn’t matter unless they match your requirements
• Use scenario-based requirements for demos– Send to the short-list vendors ahead of time so they can prepare– Allow the requisite exec summary and system overview– Always remember what your drivers are– Make sure all scenarios are addressed– Save the glitz for last and be a healthy skeptic (demos are meant to be smooth)
• Reality checks– Search reference lists for comparable situations – software versions, services
selection, consultant roles– Bad marriages lead to ugly divorces– Best practices aren’t necessarily the ‘best’ for your company– Beware the stylish haircut – look in the mirror and make an honest self-assessment
44

45
• Finding a consultant

How do you find a consultant?
• Selection should be as rigorous a process as system selection– Problem solver– Excellent communicator– Personally disciplined– Passion for doing what’s best for the client
• Know your ‘needs requirements’ – strategic planning, project management or group therapy?
• You must ‘click’ on– Approach– Cost– Personality/Culture
• Check references• Use websites and referrals from similar companies/projects
46

The Consulting Landscape
IndependentsIndependents
Broad HR Boutique
Broad HR Boutique
The Big Boys – Multiple
practices
The Big Boys – Multiple
practices
Strategic/C-Level
Strategic/C-Level
BenchmarkingBenchmarking
Niche CentricNiche Centric
ImplementationImplementation
Research &Advisory
Research &Advisory
????????
ERP Vendors SAP OracleIT body shops CSC EDS (HP) CAP GeminiProduct boutiques – Oracle: Kbace
Recruitment mgmt – The Newman Group (Futurestep)Talent Management – Knowledge Infusion Bersin & AssociatesBPO/IT outsourcing – Equaterra TPI Everest Research Inst
The Hackett Group
Bloom & Wallace
AccentureDeloitte & TouchePWCTowers WatsonIBMBoston Consulting Grp
Executive AllianceHRchitectJeitosa Group IntlWorkStrategyWise Consulting
HR Technology SolutionsBeachside Consulting(google on personal names)
Gartner AMRForrester IDCAberdeen
47

48
• Finding software

Objective Vendor/Product Analysis – Decision drivers and Scenario-based demos (not RFPs)
Decision Drivers Weight Vendor A Vendor B Vendor C Vendor D
Vendor Viability XX%
Usability XX%
Functionality XX%
Technology XX%
Configurability XX%
Scalability XX%
Global Capability XX%
Integration XX%
Cost/ROI XX%
49
49
50
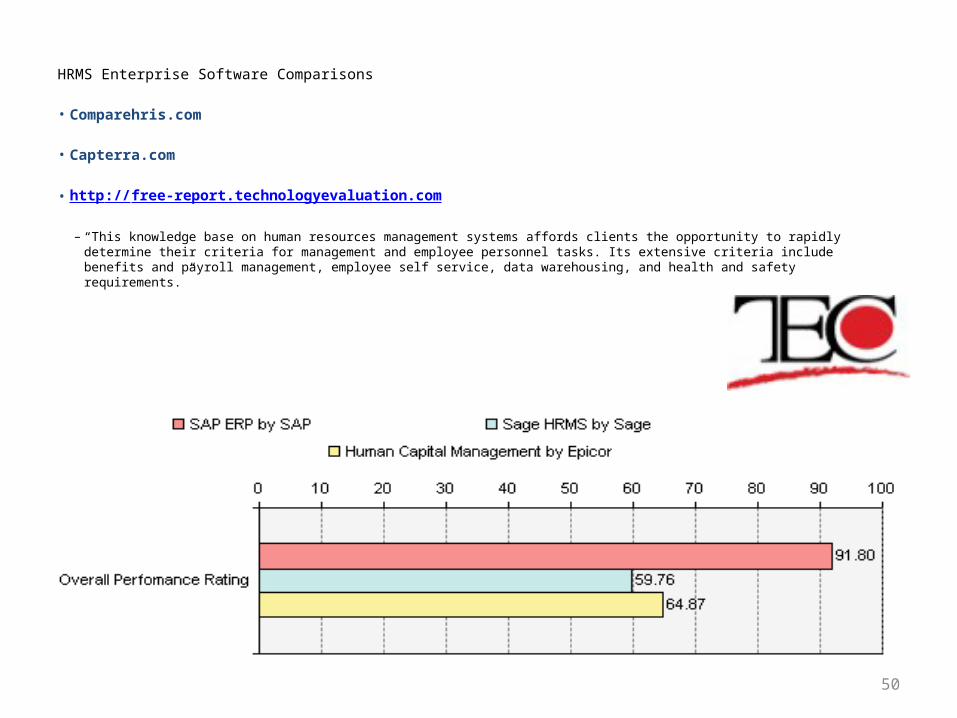
HRMS Enterprise Software Comparisons
• Comparehris.com
• Capterra.com
• http://free-report.technologyevaluation.com
– “This knowledge base on human resources management systems affords clients the opportunity to rapidly determine their criteria for management and employee personnel tasks. Its extensive criteria include benefits and payroll management, employee self service, data warehousing, and health and safety requirements.”
More reality checks…
Input is a dirty job but someone’s has to do it•There is no magic solution•Be realistic when looking at potential functionality – how is the data going to get there?•Maintain data accuracy - edit and audit continuously
Output is the true value of the system•Work backwards during the requirements phase – what do you want to get out of the system?•Reports/dashboards/metrics should be considered first, not last•Investigate retrieval tools, whether bundled or third party – getting at history in a meaningful way is still a challenge•Integration/interfacing is a key element 51

52
• Back to the bigger questions

53
Best Practices• Adopt a “business intelligence mindset”
• Start small and build credibility– In the early stages, focus on solving immediate problems
• Have the end in mind and build an infrastructure to support it
• Collaborate with other analytic groups within your company
• Build/buy analytics competence with HR
• Engage a leader who has an analytics understanding, passion, and interest

54
Pitfalls to Avoid
• Using analytics to “prove HR’s worth”
• Assigning this mission to a lower level technician
• Don’t confuse:– Data dumps with insight– Benchmarking with analytics
• Rushing the process
• Allowing the perfect to become the enemy of the good

MEASURING HR PERFORMANCEMoving from reporting to predicting
“We live in a society bloated with data but starved for wisdom.” Elizabeth Lindsey, Ethnographer and National Geographic Fellow
KEVIN [email protected]