measuring household food insecurity workshop … household food insecurity workshop report, april...
TRANSCRIPT

Food and Nutrition Technical Assistance Project (FANTA)Academy for Educational Development 1825 Connecticut Ave., NW Washington, DC 20009-5721
Tel: 202-884-8000 Fax: 202-884-8432 E-mail: [email protected] Website: www.fantaproject.org
Measuring Household Food InsecurityWorkshop Report
April 15-16, 2004

This publication was made possiblethrough the support provided to the Foodand Nutrition Technical Assistance(FANTA) Project by the Office ofHealth, Infectious Disease and Nutritionof the Bureau for Global Health and theOffice of Food for Peace of the Bureaufor Democracy, Conflict andHumanitarian Assistance at the U.S.Agency for International Development,under terms of Cooperative AgreementNo. HRN-A-00-98-00046-00 awarded tothe Academy for EducationalDevelopment (AED). The opinionsexpressed herein are those of theauthor(s) and do not necessarily reflectthe views of the U.S. Agency forInternational Development.
Copies of the publication can beobtained from:Food and Nutrition Technical AssistanceProjectAcademy for Educational Development1825 Connecticut Avenue, NWWashington, D.C. 20009-5721Tel: 202-884-8000Fax: 202-884-8432Email: [email protected]: www.fantaproject.org
Table of Contents1. Introduction................................................................................................................................. 1
2. Objectives of Workshop ............................................................................................................. 2
3. Results of the Field Validation Studies....................................................................................... 2
4. Findings of the Review of Literature on the Use of the HFSS ................................................... 3
5. Discussion of Themes ................................................................................................................. 4
6. Discussion of Questions and Level of Adaptation Needed ........................................................ 46.1. Fear/anxiety/worry about running out of food.................................................................... 5
6.1.1. Actual household food depletion .................................................................................. 56.2. Insufficient food intake ........................................................................................................ 6
6.2.1. Physical effects ............................................................................................................. 66.3. Quality of food..................................................................................................................... 6
6.3.1 Nutritional quality.......................................................................................................... 66.3.2 Taste and Appeal/Loss of control .................................................................................. 76.3.3 Social acceptability/compromise ................................................................................... 7
6.4. Coping strategies to increase household resources.............................................................. 7
7. Identification of Cross-Cutting Issues ........................................................................................ 8
8. Conclusion of Workshop ............................................................................................................ 8
Appendices
1. Questions Used to Assess the Food Security of Households in the CPS Food Security Survey ... A12. Measuring Household Food Insecurity Workshop Attendees List and Agenda ...................... A33. Household Food Insecurity Scale (HFIS) draft questions........................................................ A44. Frongillo Workshop Presentation "Understanding and Measuring the Experience of HouseholdFood Insecurity Across Locations and Cultures" .........................................................................A55. Frongillo and Nanama Workshop Presentation "Development and validation of an experience-based measure of household food security in Northern Burkina Faso"....................................... A96. Coates Workshop Presentation "Food Insecurity Measurement and Validation inBangladesh".................................................................................................................................A137. Melgar-Quiñonez, Dunford, Nord, and Johnson Workshop Presentation "Testing FoodSecurity Scales for Low-cost Poverty Assessment" .................................................................. A178. Coates Workshop Presentation "The Experience and Expression of Food Insecurity AcrossCultures" .................................................................................................................................... A23

Measuring Household Food Insecurity Workshop Report, April 15-16, 2004
1
1. INTRODUCTION
During the past four years FANTA has supported activities to validate the US Household FoodSecurity Scale (HFSS) for use in developing countries and test its usefulness as an impactindicator for the access component of food security in program evaluations. The underlyingconcept of the HFSS approach is that food insecurity in the United States is a measurableexperience that can be described and analyzed to categorize households by level of foodinsecurity1 [see Frongillo presentation in Appendix 4]. The set of activities implemented byFANTA seeks to answer whether this is universally true and whether a generic measurement toolcould be developed for application across countries.
FANTA funded two multi-year field validation studies that used the HFSS approach to developexperiential household food insecurity scales (HFIS) and validate them primarily as impactindicators for the access component of household food security. The studies were implementedby Cornell University in the Title II food security program areas of Africare in Burkina Faso andby Tufts University in the Title II food security program areas of World Vision in Bangladesh.
The objective of the field studies was the design and dissemination of a measurement process fortranslating information about the food insecurity experience into a robust andcontextually-sensitive indicator of food insecurity that has demonstrated validity. Through thesestudies, FANTA developed a practical formative research process (protocol) that can be appliedby local researchers and program implementers in a wide variety of settings to enable them todevelop measures of food insecurity appropriate to their cultural, ecological, and economiccontexts.
FANTA also provided support to Freedom from Hunger (FFH) efforts to develop a low-cost andmeaningful poverty measurement and classification system that would be applicable in diversesettings. The FFH studies in Burkina Faso, Bolivia, Ghana and the Philippines investigated therelationship between classifications based on the HFSS and those based on the internationalpoverty line—$1 per day (purchasing power parity) per capita consumption—using datagenerated in ways comparable to the Living Standards Measurement Studies (LSMS) developedand used by the World Bank.
In addition to the FANTA-supported field validation studies, researchers and food securityprogram managers have used and adapted the HFSS approach in a number of countries for arange of different purposes. FANTA carried out a review of how the HFSS was adapted andused to look at food insecurity in these cases.
As the next step in the effort to develop an easy-to-use, valid measure of household foodinsecurity for food security programs, FANTA held a two-day workshop on April 15-16 2004,with 25 researchers, PVO practitioners from Title II and Child Survival and Health programs,and USAID and FANTA staff.
1 The HFSS was developed, through collaboration among Federal agencies, academics, commercial and nonprofit organizations,as a module for the US Current Population Survey carried out by the USDA Economic Research Service. The survey module hasbeen used, in various forms, since 1995 and consists of a validated set of 18 questions that focus on behavior and conditionsrelated to food security. See Appendix 1.

Measuring Household Food Insecurity Workshop Report, April 15-16, 2004
2
2. OBJECTIVES OF WORKSHOP
The goal of the workshop was to arrive at a consensus on the feasibility and begin developmentof a generic, universally applicable measurement instrument that could be used to construct anexperiential household food insecurity scale (HFIS) in a range of country and cultural contexts.
The specific objectives of the workshop were to:
1. Present the results of the field validation studies2. Present the findings of the review of literature on the use of the HFSS3. Discuss:
a) common themes for behaviors/behaviors of food insecurity that are universal acrossdifferent countries and culturesb) questions that address these themes and the degree of adaptation needed for specificcontextsc) indicators that could be developed using the data generatedd) next steps necessary to develop a generic instrument and methods.
The agenda of the workshop is included as Appendix 2.
3. RESULTS OF THE FIELD VALIDATION STUDIES
Ed Frongillo from Cornell, Jennifer Coates from Tufts, and Hugo Melgar from Ohio Universitypresented the results of Cornell’s work with Africare in Burkina Faso, Tufts’s work with WorldVision in Bangladesh and FANTA’s partnership with FFH in Bolivia, Burkina Faso, Ghana, andthe Philippines, respectively.
The Cornell and Tufts studies showed that the HFSS approach to developing an experientialhousehold food insecurity scale (HFIS) can be applied successfully in a different, developingcountry context. The food insecurity questionnaire proved to be a simple tool that could be usedin these settings by organizations to assess, evaluate, or monitor the access component ofhousehold food security. Both studies indicate that the HFIS captures changes in food insecurityat the household level over time. These data can also be useful in the design, planning, targeting,and implementation of programs by identifying possible interventions, points of entry forservices, and subgroups most in need or who might most benefit.
Dr. Fongillo concluded that the Cornell approach in Burkina Faso, which based the tool onextensive ethnographic research rather than translating and adapting questions developedelsewhere, will likely lead to the best direct, experience-based measures for assessing householdfood insecurity in other countries [see Frongillo and Nanama presentation in Appendix 5]
The Tufts study in Bangladesh demonstrated that a module of nine questions, based onethnographic research related to the experience of food insecurity in the Bangladesh context,passes all validation tests that were applied to the HFSS. Responses to the set of nine questionstogether have strong statistical correlation with the level and severity of household foodinsecurity, and changes over time. These conclusions point to the possibilities of the use of the

Measuring Household Food Insecurity Workshop Report, April 15-16, 2004
3
tool by PVOs for designing and evaluating food security programs. The final report of theresearch project does caution that such a tool is not meant to substitute for more intensiveconsumption or anthropometric studies needed to answer specific questions about poverty ornutrition. [See Coates presentation in Appendix 6]
Preliminary results from the FFH studies, which used a slightly modified US HFSS instrumentrather than developing a country-specific instrument for each study site, show significantrelationships between food insecurity as defined by the experiential food insecurity scale andtotal household consumption in the countries included in the study. The relationship between theexperiential food insecurity scale and consumption is not always linear, although a clear trendtowards less consumption at higher levels of food insecurity was observed. [See presentation inAppendix 7]
4. FINDINGS OF THE REVIEW OF LITERATURE ON THE USE OF THE HFSS
A literature review was conducted to summarize recent work by field practitioners andacademics to develop instruments, based on the HFSS, to measure food insecurity in developedand developing countries.2 A total of 21 different uses of the HFSS were reviewed. The reviewwas used as a background paper for the FANTA workshop [see Appendix 8].
The following are the main findings of the review:• The review identified the following 5 common themes in the instruments: 1) anxiety that the
food budget or supply may be insufficient to meet basic needs; 2) perceptions of inadequatequality or quantity of food; 3) adults reducing food intake; 4) children reducing food intake;5) coping actions taken by the household to augment the food budget or food supply.Specific questions from each instrument were linked to each of the themes, and the questionsthat were unique to the specific country context or population were identified.
• All HFIS contained questions related to the following themes: 1) perceptions of sufficientquantity and quality of food, 2) adults reducing food intake or its consequences, and 3)coping behaviors to augment the household food supply. About half the instrumentsincluded questions about food-related anxiety and half included child-referenced questionsabout consumption reduction.
• The five themes that characterize the food insecurity experience in the United States appearto meaningfully discriminate among households with differing levels of food insecurity inother countries. Also common across countries is the experience that food insecurity ishandled through a “managed process”. However, the order of adoption in a given culture andassumptions about the severity indicated by specific themes are context-specific and aredependent on factors such as social acceptability and the coping strategies available tohouseholds.
• There may be a trade-off between the generic phrasing of a question required for universalrelevance and the cultural specificity required to ensure comprehension by the respondent.Questions reviewed here represented a range from very generic to very specific.
2 Coates, Jennifer. (2004) “Experience and Expression of Food Insecurity Across Cultures: Practical Implications for ValidMeasurement”. Washington, D.C.; Food and Nutrition Technical Assistance, Academy for Educational Development.

Measuring Household Food Insecurity Workshop Report, April 15-16, 2004
4
An additional literature review of ethnographic studies of food insecurity in six differentcountries, including the United States, was completed for the workshop. Comparisons of thestudies identified seven themes: 1) insufficient food intake (individual); 2) physical effects ofhunger; 3) household food depletion; 4) nutritional inadequacy; 5) uncertainty of future foodacquisition; 6) decreased choice and control over food; and 7) social compromises. There wasless commonality in the way these themes are experienced, indicating the need for furtherrefinement in particular country contexts.
In addition, the additional literature review compared themes against behaviors aimed atmitigating food insecurity. With one exception (changing eating patterns), each theme wasrelated to multiple behaviors that were not common across all countries. For example, theresponse to household food depletion varied so that some groups only borrowed or acceptedcharity while other groups also changed the dynamic of how food was distributed in thehousehold.
5. DISCUSSION OF THEMES
Drawing on the themes expressed in the HFSS, the themes identified in the workshopbackground paper, and the analysis of ethnographic studies of food insecurity, the workshopparticipants came to consensus that the following 4 themes and related sub-themes represent auniversal list that characterizes the experience of food insecurity across countries and cultures:
a. Fear/anxiety/worry about running out of fooda.1 Actual household food depletion
b. Insufficient food intake (quantity)b.1 Physical effects
c. Quality of foodc.1 Nutritional qualityc.2 Taste and appeal/loss of controlc.3 Social acceptability/compromise
d. Coping strategies to increase household resources
6. DISCUSSION OF QUESTIONS AND LEVEL OF ADAPTATION NEEDED
A key step in developing a universal household food insecurity measurement instrument that canbe used across a range of contexts is to develop ways to elicit the food insecurity experience ofthe household from a respondent in a consistent and valid way. Working groups for each of theuniversal themes discussed possible questions, using as a starting point the questions from theexamples summarized in the background paper. The discussion also drew upon the experienceof individuals who had used these instruments and could provide expert opinion on the validityand accuracy of specific questions. The most critical issues in this discussion were 1) thedetermination of the level of adaptation needed in order to provide accurate data related to aspecific context and 2) whether that adaptation would invalidate the universality of theinstrument.

Measuring Household Food Insecurity Workshop Report, April 15-16, 2004
5
The following scenarios were developed to help guide the overall focus of the discussion. Thestarting point for each scenario was the assumption that the themes were universal and thereforewould not need site-specific adaptation. All scenarios also assume that the questions would haveto be translated into local languages and subjected to cognitive and pilot testing.
• The “A” scenario: Assumes that only translation of questions into the local language(s) andcognitive and pilot testing are necessary. This is the ideal scenario for a universalinstrument.
• The “B” scenario: Site-specific adaptation of the phrasing of the question would benecessary, however, the basic question could be included in a universal instrument.
• The “C” scenario: Additional in-depth qualitative interviews are necessary to inform questiondevelopment, then site-specific questions would need to be developed. Inclusion of thetheme in a universal instrument would not be possible in this scenario.
With these 3 scenarios in mind, participants divided into small groups, by theme, to consider thefollowing questions:
• Are there additional sub-themes that are necessary to fully capture the food insecurityexperience under the theme?
• What are the possible questions related to each theme/sub-theme?• Are there universal ways to express those questions?
There were two rounds of small group discussions, between which each groups’ work waspresented to the larger group for discussion and suggestions for refinement. The following list ofthemes, sub-themes, and related questions were the result of the small group work and largegroup discussion. Questions are in bold. (Appendix 3 contains a list of the draft questionsidentified by the groups.) The scenario (A, B, or C) and issues for further consideration areidentified after each question. Unless specifically noted otherwise, most of the ambiguity in thefindings indicate a lack of time to accomplish further refinement rather than a lack of consensus.
6.1. Fear/anxiety/worry about running out of food
(Q1) In the past 12 months, have you worried that your “x” would not have enoughfood?
This question falls under Scenario A. “x” refers to the unit of analysis, likely to beconsidered, either a household or a family (see cross-cutting issues below). The concept ofworry about the future may not be relevant in fatalistic cultures.
6.1.1. Actual household food depletion
(Q2) In the past 12 months, was there a time when [your usual food supply ran out] or [youdid not have all of the food you needed]?
The bracketed terms need to be context-specific. (Scenario B) The use of the term “runningout of food” was considered problematic as it may be ethnocentric.

Measuring Household Food Insecurity Workshop Report, April 15-16, 2004
6
(Q3) In the past 12 months, was there a time when you completely ran out of food anddidn’t have any [good or acceptable or appropriate] ways of getting more?
The bracketed term needs to be context specific (Scenario B.) It was noted that thesequestions assume that “depletion” will follow “reduction in intake” (as determined in otherquestions).
6.2. Insufficient food intake
(Q4) In the past 12 months, did you or any adult in your household have to limit theamount of food eaten in a day because there was not enough food?
(Q5) In the past 12 months, did you or any adult in your household have to eat fewermeals in a day because there was not enough food?
(Q6) In the past 12 months, did you or any adult in your household have to go a wholeday without eating because there was not enough food?
(Q7) In the past 12 months, did any child in your household have to limit the amount offood eaten in a day because there was not enough food?
(Q8) In the past 12 months, did any child in your household have to eat fewer meals in aday because there was not enough food?
(Q9) In the past 12 months, did any child in your household have to go a whole daywithout eating because there was not enough food?
6.2.1. Physical effects
(Q10) In the past 12 months, did you or any adult in your household have to go to sleepat night hungry because there was not enough food?
(Q11) In the past 12 months, did any child in your household have to go to sleep at nighthungry because there was not enough food?
These questions (4 – 11) are likely to fall under Scenario A, although the term “limit” inquestions 4 and 7 may be site-specific (Scenario B.) The issues related to this theme andsub-theme involve identifying the most appropriate respondent and the use of the questionsin a situation of chronic food insecurity (i.e., a regularly occurring situation).
6.3. Quality of food
6.3.1 Nutritional quality
There was lack of consensus on this sub-theme. While clearly important for overall foodinsecurity, some participants felt that this did not fit into the experiential nature of the rest of the

Measuring Household Food Insecurity Workshop Report, April 15-16, 2004
7
instrument; others thought that it did fit. In addition, in order to adequately assess changes innutritional quality, more than just one or two questions would be needed. One suggestion wasthat this information be collected separately from this instrument, through a measure of dietarydiversity, for example. Some participants, however, were concerned that dietary diversity maynot be indicative of nutritional quality in some locations. Another suggestion was to ask aboutwhether people consume a list of a few key foods (e.g. meat, fish) known to be importantcontributors to nutritional quality in a given location. This approach has been successful incountries where it has been used.
6.3.2 Taste and Appeal/Loss of control
(Q12) In the past 12 months, has your family not been able to eat the way you think youshould because of [lack of resources]?
The bracketed term needs to be refined so that it is clear to the respondent that the experienceis clearly related to access to food (Scenario B).
6.3.3 Social acceptability/compromise
(Q13) In the past 12 months, did you get to the point where you had to eat foods thatare not acceptable to your culture/community because of [lack of resources]?
The bracketed term needs to be refined (Scenario B). There are actions that are culturallyacceptable to do in hard times, but indicate food insecurity nonetheless. There is a distinctionbetween control over food choices and compromise which is not picked up in either ofquestions 12 or 13. Monotony is an important aspect of preference, however it may be hardto get at because most people only eat one or two staple foods. It is usually understood that ifpeople say they run out of food they are referring to their staple foods. Lastly, an observationwas made that some preferred foods are not nutritionally adequate (e.g., high preference, lownutritional value product such as Coke).
6.4. Coping strategies to increase household resources
It might be helpful to know respondent’s perception of what constitutes food insecurity in orderto determine if the coping strategies are actually related to food insecurity.
(14) In order to meet your household food needs in the past 12 months did you have todo something that you disliked?
(15) In order to meet your household food needs in the past 12 months did you have tocompromise your future food needs?
(16) In order to meet your household food needs in the past 12 months did you have tocompromise needs other than food?

Measuring Household Food Insecurity Workshop Report, April 15-16, 2004
8
(17) In order to meet your household food needs in the past 12 months did you have todo something that you are ashamed of?
Participants agreed that the wording and choices given in this question were broad enough tobe considered common and universal. (Scenario A)
(18) In the past 12 months, [did you have] or [were you forced] to do things in order tomeet your household food needs?
The wording in brackets needs site-specific clarity (Scenario A). There are multiple levels ofcoping depending on severity and timing, so it might be necessary to ask whether the copingstrategies referred to in both questions are happening “now”, “always”, or “likely in thefuture.”
7. IDENTIFICATION OF CROSS-CUTTING ISSUES
Participants agreed that the following issues would have to be addressed for each of thequestions or for the instrument as a whole:• It was not possible to adequately discuss the question of the unit of analysis. Some questions
were being asked about the household and some questions about a specific person or personsin the household, and the definition of household would vary from country to country.
• Further discussion is needed regarding who the actual respondent would be.• For most questions, the recall period was given as 12 months, however, this was not
explicitly discussed and it may be possible to identify questions that could be asked foralternative recall periods (e.g., “since the last harvest”).
• The response for each of the questions is currently a “yes/no”. It might be useful to ask aboutthe frequency of a particular experience (e.g. never-rarely-sometimes-often-always) to makeit easier for a respondent to reply and to determine severity of food insecurity.
• Lastly, some of the questions might be more effective as statements rather than questions.
8. CONCLUSION OF WORKSHOP
Workshop participants were advised by researchers not to repeat errors that had been made in theearly iterations of the HFSS (i.e., the decision not to separate out questions about children fromadults) and to focus on specific information needs as opposed to trying to expand the instrumentto meet all possible uses.
Proposed next steps:
• Reach consensus on cross-cutting issues• Determine the implications of capturing the same behavior in more than one question• Identify universal wording for bracketed terms• Identify any additional commonalities in the themes or questions used in food insecurity
scales used in different studies• Define indicators that use the scale to categorize households by level of food
security/insecurity and those that could be created out of individual questions

Measuring Household Food Insecurity Workshop Report, April 15-16, 2004
9
• Field testing• Identify the limits and possibilities for appropriate uses of the instrument• Determine level of comparability of results across countries.
Throughout the discussion at the workshop, the principal goal of having an impact-levelindicator of food insecurity for program evaluations was kept in mind to focus everyone’sefforts. Beyond this, as suggested above, an important next step is to explore and identify thelimits and possibilities for other appropriate uses of the instrument. Some possible usesdiscussed were:
• A module in the Knowledge, Practice, and Coverage (KPC) surveys used in the ChildSurvival and Health grant program,
• Tool for reporting results of interventions• Incorporated into the Demographic and Health Surveys (DHS)• Targeting• Community tool• Comparison of countries• Comparison of PVOs’ activities

Appendix 1 of Measuring Household Food Insecurity Workshop Report, April 15-16, 2004
A1
APPENDIX 1: QUESTIONS USED TO ASSESS THE FOOD SECURITY OFHOUSEHOLDS IN THE CPS FOOD SECURITY SURVEY
1. “We worried whether our food would run out before we got money to buy more.”Was that often, sometimes, or never true for you in the last 12 months?
2. “The food that we bought just didn’t last, and we didn’t have money to get more.”Was that often, sometimes, or never true for you in the last 12 months?
3. “We couldn’t afford to eat balanced meals.”Was that often, sometimes, or never true for you in the last 12 months?
4. In the last 12 months, did you or other adults in the household ever cut the size of yourmeals or skip meals because there wasn’t enough money for food? (Yes/No)
5. (If yes to Question 4) How often did this happen—almost every month, some months butnot every month, or in only 1 or 2 months?
6. In the last 12 months, did you ever eat less than you felt you should because there wasn’tenough money for food? (Yes/No)
7. In the last 12 months, were you ever hungry, but didn’t eat, because you couldn’t affordenough food? (Yes/No)
8. In the last 12 months, did you lose weight because you didn’t have enough money forfood? (Yes/No)
9. In the last 12 months, did you or other adults in your household ever not eat for a wholeday because there wasn’t enough money for food? (Yes/No)
10. (If yes to Question 9) How often did this happen—almost every month, some months butnot every month, or in only 1 or 2 months?
(Questions 11-18 are asked only if the household included children under 18 years old)
11. “We relied on only a few kinds of low-cost food to feed our children because we wererunning out of money to buy food.”Was that often, sometimes, or never true for you in the last 12 months?
12. “We couldn’t feed our children a balanced meal, because we couldn’t afford enough food.”Was that often, sometimes, or never true for you in the last 12 months?
13. “The children were not eating enough because we just couldn’t afford enough food.”Was that often, sometimes, or never true for you in the last 12 months?
14. In the last 12 months, did you ever cut the size of any of the children’s meals because therewasn’t enough money for food? (Yes/No)
15. In the last 12 months, were the children ever hungry but you just couldn’t afford morefood? (Yes/No)
16. In the last 12 months, did any of the children ever skip a meal because there wasn’t enoughmoney for food? (Yes/No)

Appendix 1 of Measuring Household Food Insecurity Workshop Report, April 15-16, 2004
A2
17. (If yes to Question 16) How often did this happen—almost every month, some months butnot every month, or in only 1 or 2 months?
18. In the last 12 months did any of the children ever not eat for a whole day because therewasn’t enough money for food? (Yes/No)
Source: Nord, Mark; Margaret Andrews, and Steve Carlson. Household Food Security in theUnited States, 2003. Economic Research Service, U.S. Department of Agriculture, Washington,D.C. October 2004. Page 4.
Appendix 2 of Measuring Household Food Insecurity Workshop Report, April 15-16, 2004
A3
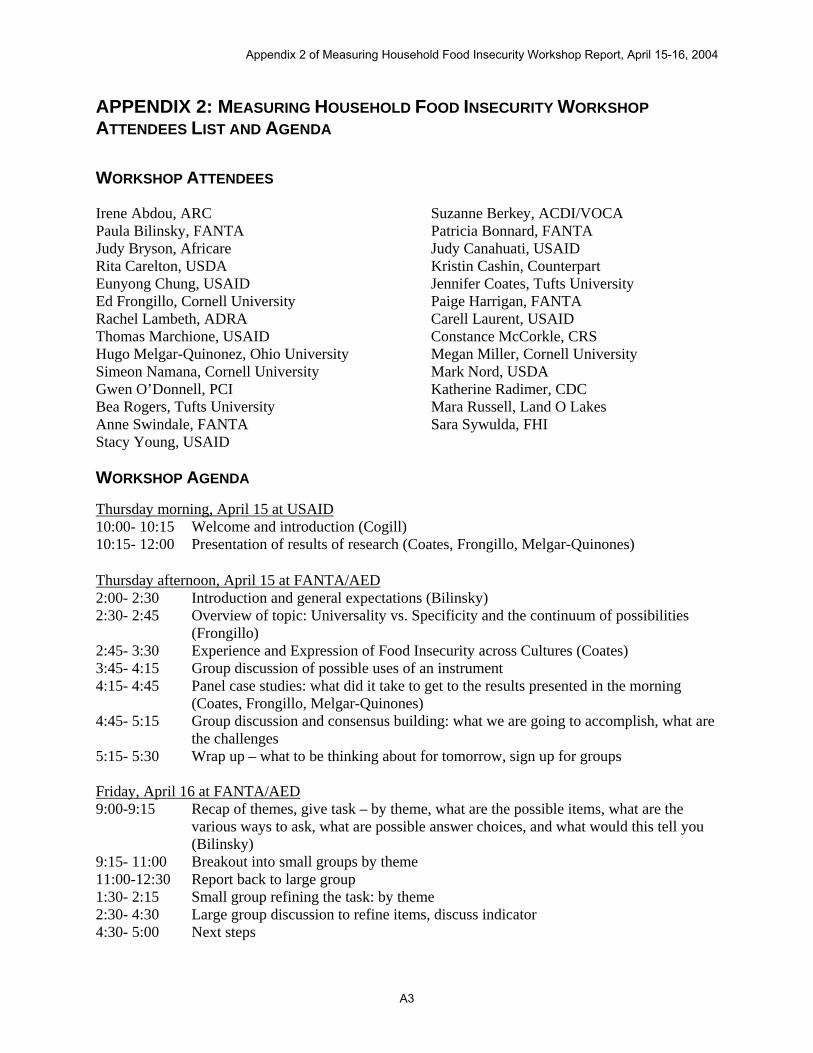
APPENDIX 2: MEASURING HOUSEHOLD FOOD INSECURITY WORKSHOPATTENDEES LIST AND AGENDA
WORKSHOP ATTENDEES
Irene Abdou, ARC Suzanne Berkey, ACDI/VOCAPaula Bilinsky, FANTA Patricia Bonnard, FANTAJudy Bryson, Africare Judy Canahuati, USAIDRita Carelton, USDA Kristin Cashin, CounterpartEunyong Chung, USAID Jennifer Coates, Tufts UniversityEd Frongillo, Cornell University Paige Harrigan, FANTARachel Lambeth, ADRA Carell Laurent, USAIDThomas Marchione, USAID Constance McCorkle, CRSHugo Melgar-Quinonez, Ohio University Megan Miller, Cornell UniversitySimeon Namana, Cornell University Mark Nord, USDAGwen O’Donnell, PCI Katherine Radimer, CDCBea Rogers, Tufts University Mara Russell, Land O LakesAnne Swindale, FANTA Sara Sywulda, FHIStacy Young, USAID
WORKSHOP AGENDA
Thursday morning, April 15 at USAID10:00- 10:15 Welcome and introduction (Cogill)10:15- 12:00 Presentation of results of research (Coates, Frongillo, Melgar-Quinones)
Thursday afternoon, April 15 at FANTA/AED2:00- 2:30 Introduction and general expectations (Bilinsky)2:30- 2:45 Overview of topic: Universality vs. Specificity and the continuum of possibilities
(Frongillo)2:45- 3:30 Experience and Expression of Food Insecurity across Cultures (Coates)3:45- 4:15 Group discussion of possible uses of an instrument4:15- 4:45 Panel case studies: what did it take to get to the results presented in the morning
(Coates, Frongillo, Melgar-Quinones)4:45- 5:15 Group discussion and consensus building: what we are going to accomplish, what are
the challenges5:15- 5:30 Wrap up – what to be thinking about for tomorrow, sign up for groups
Friday, April 16 at FANTA/AED9:00-9:15 Recap of themes, give task – by theme, what are the possible items, what are the
various ways to ask, what are possible answer choices, and what would this tell you(Bilinsky)
9:15- 11:00 Breakout into small groups by theme11:00-12:30 Report back to large group1:30- 2:15 Small group refining the task: by theme2:30- 4:30 Large group discussion to refine items, discuss indicator4:30- 5:00 Next steps

Appendix 3 of Measuring Household Food Insecurity Workshop Report, April 15-16, 2004
A4
APPENDIX 3: HOUSEHOLD FOOD INSECURITY SCALE (HFIS) DRAFT QUESTIONS
In the past 12 months...1. Have you worried that your “x” would not have enough food?
2. Was there a time when [your usual food supply ran out] or [you did not have all of the foodyou needed]?
3. Was there a time when you completely ran out of food and didn’t have any [good oracceptable or appropriate] ways of getting more?
4. Did you or any adult in your household have to limit the amount of food eaten in a daybecause there was not enough food?
5. Did you or any adult in your household have to eat fewer meals in a day because there wasnot enough food?
6. Did you or any adult in your household have to go a whole day without eating becausethere was not enough food?
7. Did any child in your household have to limit the amount of food eaten in a day becausethere was not enough food?
8. Did any child in your household have to eat fewer meals in a day because there was notenough food?
9. Did any child in your household have to go a whole day without eating because there wasnot enough food?
10. Did you or any adult in your household have to go to sleep at night hungry because therewas not enough food?
11. Did any child in your household have to go to sleep at night hungry because there was notenough food?
12. Has your family not been able to eat the way you think you should because of [lack ofresources]?
13. Did you get to the point where you had to eat foods that are not acceptable to yourculture/community because of [lack of resources]?
14. In order to meet your household food needs, did you have to do something that youdisliked?
15. In order to meet your household food needs, did you have to compromise your future foodneeds?
16. In order to meet your household food needs, did you have to compromise needs other thanfood?
17. In order to meet your household food needs, did you have to do something that you areashamed of?
18. [Did you have] or [Were you forced] to do things in order to meet your household foodneeds?

Appendix 4 of Measuring Household Food Insecurity Workshop Report, April 15-16, 2004
APPENDIX 4: Frongillo Workshop Presentation “Understanding andmeasuring the experience of household food insecurity across locationsand cultures”

1
Understanding and measuringthe experience of
household food insecurityacross locations and cultures
Edward FrongilloApril 15, 2004
Research aims
•Develop direct measures of householdfood insecurity based on in-depthunderstanding of the experience of foodinsecurity in developing countries
•Gain understanding of how to developsuch measures in an efficient manner andprovide guidance
•Identify common and unique aspects of theexperience of household food insecurityacross locations and cultures
Rationale
•Assist development organizations withplanning, targeting, monitoring, evaluation,research
•Complement other measures
Prevalence How many have the problem?Determinecauses
Why do they have the problem?
Targeting Who has the problem?Who will benefit from a solution?
Monitoring How is the situation changing?Evaluation Who has benefited and how?
Purposes for Population
Screening Is the person at risk of the problem?Diagnosis Does the person have the problem?
Will the person benefit from a solution?Monitoring Is the person's situation improving?
Purposes for Individuals (or Households)Experience
•To undergo, feel, endure, encounter
•Perception is one manifestation of experience
•Assessment through subjective report ofphysical, cognitive, and emotional reality
•Build understanding from ground up
•Use expressions of people themselves

2
Steps in developing questionnaire items
•Define and understand phenomena to bemeasured
•Break down phenomena into measurablecomponents
•Create questionnaire items to addressspecific components of phenomena
Steps in testing questionnaire items
•Assess quality of items by cognitivetesting to determine if items:
-ask a meaningful question
-use words that are understood in thesame way by developer, interviewer,and respondent
•Assess functional and quantitativeperformance of items by field testing
•Assess validity using field-test data byapplying criteria 2 to 6
Well-groundedconstruction
Depth interviews
Performanceconsistent withunderstanding
Factor analysis, patterns ofitem responses within andacross populations,cognitive testing
Precision Cronbach’s alphaDependability Not an issueAccuracy Comparison to definitive
measure, and determinantsand consequences
Attribution ofaccuracy
Explained food securitybeyond socioeconomicfactors
Criteria applied to U.S. food security measure
What are we trying to do?
•Common measurement tool to be usedeverywhere that has universal meaning?
•Specific tools for each location?
•Measurement tool with some commonitems and others that are specific?
Why would we want a common tool?
•Compare household food insecurity acrosslocations?
•Provide common language for whatinsecure households experience?
•Spare or shorten effort of organizations todevelop tool?
I. Are there universal or commonexperiences of food insecurity acrosslocations and cultures in terms of:
A. The major components?B. The specific forms that these
components take?C. How these specific forms are
expressed by people?

3
Components of food insecurity
• Insufficient food intake• Physical effects of hunger• Household food depletion• Nutritional inadequacy• Uncertainty of future food acquisition• Decreased choice and control over food• Social compromises
Specific forms for household food depletion
•Inability to afford food
•Inability to produce food
•Difficulty providing for children
•Inadequate food reserves
•Insufficient food for guests and others in need
A. Component: Household food depletionB. Form: Inability to produce enough foodC. Expressions:HA: Do you grow cereals, corn, and beans? How longdoes the harvest of these foods last? Do you also buythese foods?BC: At what interval have you purchased rice?BT: Needed to purchase rice frequently (because ownproduction ran out).BF: Did you buy cereals to feed your family becausethere wasn’t enough at home?
Different except BC and BT
II. Can there be a universally orcommonly applicable measurement tool
across locations and cultures?Three possible scenarios:• A only occurs, requiring in-depth
qualitative interviews, item development,cognitive and field testing
• A and B occur, requiring that there beitem development, cognitive and fieldtesting
• A, B, and C occur, requiring that therebe translation, cognitive and field testing
Criteria for evaluation of questions
• Conceptual basis• Performance• Discrimination• Usefulness

Appendix 5 of Measuring Household Food Insecurity Workshop Report, April 15-16, 2004
APPENDIX 5: Frongillo and Nanama Workshop Presentation “Development andvalidation of an experience-based measure of household food security inNorthern Burkina Faso”

FANTA Household Food Insecurity Workshop April 15, 2004
1
Development and validation of anexperience-based measure of householdfood security in Northern Burkina Faso
E.A. Frongillo and S. NanamaDivision of Nutritional Sciences, Cornell
University, Ithaca, NY
USAID, Washington DC, April 2004
Funded by USAID, through the FANTA project with thecollaboration of Africare
Background
! Development agencies need to measurehousehold food insecurity (FIS) for M&E
! Interest in testing whether approach used todevelop U.S. Household Food Security SurveyModule leads to valid measures in othercontexts
! Contribute to understanding universal andspecific aspects of FIS
Context
! Site: Northern BurkinaFaso
! Rural households
! Rely on home-producedfood
! FIS strongly seasonal(high in June-Sept)
Development and validation of FIS measure
! Qualitative study to identify components of FIS
! Development of items from components
! Field testing of items
! Assess validity at one point in time
! Assess validity for changes over time
Questions
1. On group basis, is FIS score consistent with the known FIS pattern over seasons?
2. Do households that improve on FIS score also improve on comparators?
Components discriminating HH FIS1. Level and reduction of daily food ration
2. Use of mother food store
3. Adult eating pattern
4. Daily concerns and uncertainty
5. Income sources
6. Utilization of income
7. Food buying patterns
8. Changes in food acquisition

FANTA Household Food Insecurity Workshop April 15, 2004
2
Data
! Data on 126 HH collected every January andJuly from July 2001 to July 2003 (5 waves)
! Survey questions on:" Food production and uses" Cash and food transfers" Livestock ownership" Dietary intake" Food insecurity (using the 22-item questionnaire) 0
5
10
15
20
25
30
35
Jul-01 Jan-02 Jul-02 Jan-03 Jul-03
Net
inco
me/
capi
ta (1
000
F)
00.10.20.30.40.50.60.70.8
Food
Sha
re
Jul-01 Jul-02 Jul-03
0
24
68
1012
14
Jul-01 Jan-02 Jul-02 Jan-03 Jul-03
Food
div
ersi
ty s
core
00.511.522.533.54
# of
eat
ing
occa
sion
s
Jul-01 Jul-02 Jul-030
2
4
6
8
10
12
Jul-01 Jan-02 Jul-02 Jan-03 Jul-03
Mea
n FI
S sc
ore
Jul-01 Jul-02 Jul-03
Analysis for Question 2
Change incomparator
Change in FIS score
Initial comparator
Initial FIS score
1 SD increase in FIS score associated with:
-0.16-0.07
0.32
-0.26-0.4-0.3-0.2-0.1
00.10.20.30.4
Coef
ficie
nt
Net income/capita #Eating occasionsFood diversity score Food share
*
*
*
* p < 0.05

Conclusion! Previous work showed validity at one point in
time
! This work provides further evidence that thequestionnaire" Captures seasonal fluctuation in FIS" Captures changes in FIS at HH level over time
! Is simple, quick, and inexpensive to administer
! Can be used for planning, monitoring, andevaluation
Acknowledgement
Africare and Africare staffJudy BrysonHarold TarverSuzanne GervaisAlison GoldbergFrancoise VermeylenColeen McCrackenVillagersField workers
Per Pinstrup-AndersenAvril ArmstrongJi-Yun HwangAnne SwindalePatricia BonnardAlice WillardTony CastlemanGilles BergeronFANTA-USAID
Appendix 6 of Measuring Household Food Insecurity Workshop Report, April 15-16, 2004
APPENDIX 6: Coates Workshop Presentation “Food Insecurity Measurementand Validation in Bangladesh”

1
Food Insecurity Measurementand Validation in Bangladesh
Presented by Jennifer CoatesApril 15, 2004
FANTA Food SecurityMeasurement Workshop
Increased annualaverage of fish (kg)marketed per HH.
Greater number offoods or food groupsconsumed.
Income sources perhousehold increase.
Households rearsmall livestock,dairy/beef cattle,chickens
Ponds are usedfor fish culture
More people areemployed formore days
Destitute womenemployed for treecare
People obtainmicrocredit
Roads improved
Schools cumdisaster sheltersconstructed
Impact?OutcomeOutputInput
PVOs lack indicators that capture the access dimension offood insecurity
Bangladesh Food Insecurity Measurementand Validation Study Objectives
• Develop and validate an experiential foodsecurity scale in Bangladesh using the USapproach.
• Explore the scale’s sensitivity to changerelated to program impact and secular trends.
Ethnography andlit review
600 householdsurvey
Candidate itemsgenerated
Scaledevelopmentand testing
Qualitativeinteractions
120 HH Sub-sample resurvey
Scalemodification
600 householdresurvey
Longitudinalchange analysis
Experiential Food Insecurity Scale Developmentand Validation Process
Nine questions about behavioral responses to foodstress successfully characterize the problem of
food insecurity
• The family ate < 3 meals per day on a regular basis• Obliged to eat wheat instead of rice (when rice
would have been preferred)• The adult respondent personally skipped entire
meals due to a lack of food in the household.• The respondent adult personally went without food
for an entire day• There were times when food stored in the house
ran out and no cash to buy more
Nine question scale about behavioral responses tofood stress has good internal consistency and
reliability(Chronbach Alpha) of 0.89, explains 47 percent of sample variance)
• Worried about where the next meal would comefrom
• Needed to purchase rice frequently (because ownproduction or purchased stores ran out)
• Took food (usually rice or lentils in kind) on creditfrom a local store
• Needed to borrow food from relatives or neighborsto make a meal

2
Bivariate Correlations of Food Insecurity Scale andPoverty Related Proxies Were Highly Significant
FAST(11) FS rating
(Correlation coefficient)
FAST(11) 1.0
Enumerator FS Rating -.73** 1.0
Total Expenditure (per capita) .44** -.47**
Expenditure Tercile .42** -.45**
Land Owned .57** -.51**
Clothing Expenditure (per cap) .36** -.38**
Productive Assets .38** -.35**
Non-Prod Assets .62** -.62**
Bivariate Correlation of Food Insecurity Scale andFood Consumption Related Proxies Were Highly
Significant FAST (11) FS rating
(Correlation coefficient)FAST 111 1.0
Enumerator Food Security Rating -.73** 1.0
Food Share in Expenditure -.41** .38**Food Expenditure Per Capita .16** -.48**
Value Foods Consumed .52** -.53**
# Food Groups .35** -.39**# Unique Foods Consumed .42** -.42**
Calorie Ratio .23** -.28**Meet 80% of Needs .15** -.20**
Anthropometric Indicators were significantlycorrelated to the Food Insecurity scale, but weakly
so (as expected)
FAST(11)
FS rating
(Correlation coefficient)
FAST (11) 1.0
Enumerator Food SecurityRating
.77** 1.0
Any Wasting -.01 .05
Any Underweight -.12* .06
Any Stunting -.14** .15**
Correlations of food insecurity scale questions andcomposite of WV/B impact indicators were
significant
FAST(9)1Enumerator
ratingWV index1
(Correlation coefficients)
FAST (9) 1.0
Enumerator FoodSecurity Rating
.86** 1.0
WV impact indicatorIndex 1
.36** .35** 1.0
On average food insecurity scale scorechanged little over time but within each foodsecurity category change was as expected.
Mean FAST (9) Score by FS Status
Mean Fast (9) Score
21
Estim
ated
Mar
gina
l Mea
ns
9
8
7
6
5
4
3
security status chng
insecure R1 & R3
secure R1 only
secure R3 only
secure R1 & R3
Food insecurity scale changed over time asexpected in relation to other access
indicators.Mean PC Cost of Foods Consumed by FS Status
PC Cost of Food Consumed
21
Estim
ated
Mar
gina
l Mea
ns
900
800
700
600
500
400
security status chng
insecure R1 & R3
secure R1 only
secure R3 only
secure R1 & R3

3
Experiential Food Insecurity Scales MeetCriteria of a Good Indicator
Inexpensive to obtaininformation
Few human resourcesto analyze data andconstruct indicator
Indicator expected tochange within DAP
cycle
Sensitive to programimpact
Adaptable to variety ofconditions
Easy to interpret
Conclusions• The approach to developing the US food
security measure can be applied successfullyin a different, developing country context.
• The module of nine questions constructed foruse in Bangladesh ‘passes’ validation teststhat were applied to the US module.
• The set of nine questions together havestrong statistical properties that measureprevalence of food insecurity, severity andchange over time.
Recommendation
• Title II PVOs should consider using anexperiential food insecurity measure asa reporting indicator of the project’s foodaccess impact.

Appendix 7 of Measuring Household Food Insecurity Workshop Report, April 15-16, 2004
APPENDIX 7: Melgar-Quiñonez, Dunford, Nord, and Johnson WorkshopPresentation “Testing Food Security Scales for Low-Cost Poverty Assessment”

1
Testing Food Security Scales forLow-Cost Poverty Assessment
Hugo Melgar-Quiñonez, MD, PhD 1
Christopher Dunford, PhD 2
Mark Nord, PhD 3
Michelle Johnson 1
1 Department of Human Nutrition, Ohio State University2 Freedom from Hunger3 Economic Research Services, USDA
Credit with Education (CwE) institutions! CRECER - Bolivia!Réseau des Caisses Populaires (RCPB) and Centre d’Innovations Financières (CIF) - Burkina Faso!FFH Ghana and the Akoti Rural Bank - Ghana! Center of Agricultural and Rural Development (CARD) - Philippines
Research firms!Agrodata - Bolivia!Research Center of University of Ouagadougou (CEDRES) – Burkina Faso!Noguchi Memorial Institute for Medical Research (NMIMR) – Ghana!CARD - Philippines
Partner institutions
! Bolivia - Achacachi altiplano - April 2003! Burkina Faso - Ouwagadogou (Plateau Central) -
June 2003! Ghana - Abura Dunkwa Northern region - August 2003! Philippines – Mindoro oriental - Dec. 2003
Study Sites – Time ! Bolivia – Spanish - Aymara! Burkina Faso – French - Moré! Ghana – English- Fanti! Philippines – English -Tagalo
Survey
! 12 candidates selected prior to training! speak the local language! previous research experience! Bachelor’s degree
Interviewers
! Writing legibility! Availability! Manual! Certification
! 300 households (~330/country)! 2/3 CwE clients; 1/3 non-clients
(both poorer and better off)! rural (2/3) and urban (1/3)! mostly women (83-96%)
Samples
! Interviewers! Focus groups with CwE clients! Survey with CwE members in 2 communities
Cognitive and FieldTesting
Final survey tool
1) Modified USDA Food Security Scale (17 items)! 9 items (yes/no)! 8 frequency questions (often/sometimes/rarely)
Adult skipped mealsAdult cut size of mealsHad to eat same food every dayFood did not lastWorried food would run out
Adult did not eat for whole dayRespondent lost weight
Respondent hungry but did not eatRespondent ate less than should
Items

2
Furniture, electrical devices, car, truck, tractor12. Durable goodsCash and goods11. Remittances
Rent in cash/goods/services; own house: estimatedpayment if rented; utilities, installations
10. Dwelling expenses and services
Public, and private health services (includingtraditional medicine), drugs, remedies, laboratory tests
9. Health
Transportation, newspapers, meals out of home,tobacco, alms and offerings
8. Daily expenses
Housecleaning, personal items/services, clothing/shoes,household equipment, others (books, repairs, gasoline,sports equipment, tourism, etc.)
7. Non-food items5. Food consumed from own business4. Food as payment for employment
Cereals, meats, fruits, vegetables, legumes, tubers,dairy, sugar, spices, beverages, oils/fats, cooking fuel
3. Food and cooking fuel
Enrolled at school, educational level, expenditures intuition, textbooks, transportation, school uniforms
2. Education(for each household member)
Demographics: household size age, relationship,marital status, head of household
1. Household roster
ItemsSection
2) Consumption Module
Food security scale! Negative responses to items coded 0! Affirmative responses to items coded 1 if response to follow–up question: - “often” or “sometimes,” - 0 for response of “rarely”! Raw food security score for the scale: 0-9 - 0 most food secure households - 9 households most severely affected by food insecurity
Food security levels! Food secure households (0-2 points)! Food insecure households without hunger (3-5 points)! Food insecure households with hunger (6-9 points)
Analysis
Analysis
Consumption module
! 12 month-aggregates for each of the sections
" total aggregate per household/year
!Divided by the number of household members and 365 days
" consumption per capita per day
" Poverty line: 1 U$ per capita per day
Rasch analysis
!The nine food security items were fitted in the scale to the single parameter Rasch model!The scale was assessed by examining item-fit statistics and the measurable range of household scores (compared with measurement error)!Dimensionality was assessed by linear factor analysis of the item-household residuals from the Rasch model, normalized by expected variance
Prevalence of Affirmative Response
0
10
20
30
40
50
60
70
80
90
Worried FoodDidn't Last
Ate SameFood
Cut Mealsize
SkippedMeal
Ate Less Hungry andidn't eat
LostWeight
Didn’t EatWhole day
Items
%
Bolivia Burkina Ghana Philippines
Measure Values
-6
-4
-2
0
2
4
6
8
Worried Didn't Last Ate Less Ate SameFood
Cut Meal Size Hungry Skipped Meal Lost Weight Whole Day
Values
Item
Bolivia Burkina Faso Ghana Philippines

3
Infit Values
0
0.2
0.4
0.6
0.8
1
1.2
1.4
1.6
Worried Didn't Last Ate Less Ate SameFood
Cut MealSize
Hungry SkippedMeal
Lost Weight Whole Day
Items
Infit
Val
ues
Bolivia Burkina Faso Ghana Philippines
Outfit Values
0
0.5
1
1.5
2
2.5
3
Worried Didn'tLast
Ate Less Ate SameFood
Cut MealSize
Hungry SkippedMeal
LostWeight
WholeDay
Item
Out
fit V
alue
Bolivia Burkina Faso Ghana Philippines
Reliability
0.990.86Philippines
0.980.85Ghana
0.990.89Burkina Faso
0.990.82Bolivia
RaschCronbach a Country
Factor Analysis
Factor analysis of standardized item-householdresiduals indicated no substantial second factor inthe response data
Table 1: Characteristics of the sample
85.810.93.00.3
11.1 (±6.6)
37.9 (±13.5)
30.969.1
63.436.6
Burkina(N=330)
19.051.126.02.7
4.9 (± 2.2)
39.3 (± 14.4)
25.774.3
66.733.3
Bolivia(N=327)
20.245.119.814.9
56.018.824.70.6
Educational level (%)Less than elementaryElementaryHigh school> than High school
5.3 (± 2.1)5.1 (± 2.1)Household size(#of persons)
34.0 (± 11.6)41.1 (±13.8)Age of interviewee (yrs)
14.086.0
50.649.4
Area of residence (%)UrbanRural
67.932.1
65.834.2
Membership in CwE (%)ClientsNon-clients
Philippines(N=349)
Ghana(N=336)Characteristic
PhilippinesGhanaBurkinaBolivia
27.0%21.5%51.5%
5.2 (±3.1)
29.7%26.9%43.4%
4.5 (±2.7)
67.0%19.2%13.8%
56.2%21.9%21.9%
Food security statusFood secure (0-2 points)Food insec. w/o hunger (3-5)Food insec. w. hunger (6-9)
2.1 (±2.6)2.7 (±2.7)Food insecurity raw score
Food Security
87.9% (290)
0.7 (±1.0)Burkina PhilippinesBolivia
53% (186)23.9% (78)Consump./cap/day = US$1Yes
0.5 (±0.5)1.7 (±1.2)Consump./cap/day (US$)
Consumption per Capita per DayppFood Security Status
0.0020.96 (±1.72) a
0.52 (±0.29) b0.56 (±0.41) b
0.00012.27 (±1.55) a1.63 (±0.83) b1.45 (±0.90) b
Food secure (0-2 points)Food insec w/o hunger (3-5)Food insec. w hunger (6-9)
0.0021.46 (±2.9) a0.66 (±0.4) b0.70 (±0.37) a
0.50 (±0.34) b0.54 (±0.22) a0.53 (±0.28) a0.49 (±0.43) a0.62 (±0.52) a0.54 (±0.34) a0.55 (±0.38) a
0.00002.48 (±0.97) a2.27 (±1.61) b2.08 (±1.93) c1.62 (±0.53) c1.66 (±1.02) c1.60 (±0.77) c1.46 (±0.67) c1.55 (±1.17) d1.40 (±0.77) d1.20 (±0.85) d
0123456789
pBurkinapBoliviaFood Security Score
Consumption/capita/day (U$) by Food security score andFood Security Status 1
1 Mean (SD) n

4
pFood SecurityStatus
0.061.62 (±1.55)1.00 (±0.83)0.78 (±0.90)
Food secure (0-2)Food insec w/o hungerFood insec. w hunger
0.141.52 (±1.19)2.67 (±7.72)1.02 (±0.67)1.15 (±1.00)0.97 (±0.51)0.80 (±0.40)0.64 (±0.17)0.84 (±0.76)0.72 (±0.32)0.96 (±0.31)
0123456789
pPhilippinesFood Security Score
Consumption/capita/day (U$) by Food security score andFood Security Status 1
1 Mean (SD) n
Mean Food Expenditure- Bolivia(B$ per capita/day) by Food Security Level
6.3
.62 c
.65 b
.35 c
.43 b
1.2 c
1.2 c
Food Insecurewith Hunger
.0000
.0001
.03
.001
.15
.003
.005
p
7.79.5Total Food
.86 b1.1 aDairy
.80 a.84 aVegetables
.41 b.56 aFruits
.37 b.60 aFish
1.5 b2.2 aMeat
1.3 b1.6 aCereals
Food Insecurew/o Hunger
FoodSecure
FoodGroup
26.6 b1.2 b
2.3 *
0.7 b
2.7
1.7 b
8.7
Food Insecurewith Hunger
.0000
.0002
.08
.002
.08
.0001
.12
p
28.1 b39.6 aTotal Food
1.4 a2.6 aDairy
2.83.3 *Vegetables
0.7 b2.0 aFruits
2.63.7Fish
2.7 b5.3 aMeat
9.610.8Cereals
Food Insecurew/o Hunger
FoodSecure
Food Group
Mean Food Expenditure- Philippines( P$ per capita/day) by Food Security Level
Mean Expenditure - Burkina(BF$/1000 per capita/day) by Food Security Level
3.4
2.2
4.32.2 b
20.3 c
2.9 b79.5 b
Food Insecurewith Hunger
0.23
0.05
0.900.000
0.04
0.003
0.003
p
3.64.6Daily
Expenses
2.04.8Health
3.84.7Housing2.4 b5.6 a
Durablegoods
20.5 b60.3 aNon-food
2.0 b6.1 aSchool
74.7 b112.6 aFood
Food Insecurew/o Hunger
FoodSecure
Item
0.000
p
1.0 (±1.7)0.6 (±0.4)
Burkina(N=330)
0.021.6 (±3.3)0.9 (±0.7)
0.0002.3 (±1.6)1.5 (±0.9)
Food secure (0-2)Food insecure (3-9)
pPhilippines(N=349)
pBolivia(N=327)
Food SecurityStatus
Consumption per capita per day (U$) byFood Security Status (2 categories)
0.07
p
4.3 (±3.41)5.3 (±3.08)
Burkina(N=330)
pPhilippines(N=349)
pBolivia(N=327)
0.0001.2 (±2.0)2.9 (±2.8)
0.0004.1 (±2.7)5.7 (±2.3)
Poverty Level > 1 U$/capita/day= 1 U$/capita/day
Food Security Score (0-9) byPoverty level (1 U$/capita/day)
p
Burkina(N=330 )
p
Bolivia(N=327)
0.0257.5%75.2%
42.5%24.8%
0.00165.5%85.9%
34.5%14.1%
Poverty level>1U$/cap/d=1U$/cap/d
Foodinsecure
Foodsecure
Foodinsecure
Foodsecure
Food security statusFood security status
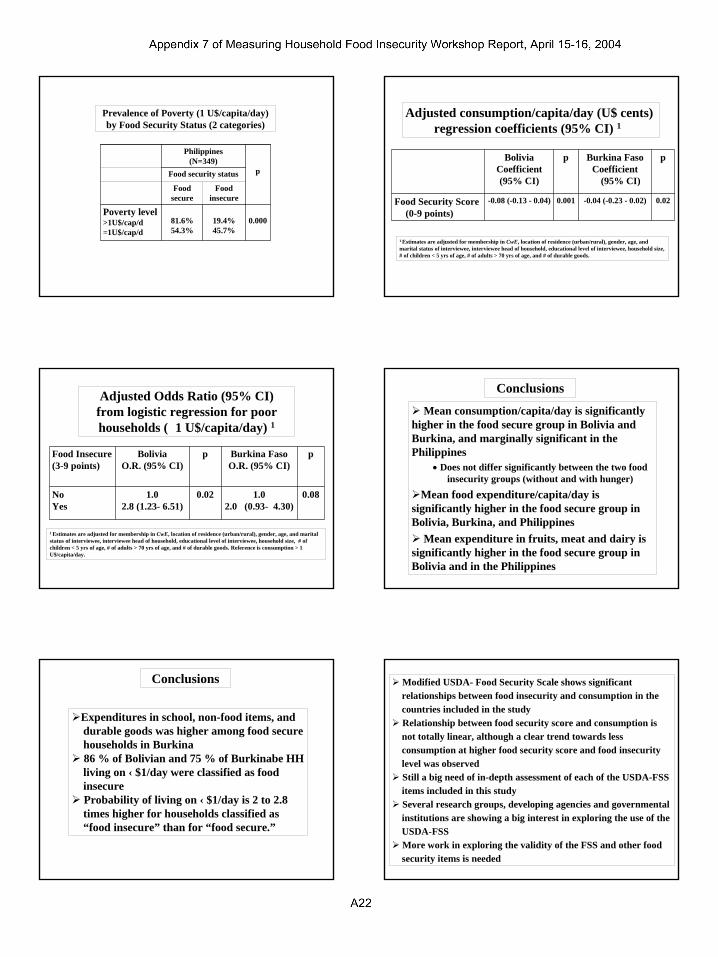
Prevalence of Poverty (1 U$/capita/day)by Food Security Status (2 categories)
5
p
Philippines(N=349)
0.00019.4%45.7%
81.6%54.3%
Poverty level>1U$/cap/d=1U$/cap/d
Foodinsecure
Foodsecure
Food security status
Prevalence of Poverty (1 U$/capita/day)by Food Security Status (2 categories)
Adjusted consumption/capita/day (U$ cents) regression coefficients (95% CI) 1
0.02-0.04 (-0.23 - 0.02)0.001-0.08 (-0.13 - 0.04)Food Security Score(0-9 points)
pBurkina FasoCoefficient
(95% CI)
pBoliviaCoefficient(95% CI)
1 Estimates are adjusted for membership in CwE, location of residence (urban/rural), gender, age, andmarital status of interviewee, interviewee head of household, educational level of interviewee, household size,# of children < 5 yrs of age, # of adults > 70 yrs of age, and # of durable goods.
0.081.02.0 (0.93- 4.30)
0.021.02.8 (1.23- 6.51)
NoYes
pBurkina FasoO.R. (95% CI)
pBoliviaO.R. (95% CI)
Food Insecure(3-9 points)
1 Estimates are adjusted for membership in CwE, location of residence (urban/rural), gender, age, and maritalstatus of interviewee, interviewee head of household, educational level of interviewee, household size, # ofchildren < 5 yrs of age, # of adults > 70 yrs of age, and # of durable goods. Reference is consumption > 1U$/capita/day.
Adjusted Odds Ratio (95% CI)from logistic regression for poorhouseholds (!1 U$/capita/day) 1
! Mean consumption/capita/day is significantlyhigher in the food secure group in Bolivia andBurkina, and marginally significant in thePhilippines
• Does not differ significantly between the two foodinsecurity groups (without and with hunger)
!Mean food expenditure/capita/day issignificantly higher in the food secure group inBolivia, Burkina, and Philippines! Mean expenditure in fruits, meat and dairy issignificantly higher in the food secure group inBolivia and in the Philippines
Conclusions
!Expenditures in school, non-food items, and durable goods was higher among food secure households in Burkina! 86 % of Bolivian and 75 % of Burkinabe HH living on ‹ $1/day were classified as food insecure! Probability of living on ‹ $1/day is 2 to 2.8 times higher for households classified as “food insecure” than for “food secure.”
Conclusions ! Modified USDA- Food Security Scale shows significant relationships between food insecurity and consumption in the countries included in the study! Relationship between food security score and consumption is not totally linear, although a clear trend towards less consumption at higher food security score and food insecurity level was observed! Still a big need of in-depth assessment of each of the USDA-FSS items included in this study! Several research groups, developing agencies and governmental institutions are showing a big interest in exploring the use of the USDA-FSS! More work in exploring the validity of the FSS and other food security items is needed

Appendix 8 of Measuring Household Food Insecurity Workshop Report, April 15-16, 2004
APPENDIX 8: Coates Workshop Presentation “The Experience and Expression ofFood Insecurity Across Cultures”

1
The Experience and Expression ofFood Insecurity Across Cultures
Jennifer CoatesApril 15, 2004
FANTA Food Security MeasurementWorkshop
Time
Availability
Access
Utilization
Vulnerability
3 Levels of Food Insecurity
Global &National
Household
Individual
Food Security definitions in US and DevelopingCountries have evolved differently
Policy-makers and Academic InstitutionsTheories
Population Experience
US: Life SciencesResearch Office
LDCs: World Bank andWorld Food Summit Experiential Food
Insecurity Scales
Incongruence between “Access” Definitionand Measurement
• Static consumption and income indicators.
• The trouble with anthropometry.
• The missing vulnerability dimension.
• Household rather than individual measures.
“An important constraint in evaluating thefood-security impacts of food availabilityand access interventions is the lack ofmeaningful and informative indicators.Most indicators chosen are not sufficientlyinformative for evaluating food-securityimpacts”. (Bonnard et al, 2002)
The Question:
• Though there is a great deal of variation inboth the causes and consequences of foodinsecurity in different countries, is there,regardless, a ‘core’ to the phenomenon itselfthat can be tapped for measurementpurposes?
2
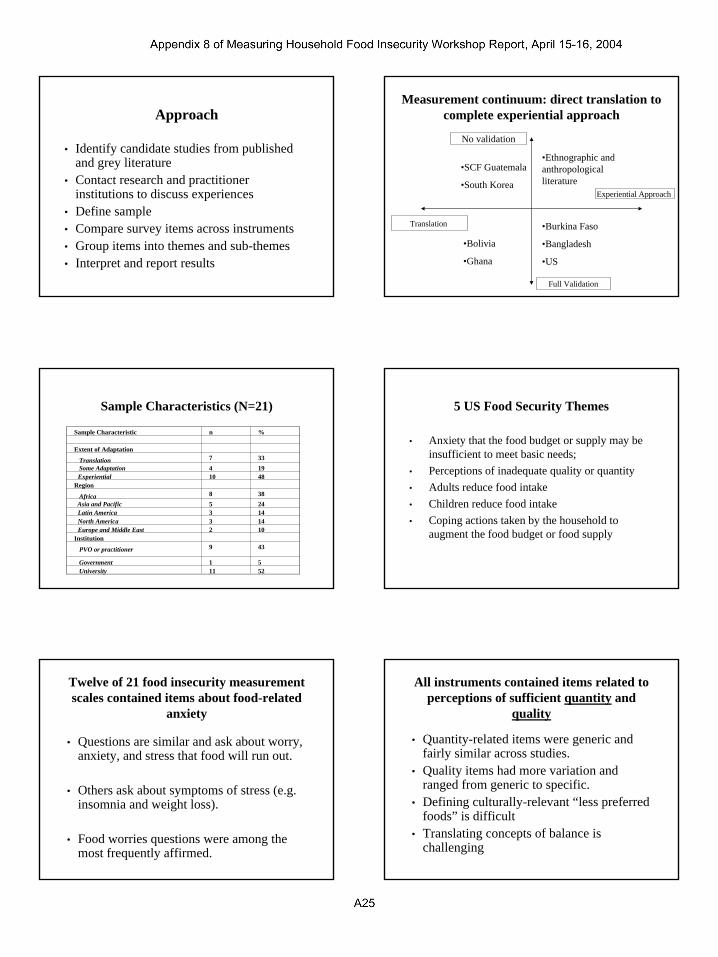
Approach
• Identify candidate studies from publishedand grey literature
• Contact research and practitionerinstitutions to discuss experiences
• Define sample• Compare survey items across instruments• Group items into themes and sub-themes• Interpret and report results
Measurement continuum: direct translation tocomplete experiential approach
No validation
Full Validation
Experiential Approach
Translation
•Bolivia
•Ghana
•Burkina Faso
•Bangladesh
•US
•SCF Guatemala
•South Korea
•Ethnographic andanthropologicalliterature
Sample Characteristics (N=21)
Sample Characteristic n %
Extent of Adaptation
Translation 7 33 Some Adaptation 4 19 Experiential 10 48Region
Africa 8 38 Asia and Pacific 5 24 Latin America 3 14 North America 3 14 Europe and Middle East 2 10Institution
PVO or practitioner 9 43
Government 1 5 University 11 52
5 US Food Security Themes
• Anxiety that the food budget or supply may beinsufficient to meet basic needs;
• Perceptions of inadequate quality or quantity• Adults reduce food intake• Children reduce food intake• Coping actions taken by the household to
augment the food budget or food supply
Twelve of 21 food insecurity measurementscales contained items about food-related
anxiety
• Questions are similar and ask about worry,anxiety, and stress that food will run out.
• Others ask about symptoms of stress (e.g.insomnia and weight loss).
• Food worries questions were among themost frequently affirmed.
All instruments contained items related toperceptions of sufficient quantity and
quality
• Quantity-related items were generic andfairly similar across studies.
• Quality items had more variation andranged from generic to specific.
• Defining culturally-relevant “less preferredfoods” is difficult
• Translating concepts of balance ischallenging

3
All scales contained items pertaining toadults reducing food intake or its
consequences
• Items represented different levels ofseverity
• There are gender differences in insecurityexperience and who sacrifices first.
• Men and women have differentresponsibilities related to food security.
Thirteen of the 21 studies contained child-referenced items about consumption
reduction.• Items were similar to adult-referenced questions in severity
range
• Children are buffered more or less in different cultures.
• Child hunger does not always imply most severeeventuality as in US.
• Ordering is interspersed with adult questions
• Such items are not applicable for households with nochildren.
All scales had coping strategy items
A Generic Categories of Coping Strategies
1. Dietary Change
2. Increase Short-term Household Food Availability
3. Decrease Numbers of People
4. Rationing Strategies
Source: Maxwell et al, 2003 P. 9.
All scales had coping strategy items
• Some distinguished between “consumption-relatedcoping” and long-term livelihood strategies.
• The same strategies do not imply same degree ofinsecurity in all cultures.
• Coping strategies can be exhausted (supplyconstraint)
Experiential Food Insecurity Scaleshave been used for:
• Monitoring and evaluation
• Food security assessments
• Early warning system
• Assessing the short-term impact of food aidinterventions in emergencies
• Targeting food aid at the household level.
Conclusions
• The five dimensions that underlie the foodinsecurity experience in the USmeaningfully discriminate between foodsecure and insecure households.
• Insecurity is a “managed process” by peoplein all the cultures surveyed.

4
Conclusions
• However, the order (and assumptions aboutthe severity indicated by each theme) ofadoption in each culture is context-specific
• There may be other themes common todifferent cultures that weren’t in the USCore Food Security Measure. Only ‘socialacceptability’ emerged here.
Conclusions
• There may be a trade-off between thegeneric phrasing for universal relevance andthe cultural specificity for comprehension.
• A handful of PVOs have tried theseexperiential food insecurity measures asindicators. Others are awaiting researchresults and concrete recommendations.