measuring hospital performances - unibg · measuring hospital performances prof. s.nuti, laboratory...
TRANSCRIPT

15/07/14
1
Measuring Hospital Performances
Prof. S.Nuti, Laboratory of Management and Healthcare, Institute of Management, Scuola Superiore Sant’Anna, Pisa (Italy)
The Italian healthcare system
It ‘s a Beveridge-like model: Universal, Comprehensive (almost),Free, Financed by general taxation. !
It is organized in three levels :!
– The national level is responsible for national health planning, including general aims and annual financial resources and for ensuring a uniform level of services, care and assistance (LEA). !
– The regional level has the responsibility for planning, organizing and managing its health care system through LHA’s activities in order to meet the needs of their population. !
– The local level (Local Health Authorities): provides care through public and/or private hospitals, primary care and prevention services.!
Sabina Nuti

15/07/14
2
Strategy
Performance evaluation systems are managerial tools able to measure strategic goals achievement
Assessment
The experience of MeS Lab on Performance Evaluation Systems (PES)
It aims to support governance system at
regional level
34 indicators, of which 23 concern performance evalua8on. Data is available on the Italian Ministry of Health’s website since 2010 in the SIVeAS sec8on: www.salute.gov.it
Network of Regions
The performance
evalua6on system at regional level
160 indicators, of which 105 concern performance evalua8on. Data is available since 2008 at the following website: www.performance.sssup.it/network
Transparency and accountability to ensure essen6al levels of care (LEA) at na6onal level
Ministry of Health
SIVeAS Project The performance
evalua6on system of regional healthcare
systems
4
It aims to support governance system at
regional level
Tuscany Region
The performance
evalua6on system at regional level
300 indicators, of which 150 concern performance evalua8on. Data is available since 2006 at the following website: www.performance.sssup.it/toscana

15/07/14
3
The regional Performance Evaluation System
Efficiency and financial performance
Employees Satisfaction
Patients Satisfaction
Clinical performance
Capacity to pursue regional strategies
Population health status
Evolution of Performance Management in Italy
6
The reference criteria for assessment bands
1. International standards, if existing (i.e.: Caesarean rate by WHO);
2. Regional standards set out by the Regional Government;
3. The regional mean, standardized by several factors to allow comparisons across Health Authorities.
15/07/14
4
7
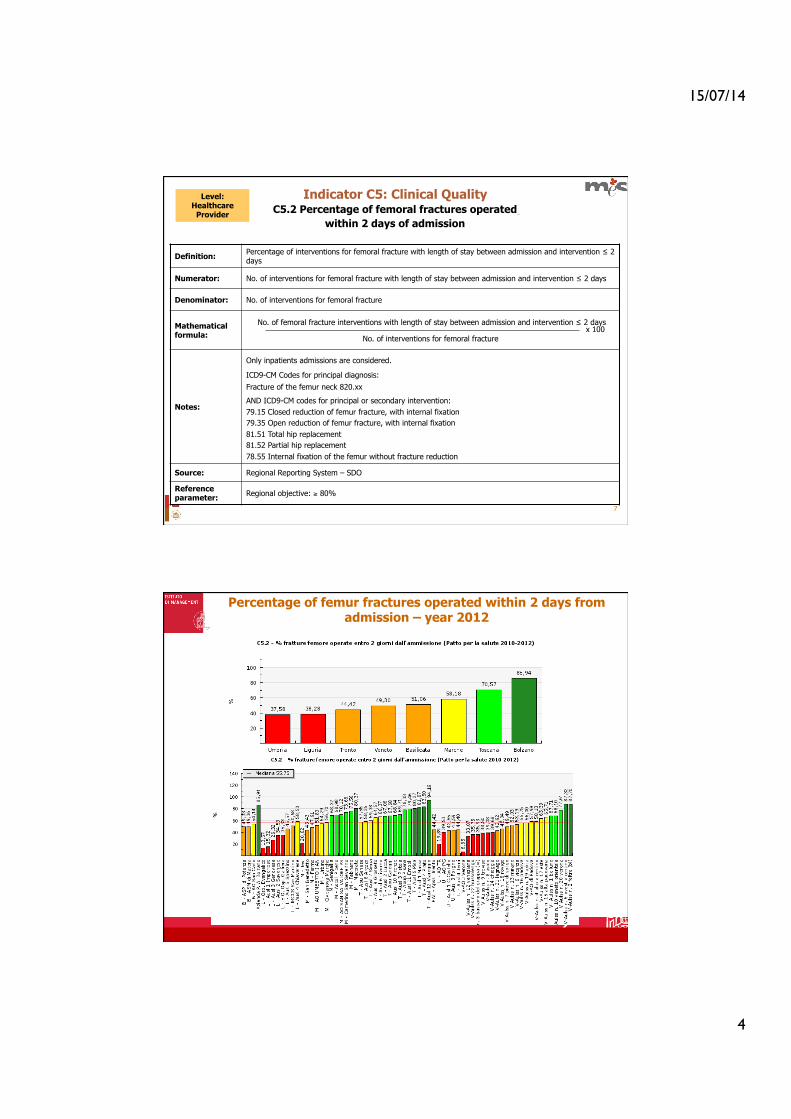
C5.2 Percentage of femoral fractures operated
within 2 days of admission
Indicator C5: Clinical Quality
Definition: Percentage of interventions for femoral fracture with length of stay between admission and intervention ≤ 2 days
Numerator: No. of interventions for femoral fracture with length of stay between admission and intervention ≤ 2 days
Denominator: No. of interventions for femoral fracture
Mathematical formula:
No. of femoral fracture interventions with length of stay between admission and intervention ≤ 2 days
No. of interventions for femoral fracture
Notes:
Only inpatients admissions are considered.
ICD9-CM Codes for principal diagnosis:
Fracture of the femur neck 820.xx
AND ICD9-CM codes for principal or secondary intervention: 79.15 Closed reduction of femur fracture, with internal fixation 79.35 Open reduction of femur fracture, with internal fixation 81.51 Total hip replacement 81.52 Partial hip replacement 78.55 Internal fixation of the femur without fracture reduction
Source: Regional Reporting System – SDO
Reference parameter: Regional objective: ≥ 80%
x 100
Level: Healthcare
Provider
Percentage of femur fractures operated within 2 days from admission – year 2012
15/07/14
5
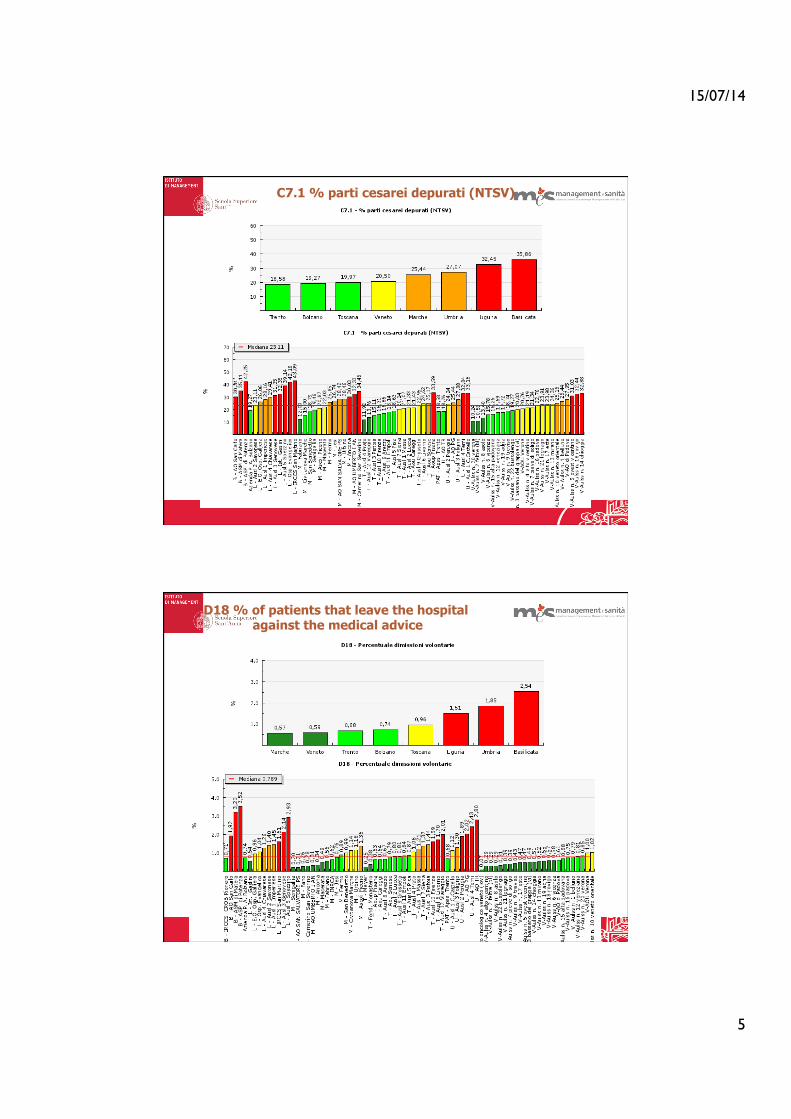
C7.1 % parti cesarei depurati (NTSV)
D18 % of patients that leave the hospital against the medical advice
15/07/14
6
11
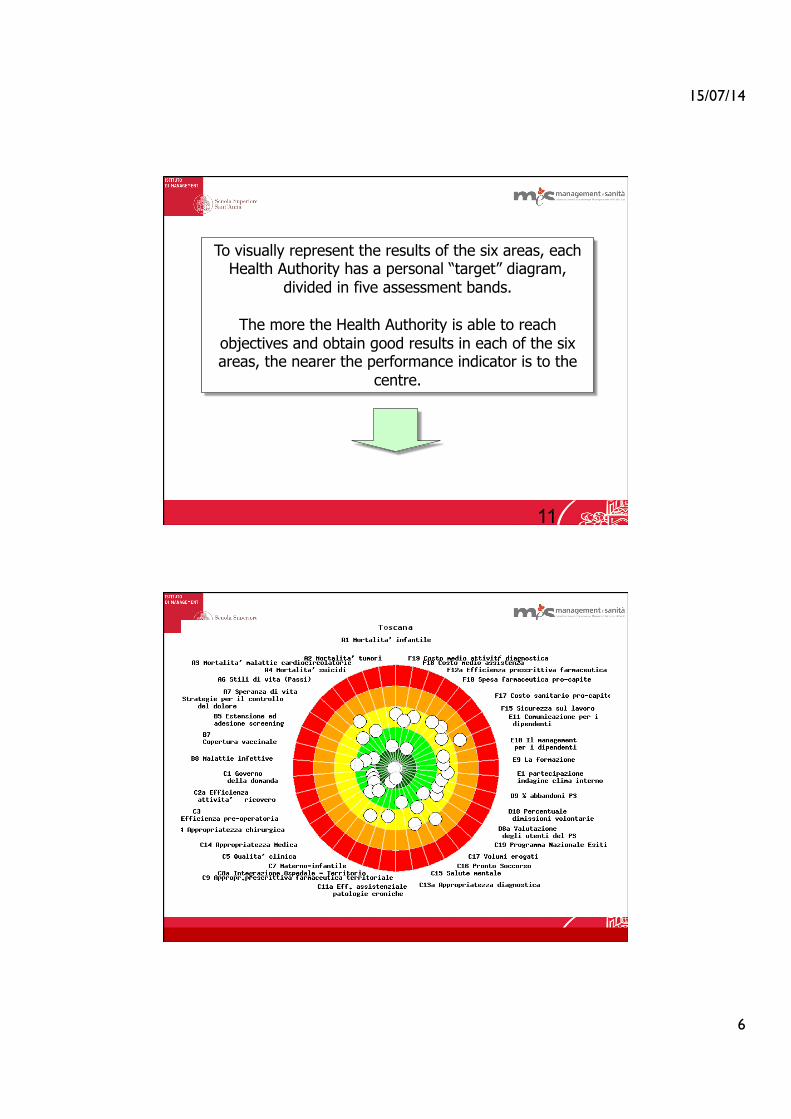
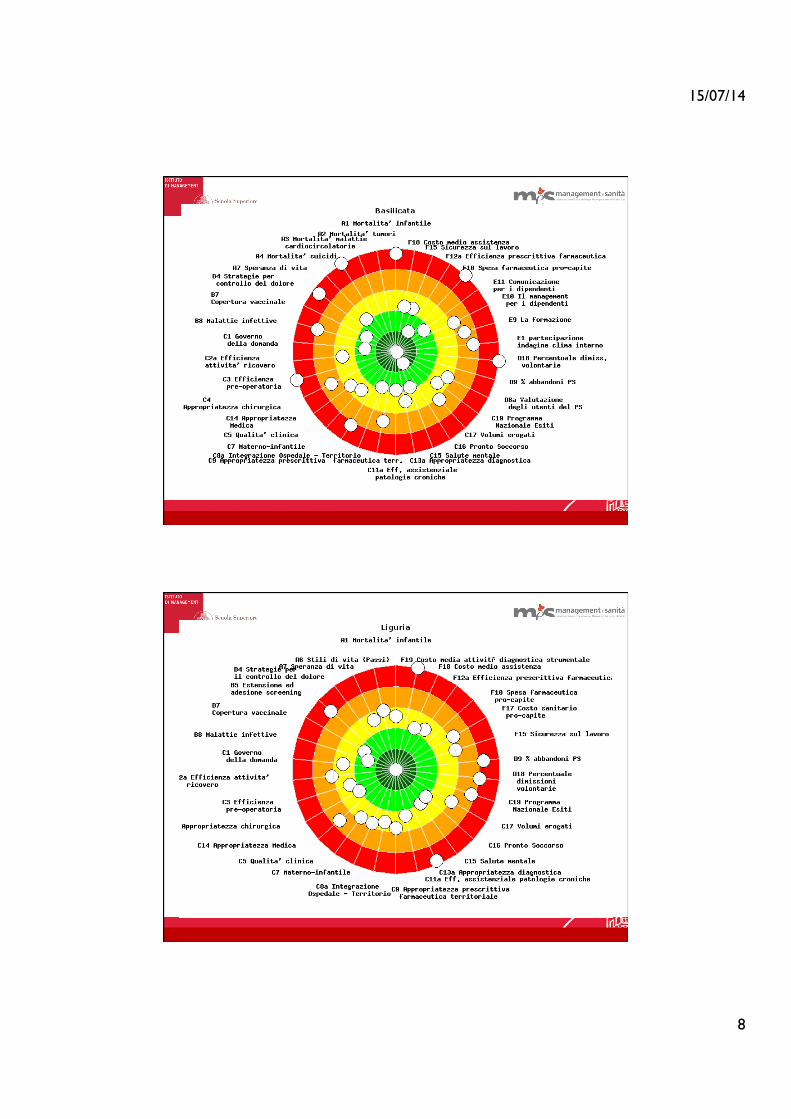
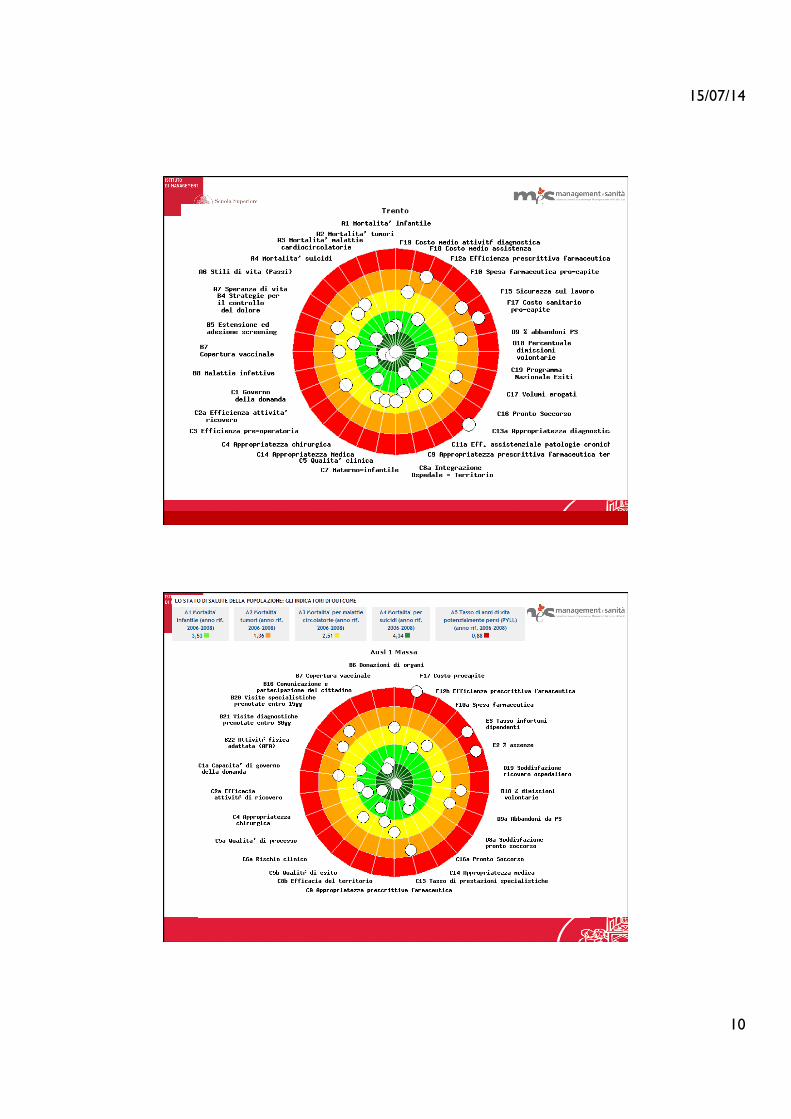
To visually represent the results of the six areas, each Health Authority has a personal “target” diagram,
divided in five assessment bands.
The more the Health Authority is able to reach objectives and obtain good results in each of the six areas, the nearer the performance indicator is to the
centre.

15/07/14
7
15/07/14
8

15/07/14
9
15/07/14
10

15/07/14
11

15/07/14
12
15/07/14
13
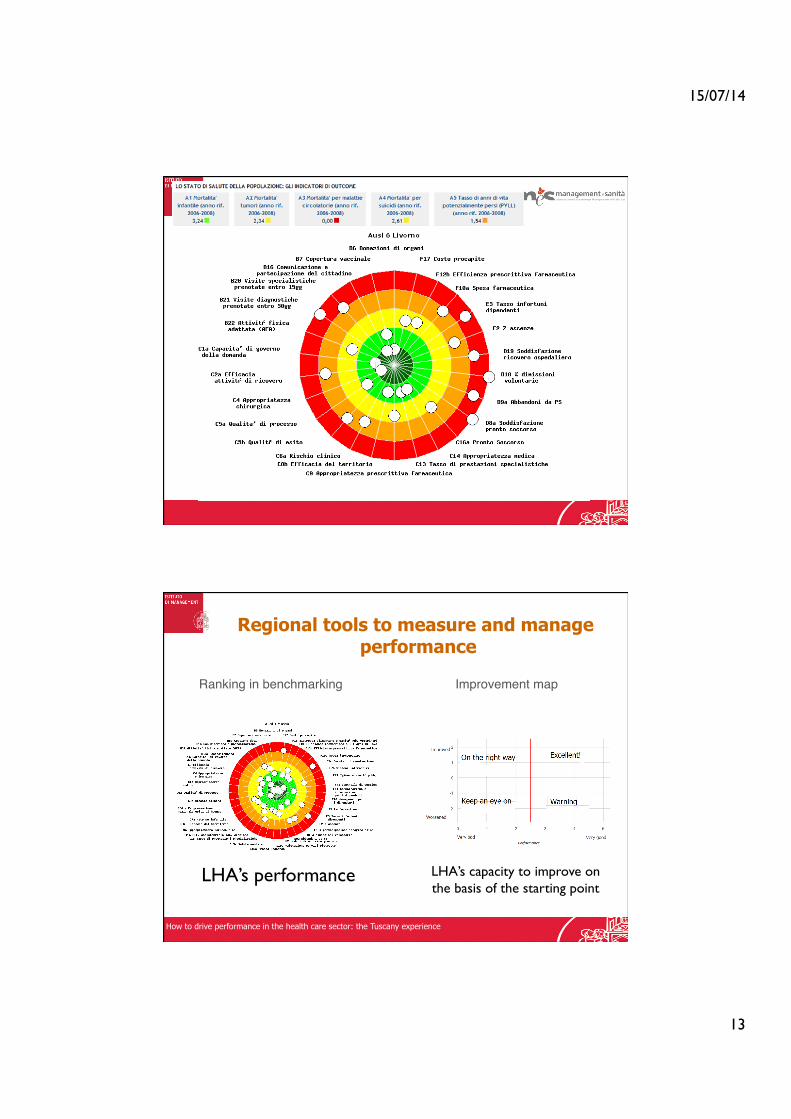
!Regional tools to measure and manage
performance
Ranking in benchmarking! Improvement map!
LHA’s performance LHA’s capacity to improve on the basis of the starting point
How to drive performance in the health care sector: the Tuscany experience

15/07/14
14
! !Hospital strategic map
On the right way
Keep an eye on
Warning
Excellent!
good bad
Wor
sene
d Im
prov
ed
Evolution of Performance Management in Italy
Roma 22 novembre 2013
"“SISTEMA DI VALUTAZIONE DELLA
PERFORMANCE DELLE AZIENDE SANITARIE” "10 aprile 2009 brevetto n. 0001358839"
!Inventore: Sabina Nuti"
TITOLARI "Scuola Superiore Sant’Anna di Pisa !
Regione Toscana!!!
"“METODO PER LA GESTIONE DI INDICATORI MULTIDIMENSIONALI DI PERFORMANCE DI
AZIENDE”"Domanda n. PI2008A000008"
!Inventori : Sabina Nuti e Domenico Cerasuolo!
TITOLARI "Scuola Superiore Sant’Anna di Pisa !
Regione Toscana!!

15/07/14
15
Does the Performance Evaluation System work?!
Improves quality"• AM. Murante, M. Vainieri, D. Rojas, S. Nuti, Does feedback influence patient - professional communication? Empirical evidence from Italy.Health Policy, doi:10.1016/j.healthpol.2014.02.001!• S.Nuti, M.Vainieri, S.Zett, C.Seghieri. Assessment and improvement of the Italian Healthcare system: first evidence from a pilot national performance evaluation system. Journal of Healthcare Management 2012 May-Jun;57(3):182-98!• S. Nuti, C.Seghieri e M. Vainieri. Assessing the effectiveness of a performance evaluation system in the public health care sector: !• some novel evidence from the Tuscany Region experience. Journal of Management and Governance 2012 DOI: 10.1007/s10997-012-9218-5!• L. Pinnarelli, S. Nuti, C Sorge, M Davoli, D Fusco N Agabiti, M Vainieri e CA Perucci What drives hospital performance? The impact of comparative outcome evaluation of patients admitted for hip fracture in two Italian regions, Bmj Quality & Safety Vol 21, p127-134, 2012!!
Reduces variability"• Nuti S., Seghieri C. (2014), Is variation management included in regional healthcare governance systems? Some proposals from Italy , Health Policy , pp. 71-78,!!
Supports the budgeting process"• S.Nuti, A.Bonini, M.Vainieri “Disinvestment for reallocation: a process to identify priorities in healthcare” Health Policy, Vol 95 pp137-143, 2010.!
!
Regions involved in the performance
evaluation system:
• Veneto • Toscana • Liguria • Umbria
• PA Trento • PA Bolzano
• Marche • Basilicata
• Emilia • Friuli
30
Evolution of Performance Management in Italy

15/07/14
16
Review of the interna6onal PES steps
Starting point
Map best practice interventions
Review the first data
The team:
1. Tuscany region 2. Quebec 3. Valencia
Region 4. The
Netherlands 5. Wales
6. Portugal
§ Define the goals and settings of the
Performance Framework.
§ First set of shared performance metrics
• Review of the first data in
benchmarking Synthesise which metrics will best
reflect performance
across the different healthcare systems
32
… But what should be analysed measuring Hospital performance?
Can Hospital performance be measured alone?
REGIONAL SYSTEM
PERSPECTIVE
HOSPITAL PERSPECTIVE

15/07/14
17
33
HOSPITAL PERSPECTIVE
Volumes
Quality of care for Hospital services users
Financial sustainability
34
REGIONAL HEALTH SYSTEM ?
The great challenge is to shift from Hospital service users to patients
and Polulation perspectives…

15/07/14
18
Veterans’ Health Administration problems (1994)
Reform Principles VA (1995-1999)
Improvements in outcomes (examples)
Hospital-focused, specialist-based, episodic treatment of illness
Clarity of vision and strategic goals Universal Primary Care Integrated Service Networks Capitation based resource allocation Shift to ambulatory care Performance management program: alignment of accountability and performance measures Modernization of information management
Diabetes control improved from 51% to 94% Screening for cervical cancer from 62% to 93% Use of beta blockers for myocardial at discharge from hospitals from 70% to 95% American Customer Satisfaction Index: the VA bested the private sector’s mean healthcare score of 68 on a 100-point scale for years 2000 to 2003 Average cost per patient reduced by 25% over same time period
Independent, competing medical centers Lack of integration of health care services
Too much inter-facility variation
Care too difficult to access
Staff demoralized
Centralized, hierarchical, top-down micro-management
Reams of rigid policies and procedures
Capital investment decisions too political
Organization too inwardly focused
There are a number of views on what makes a health system high-‐performing…
The Veteran’s Health Administra1on (US) experience…
• Ensure universal coverage • Provision of care that is free at the point of use • Delivery system should focus on the prevention of ill health • Priority is given to patients to self manage their conditions, with support from carers
and families • Priority is given to primary health care • Population management is emphasized • Care should be integrated to enable primary health care teams to access specialist
advice and support when needed • Exploit potential benefits of information technology in improving chronic care • Ensure that care is effectively coordinated • Link these nine characteristics into a coherent whole as part of a strategic approach
to change
1 C.Ham, Health Economics, Policy and Law (2010), 5, 71–90
There are a number of views on what makes a health system high-performing… Chronic Disease (Kaiser Permanente, other systems)1 addresses system design
15/07/14
19
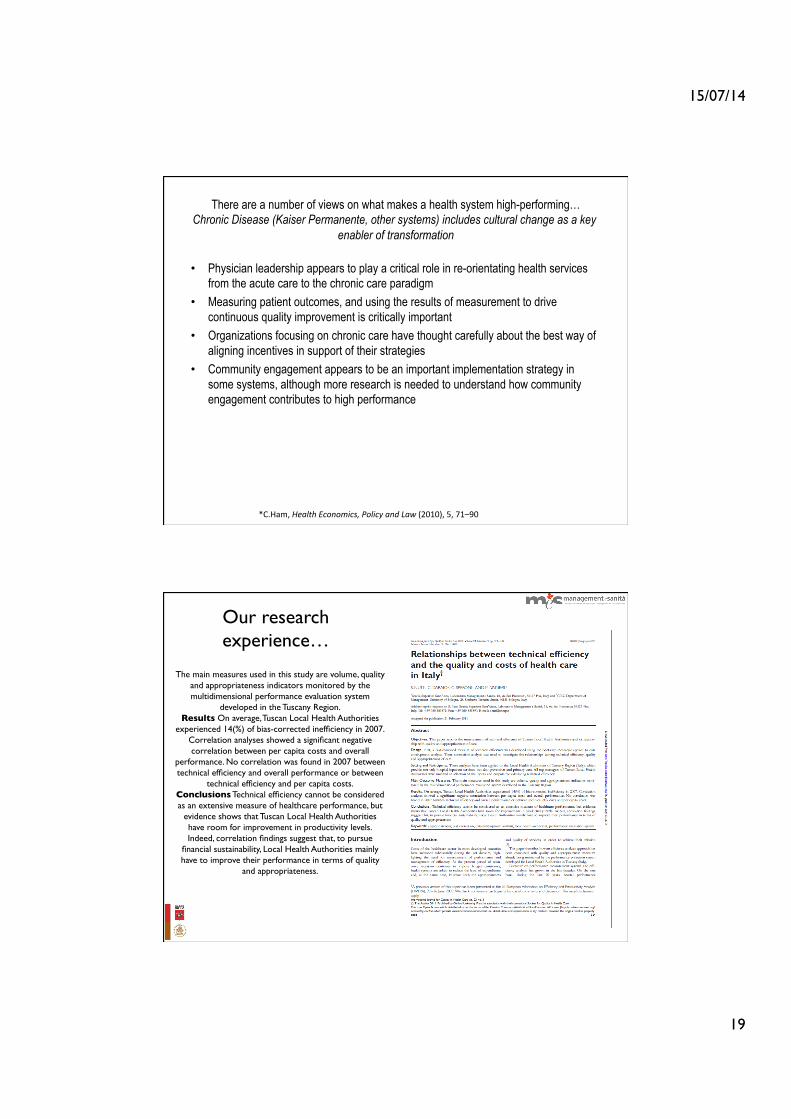
There are a number of views on what makes a health system high-performing… Chronic Disease (Kaiser Permanente, other systems) includes cultural change as a key
enabler of transformation
• Physician leadership appears to play a critical role in re-orientating health services from the acute care to the chronic care paradigm
• Measuring patient outcomes, and using the results of measurement to drive continuous quality improvement is critically important
• Organizations focusing on chronic care have thought carefully about the best way of aligning incentives in support of their strategies
• Community engagement appears to be an important implementation strategy in some systems, although more research is needed to understand how community engagement contributes to high performance
*C.Ham, Health Economics, Policy and Law (2010), 5, 71–90
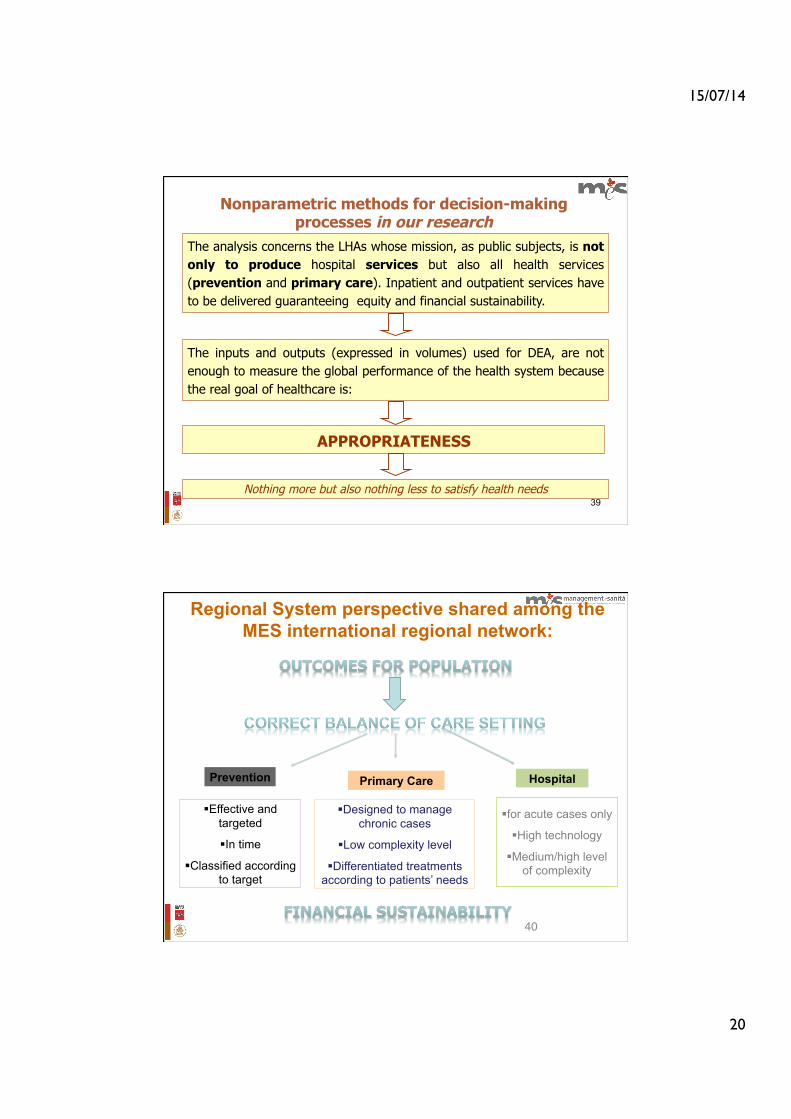
The main measures used in this study are volume, quality and appropriateness indicators monitored by the multidimensional
performance evaluation system developed in the Tuscany Region. Results On average, Tuscan Local Health Authorities experienced 14(%)
of bias-corrected inefficiency in 2007. Correlation analyses showed a significant negative correlation between per capita costs and overall performance. No correlation was found in 2007 between technical
efficiency and overall performance or between technical efficiency and per capita costs.
Conclusions Technical efficiency cannot be considered as an extensive measure of healthcare performance, but evidence shows that Tuscan Local Health Authorities have room for improvement in productivity
levels. Indeed, correlation findings suggest that, to pursue financial sustainability, Local Health Authorities mainly have to improve their
performance in terms of quality and appropriateness.
The main measures used in this study are volume, quality and appropriateness indicators monitored by the multidimensional performance evaluation system
developed in the Tuscany Region. Results On average, Tuscan Local Health Authorities
experienced 14(%) of bias-corrected inefficiency in 2007. Correlation analyses showed a significant negative correlation between per capita costs and overall
performance. No correlation was found in 2007 between technical efficiency and overall performance or between
technical efficiency and per capita costs. Conclusions Technical efficiency cannot be considered as an extensive measure of healthcare performance, but
evidence shows that Tuscan Local Health Authorities have room for improvement in productivity levels. Indeed, correlation findings suggest that, to pursue
financial sustainability, Local Health Authorities mainly have to improve their performance in terms of quality
and appropriateness.
Our research experience…
15/07/14
20
39
The inputs and outputs (expressed in volumes) used for DEA, are not enough to measure the global performance of the health system because the real goal of healthcare is:
Nonparametric methods for decision-making processes in our research
The analysis concerns the LHAs whose mission, as public subjects, is not only to produce hospital services but also all health services (prevention and primary care). Inpatient and outpatient services have to be delivered guaranteeing equity and financial sustainability.
APPROPRIATENESS
Nothing more but also nothing less to satisfy health needs
§ for acute cases only
§ High technology
§ Medium/high level of complexity
Hospital
§ Designed to manage chronic cases
§ Low complexity level
§ Differentiated treatments according to patients’ needs
Primary Care
Regional System perspective shared among the MES international regional network:
40!
§ Effective and targeted
§ In time
§ Classified according to target
Prevention

15/07/14
21
41
The current set of 34 System Performance Indicators is based on member feedbacks (1/2)
Code Indicators and sub-indicators
C1.1.1 Age/Sex adjusted hospitalization rate for acute inpatient admissions per 1,000 residentsC1.3 Number of beds per capita C2.1 Average Lenght of StayC4.7 Percentage of interventions performed in Day-Surgery for selected DRGs C4.7b Rate of interventions performed in day surgery for selected DRGsC5.1 Readmissions within 30 days C5.2 Percentage of femur fractures operated within 2 days from admission C7.1 Percentage of NTSV caesarean births
C8a.19.1 Hospitalization rate for paediatric asthma per 100,000 residents (2-17 years)C11a.7.1 Chronic Obstructive Pulmonary Disease (COPD) admissions rate per 100,000 residents, 15+ yearsC11a.8.1 Diabetes Short-term Complications Admission Rate , 15+ yearsC11a.9.1 Uncontrolled diabetes admission rate , 15+ yearsC11a.10.1 Diabetes Long-term Complications Admission Rate , 15+ yearsC11a.11.1 Congestive Heart Failure (CHF) admission rate
C8a.3 Underage conception rate per 1,000 (women, 12-17 years)Major amputation rate for diabetes per million residents ED utilization rate
Hospital/clinical evaluation
Ambulatory Care Sensitive Conditions Hospitalization
Area-Hospital Integration
42
The current set of 34 System Performance Indicators is based on member feedbacks (2/2)
b25.1 Age–gender standardised hospitalization rates for hip replacementb25.2 Age–gender standardised hospitalization rates for knee replacementb25.3 Age–gender standardised hospitalization rates for cholecistectomyb25.4 Age–gender standardised hospitalization rates for PCIb25.5 Age–gender standardised hospitalization rates for tonsillectomyb25.6 Age–gender standardised hospitalization rates for histerectomyb25.7 Age–gender standardised hospitalization rates for vein strippingb25.8 Age–gender standardised hospitalization rates for colectomyb25.9 Age–gender standardised hospitalization rates for Transurethral Prostatectomy
C8a.13 Hospitalization rate for adult psychiatric patientsC8a.13.1 Average Lenght of Stay - adult psychiatric patientsC8a.13.2 Percentage of readmissions for adult psychiatric patients within 30 daysC8a.13.3 Percentage of readmissions for adult psychiatric patients within 7 days
C13.2.1 Age/Sex adjusted CT performance rate per 1,000 residentsC13.2.2 Age/Sex adjusted MRI performance rate per 1,000 residents
C5.4 Avoidable mortality
F17 Health expenditure per capita
Outpatient services
Healthcare Expenditures
Outcomes
Geographic variability
CLINICAL PATHWAYSMental health
15/07/14
22
43
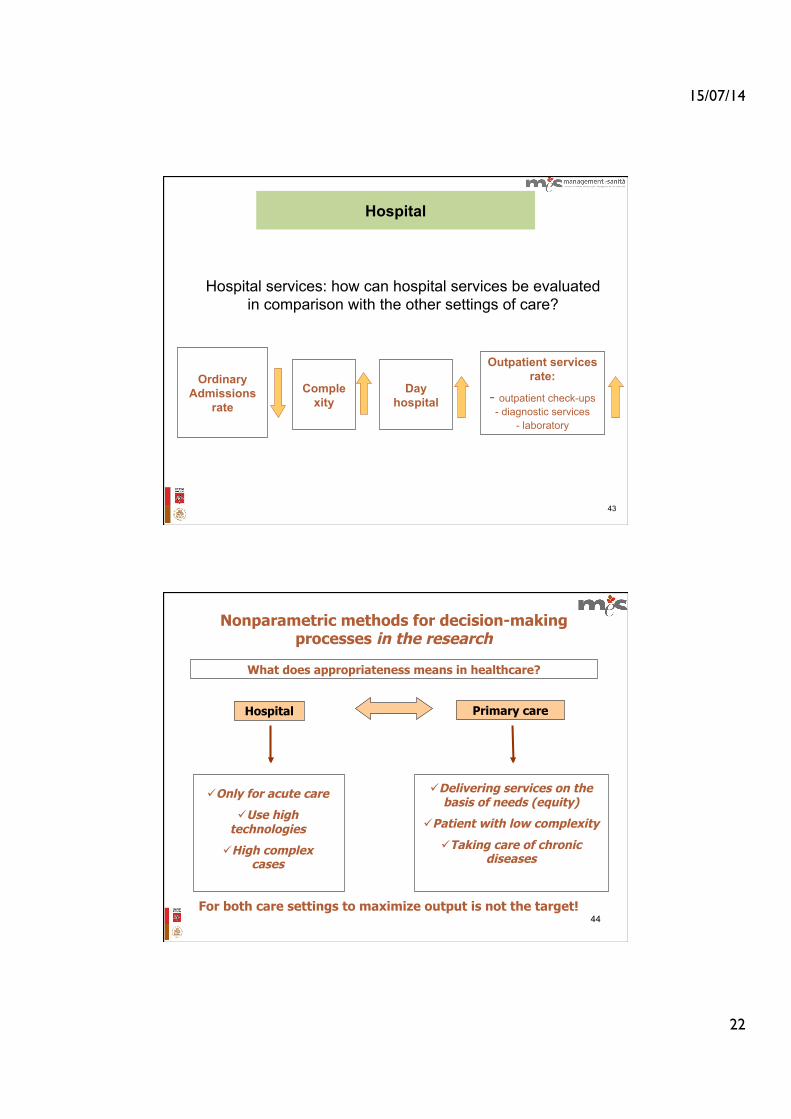
Hospital services: how can hospital services be evaluated in comparison with the other settings of care?
Comple xity
Day hospital
Outpatient services rate:
- outpatient check-ups - diagnostic services
- laboratory
Ordinary Admissions
rate
Hospital
44
ü Delivering services on the basis of needs (equity)
ü Patient with low complexity
ü Taking care of chronic diseases
What does appropriateness means in healthcare?
ü Only for acute care
ü Use high technologies
ü High complex cases
Hospital Primary care
Nonparametric methods for decision-making processes in the research
For both care settings to maximize output is not the target!
15/07/14
23
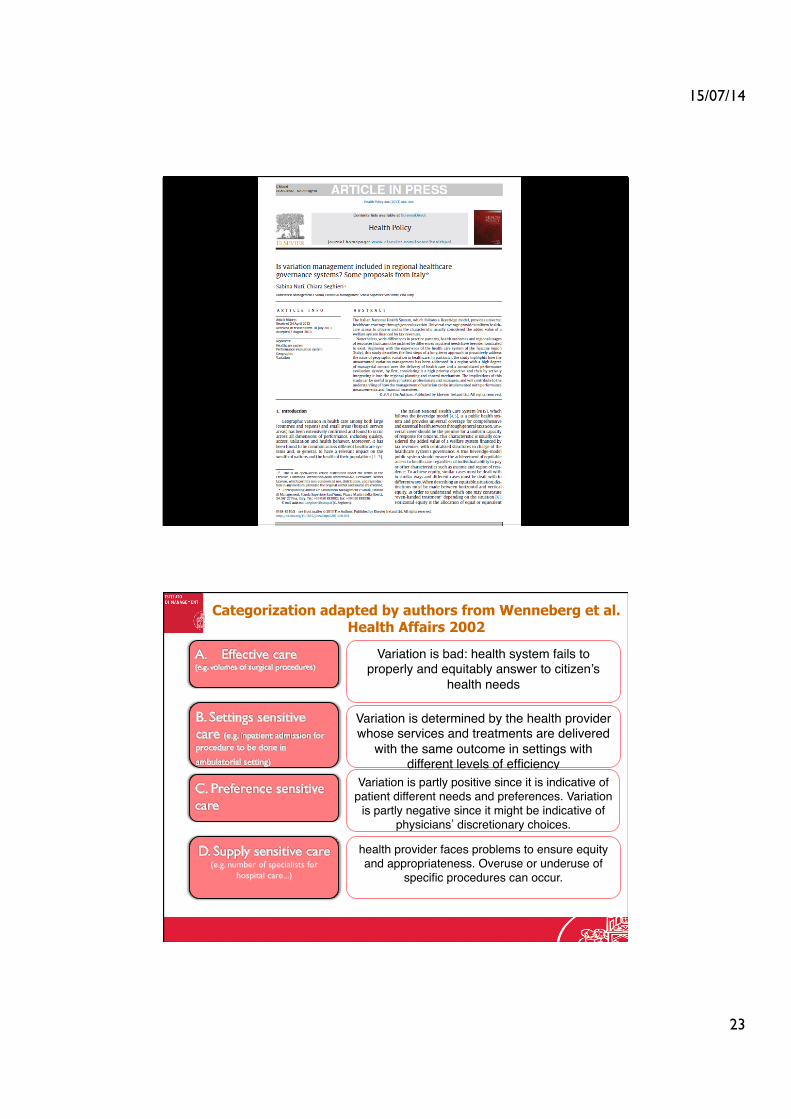
(e.g. number of specialists for hospital care...)
Categorization adapted by authors from Wenneberg et al. Health Affairs 2002
Variation is bad: health system fails to properly and equitably answer to citizen’s
health needs
Variation is determined by the health provider whose services and treatments are delivered
with the same outcome in settings with different levels of efficiency
Variation is partly positive since it is indicative of patient different needs and preferences. Variation
is partly negative since it might be indicative of physicians’ discretionary choices.!
health provider faces problems to ensure equity and appropriateness. Overuse or underuse of
specific procedures can occur.

15/07/14
24
Categorization adapted by authors from Wenneberg et al. Health Affairs 2002
! ! !! !How to manage health services ?
There are standards that can be followed
No standards…
how to cope with it? Over/Underuse may occur not justified by patients’ preferences
Standardized hospitalization rate by sex and age for colecistechtomy per 100.000 inhabitans- Italy, Year 2011
Elaboration by Laboratorio MeS and PNE - Agenas
15/07/14
25
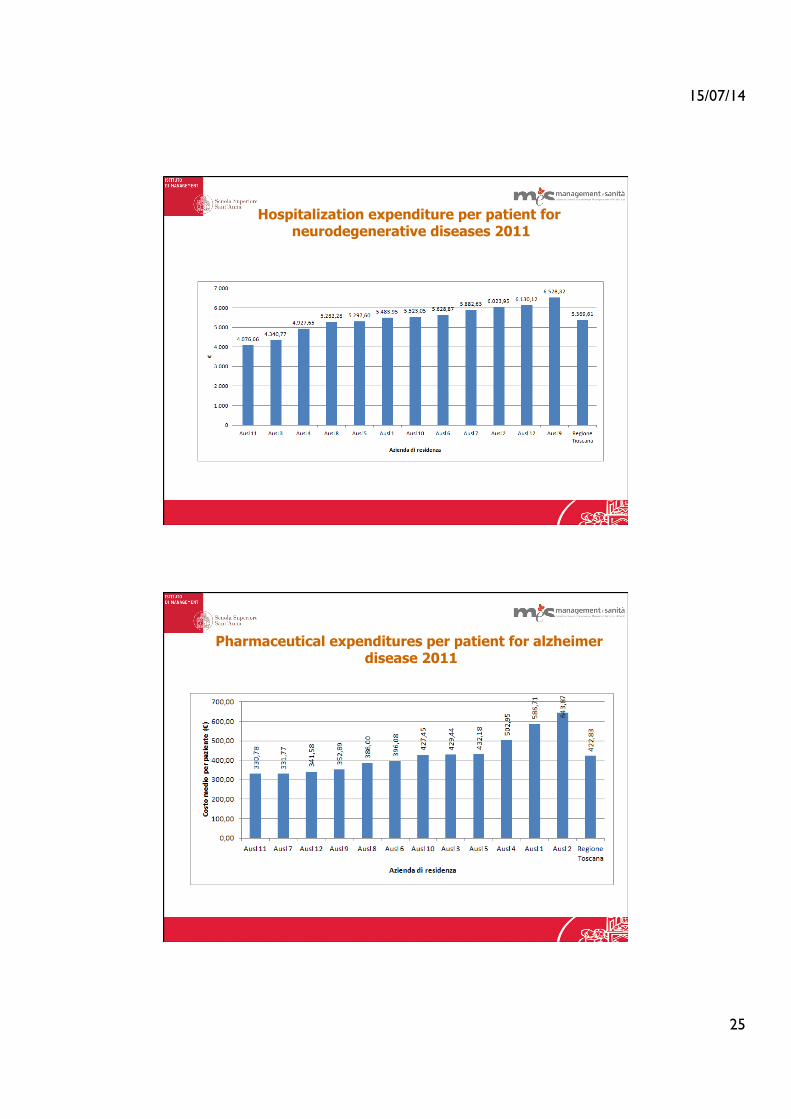
Hospitalization expenditure per patient for neurodegenerative diseases 2011
Pharmaceutical expenditures per patient for alzheimer disease 2011
15/07/14
26
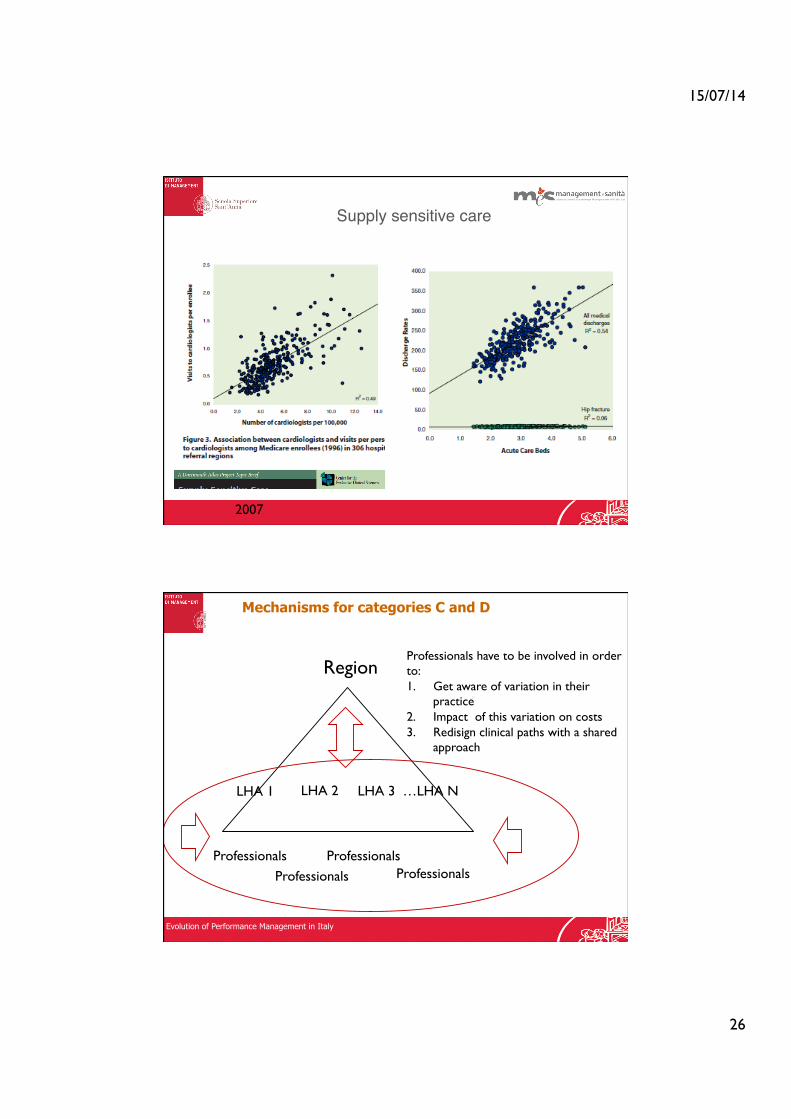
! ! !! ! ! ! !Supply sensitive care!
2007
!Mechanisms for categories C and D
Region
LHA 1 LHA 2 LHA 3 …LHA N
Professionals Professionals
Professionals Professionals
Professionals have to be involved in order to: 1. Get aware of variation in their
practice 2. Impact of this variation on costs 3. Redisign clinical paths with a shared
approach
Evolution of Performance Management in Italy

15/07/14
27
Beyond the numbers: professionals… and organizations
The case of diabetic foot: Major diabetes-related major amputation rate per million residents in Tuscan Local Health Authorities (LHAs), 2009-2011.
Differences could not be fully explained by the diabetes prevalence across LHAs
My cases are more complex because I work in the regional reference centre
! !The approach followed to detangle differences!
Qualitative analyses!
Quantitative analyses!
Cost and specific analyses !
Record linkages*!
Outpatient surveys!
Visits to the point of care!
Interviews to professonals!
* Patients who were amputated in 2011 for the first time. Data analyses concerned consumption and treatments of 2011 and years ahead of the amputation.

15/07/14
28
THE CASE OF DIABETIC FOOT PATH OF CARE: Has each patient been taken in charge in outpatient clinics before amputation? (n=123. Period: 2009-2011)
0
500
1000
1500
2000
2500
PZ14
PZ10
9
PZ10
2
PZ19
PZ98
PZ
3
PZ80
PZ
9
PZ72
PZ11
1
PZ23
PZ85
PZ46
PZ84
PZ32
PZ16
PZ50
PZ95
PZ74
PZ11
4
PZ94
PZ82
PZ10
7
PZ37
PZ54
PZ56
PZ86
PZ10
PZ89
PZ25
PZ45
PZ83
PZ11
9
PZ11
2
PZ11
6
PZ35
PZ66
PZ24
PZ92
PZ87
PZ79
PZ31
PZ41
PZ10
1
PZ12
PZ43
PZ76
PZ75
PZ18
PZ44
PZ22
PZ88
PZ77
PZ11
3
PZ11
5
PZ39
PZ58
PZ10
5
PZ38
PZ42
PZ93
PZ10
0
PZ10
6
PZ28
PZ67
PZ10
3
PZ10
8
PZ55
PZ21
PZ26
PZ12
1
PZ20
PZ97
PZ12
2 PZ
6
PZ36
PZ73
PZ52
PZ99
PZ15
PZ
8
PZ62
PZ47
PZ
5
PZ11
0
PZ59
PZ11
PZ65
PZ63
PZ17
PZ64
PZ68
PZ90
PZ57
PZ30
PZ
4 PZ
7
PZ96
PZ11
8
PZ34
PZ27
PZ61
PZ69
PZ70
PZ40
PZ10
4
PZ29
PZ51
PZ49
PZ60
PZ
2
PZ91
PZ
1
PZ78
PZ13
PZ33
PZ81
PZ53
PZ11
7
PZ48
PZ71
PZ12
0
Nu
mb
er o
f A
cces
ses
Patients
Number of accesses in outpatient clinics for each patient in the sample group (n=123)
Before amputation After amputation
Patients with very high number of procedures in outpatient
clinics
3 Patients with NO ACCESSES before being amputated: Need for specific
AUDIT among providers
“ P a t h w a y a n a l y s i s a n d periodical peer-review results monitor ing, working on population based data…
some results… “Pathway analysis and periodical peer-review” Cost analyses allowed the professionals to reflect upon the resources needed for their patients’ pathways, to make them more aware of the impact of their choices and to enhance discussions on potential reallocations to improve value for money for their LHA residents.
Closing the gap between measurement and improvement in the diabetic foot care pathway
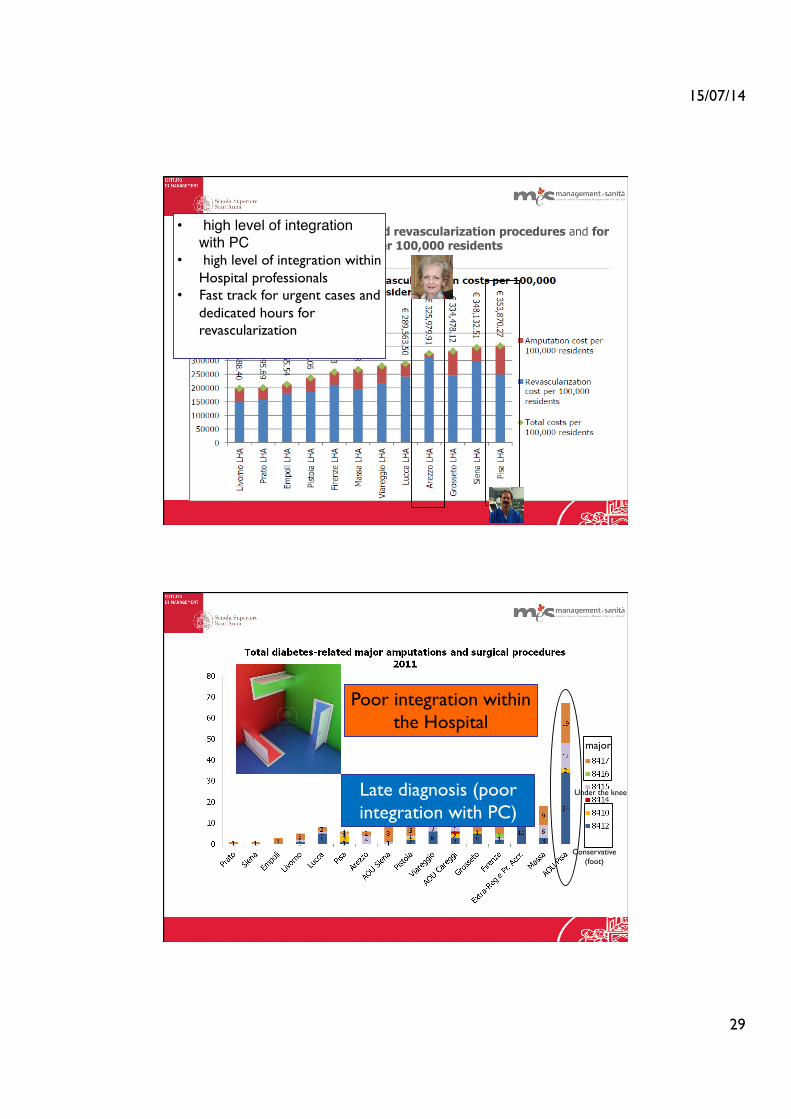
A key example: t h e LHA c o s t p e r 100,000 residents of the hospitalizations for d i a b e t e s - r e l a t e d revascularizations and major amputations at lower limbs estimated c o n s i d e r i n g t h e 2009-2012 average.
These differences and geographic variations showed room for improvement, achievable by reallocating resources from intensive care for amputations to preventative interventions that can save limbs and enhance the patients’ quality of life. The best performer did not show low overall costs but a cost-mix sharply oriented towards revascularization procedures.
15/07/14
29
§ Annual costs for diabetes-related revascularization procedures and for diabetes-related amputations per 100,000 residents
• high level of integration with PC!
• high level of integration within Hospital professionals
• Fast track for urgent cases and dedicated hours for revascularization
Conservative (foot)
major
Under the knee Late diagnosis (poor integration with PC)
Poor integration within the Hospital

15/07/14
30
I always do my best for my patients and I thought to be on the right way. The population based perspective helped me to
have a look at the entire path of the patients. I realized that our integration with the other professionals (namely PC)
has to be boosted. Moreover this analysis allowed me to have data and results that I can use to reorganize the
pathway within the hospital wall.
A shared proposal from professionals to regional health department !
A REGIONAL PROTOCOL FOR DIABETIC PATHWAY (focusing on integration between PC and H )!
AND A SPECIFIC DOCUMENT FOR THE DIABETIC FOOT PATH!
!
!
!
!
Conclusions 1. foster the analysis of results with a benchmark perspective: an inward-looking perspective should be avoided and a constructive and shared comparison of data at a regional level should be enhanced overcoming organizational boundaries among healthcare settings by involving the professionals in a constructive approach which periodically peer-reviews measures and experiences based on population data 2. It is essential to shift professionals’ attitudes towards “population medicine”: professionals should be involved in the decisions on resources allocation in order to foster a shared responsibility as “public health professionals” <<to the population they serve, to the patients they never see, as well as to the patients who have consulted or been referred>>. To support this process, the analyses of data on clinical services should be complemented with a benchmarking comparison of their different impact on HA budgets when rea l loca t ing resources fo r pa t ien t va lue improvement.

15/07/14
31
Mes Bibliography!
1. Nuti S., Seghieri C. (2013 online first), Is variation management included in regional healthcare governance systems? Some proposals from Italy , Health Policy.!
2. Nuti S., Vainieri M. (2012), Managing waiting times in diagnostic medical imagining, British Medical Journal Open 2012;2:e001255.!
3. Nuti S., Seghieri C., Vainieri M. (2012), Assessing the effectiveness of a performance evaluation system in the public health care sector: some novel evidence from the Tuscany Region experience, The Journal of Management and Governance, May 2012, n. pag. 10.!
4. Nuti S., Seghieri C., Vainieri M., Zett S. (2012), Assessment and improvement of the Italian Healthcare system: first evidences from a pilot National performance evaluation system, Journal of Healthcare Management, Vol. 57, No. 3, pp. 182-199.!
5. Pinnarelli L., Nuti S., Sorge C., Davoli M., Fusco D., Agabiti N., Vainieri M., Perucci C. (2012), What drives hospital performance? The impact of comparative outcome evaluation of patients admitted for hip fracture in two Italian regions., British Medical Journal BMJ Quality and Safety, Vol. 21, No. 2, pp. 127-134.!
6. Nuti S., Daraio C., Speroni C., Vainieri M. (2011), Relationships between technical efficiency and the quality and costs of health care in Italy, International Journal for Quality in Health Care, Vol. 23, No. 3, pp. 324-330.!
7. Report of Tuscany PES in english: www.meslab.sssup.it/en/index.php?page=report-2010 !