measuring food insecurity: global estimates
TRANSCRIPT

Measuring Food Insecurity: Global Estimates
Nanak Kakwania and Hyun H. Son
b
a: University of New South Wales, Australia ([email protected]) b: Asian Development Bank, Philippines ([email protected])
Abstract: Food insecurity is a complex development issue dealing with physical and economic constraints to safe and nutritious food to maintain healthy living. The typical measurement of food insecurity involves comparing calorie consumption with a fixed requirement value. This paper proposes a new approach to measuring food insecurity by estimating the per capita monetary cost of a food basket that provides a balanced diet through adequate nutrients including calories, protein, fat and carbohydrates to maintain good health. The per capita monetary cost of food is calculated in terms of US dollars based on the 2011 Purchasing Power Parity to compare estimates across countries. Households or individuals are likely to struggle with food insecurity if their access to food sufficient to meet their nutritional needs is limited by lack of resources. The findings reveal substantial progress in reducing global food insecurity during 2002–2012. In just one decade, the percentage of people suffering from hunger notably decreased from 23.05% in 2002 to 10.01% in 2012, with more than 576 million people lifted out of food insecurity. Despite such progress, some 557 million people in the globe still face food insecurity. Food insecurity remains prevalent in Sub-Saharan Africa.
Keywords: Food security, hunger, poverty, undernutrition, malnutrition JEL Classification: I32, O15, O20, O57

2
1. Introduction
Food is a basic necessity. But in some parts of the world, having three meals a day or even two is a luxury. This injustice illustrates the concept of food insecurity. Food insecurity is about some people not knowing if and when their next meal will come, and not being able to afford the food they want to eat. Food security can be ensured if people can always buy the basic food they are accustomed to. The 2009 Declaration of the World Summit on Food Security states that “food security exists when all people, at all times have physical, social and economic access to sufficient, safe and nutritious food, which meets their dietary needs and food preferences for an active and healthy life.” This definition has been widely accepted by the international community, with the Food and Agriculture Organization (FAO) using it to derive several indicators of food security as presented in its flagship publication, The State of Food Security in the World. Food insecurity can be viewed as an extreme form of poverty. The relationship between the two is evident from Rowntree’s (1901) work on measuring the absolute poverty line, which he defined as the cost of maintaining a minimum standard of living. He first estimated the minimum monetary costs for food that would satisfy the average nutritional need of families of different sizes. To these costs, he added rent and minimum amounts for clothing, fuel, and sundries to arrive at a poverty line of a family of given size. A family is classified poor if its total earnings are less than its absolute poverty line. The idea of food insecurity is closely related to Rowntree’s food poverty line, defined as the minimum money cost of food that would meet the average nutritional needs of families of different size and composition. A family is unlikely to suffer from food insecurity if its total earnings are not less than the food poverty line. Hence, food security is achieved when all families and individuals have sufficient earnings to satisfy their average nutritional requirements. This definition of food security is very similar to that of the 2009 World Summit on Food Security. If households and individuals do not obtain sufficient food to meet their average nutritional needs, they suffer from undernourishment. FAO defines hunger in terms of prevalence of undernourished people whose caloric intake is less than their minimum energy requirements. In 2011-2013, 12% of the global population, equivalent to 842 million people, suffered from chronic hunger, FAO estimates. Maintaining good health, however, also requires sufficient intake of other basic nutrients such as protein, fat and carbohydrates. Since FAO’s measure of hunger is derived exclusively from the inadequacy of caloric needs, it does not measure undernutrition (or malnutrition). Thus, FAO’s measure of hunger does not inform whether people are becoming nutritionally better or worse. The 2009 Declaration of the World Summit on Food Security clearly emphasizes that all people should have access to nutritious food at all times. FAO’s measure of hunger, therefore, does not provide what it is intended to measure.

3
This paper proposes a new methodology of measuring food insecurity. Households or individuals suffer from food insecurity if they do not command enough resources to buy food sufficient to meet their nutritional needs. This definition is more relevant to the 2009 World Summit on Food Security’s definition of food security. The main contribution of this paper is to estimate the per capita monetary cost of a food basket that provides a balanced diet through adequate nutrients including calories, protein, fat and carbohydrates to maintain good health. The cost is measured in US dollars based on the 2005 Purchasing Power Parity (PPP) to allow for comparison across countries.1 Per capita household expenditure is also measured in 2005 PPP US dollars. A household is identified as food-insecure if its per capita expenditure is less than the estimated per capita cost of food. If a household struggles with food insecurity, then all individuals belonging to the household are assumed to be food-insecure. This is standard assumption commonly used in the measurement of poverty. This paper uses the World Bank’s PovcalNet program to measure the percentage of population deemed food-insecure in 126 countries, which account for nearly 6 billion people worldwide.
2. Distinction between Food and Nutritional Security
While food and nutritional security are closely related, they are not the same. According to FAO, food security consists of four dimensions: (i) food availability, (ii) economic and physical access to food, (iii) food utilization, and (iv) stability (vulnerability and shocks). FAO’s definition of food security encompasses production, consumption, access, and utilization of food. Among the four dimensions, food utilization is the only dimension that focuses on nutrition. Hence, nutritional security is a component of food security. Food and nutritional security are, therefore, related but two distinct concepts. Food contains a number of basic elements such as carbohydrates, proteins, fats and alcohol that produce different quantities of energy when burnt. The amount of energy produced when one gram of any of these elements is burnt is known as its calorific value. Food security should, therefore, be concerned with whether people have access to food that meets their nutritional requirements. To directly measure food security, one needs to measure the extent to which people are able to acquire food that meets their nutritional requirements. This approach, as will be discussed below, is related to Sen’s (1981) entitlement approach to measuring food deprivation in the population. Food security is influenced by factors such as poverty, food prices, social protection, unemployment, and earnings, among others. Nutritional security, on the other hand, is concerned with adequacy of nutrients, not just calories, required to remain healthy. Although food is the main source of nutrients, nutritional security also depends on the efficiency with which individuals are able to convert food into nutrients. Nutritional insecurity is commonly measured by the prevalence of undernourishment and undernutrition (malnutrition).
1 The costs of a food basket in local currencies do not allow us to compare them across countries. The costs have thus to be measured in some international currency such as US dollar. The conversion of local currency to US dollar is accomplished using purchasing power parity exchange rates, which account for differences in the costs of living across countries.
4
Undernourishment is measured by the percentage of population unable to meet their dietary energy requirement. Energy needs are determined by metabolic rates, which vary from one person to another. Hence, nutritional needs differ substantially across people. A person’s energy requirements depend on age, gender, and activity level. Even if such differences are taken into account, interpersonal variations still exist due to an individual’s metabolic rates, which cannot be measured. As will be discussed below, the energy requirements are also known to vary intra-individually—i.e. for the same individual over time.2 These conceptual problems make the measurement of undernourishment highly problematic. The processes through which malnutrition afflicts households or a community are also very complex. In addition to inadequate entitlement to food, health care, lack of nutritional education, unhygienic environment and food preparation influence nutritional status. Osmani (1992a) points out that the nutritional status of a person is almost the outcome of a complex interaction between nutrient intake and disease environment. Given such complexities, it is almost impossible to directly measure undernutrition. Indirectly, the existence and magnitude of undernutrition can be measured through the percentage of children under five years of age affected by wasting, underweight, and stunted. But they cannot tell us the many possible constraints that may have led to that deprivation. This paper explores the measurement of food insecurity by constructing a food basket that provides the basic nutrients for maintaining good health.
3. Prevalence of Undernourishment
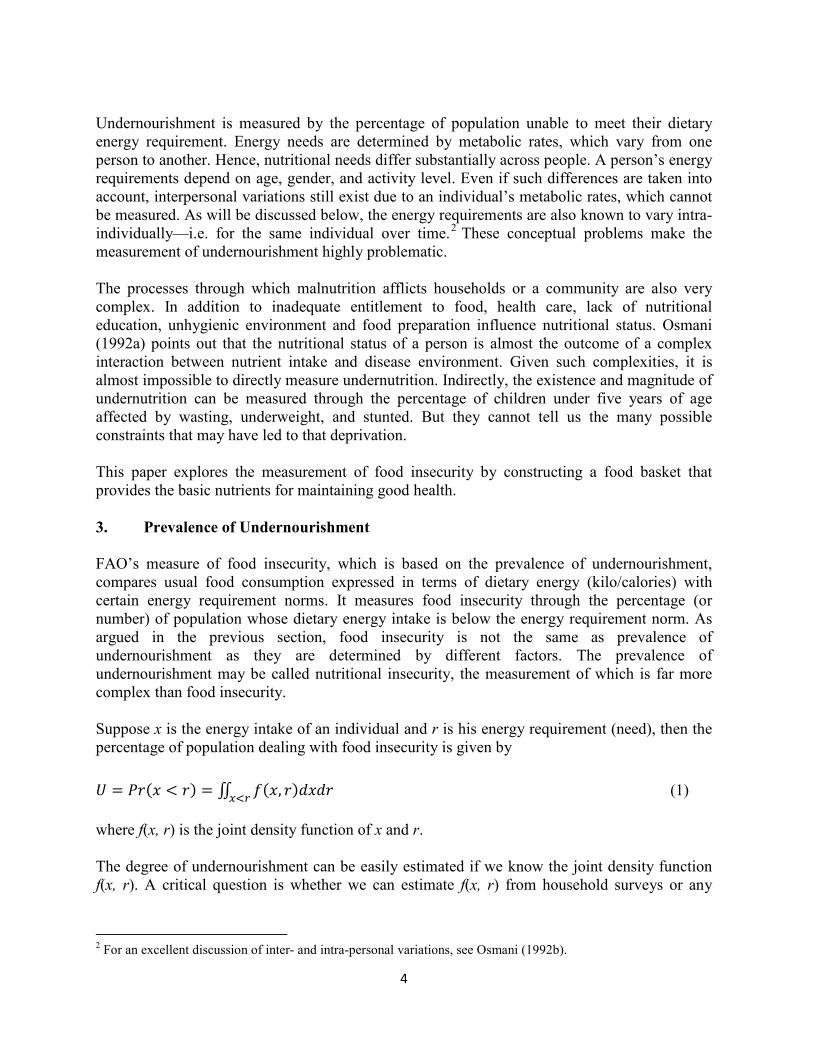
FAO’s measure of food insecurity, which is based on the prevalence of undernourishment, compares usual food consumption expressed in terms of dietary energy (kilo/calories) with certain energy requirement norms. It measures food insecurity through the percentage (or number) of population whose dietary energy intake is below the energy requirement norm. As argued in the previous section, food insecurity is not the same as prevalence of undernourishment as they are determined by different factors. The prevalence of undernourishment may be called nutritional insecurity, the measurement of which is far more complex than food insecurity. Suppose x is the energy intake of an individual and r is his energy requirement (need), then the percentage of population dealing with food insecurity is given by
� = ���� < �� = ∬ ��, ������ �� (1)
where f(x, r) is the joint density function of x and r. The degree of undernourishment can be easily estimated if we know the joint density function f(x, r). A critical question is whether we can estimate f(x, r) from household surveys or any
2 For an excellent discussion of inter- and intra-personal variations, see Osmani (1992b).

5
other data sources. To answer this question, a brief overview of the debate on energy deficiency is provided in Section 4. Equation (1) can at best measure the percentage of population unable to meet their dietary energy requirements. However, FAO’s measure of food security, which is based on caloric needs, does not take undernutrition (or malnutrition) into consideration. Maintaining good health also requires the intake of other basic nutrients such as protein, fat, and carbohydrates. As such, FAO’s measure given in (1) does not inform whether people are becoming nutritionally better-off or worse-off. FAO considers chronic undernourishment as synonymous with hunger, according to The State of Food Security in the World.
4. A Brief Overview of the Debate on Nutritional Insecurity
The prevalence of undernourishment, in turn, is a gauge of nutritional insecurity. Economists and statisticians have yet to reach a consensus on how to estimate the joint density function defined in (1), which is measure of undernourishment.3 In determining undernourishment, FAO focuses on the average dietary energy requirements of individuals among different age and gender groups that would allow them to maintain the required physical efficiency. It periodically publishes the average calorie requirements separately for men and women of different ages including children. Many attempts have been made to measure undernourishment using these norms. This approach classifies a person as undernourished if his calorie intake is below the required average norms [see Ojha (1970) and Dandekar and Rath (1971) for India and later Reutlinger and Selowsky (1976) and FAO (1977) at global level]. This approach has been severely criticized by Sukhatme (1981) and Srinivasan (1981), among others. Much of the controversy centers on the problems in using the “average” requirement norm. However, average dietary energy requirements vary interpersonally—i.e. from person to person even controlling for age, gender and activity level—and intra-individually—i.e. for the same individual at different points in time. Sukhatme (1961) argued that intra-individual variation is by far the more important source of variation than inter-individual variation. Nutritionists, however, are deeply divided on this issue, many of them holding opposite view that intra-individual variation is of a minor order of magnitude (Gopalan 1992, Payne 1992, Srinivasan 1992, Osmani 1992). Sukhatme’s main argument for intra-individual variation has been that an individual can “adapt” to a low calorie-intake level without suffering any impairment to health—in other words, when his calorie intake falls, then his calorie requirement also falls in line with calorie intake. The individual will suffer undernourishment only when his calorie intake falls much below the “average” calorie requirement norm. Sukhatme (1961) suggested the following formula for estimating the proportion of undernourished individuals with the same age, gender, body weight, and activity level:
3 See particularly Sukhatme (1977, 1982), Srinivasan (1981), Seckler (1982, 1984), Sukhatme and Morgan (1982), Lipton (1983), Payne (1985, 1992), Gopalan (1992), and Kakwani (1986, 1992).
6
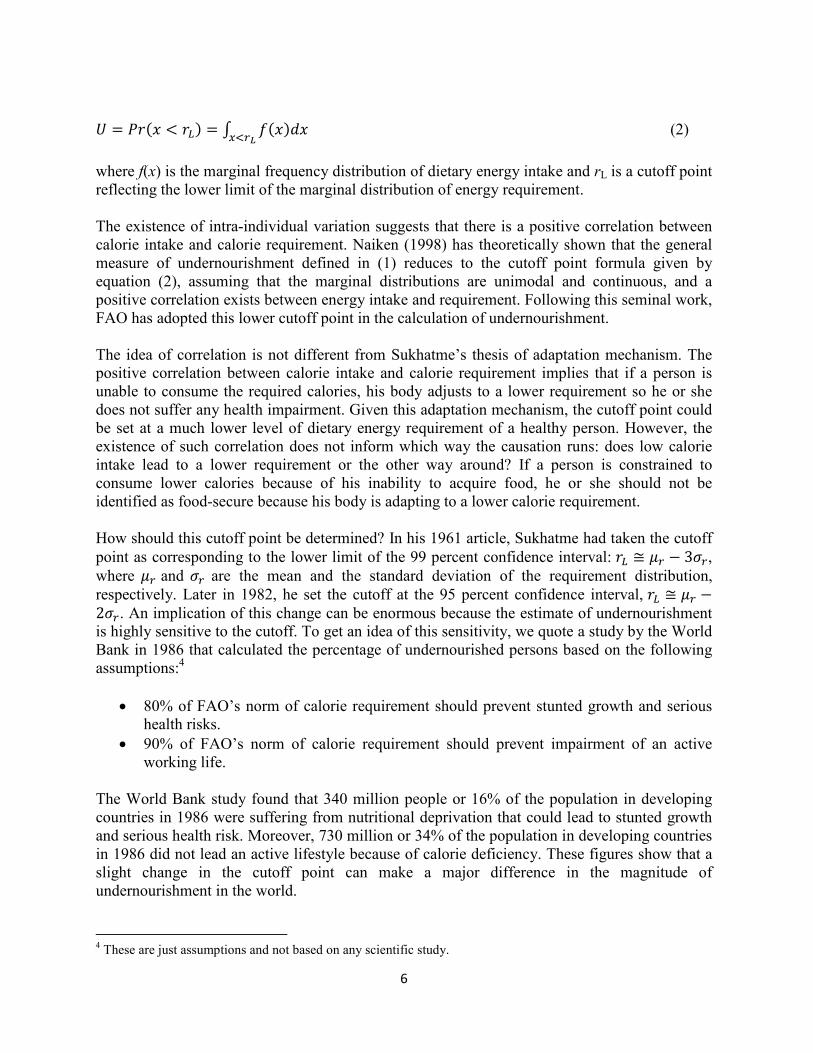
� = ���� < ��� = � ����� ��� (2)
where f(x) is the marginal frequency distribution of dietary energy intake and rL is a cutoff point reflecting the lower limit of the marginal distribution of energy requirement. The existence of intra-individual variation suggests that there is a positive correlation between calorie intake and calorie requirement. Naiken (1998) has theoretically shown that the general measure of undernourishment defined in (1) reduces to the cutoff point formula given by equation (2), assuming that the marginal distributions are unimodal and continuous, and a positive correlation exists between energy intake and requirement. Following this seminal work, FAO has adopted this lower cutoff point in the calculation of undernourishment. The idea of correlation is not different from Sukhatme’s thesis of adaptation mechanism. The positive correlation between calorie intake and calorie requirement implies that if a person is unable to consume the required calories, his body adjusts to a lower requirement so he or she does not suffer any health impairment. Given this adaptation mechanism, the cutoff point could be set at a much lower level of dietary energy requirement of a healthy person. However, the existence of such correlation does not inform which way the causation runs: does low calorie intake lead to a lower requirement or the other way around? If a person is constrained to consume lower calories because of his inability to acquire food, he or she should not be identified as food-secure because his body is adapting to a lower calorie requirement. How should this cutoff point be determined? In his 1961 article, Sukhatme had taken the cutoff
point as corresponding to the lower limit of the 99 percent confidence interval: �� ≅ �� − 3��,
where �� and �� are the mean and the standard deviation of the requirement distribution,
respectively. Later in 1982, he set the cutoff at the 95 percent confidence interval, �� ≅ �� −2��. An implication of this change can be enormous because the estimate of undernourishment is highly sensitive to the cutoff. To get an idea of this sensitivity, we quote a study by the World Bank in 1986 that calculated the percentage of undernourished persons based on the following assumptions:4
• 80% of FAO’s norm of calorie requirement should prevent stunted growth and serious health risks.
• 90% of FAO’s norm of calorie requirement should prevent impairment of an active working life.
The World Bank study found that 340 million people or 16% of the population in developing countries in 1986 were suffering from nutritional deprivation that could lead to stunted growth and serious health risk. Moreover, 730 million or 34% of the population in developing countries in 1986 did not lead an active lifestyle because of calorie deficiency. These figures show that a slight change in the cutoff point can make a major difference in the magnitude of undernourishment in the world.
4 These are just assumptions and not based on any scientific study.

7
Sukhatme’s justification for a lower cutoff point is that an individual can “adapt” to a low calorie-intake level without any impairment to health. This process of adjustment occurs through changes in metabolic efficiency, i.e. the efficiency with which food is converted to energy. In his writings, Sukhatme tends to assume that this lower limit is the same for all individuals, but this is not the case. The lower limit is determined by an individual’s metabolic ability to regulate his energy expenditure. There is no reason to expect that all individuals have the same capacity for metabolic regulation. Thus, the problem of inter-individual variation in average dietary energy requirement cannot be avoided. The conceptual problems with the estimation of people suffering from undernourishment are complex. Moreover, there are uncertainties on the quality of data used, which we have not yet discussed. A pertinent question is whether it is possible at all to obtain credible estimates of the number of undernourished population around the world. FAO does accomplish this task every year in its flagship publication, The State of Food Insecurity in the World. The 2013 State of
Food Security in the World estimates (with the methodology described above) that 842 million people, or 12% of the global population, were unable to meet their dietary energy requirement. The methodology behind such numbers has attracted considerable criticism. The next section will provide a brief review of FAO’s methodology of estimating global hunger.
5. The FAO Method of Measuring Hunger
FAO defines chronic undernourishment as synonymous with hunger. Its estimates of global hunger are widely used by different development agencies to track progress towards the Millennium Development Goal of halving poverty and hunger by 2015. This section assesses FAO’s methodology for estimating hunger and the reliability of such estimates in monitoring global hunger. FAO deems that a person is suffering from hunger if his calorie intake is less than a cutoff point of calorie requirement, which is called the minimum dietary energy requirement (MDER). If the distribution of calorie intake and the MDER are known, it is then easy to identify whether or not the person is suffering from hunger. The most direct method of deriving the distribution of calorie intake is through household expenditure surveys, which comprise data on all food acquired by households including their food purchase, food consumed from their own production, and food received in kind. These food quantities can be converted into calories by means of food calorie conversion factors, which are available for almost all countries in the globe. Given the quantities of food consumed by each sample household in household expenditure surveys, we can compute the actual calorie intake of each sample household by multiplying the quantities by the calorie conversion factors. Dividing the calorie intake of each household by its size would give us each household’s per capita calorie intake. Thus, the entire distribution of calorie intake can be estimated from household expenditure surveys. Each sample household has an associated population weight. Given the cutoff point of calorie requirement, the percentage of undernourished or hungry persons can be accurately estimated by the weighted average of per capita calorie intake with the weight proportional to the population weight associated with each sample household. The total number of undernourished persons in a

8
country can then be obtained by multiplying the percentage of undernourished persons by the country’s total population. FAO follows a rather approximate method of estimating hunger. It assumes that the distribution of calorie intake, denoted by f(x), follows a two-parameter lognormal distribution. This implies
that ln(x) is normally distributed with mean � and variance ��.5 It follows from the lognormal distribution that
�� = ������ + 1� (3) and
� = ����̅� − �� (4)
where �̅ and "�are the mean and variance of calorie intake, respectively, and �� = "/�̅ is the coefficient of variation of calorie intake. Together, these two equations show that the lognormal
distribution can be characterized by mean �̅ and coefficient of variation, CV. Using the lognormal distribution, the estimation of the percentage of undernourished population
requires only two parameters: average calorie intake (�̅� and coefficient of variation (CV).
Suppose �̅ = 2,414 calorie intake per person per day and CV = 0.29; substituting these in (3)
and (4) immediately gives � = 0.2842and� = 7.7487. Assuming that the MDER, which is the cutoff point of the calorie requirement intake, is equal to 1,680 per person per day, the probability that a person is undernourished is given by
��,� < 1,680. = ��,����� < ���1,680�. = / 012�3,456�78.89586.�59� : = /�−1.1335� where N(X) is the standard normal cumulative distribution. Utilizing the standard cumulative
normal tables gives N( − 1.1335) = 0.1285, and thus the percentage of undernourished population in this hypothetical country would be 12.85. If the total population of the country is 100 million, then the number of undernourished persons is about 13 million.
6. Limitations of FAO’s Method
Based on FAO’s estimates, the distribution of calorie intake follows a lognormal distribution.6 This model is convenient from an analytical point of view, but not flexible enough to capture the variation at the bottom of the distribution. Nevertheless, it gives reasonable fit in the middle range of the distribution covering about 60% of the population. Since undernourishment basically occurs at the lower end of the distribution, the lognormal distribution will
5 Recently, the FAO has adopted a more flexible model of skewed normal and log-normal distributions introduced by Azzalini (1985) with the results published in The State of Food Security in the World 2012. It is not reported how well these distributions fit to the data. The loss of efficiency due to grouping still remains. 6 An elaborate history and analytical properties of log-normal distribution are presented by Aitchison and Brown (1957).

9
underestimate the percentage of population suffering from undernourishment because of its limited flexibility. The lognormal distribution was popular in the 1950s and 1960s, during which national statistical offices did not release unit-record data for household surveys, providing only group data so data analysis was carried out using some distribution model. The lognormal model was found to be analytically simple, and its close relationship with normal distribution provided ready access to efficient procedures and statistical inference.7 India’s five-year development plans extensively utilized the lognormal distributions to project consumer expenditures. Today, household unit-record data are readily available and the use of lognormal distribution has become rather obsolete. Poverty and inequality measures are now directly and more efficiently estimated from household surveys, which provide the entire distribution. FAO has somehow continued the practice of estimating the distribution of calorie intake from group data using the lognormal distribution. The main justification for such practice is that direct estimates of deficiency in calorie intake captures excessive variability and does not provide the variance of habitual food consumption in the population. The excessive variability in calorie intake is, therefore, controlled by calculating the CV of calorie consumption of a representative individual. However, FAO’s methodology does not inform how such representative individual is defined; is it a person with an average calorie intake? It does, nevertheless, inform how the CV of calorie intake for a representative individual can be calculated. The procedure is as follows: Household surveys provide information on per capita expenditure and per capita calorie consumption for each sample household along with household weights. From these information, the CV of calorie intake can be directly and more accurately estimated. Instead, all these unit-record data are grouped into per capita expenditure classes, with each class giving the median value of per capita dietary energy consumption. The CV is then estimated from the median values for each expenditure class. However, the resulting CV completely ignores within-group variation in calorie consumption, thus underestimating the total variation in calorie consumption. The degree of underestimation will depend on how many expenditure classes are constructed. It is thus difficult to understand why the CV calculated from grouped data will provide habitual consumption of dietary energy for the representative individual. The calculation of CV from grouped data will only amount to loss of efficiency. Although the CV is estimated from household surveys, FAO estimates the mean calorie intake from food balance sheets (FBSs), which provide the quantities of different food items available in a country from the country’s production data. The calculation of FBS is performed by adding national food production and imports, and subtracting exports, food losses, food used for seeds, animal feed and stock changes. Food quantities are then converted into calories by means of food calorie conversion factors. Combining this with population data provides the total calories available for human consumption per person in each country.
7 Iyenger (1960) extensively used log-normal distribution to analyze consumption patterns in India.

10
Estimates of average calorie intake obtained from FBSs may be less reliable than those obtained from household expenditure surveys. Some economists at the World Bank8 have raised a few concerns about these estimates of food availability. First, as food availability is residual, any errors in reported production, trade and stocks will affect the estimates of national food availability. Second, production and trade data for grain crops are potentially reliable since it is feasible to measure production with sample plots and a real mapping, among others. However, the same is not true for root crops such as potatoes, sweet potatoes and cassava, which are important sources of nutrition for the poor. In addition, there are problems associated with storage, food fed to animals, and crops kept for seeds. Given these practical problems, it is difficult to ascertain the amount of food grains available for human consumption. The MDER is a crucial factor in FAO’s methodology to estimate undernourishment, as it establishes a cutoff point (or threshold) to estimate the prevalence of undernourished population in a country. When the threshold changes, so does the prevalence of people estimated to be undernourished. As noted earlier, the estimates for the undernourished population are highly sensitive to the threshold. A small error in the estimation of the cutoff point can have a substantial impact on the estimates for the undernourished. FAO compiles the MDER for the individuals by age and gender. As Naiken (2002) points out,
the gender-age-specific MDERs have been derived not by Sukhatme’s formula �� − 2��, but by directly considering the energy expenditure corresponding to the lowest acceptable weight-for-height and the lowest acceptable activity level. There is a range of body weights that is considered to be healthy. Similarly, there is a range of physical activity levels (PALs) required to perform economically necessary activity. The cutoff point is the lowest value in these ranges and varies with age and gender of the population. Thus, the MDER is calculated separately for each gender and age group. The cutoff point for a population is derived by aggregating gender- and age-specific MDERs using the proportion of the population in different gender and age groups as weights. Since the gender-age distribution of the population changes over time, the cutoff point is updated annually to reflect changes in the demographic structure of the population. There is considerable uncertainty regarding the actual requirement level of individuals. This uncertainty stems from the fact that energy requirement is specified as the average for a group of individuals. However, the actual requirement for each individual in the group is not known. In addition, calorie requirements are known to vary interpersonally–i.e. from person to person– and intra-individually–i.e. for the same individual at different points in time. As such, the assumption is that all individuals whose calorie intake is above the MDER can “adapt” so that their calorie intake always matches their respective requirements and are not, therefore, undernourished. The accurate estimation of the MDER is crucial. Naturally, its estimation involves normative judgments at various stages, thereby making the task more challenging.
7. Food Insecurity as Entitlement Failure
8 See De Weerdt, Beegle, Friedman, and Gibson (2014).

11
FAO views food insecurity from a perspective of nutritional deprivation. This might be valid as undernourishment could lead to severe health problems. Undernourished people tend to have low immunity and are susceptible to infections. Children under five years of age are the most affected segment of the population from undernourishment, becoming wasted (low weight for height), stunted (low height for age) and underweight (low weight for age). Undernourishment among people is a consequence of not being able to consume sufficient amount of food that meets their dietary needs. Thus, the direct method of measuring food security is to capture the extent to which people are able to acquire food that meets their nutritional requirements. This method is closely related to Sen’s (1981) entitlement approach to measuring food deprivation in the population. A brief description of it is as follows. According Sen (1989), every individual is endowed with a bundle of resources, which he can exchange for food and any other commodities. A person’s entitlements depend on what he owns initially and what he can acquire through exchange. If the entitlement set does not include a commodity bundle with an adequate amount of food, the person would go hungry and become food-insecure. This, according to Sen, is an entitlement failure. An entitlement failure can occur due to many reasons. For instance, if food prices go up sharply, the entitlements of some individuals may cease to include an adequate bundle of food. Such individuals will thus suffer from food deprivation. Similarly, people can suffer from food insecurity due to sickness, unemployment, or death of bread-winner. Given these, this paper proposes an alternative definition of food security:
Food security exists when all people, at all times have entitlement to sufficient and nutritious
food, which meets their dietary needs.
This definition of food security emphasizes the entitlement to food, whereas the definition proposed by the 2009 Declaration of the World Summit on Food Security emphasizes access to food (or actual consumption of food). Individuals make their own choices on what food they want consume, so policymakers can only ensure that people have necessary resources to consume sufficient and nutritious food. Thus, the entitlement approach is more realistic than the access approach. This entitlement approach is directly linked to income or employment generation, food production, food prices, and social security, all of which have an important impact on food security. For instance, following the 2008 global financial crisis, many households lost their source of livelihood and may have suffered a severe failure of entitlement to food. Thus, the measurement of food security based on the entitlement approach helps determine the magnitude of the contribution of such shocks to food insecurity and policies to reduce or prevent food deprivation.
8. Measuring Household Food Security: A Proposed Method
This section proposes a new method of measuring food security among households. It is based on Sen’s (1981) entitlement approach. Since this approach only deals with food security among households, the issue of intra-household food security is not addressed. Given data limitation, it is generally not possible to measure food deprivation within households.

12
In a market economy, a person can exchange whatever he owns for other goods including food. This exchange can take place through monetary income at given market prices. The person’s income in the reference period can be used as a composite measure of his entitlement. A household’s composite index of its entitlement can similarly be measured by its per capita income (or consumption), which is denoted by yi for the ith household. Suppose zi is the per capita cost of food bundle for the ith household that meets the nutritional needs of all its members. Given this, the ith household is defined as food-secure if at all times yi is greater than zi. If yi is less than zi at all times, then the ith household is chronically food-insecure. A household’s food bundle that is sufficient, safe and nutritious for all members of the household should meet the following requirements.
• The food bundle should meet the average dietary energy needs of all household members.
• The food bundle should meet the average basic requirements of protein, fat and carbohydrates of all household members.
9. Households’ Per Capita Minimum Dietary Requirement
To construct a food bundle that meets the dietary energy needs of household members, we need to know the energy requirement norms or standards adopted at the international level. The report of the FAO/WHO/UNU Expert Consultation on Energy and Protein Requirements has defined energy requirements as follows:9
The energy requirement of an individual is the level of energy intake from food that will balance
energy expenditure when an individual has a body size and composition and level of physical
activity, consistent with long-term good health; and that will allow for the maintenance of
economically necessary and socially desirable physical activity. In children and pregnant or
lactating women the energy requirement includes the energy needs associated with the
deposition of tissues or the secretion of milk at rates consistent with good health.
These norms differ across individuals depending on age, gender, weight, and activity level. Household expenditure surveys provide information on the age and gender of each individual within a household, but the activity level and body weight of each individual are not available in these surveys. Thus, we can control for age and gender of individuals, but not weight and activity level. In determining calorie norms, we assume that the reference person has the median height and weight to give a body mass index (BMI) of 21.5 for adult females and 22.5 for adult males. Table 1 presents the estimated amounts of calories required to maintain energy balance for various gender and age groups at three different levels of physical activity. Estimates are rounded to the nearest 200 calories. 9 See FAO, WHO, and UNU (1985).

13
Table 1: Calories required for energy balance by gender and age groups
Age Sedentarya Moderatelyb Activec
Child 1-3 years 1,000 1,000 1,000
Female 4-8 years 1,200 1,600 1,800
9-13 years 1,600 2,000 2,200 14-18 years 1,800 2,000 2,400
19-30 years 2,000 2,200 2,400
31-50 years 1,800 2,000 2,200
51 years and above 1,600 1,800 2,200
Male 4-8 years 1,400 1,600 2,000
9-13 years 1,800 2,200 2,600
14-18 years 2,200 2,800 3,200
19-30 years 2,400 2,800 3,000
31-50 years 2,200 2,600 3,000
51 years and above 2,000 2,400 2,800 Source: These levels are based on Estimated Energy Requirements from the Institute of Medicine Dietary Reference Intakes Macronutrients Report, 2002. a Sedentary means a lifestyle that includes only the light physical activity associated with typical day-to-day life. b Moderately active means a lifestyle that includes physical activity equivalent to walking about 1.5 to 3 miles per day at 3 to 4 miles per hour, in addition to the light physical activity associated with typical day-to-day life c Active means a lifestyle that includes physical activity equivalent to walking more than 3 miles per day at 3 to 4 miles per hour, in addition to the light physical activity associated with typical day-to-day life.
The calorie requirements for different gender and age groups can be aggregated by means of weighted average, with weights proportional to the population in each group. The population in each gender and age group is available from household surveys. The aggregate requirement will be different across countries given disparities in their gender and age composition. Using unit-record data for nine countries in Asia and the calorie norms given in Table 1, we can calculate the average calorie norms for each of the nine countries. The estimates for three alternative activity levels are presented in Table 2.
Table 2: Aggregate caloric norms for three levels of activity
Country Year Sedentary Moderately Active
India 2007-08 1,835 2,137 2,420
Indonesia 2014 1,839 2,134 2,417
Bangladesh 2000 1,788 2,086 2,362
Pakistan 2007-08 1,773 2,066 2,340
Sri Lanka 2009-10 1,829 2,122 2,419
Bhutan 2007 1,823 2,122 2,405
Nepal 2010 1,776 2,067 2,344
Philippines 2011 1,827 2,128 2,412
Vietnam 2008 1,867 2,170 2,466
Source: Authors' calculations.

14
Table 2 shows that the average calorie norms vary with activity levels. The variation is much larger across activity levels than across countries. We cannot measure the activity levels of all individuals in a country. Hence, the determination of undernourishment by comparing individuals’ calorie intake with their calorie needs will be highly unstable and unreliable. But if food insecurity is measured using income or consumption at the household level, the variation in individuals’ calorie requirements will not be that large. The resulting estimates will be more reliable because different caloric needs of individuals within households will be averaged. In the construction of food basket, we assume that, on average, individuals within households have moderate activity level ̶ with a lifestyle that includes physical activity equivalent to walking about 1.5-3 miles per day at 3-4 miles per hour, in addition to the light physical activity associated with typical day-to-day living. Table 2 also shows that the calorie norms with moderate activity are around 2,100 kilo/calories per person per day. The U.S. Department of Agriculture also uses an “average” energy requirement for each country, which averages about 2,100 calories per person per day for 67 developing countries. If a household has access to food that provides a minimum of 2,100 kilo/calories per person per day, it will be highly unlikely that the household faces chronic hunger. While some household members may have caloric needs greater than 2,100 kilo/calories, others may have less; hence, on average, the household is unlikely to suffer hunger. On the other hand, FAO’s (1996) cutoff for undernourishment is about 1,800 calories per person per day ̶ about 300 calories less than the average calorie requirements of 2,100 of a healthy person. FAO’s lower cutoff point is justified on the ground that the human body can adapt to a lower calorie intake without any adverse effect on health. However, even if humans can adapt, households may still feel food-deprived if they purchase food with no more than about 1,800 kilo/calories per person. To address food insecurity, households and individuals must not only meet dietary energy needs, but also have adequate amount of protein, fat, carbohydrates and other micronutrients. If households limit their consumption to only 1,800 kilo/calories per person, they may not meet other nutritional needs. In the next section, we calculate the cost of the food basket, which provides 2,100 kilo/calories per person per day and meets the recommended requirements of protein, fat and carbohydrates.
10. What is the Cost of a Nutritious Food Basket?
This paper calculates the cost of a nutritious food basket, which satisfies the daily caloric requirements of 2,100 kilo/calories and the recommended requirements of protein, fat and carbohydrates. The cost is calculated in 2005 PPP US dollars so that it can be applied to all countries. The PPP exchange rates are used to convert local currencies into US dollars. The cost of the nutritious food basket is estimated using FAO data for 30 countries (32 spells). The data were downloaded the following variables from the FAO website:
i. Per capita household expenditure (in local currency)

15
ii. Per capita household food expenditure (in local currency) iii. Per capita daily kilo/calorie intake iv. % share of calories obtained from protein v. % share of calories obtained from fat
vi. % share of calories obtained from carbohydrates Per capita food and total expenditures in local currency are converted to US dollars using the 2005 PPP. These estimates are presented in Table A.1 in the Appendix. Per capita household expenditure in 2005 PPP provides a measure of average standards of living that is comparable across countries. Of the 30 countries with available data, Mozambique and Nepal have the lowest standards of living, with daily per capita expenditures of $1.15 and $1.28 in 2005 PPP, respectively. On the other hand, the richest country in the list is Hungary, with per capita expenditure of $11.57 per day. As shown in Table A.1, standards of living vary substantially from one country to another. While calories are derived from food, there is no one-to-one relationship between calorie intake and food expenditure. This is because individuals consume various types of food that provide different quantities of calories. Hence, we cannot expect a one-to-one relationship between the two variables. In this paper, we estimate this relationship using a cross-country regression model. A theoretical, plausible relationship between per capita calorie intake (C) and per capita food expenditure (F) is specified to take on the semi-logarithmic form:
� = < + =���>� (5)
where = > 0 and which gives: @A@B =
CB and
@DA@BD = − C
BD which implies that as food expenditure increases, calorie intake also increases but at a decreasing rate—in other words, the rate of increase in calorie intake slows as people become more affluent. Instead of consuming more calories, people consume more protein and fat as their food expenditure increases. The regression model in (5) was estimated using 32 observations given in Table A.1, with each country as an observation. Such cross-country regressions have been widely used in the literature (Reutlinger and Selowsky 1976). One potential drawback of using cross-country data for estimating the regression model (5) is that they may have a limited range of variation in per capita food expenditure as compared to using household data. Fortunately, the countries used in this study provide sufficient variability to reasonably estimate regression coefficients. The estimated equation is:
� = 2090.4 + 361.5���>�F� = 0.44 (6) (42.8) (5.1) The t-values in the bracket show that the coefficients are highly significant. This equation can be used to calculate the cost of food basket that provides on average 2,100 kilo/calories per person per day. Substituting C = 2,100 in (6) gives F=1.03. Therefore, the cost of a food basket

16
that gives on average 2,100 kilo/calories per day per person is $1.03 in 2005 PPP. Accordingly, the estimated cost of calorie is equal to $0.49 in 2005 PPP per 1,000 kilo/calories. The calorie cost is obtained by dividing total food expenditure by the number of calories derived from food. The calorie cost varies with a household’s standards of living: the richer a household is, the higher the cost of calories (Kakwani 2010). This is because richer households tend to consume a greater variety of food containing more protein and other nutrients, while the poor are likely to consume more carbohydrates, which are less expensive than protein. Using equation (6), the calorie elasticity with respect to food consumption is estimated at 0.172. To measure the impact of food consumption on calorie cost, we estimate the following semi-logarithm form based on the data presented in Table A.1:
�GH"I = 0.49 + 0.65���>�F� = 0.94 (7) (24.8) (22.4) This equation estimates that the calorie-cost elasticity with respect to food consumption is 1.33 at the point where the calorie cost is 0.49 per 1,000 kilo/calories. The calorie-food elasticity is 0.172 whereas the calorie-cost-food elasticity is 1.33. Many studies have found that the calorie-food elasticity is low, which has been of much concern in the literature.10 A low elasticity of calories implies that economic development would either never or take a very long time to eliminate hunger (Deaton 1997). If the calorie-cost elasticity is greater 1, people incur greater calorie costs as their incomes increase because they buy food of better quality with higher nutrient contents. In contrast, the poor tend to consume calorie-intensive food and are deprived of other nutrients necessary for good health. They suffer from undernourishment because they cannot afford to buy nutritious food. Similar to MDERs, there should be also a requirement of minimum calorie costs (MCC), which on average provide a balanced diet that meets nutritional needs necessary to maintain good health. In this context, a pertinent question would be whether a food basket with the estimated calorie cost of $0.49 in 2005 PPP per 1,000 kilo/calories will be able to provide a balanced diet. The next section attempts to answer this question.
11. A Balanced Food Basket
Food contains a number of basic nutrients such as carbohydrates, proteins, and fats that produce different quantities of energy when burnt. The amount of energy produced, when one gram of any of these nutrients is burnt, is known as its calorific value. A balanced food basket is one that provides 2,100 kilo/calories per person per day, of which 60%–70% is obtained from carbohydrates11, 15%–30% from fats12, and 10%–15% from proteins13, according to the Healthy Diet Plans.
10 Alderman (1993) has provided an excellent review of econometric techniques, which have been used in the literature to estimate the calorie-intake elasticity. 11 Carbohydrates are the main source of energy for the human body and are obtained from food such as whole-grain cereals and breads, pasta, corn, beans, peas, potatoes, fruit, vegetables, and milk products.

17
The amount of energy produced, when one gram of any of these nutrients is burnt, is known as its calorific value. One gram of carbohydrates yields 4 calories, protein 4 calories and fat 9 calories. Using these calorific values, a balanced food basket with the calorie consumption of 2,100 kilo/calories per person per day is estimated to provide the three nutrients in the following ranges: protein 52.5-78.7 grams, fats 35-70 grams, and carbohydrates 315-367grams. Holding the daily calorie requirements constant, the calorie cost becomes the main determinant of the quantities of protein, carbohydrates and fats as sources of calories. To calculate these quantities, we fitted the following three cross-country semi-logarithmic regressions using the 32 observations from Table A.1:
JG_J�HILM� = 71.2 + 18.4����GH"I�F� = 0.45 (8) (32.7) (5.0)
JG_GN�O = 353.1 − 33.7����GH"I�F� = 0.10 (9) (32.8) (-1.86)
JG_NI = 67.4 + 41.2����GH"I�F� = 0.59 (10) (18.2) (6.6) where pc_protein is per capita consumption of protein; pc_carb is per capita consumption of carbohydrates; pc_fat is per capita consumption of fats; and Ccost is calorie cost per 1,000 kilo/calories in 2005 PPP. Equation (9) shows that the t-value for the coefficient of ln(Ccost) is 1.86, which is not statistically significant at 5%. This indicates that an increase in calorie cost has an insignificant impact on the consumption of carbohydrates. The estimated calorie cost of the food basket is $0.49 in 2005 PPP, which upon substituting in (8), (9) and (10) gives the estimates for per capita quantities of protein, carbohydrates and fat, respectively. Thus, our proposed per capita food basket, which costs $1.03 in 2005 PPP, provides 2,100 kilo/calories per person per day and consists of 58 grams of protein per person day, 377 grams of carbohydrates per person per day, and 38 grams of fats per person per day. The quantities of the three nutrients lie in the ranges of nutrient requirements for a healthy person—except carbohydrates, which is slightly higher by 9 grams. This food basket provides the required nutrients for a healthy person and, therefore, offers a balanced diet of an average person. A household is deemed suffering from food insecurity if its entitlement, as measured by per capita expenditure, is less than the cost of basket estimated to be $1.03 in 2005 PPP.
12 Fats are important for the absorption of fat-soluble vitamins such as vitamins A, D, E, and K. They also provide essential fatty acids, which are important for the structure and function of cells, and cushion vital organs and protects the body from extreme cold and heat. 13 Proteins are complex nitrogen-containing compounds that build and repair body tissue. Protein deficiency can retard growth and development and inhibit the body’s ability to fight infection.

18
As noted earlier, FAO’s (1996) recommended calorie requirements are about 1,800 kilo/calories per person per day, 300 calories less than the average calorie requirements for a healthy person. This paper estimates the calorie cost of a food basket that provides 1,800 kilo/calories per person per day from (6) at $0.25 in 2005 PPP per 1,000 kilo/calories. Substituting this value of calorie cost in (8), (9) and (10), we obtain a food basket that provides 1,800 kilo/calories per person per day and comprises 46 grams of protein per person day, 400 grams of carbohydrates per person per day, and 10.2 grams of fats per person per day. Except in carbohydrates, a food basket of 1,800 kilo/calories per person per day is deficient in both protein and fats, with their values lying outside the range of nutrient requirements for a healthy person. Even if the human body can adapt to a lower dietary energy intake, households may consume excessive carbohydrates and experience severe deficiency in both protein and fats. In this case, households will not meet their nutritional needs and consequently suffer chronic malnutrition. Therefore, adopting a lower threshold, based on FAO’s minimum dietary energy requirement, will not provide a balance diet.
12. Global Estimates of Food Insecurity
Departing from FAO’s measure food insecurity that compares energy intake with requirement, this paper builds upon the entitlement approach, which compares per capita household expenditure with per capita food cost. This paper estimates that the per capita cost of a food basket that provides sufficient nutrients for maintaining good health is $1.03 per day in 2005 PPP. Using the World Bank’s PovcalNet program, this paper measures global food insecurity through data from 124 countries, which account for 5.7 billion people. In calculating the incidence of food insecurity, the poverty line is set at $1.03 in 2005 PPP. The international poverty line of $1.25 per person per day in 2005 PPP is widely used to measure extreme poverty in the world. The World Bank recently refined its estimates of the PPP, which is a currency conversion for comparing the size and price levels of economies, by updating the base year from 2005 to 2011. The 2011 PPPs are deemed superior compared to the 2005 PPPs in terms of coverage of countries and estimation based on more accurate prices collected from individual countries. With the latest conversion rates available, it is appropriate to ask what would be the threshold of food insecurity in 2011 PPP corresponding to $1.03 in 2005 PPP. To calculate a single threshold of food insecurity based on 2011 PPP, this paper has used a new methodology of equivalence poverty liens developed by Kakwani and Son (2015). There is no single threshold for food insecurity in 2011 PPP that is equivalent to $1.03 in 2005 PPP. To this end, this paper estimates a single threshold for food insecurity using the weighted average of equivalent thresholds for 101 countries with weights proportional to their population. The resulting threshold calculated accordingly is equal to $1.59 in 2011 PPP. The threshold for food insecurity was estimated by incorporating the cost of calorie intake, which has never been considered by earlier studies in this field. To this extent, this study covers demand-side issues of food insecurity neglected in the past. Any supply-side interruptions, whether natural or man-made, will automatically be reflected in food prices that affect calorie

19
cost and consequentially food insecurity. Thus, the proposed method implicitly incorporates both supply and demand sides of food production or availability as important determinants of food insecurity. Rich, industrialized countries have been excluded from the study because they are not expected to struggle with food deprivation. Table A.2 in the Appendix provides the estimates for individual countries by selecting individual countries in the latest PovcalNet program for 2002 and 2012. Aggregated estimates from individual countries are presented in Table 3 for six major regions in the world. These aggregated estimates are directly obtained from the PovcalNet program. The aggregation is performed by the weighted average method, with weights proportional the countries’ population. Table 3 shows impressive progress in reducing the overall food insecurity worldwide. In just one decade, 2002–2012, the percentage of the global population dealing with food insecurity declined from 23.05% in 2002 to 10.01% in 2012. Similarly, the number of people suffering from food insecurity has fallen by 576.37 million, despite the serious food crisis in 2007-2008 when food prices skyrocketed.
Table 3: Percentage and number of food-insecure persons in the world, 2002 and 2012
2002 2012 Annual change
Region Percentage
(%) Number (million)
Percentage (%)
Number (million)
Percentage (%)
Number (million)
East Asia and Pacific 20.85 368.93 3.81 72.76 -1.70 -296.17
Europe and Central Asia 1.66 7.35 0.26 1.15 -0.14 -6.20
Latin America and Caribbean 10.00 51.97 4.40 25.90 -0.56 -26.07
Middle East and North Africa 1.99 2.24 0.39 0.49 -0.16 -1.75
South Asia 27.07 380.99 10.02 162.34 -1.71 -218.65
Sub-Saharan Africa 48.37 322.18 33.84 294.63 -1.45 -27.55
Total 23.05 1,133.65 10.01 557.28 -1.30 -576.37 Source: Authors’ calculations using PovcalNet.
Several regions have charted notable progress in addressing food insecurity. In East Asia and Pacific alone, the number of people suffering from food insecurity decreased from 368.934 million to 72.76 million between 2002 and 2012. The incidence of food insecurity is thus reduced to about 3.81% of the region’s population in 2012. One plausible explanation for such an impressive reduction could be due to rapid economic growth as experienced by many East Asian countries such as China.
Figure 1: Percentage of food-insecure people in the world

20
Source: Authors’ calculations.
South Asia’s performance in reducing food insecurity is equally commendable. The number of the region’s food-insecure people declined from 280.99% in 2002 to 162.34% in 2012, lifting 218.65 million out of food insecurity. Given such rapid reduction in the number of food-insecure people, it could take only a few more years to eliminate food insecurity in South Asia. Similarly, food insecurity is not much of an issue in Europe and Central Asia and Middle East and North Africa, where the percentage of food-insecure people is less than 1%. In Latin America and Caribbean, the percentage of food-insecure people is 4.4% in 2012. In contrast, Sub-Saharan Africa suffers from extreme food insecurity, with 48% of its population suffering from food insecurity in 2002. This percentage declined to 33.84% in 2012. As a result, the number of people struggling with food insecurity fell from 322.18 in 2002 to 294.63 in 2012, accounting for a net reduction of 27.55 million in one decade. Despite the impressive progress in ensuring food security, some 557.28 million around the globe were unable to meet their minimum food requirements in 2012. These people are more likely to suffer from chronic hunger. One of the United Nations’ new agenda of Sustainable Development Goals aims to end hunger, and achieve food security and improved nutrition by 2030. To achieve this goal, these 557.28 million people need to break out of food insecurity and hunger. Table A.2 provides estimates of the percentage of the population dealing with food insecurity in 126 countries. Of these 126 countries, 60 have less than 3% of their populations suffering from food insecurity and are likely to have no serious issues on food insecurity. On the other hand, food insecurity is severe in Burkina Faso, Cameroon, Congo Democratic Republic, Madagascar, Malawi, and Zambia, where more than 50% of their populations struggled with food insecurity in 2012. The global development community needs to commit greater resources to address food insecurity in these countries. China and India’s performance in reducing malnutrition of children are often compared with one another. It is generally perceived that India’s performance in providing adequate amount of food to its population is poorer than China’s. China has reduced the percentage of its population
20.85
1.66
10.00
1.99
27.07
48.37
3.81
0.26
4.40
0.39
10.02
33.84
0.00 10.00 20.00 30.00 40.00 50.00 60.00
East Asia and Pacific
Europe and Central Asia
Latin America and Caribbean
Middle East and North Africa
South Asia
Sub Saharan Africa
2012 2002

21
coping with food insecurity from 23.91% in 2002 and 3.59% in 2012, with 258 million people emerging out of food insecurity. In comparison, India has reduced the percentage of its food-insecure people from 27.09% in 2002 to 9.76% in 2012 (Table A.2). As a result, almost 171 million have been lifted out of food insecurity. In addressing food insecurity, India’s progress is not that much behind China’s. Severe malnutrition among children is widely prevalent in India, but this may not be only due to food deprivation. Other factors such as poor public hygiene, low rate of immunization and low access to basic health services may also influence malnutrition. As the recent issue of The Economist (July 2015) points out, “one reason Indians are less well-nourished than Africans is that more Indians defecate outdoors so more contract diarrhea and other diseases that makes it harder for children specially, to absorb the nutrients they consume.”
13. Linkage between Economic Growth and Food Insecurity
Growth generates additional goods and services enjoyed by the population. It is measured by the gross domestic product (GDP) and per capita GDP.14 But the entitlement to the output produced varies from one person to another depending on the pattern of growth. The pattern of growth determines its impact on reducing poverty and income inequality, and expanding economic opportunities for improving well-being. This paper shows that the level and pattern of growth can also influence food security in a country. Table 4 presents the annual growth rates of per capita GDP between 2002 and 2011 in different regions. As expected, East Asia and Pacific is the fastest growing region, with its per capita real GDP increasing at an annual rate of 7.80% in the given period. South Asia is the second fastest growing region with an annual per capita real GDP growth rate of 5.47%. The developing world’s annual growth rate of per capita real GDP is estimated at 2.68%.
Table 4: Growth effectiveness in reducing food insecurity in the world, 2002–2012
Per capita GDP in 2002 ($US in
2011 PPP)
Per capita GDP in 2012 ($US in
2011 PPP)
Growth rate in per capita GDP (% per annum) GERFI Years Region
East Asia and Pacific 12.64 27.58 7.80 -0.22 2.15
Europe and Central Asia 22.41 35.28 4.54 -0.03 1.82
Latin America and Caribbean 29.03 36.72 2.35 -0.24 7.29
Middle East and North Africa 25.15 31.67 2.31 -0.07 2.40
South Asia 7.24 12.51 5.47 -0.31 5.22
Sub-Saharan Africa 6.55 8.85 3.01 -0.48 17.94
Total 28.7 37.51 2.68 -0.49 7.09
Note: GDP = gross domestic product; PPP = purchasing power parity; GERFI = growth effectiveness of reducing food insecurity. Source: Authors’ calculations.
14
The total amount of goods and services produced within a year is measured through GDP and per capita GDP
measures the total output that on average is available to each person.

22
In linking growth to food insecurity, the relevant question is how effective growth would be in reducing food insecurity. One method to answer this question is through the growth-food insecurity elasticity. This elasticity measures the growth effectiveness of reducing food insecurity (GERFI):
PQF>R = ∆>HH�R�"LGT�MIU∆����L��NJMINPV��
which is the ratio of change in food insecurity to the growth rate of per capita GDP. For instance, this elasticity is -0.22 for East Asia and Pacific, which implies that a 1% growth in per capita GDP reduces the percentage of people suffering from food insecurity by 0.22 percentage points. In contrast, a 1% growth in per capita GDP trims down the percentage of people struggling with food insecurity by -0.48 percentage points in Sub-Saharan Africa. The results suggest that growth is more effective in reducing food insecurity in Sub-Saharan Africa than in the other regions examined. A slower progress in reducing food insecurity in Sub-Saharan Africa is due to region’s lower growth rate in per capita GDP. We now pose a practical question as to how many years it will take to eliminate food insecurity in the world. In making such a projection, we need to make some assumptions: (i) the regions continue to have the same growth rate as in the past and (ii) the GERFI is constant. Our reference year is 2012. The calculations are illustrated for South Asia as an example. The population of South Asia suffering from food insecurity in 2012 is 12.51%, which is projected to be reduced to 0%. The GERFI for the region is -0.31, which gives the total growth rate required to eliminate food insecurity to 0% equal to 32.05%. As shown in Table 4, the annual growth rate in per capita GDP for South Asia is 5.47%. Using the compound interest
formula, W1 + X.98366Y
2= W1 + Z�.6X
366 Y,and solving for n will yield the number of years equal to
5.22.15 In Sub-Saharan Africa, about 33.84% of the population is suffering from food insecurity in 2012, which is extremely high compared to other regions. If Sub-Saharan Africa continues to have the same growth rate of per capita GDP, it will take almost 18 years to eliminate food insecurity in the region.
14. How Is Food Insecurity Related to Extreme Poverty?
Poverty and food insecurity are somewhat related concepts. Poor people lack sufficient resources to adequately meet basic necessities including food. This section assesses the linkage between extreme poverty and food insecurity.
15
The authors are grateful to Jacques Silber for suggesting the compound interest formula to be used to estimate
the number of years for this study.

23
An estimated 1.9 billion lived below $1.25 a day in 1990-1992, which declined by 835.5 million to 1.065 billion in 2015.16 Meanwhile, FAO estimated that about 991 million suffered from hunger in 1990 and declined to 775 million in 2015, reducing by 216 million in 25 years. The decline in the number of hungry people by 216 million between 1990 and 2015 was only about a quarter of the estimated decline in the number of extreme poor at 835.5 million in 2015. Lele (2015) in her recent blog “Measuring Poverty and Hunger can Raise More Questions than Answers” raised a pertinent question: why is there no link between hunger and poverty, as measured by FAO and the World Bank, respectively? Progress in hunger reduction seems underwhelming relative to the reported absolute levels and rates of decline in poverty. This puzzle can be understood given the following justification. Poverty is measured through income or expenditure. As economic growth increases people’s incomes, poverty is likely to be reduced because poor people also benefit from growth if not in the same proportion as the non-poor. On the other hand, FAO measures hunger through calorie intake, which is compared with a fixed value of calorie requirement. As this study shows, calorie intake increases very slowly with growth even among the poor and may at some point remain the same. As such, when the calorie requirement is fixed, reduction in hunger will be likely very slow. With prosperity, people tend to buy more quality food, which has high contents of protein and other micro-nutrients, and opt for more fresh and hygienic food. FAO’s measure of undernourishment is only based on calorie consumption, which fails to inform whether people are becoming nutritionally better or worse off. Like poverty, food insecurity in this study is measured through expenditure. There is almost a one-to-one relationship between the two as is evident from the following cross-country regressions:
���ℎHH�2012� = −1.52 + 0.80���ℎJHH�2012�F� = 0.97 (-3.64) (57.28) where hfood2012 = % of population suffering food insecurity in 2012; and hpoor2012 = % of population suffering extreme poverty in 2012. Food insecurity or hunger is an extreme form of poverty. Concepts of poverty and food insecurity are closely related. The equation above establishes that there is an almost one-to-one relationship between the two.
15. Concluding Remarks Eradicating food insecurity is a remaining development agenda in many countries. Measuring food insecurity is conventionally done by comparing caloric needs against requirements. However, nutrients such as proteins, fats and carbohydrates are also required to maintain good health. Hence, to ensure food security, households and individuals must have sufficient resources to purchase food that satisfies nutritional requirements.
16 People living on less than $1.25 a day in 2005 PPP are trapped in extreme poverty. This poverty line was adopted to monitor the Millennium Development Goal of halving extreme poverty in 25 years between 1990 and 2015.

24
This paper proposed a new methodology of measuring food insecurity. It calculated the per capita monetary cost of a food basket that satisfies the caloric and nutrient needs to maintain a healthy body. This nutritious food basket with a balanced diet provides 2,100 kilo/calories per person per day, consisting of 58 grams of protein per person per day, 375 grams of carbohydrates per person per day, and 37 grams of fats per person per day. The quantities of proteins and fats fall within the range of nutrient requirements for a healthy person—except carbohydrates, which is marginally higher by 9 grams. This nutritious food basket costs $1.03 in 2005 PPP, this paper estimated. With the 2011 PPP currency conversion rates recently released, this paper has estimated that the threshold of food insecurity is $1.59 in 2011 PPP, equivalent to $1.03 in 2005 PPP. Accordingly, our global estimates for food insecurity are based on the new threshold of $1.59 per person per day in 2011 PPP. In constructing the nutritious food basket, the paper identified calorie norms for reference individuals of median height and weight with a BMI of 21.5 for adult females and 22.5 for adult males. Individuals are also assumed to have a lifestyle with moderate activities including walking about 1.5-3 miles per day at 3-4 miles per hour, as well as light physical activity associated with typical day-to-day living. Given these assumptions, the paper estimates the calorie norm with moderate activity at around 2,100 kilo/calories per person per day. The U.S. Department of Agriculture also uses the average energy requirements of around 2,100 calories per person per day, which was estimated for 67 developing countries. A household that has access to this nutritious food basket, which provides a minimum of 2,100 kilo/calories per person per day, is unlikely to struggle with chronic hunger. Caloric needs of household members may be greater or less than 2,100 kilo/calories, hence the household, on average, will not likely face hunger. In comparison, FAO recommends calorie requirements of 1,800 kilo/calories per person per day – 300 calories lower than the average requirements for a healthy person. FAO justifies this lower threshold based on the human body’s capacity to adapt to a lower dietary energy intake without any impairment to health. However, this lower cutoff based on FAO’s minimum dietary energy requirement provides deficient amounts of protein and fats, and thus fails to deliver a balanced diet. This paper identified a household suffering from food insecurity as one with its entitlement, as measured by per capita expenditure, less than the cost of basket estimated to be equal to $1.59 in 2011 PPP. Using this benchmark, the findings revealed notable gains in reducing food insecurity worldwide between 2002 and 2012. Despite the severe food crisis in 2007–2008, the percentage of the global population struggling with food insecurity significantly decreased from 23% in 2002 to 10% in 2012. In just one decade, the number of food-insecure people declined by more than 576 million. Progress in combating food insecurity has been notable in all regions. East Asia and Pacific recorded a rapid reduction in food insecurity largely on the back of China’s impressive growth. The number of food-insecure people in East Asia and Pacific decreased from 368.93 million to 72.76 million in 2002–2012. In South Asia, food insecurity is expected to be eliminated in a few

25
years, with the percentage of its population facing food insecurity rapidly decreasing from 27.07% in 2002 to 10.02% in 2012. Some 218.65 million people in South Asia broke out of food insecurity in the given decade. Similarly, the percentage of food-insecure people is less than 1% of the populations in Europe and Central Asia and Middle East and North Africa, and 4.4% of Latin America and Caribbean’s population in 2012. Food insecurity is, however, expected to remain a prevalent development concern in Sub-Saharan Africa in the years to come. The region charted a decrease in the percentage of its population dealing with food insecurity, from 48.37% in 2002 to 33.84% in 2012. Although Sub-Saharan Africa has made marked progress in reducing food insecurity, it will take about 18 years to eliminate food insecurity in the region assuming that the growth rate of per capita GDP remains at 3% per annum.
How is food insecurity related to growth and poverty reduction? In explaining the linkage between growth and food insecurity, this paper examined how effective growth is in reducing food insecurity. A 1% growth in per capita GDP in East Asia and Pacific diminishes the percentage of food-insecure people by 0.49 percentage points, this paper estimated. In Sub-Saharan Africa, the percentage of people suffering from food insecurity is reduced by -0.48 percentage points with a 1% growth in per capita GDP. Among six regions in the globe, the study found that economic growth in Sub-Saharan Africa is the most effective in reducing the incidence of food insecurity – albeit its lower growth rate compared to the other regions.
Meanwhile, gains in reducing hunger appear marginal compared to the decline in poverty. FAO estimates that only 216 million people escaped hunger in the last 25 years, with the number of hungry people decreasing from 991 million in 1990 to 775 million in 2015. This decrease of 216 million in the number of people dealing with hunger was only about a quarter of the estimated decline in the number of extreme poor at 835.5 million in 2015. This discrepancy between the progress in reducing poverty and hunger can be explained by the following. As FAO measures hunger by comparing calorie intake with a fixed value of calorie requirement, calorie consumption increases sluggishly or may even remain the same given an increase growth. With a fixed calorie requirement, progress in reducing hunger is expected to be very slow. In contrast, poverty, which is measured through income or expenditure, is reduced with growth since people’s income increases. With higher incomes, people tend to buy more quality food with higher contents of nutrients. Since FAO’s measure of hunger is only based on calorie intake, it does not inform whether people are becoming nutritionally better or worse.

26
REFERENCES
Aitchison, J. and J. Brown (1957). The Lognormal Distribution. Cambridge: Cambridge University Press. Alderman, H. (1993). New Research on Poverty and Malnutrition: What Are the Implications for Policy? In M. Lipton and J. van der Gaag (eds.) Including the Poor. Washington, D. C.: World Bank Regional and Sectoral Studies. Azzaline, A. (1985). A Class of Distributions which Include the Normal Ones. Scandinavian
Journal of Statistics, Vol. 12, pp. 171-178. Dandekar, V. (1982). On Measurement of Undernutrition. Economic and Political Weekly, 15 (6), pp. 203-212. Dandekar, V. and Rath, N. (1971). Poverty in India. Poona, Indian School of Political Economy. Deaton, A. (1997). The Analysis of Household Surveys: A Microeconometric Approach to
Development Policy. Baltimore: Johns Hopkins University Press. De Weerdt, J., K. Beegle, J. Friedman, and J. Gibson (2014). The Challenge of Measuring Hunger. Policy Research Working Paper Series 6736. Washington D. C.: The World Bank. Economist (2015). Nutrition in India of Secrecy and Stunting. July 4th Edition. Food and Agriculture Organization (1977). The Fourth World Food Survey. Rome: FAO. Food and Agriculture Organization (1996). Rome Declaration on World Food Security and
World Food Summit Plan of Action. World Food Summit 13–17 November 1996. Rome: FAO. Food and Agriculture Organization (2009). Declaration of World Summit on Food Security. Rome: FAO. Food and Agriculture Organization (2013). The State of Food Insecurity in the World: Multiple Dimensions of Food Security. Rome: FAO. Food and Agriculture Organization (2015). The State of Food Insecurity in the World. Rome: FAO. Food and Agriculture Organization, World Health Organization, and United Nations University (1985). Protein and Energy Requirements. Rome: FAO. Food and Agriculture Organization, World Health Organization, and United Nations University (2004). Human Energy requirements: Report of a joint FAO, WHO and UNU Expert Consultation Rome 17-24 October 2001. Accessed at http://www.fao.org/3/a-y5686e.pdf

27
Gopalan, C. (1992). Undernutrition: Measurement and Implication in Osmani, S.R (1992), Nutrition and Poverty (ed.), Clarendon Press: Oxford. Iyenger, N. (1960). On a Method of Computing Engel Elasticity from Concentration Curves. Economterica, Vol. 28, pp. 882-91. Kakwani, N. (1989). On Measuring Undernutrition. Oxford Economic Papers, Vol. 41, pp. 528-552. Kakwani, N. (1992). Measuring Undernutrition with Variable Calorie Requirements, in Osmani (edited), Nutrition and Poverty, Clarendon Press: Oxford. Kakwani, N. (2010). A New Model for Constructing Poverty Lines. Discussion Paper Series 2010-06. Manila: Philippine Institute for Development Studies. Kakwani, N. and H. Son. (2016). Global Poverty Estimates Based on 2011 Purchasing Power Parity: Where Should the New Poverty Line be Drawn?. Journal of Economic Inequality (forthcoming). Lipton, M. (1983). Poverty, Undernutrition and Hunger. World Bank Staff Working Paper No 597 Washington D.C.: World Bank. Lele U. (2015). Measuring Poverty and Hunger Can Raise More Questions than Answers, Future Development Economics to End Poverty, www.brookings.edu/blogs on 15 June 2015. Naiken L. (1998). On Certain Statistical Issues Arising from the Use of Energy Requirements in
Estimating the Prevalence of Energy Inadequacy (Undernutrition). Journal of the Indian Society of Agricultural Statistics, Vol. 2 (2.3), pp. 113-128. Naiken L. (2002). FAO Methodology for Estimating the Prevalence of Undernourishment. Keynote paper presented at the International Scientific Symposium on Measurement of Food Deprivation and Undernutition, Rome. Ojha, P. (1970). A Configuration of Indian Poverty: Inequality and Levels of Living. Reserve
Bank of India Bulletin, 24 (1), pp. 16-27. Osmani, S. (1992a). Nutrition and Poverty, Oxford: Clarendon Press. Osmani, S. (1992b). On Some Controversies in the Measurement of Undernutrition. In Osmani, S.R. Nutrition and Poverty (eds.), Oxford: Clarendon Press. Payne, P. (1985). Nutritional Adoptation in Man: Social Adjustment and Their Nutritional Implications. In Blaxter and Waterlow (eds.) Nutritional Adoptation In Man, London: John Libbey.

28
Payne, P. (1992). Assessing Under nutrition: The Need for a Reconceptualization. In Osmani, S.R Nutrition and Poverty (eds.), Oxford: Clarendon Press. Reutilinger, S. and M. Selowsky (1976). Malnutrition and Poverty: Magnitude and Policy
Options. Baltimore: Johns Hopkins University Press. Rowntree, B. (1901). Poverty: A Study of Town Life. London: Macmillan. Seckler, D. (1982). Small but Healthy: A basic hypothesis in Theory and Measurement Policy in Malnutrition. In P.V. Sukhatme (eds.) Newer Concepts in nutrition and their implications for
policy. India: Maharashtra Association for the Cultivation of Science Research Institute. Seckler, D. (1984). Malnutrition: An Intellectual Odyssey. In K.T. Achaya(eds.), Interfaces
between Agriculture, Nutrition and Food Science. Tokyo: United Nations University. Sen, A. (1981). Poverty and Famines: An Essay on Entitlement and Deprivation. New York: Oxford University Press. Sen, A. (1989). Food and Freedom. World Development, Vol. 17(6), pp. 769-781. Srinivasan, T. (1981). Malnutrition: Some Measurement and Policy Issues. Journal of
Development Economics, Vol. 8, pp. 3-19. Srinivasan, T. (1992). Undernutrition: Concepts, Measurement and Policy Implications in Osmani, S.R. (1992), Nutrition and Poverty (ed.), Clarendon Press: Oxford. Sukhatme, P. (1961). The World’s Hunger and Future Needs in Food Supplies. Journal of the
Royal Statistical Society, Vol. 124, pp. 463-525. Sukhatme, P. (1977). Incidence of Undernutrition. India Journal of Agricultural Economics. Vol. 32 (3), pp. 1-7. Sukhatme, P. (1981). Relationship between Malnutrition and Poverty. Delhi: Indian Association of Social Science Institutions. Sukhatme, P. (1982). Measurement of Undernutrition. Economic and Political Weekly. 17(50), pp. 2000-2016. Sukhateme, P. and S. Margen (1992). Autoregulatory and homeostatic Nature of Energy
Balance. American Journal of Clinical Nutrition. Vol. 35, pp. 355-365.

29
APPENDIX
Table A.1: FAO data on food and nutrition consumption
Country Survey
year Per capita
expenditure Per capita
food Per capita
kilo calorie Per capita
protein Per capita
fats Per capita
carbohydrates
Azerbaijan 2006 6.04 3.13 2856 78.31 76.1 448.62
Bangladesh 2000-01 1.61 0.83 2195 56.52 29.98 411.04
2005 1.88 0.91 2119 49.61 26.43 417.26
Bolivia 2003-04 4.99 1.81 1866 63.54 38.85 305.11
Cambodia 2004 1.60 1.14 2014 55.09 29.33 370.41
2009 2.25 1.59 2055 63.12 36.65 352.75
Chad 2009 2.05 1.44 2461 82.11 52.25 393.75
Côte d'Ivoire 2002 3.66 1.11 2105 63.69 46.74 343.89
Guatemala 2006 5.93 2.17 2290 65.02 50.12 379.11
Haiti 1999-2000
2.68 1.54 2324 57.5 61.76 384.96
Hungary 2004 11.57 2.96 2450 79.91 107.5 280.79
Kenya 2005-06 2.84 1.30 1799 52.4 41.94 301.02
Lao PDR 2008 2.82 1.55 2571 69.09 24.98 502.75
Lithuania 2002 9.41 4.38 2811 86.5 123.74 319.43
Malawi 2004-05 1.57 1.03 2237 74.32 47.51 375.7
Mali 2001 1.76 1.15 2276 63.49 44.73 396.68
Mexico 2004 10.68 2.89 2170 78.51 68.78 290.68
Moldova 2006 5.90 3.21 2690 92.62 90.08 364.37
Mozambique 2002-03 1.15 0.63 1955 51.6 41.83 341.26
Nepal 1995-96 1.28 0.77 2231 50.51 25.06 434.63
Niger 2007-08 2.17 0.68 1938 56.73 33.99 336.82
Pakistan 2005-06 1.93 1.05 1949 59.67 51.49 298.67
Panama 2008 11.24 3.38 2371 83.66 78.51 314.92
Papua New Guinea
1996 4.00 1.93 2003 47.61 43.54 334.42
Paraguay 1997-98 8.14 3.18 2837 84.06 94.09 388.31
Philippines 2003 3.38 1.57 1900 53.17 33.56 346.27
Sri Lanka 1999-2000
2.85 1.38 2182 56.42 47.29 372.32
Sudan 2009 2.78 1.70 2238 69.37 54.32 343.77
Tajikistan 2007 5.70 3.63 2617 69.55 71.93 408.85
Togo 2006 1.66 1.06 2159 66.41 37.65 385.94
Uganda 2002-03 1.84 0.84 2159 50.08 28.77 394.05
2005-06 1.97 0.84 2006 47.48 25.15 365.78
Source: Authors’ calculations based on FAO database.

30
Table A.2: Percentage and number of food-insecure persons for 126 countries,
2002 and 2012
2002 2012
Country Percentage
(%) Number (million)
Percentage (%)
Number (million)
Cambodia 23.84 3.03 2.27 0.34
China 23.91 306.14 3.59 48.49
Fiji 2.68 0.02 1.67 0.01
Indonesia 11.38 24.47 4.95 12.22
Lao PDR 29.98 1.66 20.57 1.37
Malaysia 2.73 0.67 0.03 0.01
Micronesia, Fed. States of (Urban) 44.06 0.01 42.56 0.01
Papua New Guinea 50.91 2.88 26.58 1.91
Philippines 10.76 8.71 7.16 6.92
Thailand 0.52 0.33 0.03 0.02
Timor-Leste 31.59 0.28 14.94 0.17
Vietnam 26.04 20.71 1.46 1.30
East Asia and Pacific 20.85 368.93 3.81 72.76
Albania 0.94 0.03 0.48 0.01
Armenia 8.07 0.25 0.78 0.02
Azerbaijan 0 0.00 0 0.00
Belarus 1.2 0.12 0 0.00
Bosnia and Herzegovina 0.22 0.01 0.06 0.00
Bulgaria 0.75 0.06 1.54 0.11
Croatia 0.03 0.00 0 0.00
Czech Rep. 0.04 0.00 0.06 0.01
Estonia 0.71 0.01 0.83 0.01
Georgia 11.1 0.48 10.97 0.49
Hungary 0 0.00 0.26 0.03
Kazakhstan 3.32 0.49 0.02 0.00
Kyrgyz Rep. 21.91 1.09 1.71 0.10
Latvia 0.47 0.01 1.1 0.02
Lithuania 0.16 0.01 0.86 0.03
Macedonia, former Yugoslav Rep. of 0.76 0.02 0.85 0.02
Moldova 10.14 0.37 0.07 0.00
Montenegro 0.19 0.00 1.18 0.01
Poland 0.01 0.00 0.01 0.00
Romania 3.13 0.68 0 0.00
Russian Federation 0.34 0.49 0.01 0.01
Serbia 0.25 0.02 0.05 0.00
Slovak Rep. 0.08 0.00 0.17 0.01
Slovenia 0 0.00 0 0.00

31
Tajikistan 22.46 1.44 2.36 0.19
Turkey 0.58 0.38 0 0.00
Turkmenistan 22.84 1.05 1.22 0.06
Ukraine 0.7 0.34 0 0.00
Europe and Central Asia 1.66 7.35 0.26 1.15
Argentina (Urban) 10.67 3.64 1.18 0.45
Belize 8.68 0.02 9.89 0.03
Bolivia 21.33 1.89 7.88 0.83
Brazil 8.91 15.98 3.77 7.49
Chile 1.97 0.31 0.82 0.14
Colombia 11.59 4.78 5.27 2.51
Costa Rica 5.18 0.21 1.26 0.06
Dominican Rep. 4 0.36 1.66 0.17
Ecuador 13.82 1.80 4.31 0.67
El Salvador 12.25 0.74 2.36 0.15
Guatemala 15.4 1.81 8.35 1.26
Guyana 10.11 0.08 7.85 0.06
Haiti 48.38 4.29 47.74 4.86
Honduras 25.07 1.63 17.04 1.35
Jamaica 1.6 0.04 0.51 0.01
Mexico 5.89 6.29 1.66 2.01
Nicaragua 10.74 0.56 6.43 0.39
Panama 9.24 0.29 3.25 0.12
Paraguay 10.78 0.60 2.57 0.17
Peru 11.6 3.10 2.66 0.80
St. Lucia 25.41 0.04 22.55 0.04
Suriname 20.87 0.10 16.95 0.09
Trinidad and Tobago 1.17 0.01 0.23 0.00
Uruguay (Urban) 0.46 0.01 0.19 0.01
Venezuela, Rep. Bolivariana de 13.36 3.38 7.44 2.23
Latin America and Caribbean 10.00 51.97 4.40 25.90
Djibouti 14.19 0.11 14.12 0.12
Iran, Islamic Rep. of 1.5 1.02 0.05 0.04
Jordan 0.35 0.02 0.1 0.01
Morocco 3.04 0.89 0.7 0.23
Tunisia 2.12 0.21 0.92 0.10
Middle East and North Africa 1.99 2.24 0.39 0.49
Bangladesh 41.43 56.76 23.24 35.95
Bhutan 24.34 0.15 1.13 0.01
India 27.09 291.68 9.76 120.70
Maldives 8.11 0.02 0.03 0.00
Nepal 37.45 9.03 4.5 1.24
Pakistan 15.15 22.68 2.38 4.26

32
Sri Lanka 3.57 0.68 0.9 0.18
South Asia 27.07 380.99 10.02 162.34
Angola 52.38 7.80 20.78 4.33
Angola (Urban) 23.72 1.80 40.85 4.11
Benin 38.54 2.86 8.81 0.18
Botswana 25.27 0.46 34.81 5.73
Burkina Faso 56.58 6.96 68.37 6.73
Burundi 72.39 5.10 9.01 0.04
Cabo Verde 20.84 0.10 19.18 4.16
Cameroon 15.69 2.63 51.57 2.34
Central African Rep. 55.66 2.10 28.28 3.52
Comoros 8.81 0.05 10.26 0.07
Congo, Democratic Rep. of 89.7 44.42 69.59 45.73
Congo, Rep. of 43.79 1.44 21.16 0.92
Cote d'Ivoire 16.18 2.70 20.65 4.10
Ethiopia 32.75 22.91 18.23 16.72
Gabon 4.55 0.06 3.53 0.06
Gambia, The 54.95 0.72 36.65 0.66
Ghana 22.88 4.53 9.16 2.32
Guinea 51.88 4.70 24.32 2.78
Guinea-Bissau 42.16 0.56 53.57 0.89
Kenya 22.6 7.46 18.57 8.02
Lesotho 55.02 1.04 50.6 1.04
Liberia 39.06 1.20 34.21 1.43
Madagascar 68.7 11.50 75.08 16.74
Malawi 64.21 7.66 62.51 9.95
Mali 47.18 5.13 38.8 5.76
Mauritania 12.02 0.35 6.1 0.23
Mauritius 0.35 0.00 0.27 0.00
Mozambique 74.79 14.45 52.39 13.20
Namibia 28.54 0.56 13.51 0.31
Niger 69.27 8.19 29.99 5.15
Nigeria 60.29 77.91 42 70.91
Rwanda 64.2 5.77 46.51 5.33
Sao Tome and Principe 22.41 0.03 21.64 0.04
Senegal 37.22 3.87 28.84 3.96
Seychelles 0.35 0.00 0 0.00
Sierra Leone 51.2 2.30 36.94 2.21
South Africa 28.29 12.89 11.56 6.05
Sudan 17.35 5.06 7.72 2.87
Swaziland 37.47 0.40 35.03 0.43
Tanzania 68.82 24.64 34.29 16.38
Togo 46.01 2.36 44.06 2.93

33
Uganda 51.46 13.35 23.73 8.63
Zambia 39.43 4.19 54.61 7.69
Sub-Saharan Africa 48.37 322.18 33.84 294.63
Developing World 23.05 1,133.65 10.01 557.28 Source: Authors’ calculations.