measuring and monitoring trends in home health therapy ... · – 1 million episodes ended in 2007...
TRANSCRIPT

2/27/2012
1
Measuring and Monitoring Trends in Home Health Therapy Utilization
Combined Sections Meeting 2012
Home Health Section of American Physical Therapy Association
www.ocshomecare.com | © 2012 National Research Corporation 2
Agenda
� Identify measures and benchmarks of therapy utilization
� Discuss changes in health policy requirements impacting providing therapy services.
� Explore therapy utilization trends and benchmarks• Prediction vs. actual utilization• Average for agency • Average & median for patient receiving specific discipline

2/27/2012
2
www.ocshomecare.com | © 2012 National Research Corporation 3
A Word About the Data
� PPS Analyses are: • Based on the OCS Proprietary Data Set
– Over 2,000 agency locations– 1 million episodes ended in 2007– 1.6 million episodes ended in 2010– 1.8 million episodes ended in 2011
• Unless otherwise noted, represent:– Non-LUPA, non-outlier episodes– Wage and therapy adjusted reimbursement– Traditional Medicare patients
www.ocshomecare.com | © 2012 National Research Corporation 4
2010 Case Weight
1.35
1.41
1.001.051.101.151.201.251.301.351.401.451.50
RAP Adjusted
Avg. CW(StandardEpisodes)

2/27/2012
3
www.ocshomecare.com | © 2012 National Research Corporation 5
Adjustment Impact
-7.2%
4.4%
-8%
-6%
-4%
-2%
0%
2%
4%
6%
National 2007 National 2010
www.ocshomecare.com | © 2012 National Research Corporation 6
Adjusted Reimbursement
$2,642$2,833$2,929
$3,171
$-
$500
$1,000
$1,500
$2,000
$2,500
$3,000
$3,500
All Standard
2007 National 2010 National

2/27/2012
4
www.ocshomecare.com | © 2012 National Research Corporation 7
Visits
Total = 17.4
Average Visits per Standard Episode
8.0
6.0
3.2
0.2
Total = 18.1
8.3
7.1
2.2
0.2
0
2
4
6
8
10
12
14
16
18
20
2007 2010
MSW
HHA
Therapy
SN
Visits per Episode
8

2/27/2012
5
www.ocshomecare.com | © 2012 National Research Corporation 9
Modeled Reimbursement Changes
$0
$1,000
$2,000
$3,000
$4,000
$5,000
$6,000
$7,000
0 1 2 3 4 5 6 7 8 9 10 11 12 13 14 15 16 17 18 19 20 21 22 23 24
2007 Reimbursement 2008 Methodology
Percent of Visits in the Therapy Thresholds
10

2/27/2012
6
www.ocshomecare.com | © 2012 National Research Corporation 11
Distribution by Therapy Visits
Distribution of Standard Episodes
42% 39%
15%14%
11% 15%
17%11%
10%12%
5% 9%
0%
10%
20%
30%
40%
50%
60%
70%
80%
90%
100%
Therapy in 2007 Therapy in 2010
20+ therapy visits
14 to 19 visits
10 to 13 visits
6 to 9 therapy visits
1 to 5 therapy visits
0 therapy visits
www.ocshomecare.com | © 2012 National Research Corporation 12
Distribution by Therapy Visits
PPS 2010 Distribution of Episodes, based on total t herapy
0%
1%
2%
3%
4%
5%
6%
Expected Actual
2/27/2012
7
www.ocshomecare.com | © 2012 National Research Corporation 13
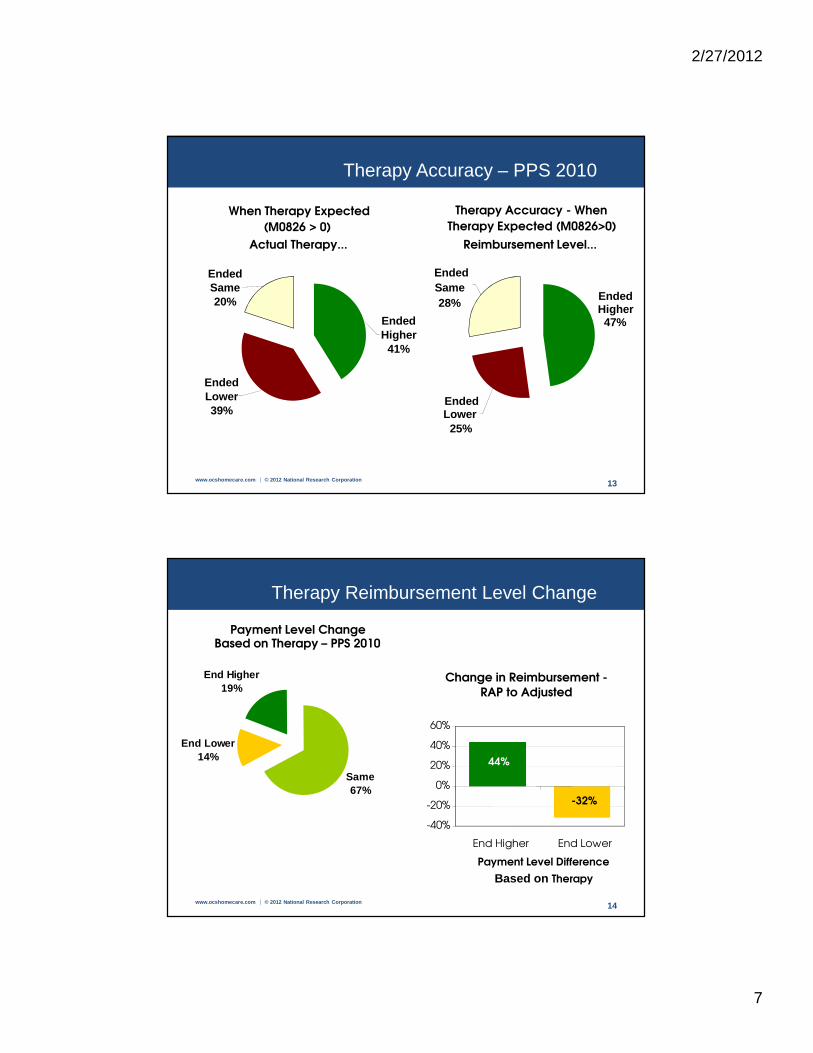
Therapy Accuracy – PPS 2010
When Therapy Expected
(M0826 > 0)
Actual Therapy...
Therapy Accuracy - When
Therapy Expected (M0826>0)
Reimbursement Level...
Ended Higher
41%
Ended Same20%
Ended Lower39%
Ended Lower
25%
Ended Higher47%
Ended Same28%
www.ocshomecare.com | © 2012 National Research Corporation 14
Therapy Reimbursement Level Change
Change in Reimbursement -
RAP to Adjusted
44%
-32%
-40%
-20%
0%
20%
40%
60%
End Higher End Lower
Payment Level Difference
Based on Therapy
Payment Level Change Based on Therapy – PPS 2010
Same67%
End Lower14%
End Higher19%
2/27/2012
8
www.ocshomecare.com | © 2012 National Research Corporation 15
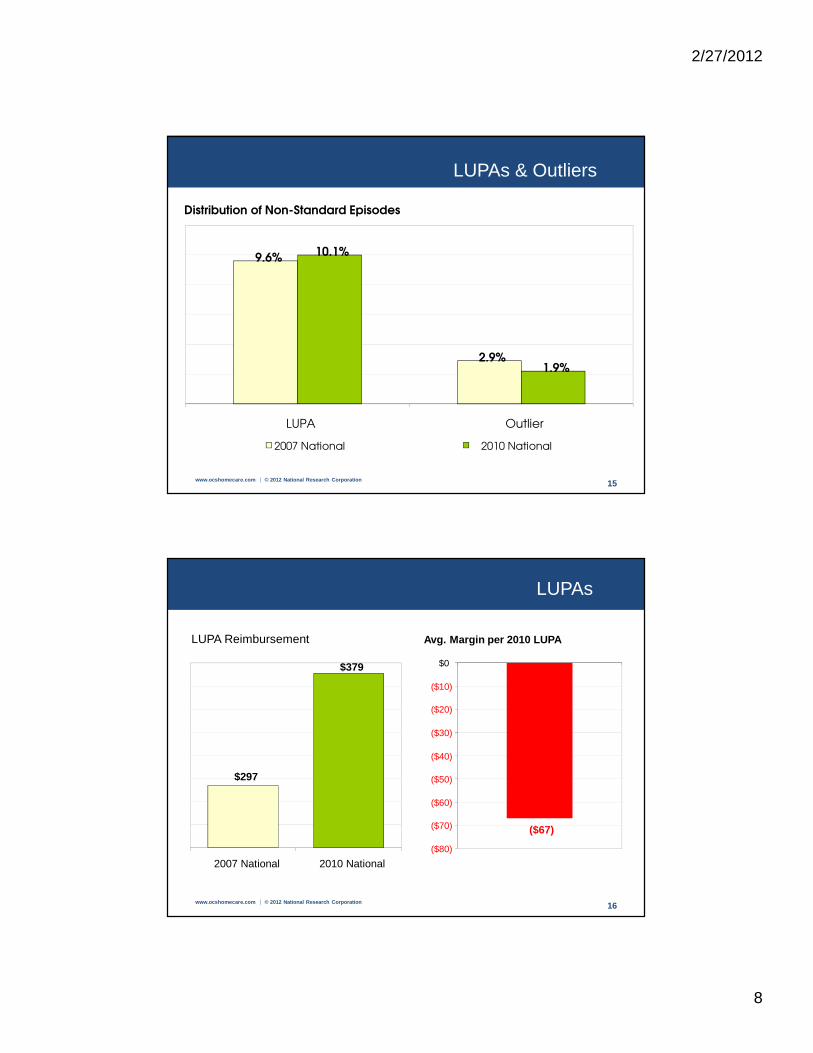
LUPAs & Outliers
Distribution of Non-Standard Episodes
9.6%
2.9%
10.1%
1.9%
LUPA Outlier
2007 National 2010 National
www.ocshomecare.com | © 2012 National Research Corporation 16
LUPAs
LUPA Reimbursement
$297
$379
2007 National 2010 National
-19%
Avg. Margin per 2010 LUPA
($67)
($80)
($70)
($60)
($50)
($40)
($30)
($20)
($10)
$0

2/27/2012
9
www.ocshomecare.com | © 2012 National Research Corporation 17
Outliers
Total Outlier Reimbursement
$4,676
$5,295
2007 National 2010 National
-83%
Avg. Margin per 2010 Outlier
($3,631)($4,000)
($3,500)
($3,000)
($2,500)
($2,000)
($1,500)
($1,000)
($500)
$0
Visits per Episode
18

2/27/2012
10
Visits per Occurrence (Patient) )
19
www.ocshomecare.com | © 2012 National Research Corporation 20
When a Discipline is utilized: Mean vs. Median
CG
PT OT ST
Average Median Average Median Average Median
National 9.03 9.05 5.80 5.48 6.16 5.74
Region-1 7.13 7.20 4.44 4.49 4.56 4.37
Region-4 10.34 10.16 6.68 6.20 6.69 6.42
� National = all 10 Medicare Regions� Region 1 = New England (Low), also West and Northwest� Region 4 = South (High), as Northeast
� When mean and median are similar, then similar variation.� When variation, then uneven distribution of visits provided per
patient receiving the discipline

2/27/2012
11
www.ocshomecare.com | © 2012 National Research Corporation 21
What Diagnosis Are Most Frequent?
When PT Utilized When OT Utilized When ST Utilized
V54-Other orthopedic aftercare V54-Other orthopedic aftercare438-Late effects of cerebrovascular disease
V57-Care involving use of rehabilitation procedures
V57-Care involving use of rehabilitation procedures
V57-Care involving use of rehabilitation procedures
V58-Encounter for other and unspec. procedures and aftercare
438-Late effects of cerebrovascular disease 401-Hypertension
428-Congestive Heart FailureV58-Encounter for other and unspecified procedures and aftercare 428-Congestive Heart Failure
250-DM 428-Congestive Heart Failure 250-DM
438-Late effects of cerebrovascular disease 250-DM
V58-Encounter for other and unspec. procedures & aftercare
401-Hypertension 401-Hypertension V54- Other orthopedic aftercare
491Chronic bronchitis 491Chronic bronchitis 707- Chronic ulcer of skin
781-Symptoms involving nervous and musculoskeletal systems 707-Chronic ulcer of skin 332- Parkinson's disease
707-Chronic ulcer of skin781-Symptoms involving nervous and musculoskeletal systems
331- Other cerebral degenerations
www.ocshomecare.com | © 2012 National Research Corporation 2222
Changing Performance Data
� CMS is shifting the way that they provide and use d ata to evaluate home health quality performance• Performance Triangle
– Quality – OASIS-C outcomeso Patient-focused
» Positive: Behavioral, functional, clinical
» Negative: Adverse Events
– Process Measures – driven by OASIS-Co Provider activities that support best practices
– Satisfaction – facilitated by HH-CAHPSo Patient/Family Perception of Care
� Future change ideas:• Composite scores: Standardized Outcome Index (SOI)• Sub-population specific measures: Orthopedic

2/27/2012
12
www.ocshomecare.com | © 2012 National Research Corporation 23
OCS Standardized Outcome Index™
� Composite Scoring� Several key ADLs/IADLs and compared scores
at SOC to scores at discharge to identify the change in patient status
� Values assigned to improved, stabilized and declined
� Outcome Scores were developed at the patient level and then rolled up to an agency level for comparative analysis of overall outcome trends
www.ocshomecare.com | © 2012 National Research Corporation 24
SOI® Variation by Diagnosis
Trended Average SOI by Primary Diagnosis
0.40
0.60
0.80
1.00
1.20
1.40
1.60
1.80
2.00
2002Q1 2002Q2 2002Q3 2002Q4 2003Q1 2003Q2 2003Q3 2003Q4
428486707715781
Trended Average SOI by Primary Diagnosis
0.40
0.60
0.80
1.00
1.20
1.40
1.60
1.80
2.00
2002Q1 2002Q2 2002Q3 2002Q4 2003Q1 2003Q2 2003Q3 2003Q4
428486707715781
2/27/2012
13
www.ocshomecare.com | © 2012 National Research Corporation 25
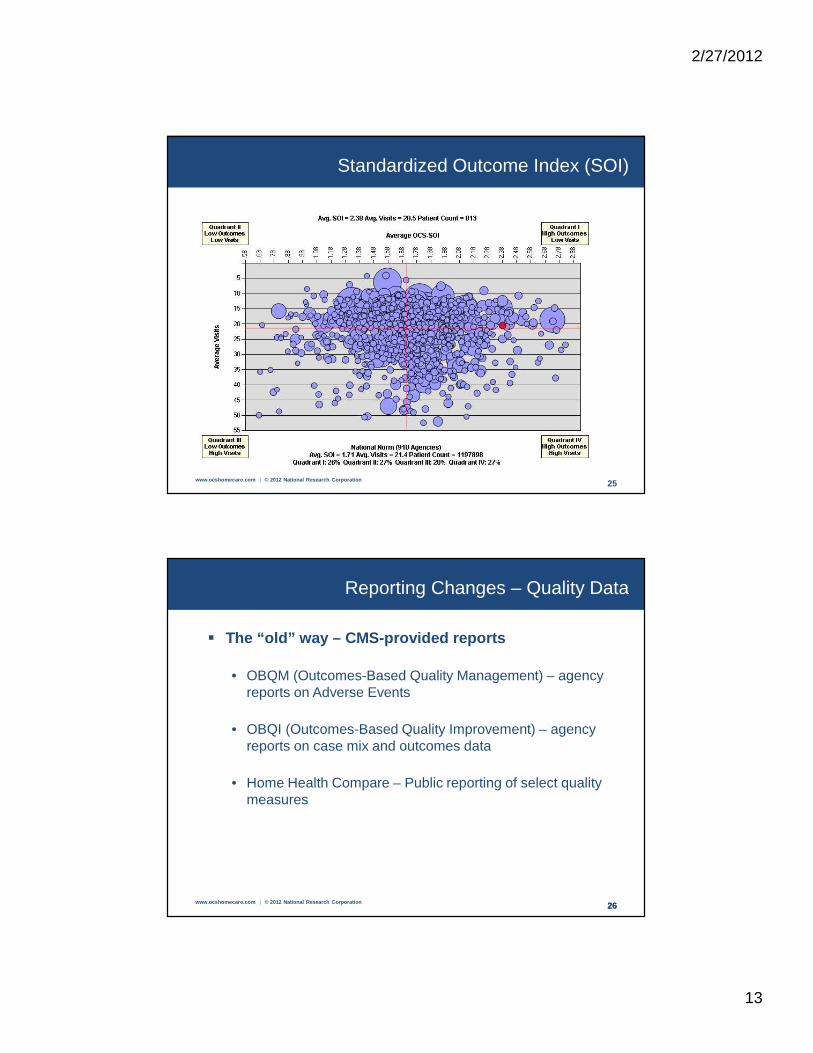
Standardized Outcome Index (SOI)
www.ocshomecare.com | © 2012 National Research Corporation 2626
Reporting Changes – Quality Data
� The “old” way – CMS-provided reports
• OBQM (Outcomes-Based Quality Management) – agency reports on Adverse Events
• OBQI (Outcomes-Based Quality Improvement) – agency reports on case mix and outcomes data
• Home Health Compare – Public reporting of select quality measures

2/27/2012
14
www.ocshomecare.com | © 2012 National Research Corporation 2727
� The “new” way – CMS is/plans to provide information• 2010-2011 CMS Public reporting “blackout”• CMS has changed all reports• CMS has added new measures• Adverse Events � Potentially Avoidable Events• OBQI Reports and Home Health Compare � OASIS-C OBQI
Reports and Home Health Compare publication– Measure changes– Risk Adjustment changes – NEW model developed in
2011 and updated release in 2012o New CASPER (CMS home health reporting system for
agencies) Reports were delayed until July 2011o New Home Health Compare measures published in July
2011• Future changes in OASIS-C – ICD-10, etc.
Reporting Changes – Quality Data
www.ocshomecare.com | © 2012 National Research Corporation 2828
� The “new” way – CMS plans to provide information• NEW: Process Measures – PBQI (Process-Based Quality
Improvement) reports plus public reporting• NEW: HH-CAHPS Reporting
– CAHPS = Consumer Assessment of Healthcare Providers and Systems
– Requirement for standardized collection of patient satisfaction data using an approved vendor
– Public Reportingo Population based not patiento Patient Experience, not only clinical careo Time delay in collecting and reporting
Reporting Changes – Process & Satisfaction Data

2/27/2012
15
www.ocshomecare.com | © 2012 National Research Corporation 29
CMS Reporting Changes Timeline
Measure Type Report Method Date Available Data Period of:
OASIS-C Process CASPER(No Risk Adj.)
9/2010 1/2010-6/2010(6 months)
OASIS-C Process HH Compare(No Risk Adj.)
10/2010 1/2010-6/2010(6 months)
OASIS-C Outcome
CASPER(New Risk Adj.)
05/2011 (postponed)
07/2011 (revised)
3/2010-2/2011(12 months)
OASIS-C Outcome
HH Compare(New Risk Adj.)
07/2011 4/2010-3/2011(12 months)
HHCAHPS HH Compare(New Risk Adj.)
04/2012HHCAHPSHHCompare
10/2010-9/2011(4 quarters)
www.ocshomecare.com | © 2012 National Research Corporation 30
MedPAC March 2011 Recommendations
� Current payment system is flawed, as it creates incentives for patient selection
� Current case mix model suggests• Therapy is overvalued• Non-therapy services undervalued• i.e. no longer use the number of therapy visits as a
payment factor� Recommend revising payment system

2/27/2012
16
www.ocshomecare.com | © 2012 National Research Corporation 3131
Public Reporting
Domains of Measures
PatientExperience
ProcessMeasures
Outcome Measures
www.ocshomecare.com | © 2012 National Research Corporation 3232
A Word About the Data
� Outcomes and Process Data • Based on the OCS Proprietary Data Set
– Over 2,000 agency locations– Almost two million cases in 2010
� HH-CAHPS Data• Based on the OCS Proprietary Data Set
– Relatively early results from a three month snapshot– More than 1,500 agency locations– Almost 200,000 surveys sent, 32% response rate
• Powered by NRC Picker

2/27/2012
17
www.ocshomecare.com | © 2012 National Research Corporation 33
New OASIS-C Measures
� Potentially Avoidable Events (12 total)
• Development of Urinary Tract Infection
• Discharged to Community: – with Unhealed Stage II
Pressure Ulcer Present for More than 30 days
– with Behavioral Problems – Needing Toileting Assistance – Needing Wound Care or
Medication Assistance
• Emergent Care for: – Hypo/Hyperglycemia – Improper Medication Administration,
Medication Side Effects – Injury Caused by Fall – Wound Infections, Deteriorating
Wound Status • Increase in Number of Unhealed
Pressure Ulcers • Substantial Decline in 3 or more
Activities of Daily Living • Substantial Decline in Management
of Oral Medications
www.ocshomecare.com | © 2012 National Research Corporation 34
Hospitalization and Emergent Care
National
ACH 27.6%
Discharged Home 67.6%
ACH - Injury caused by
Fall 1.4%
Inpatient Facility Admission
Hospital 29.3%
Nursing Home 0.6%
Rehab Facility 0.4%
Hospice 0.1%

2/27/2012
18
www.ocshomecare.com | © 2012 National Research Corporation 35
New OASIS-C OBQI Measures
� OBQI Clinical Status Improvement (10)• Improvement in
– Anxiety Level – Behavior Problem
Frequency – Bowel Incontinence – Confusion Frequency – Dyspnea – Pain Interfering with Activity – Speech and Language – Status of Surgical Wounds – Urinary Incontinence – Urinary Tract Infection
� OBQI Clinical Status Stabilization (3)• Stabilization in
– Anxiety Level – Cognitive Functioning– Speech and Language
� Utilization Measures (4)• Acute Care Hospitalization • Discharged to Community• Emergency Department Use
(Without Hospitalization)• Emergency Department Use
(With Hospitalization)
www.ocshomecare.com | © 2012 National Research Corporation 36
New OASIS-C OBQI Measures
� OBQI Functional Status Improvement (12)• Improvement in:
– Ambulation/Locomotion – Bathing – Bed Transferring – Dressing – Lower Body – Dressing – Upper Body – Eating – Grooming – Light Meal Preparation – Management of Oral
Medications – Phone Use – Toileting Hygiene – Toilet Transferring
� OBQI Functional Status Stabilization (10)• Stabilization in:
– Bathing – Bed Transferring – Grooming – Light Meal Preparation – Management of Oral
Medications – Phone Use – Toileting Hygiene – Toilet Transferring

2/27/2012
19
www.ocshomecare.com | © 2012 National Research Corporation 37
HHC – OASIS-C Outcomes
To be published on Home Health Compare� Utilization
• Acute Care Hospitalization* • Emergency Department Care Without Hospitalization
* Unexpectedly changed calculations• Used to include all hospitalizations• Now only includes unplanned hospitalizations
www.ocshomecare.com | © 2012 National Research Corporation 38
Patient Discharge Disposition
National
Patient Discharge Disposition
Remained in community without formal assistance 80.7 %
Remained in community with formal assistance 15.7%
Transferred to a non-institutional hospice 2.0%
Unknown because patient moved 0.7%
UK – Other unknown 0.8%
© OCS HomeCare 2011 National Benchmarks

2/27/2012
20
www.ocshomecare.com | © 2012 National Research Corporation 39
HHC – OASIS-C Outcomes
To be published on Home Health Compare� Functional Outcomes
• Improvement in Ambulation/Locomotion • Improvement in Bathing • Improvement in Bed Transferring • Improvement in Management of Oral Medications
� Health Outcomes • Improvement in Dyspnea • Improvement in Status of Surgical Wounds • Improvement in Pain Interfering with Activity
� Potentially Avoidable Events • Increase in Number of Unhealed Pressure Ulcers
www.ocshomecare.com | © 2012 National Research Corporation 40
Home Health Compare Outcomes
Improvement MeasuresNational Benchmark, 2010
65%
85%
66%58%
67%56%
51%
0%10%20%30%40%50%60%70%80%90%
Dyspnea Status ofSurgicalWounds
Pain Ambulation/Locomotion
Bathing BedTransferring
Mangmntof Oral Meds
Clinical Status Functional Status

2/27/2012
21
www.ocshomecare.com | © 2012 National Research Corporation 41
Home Health Compare
Outcome Measures National Benchmark, 2010
27%
4%
0.4%0%
5%
10%
15%
20%
25%
30%
Acu
te C
are
Hos
pita
lizat
ion
Em
erge
ntC
are
with
out
Hos
pita
lizat
ion
Incr
ease
in #
of U
nhea
led
Pre
ssur
eU
lcer
s
www.ocshomecare.com | © 2012 National Research Corporation 42
HHC – New OASIS-C Process Measures
� Process Measures endorsed by NQF and to be reported on Home Health Compare (HHC) and PBQI (process-based quality improvement) reports• Timely Initiation Of Care• Depression Assessment Conducted• Multifactor Fall Risk Assessment Conducted For
Patients 65 And Over• Pain Assessment Conducted• Pressure Ulcer Risk Assessment Conducted• Pressure Ulcer Prevention In Plan Of Care• Pneumococcal Polysaccharide Vaccine Ever Received

2/27/2012
22
www.ocshomecare.com | © 2012 National Research Corporation 43
New OASIS-C Process Measures
� Process Measures NOT endorsed by NQF; � CMS determined that they will NOT be reported on
Home Health Compare (HHC); � Will be on PBQI (Process-Based Quality
Improvement) reports• Drug Education On High Risk Medications Provided To
Patient/Caregiver At Start Of Episode• Potential Medication Issues Identified And Timely
Physician Contact At Start Of Episode• Potential Medication Issues Identified And Timely
Physician Contact
Injury Caused by Fall (M2430_2)
National
Region I
New England
Region II
NorEast
Region III
East
Region IV
South
Region V
Central
Region VI
Sowest
Region VII
Midwest
Region VIII
Montain
Region IX
West
Region X
Norwest IL
4.61% 5.03% 3.87% 3.89% 4.95% 4.11% 5.16% 5.74% 8.26% 3.81% 6.17% 3.93%
44

2/27/2012
23
www.ocshomecare.com | © 2012 National Research Corporation 45
Some Data About Falls Resulting in ACH
• 69 days is national median• 25th Percentile at 31 days• 75th percentile falls at 85 days• Half of falls hospitalized are between days 31 and 85
79 days is CMS Region IV median, which is second highest
www.ocshomecare.com | © 2012 National Research Corporation 46
Predicting ACH and EC
M1032 Risk for Hospitalization
There are risks for Hosp
There are norisks for Hosp
ACH 29.92% 9.88%
EC 3.91% 2.36%
(M1032) Risk for Hospitalization: Which of the following signs or symptoms characterize this patient as at risk for hospitalization? (Mark all that apply.)
⃞ 1 - Recent decline in mental, emotional, or behavioral status ⃞ 2 - Multiple hospitalizations (2 or more) in the past 12 months ⃞ 3 - History of falls (2 or more falls - or any fall with an injury - in the past year) ⃞ 4 - Taking five or more medications ⃞ 5 - Frailty indicators, e.g., weight loss, self-reported exhaustion ⃞ 6 - Other
⃞ 7 - None of the above
2/27/2012
24
www.ocshomecare.com | © 2012 National Research Corporation 47
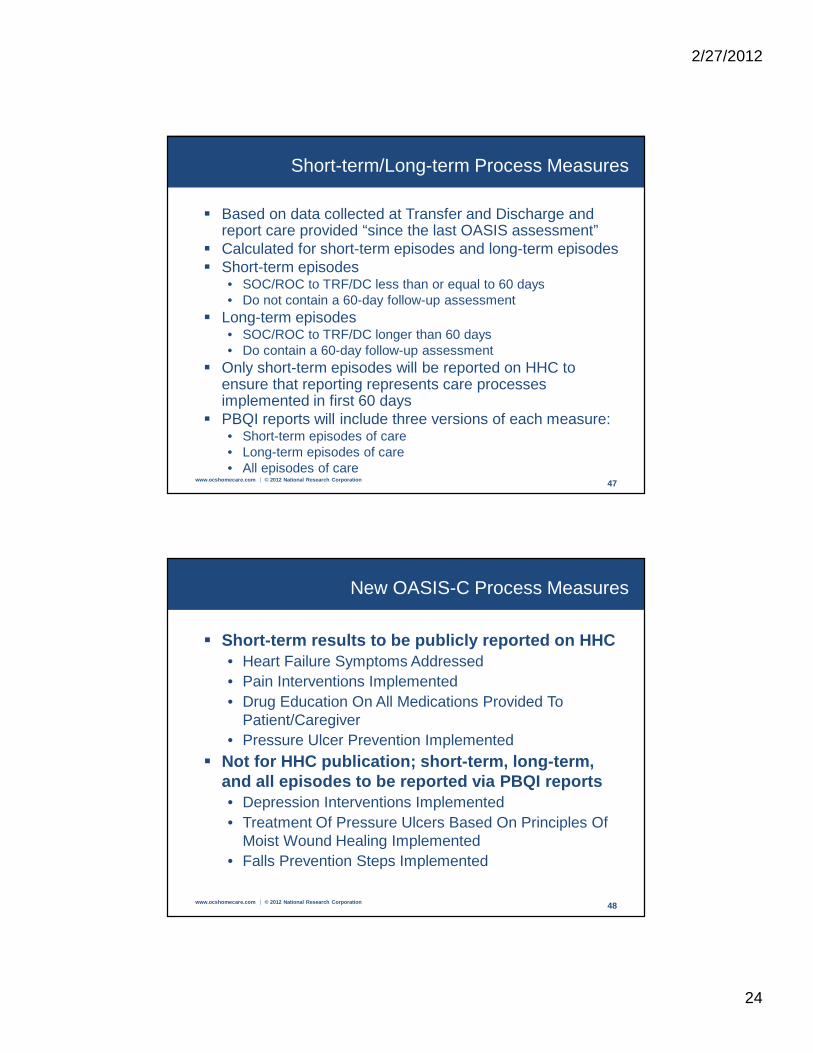
Short-term/Long-term Process Measures
� Based on data collected at Transfer and Discharge and report care provided “since the last OASIS assessment”
� Calculated for short-term episodes and long-term episodes� Short-term episodes
• SOC/ROC to TRF/DC less than or equal to 60 days • Do not contain a 60-day follow-up assessment
� Long-term episodes • SOC/ROC to TRF/DC longer than 60 days • Do contain a 60-day follow-up assessment
� Only short-term episodes will be reported on HHC to ensure that reporting represents care processes implemented in first 60 days
� PBQI reports will include three versions of each measure: • Short-term episodes of care • Long-term episodes of care • All episodes of care
www.ocshomecare.com | © 2012 National Research Corporation 48
New OASIS-C Process Measures
� Short-term results to be publicly reported on HHC• Heart Failure Symptoms Addressed• Pain Interventions Implemented• Drug Education On All Medications Provided To
Patient/Caregiver• Pressure Ulcer Prevention Implemented
� Not for HHC publication; short-term, long-term, and all episodes to be reported via PBQI reports• Depression Interventions Implemented• Treatment Of Pressure Ulcers Based On Principles Of
Moist Wound Healing Implemented • Falls Prevention Steps Implemented
2/27/2012
25
www.ocshomecare.com | © 2012 National Research Corporation 49
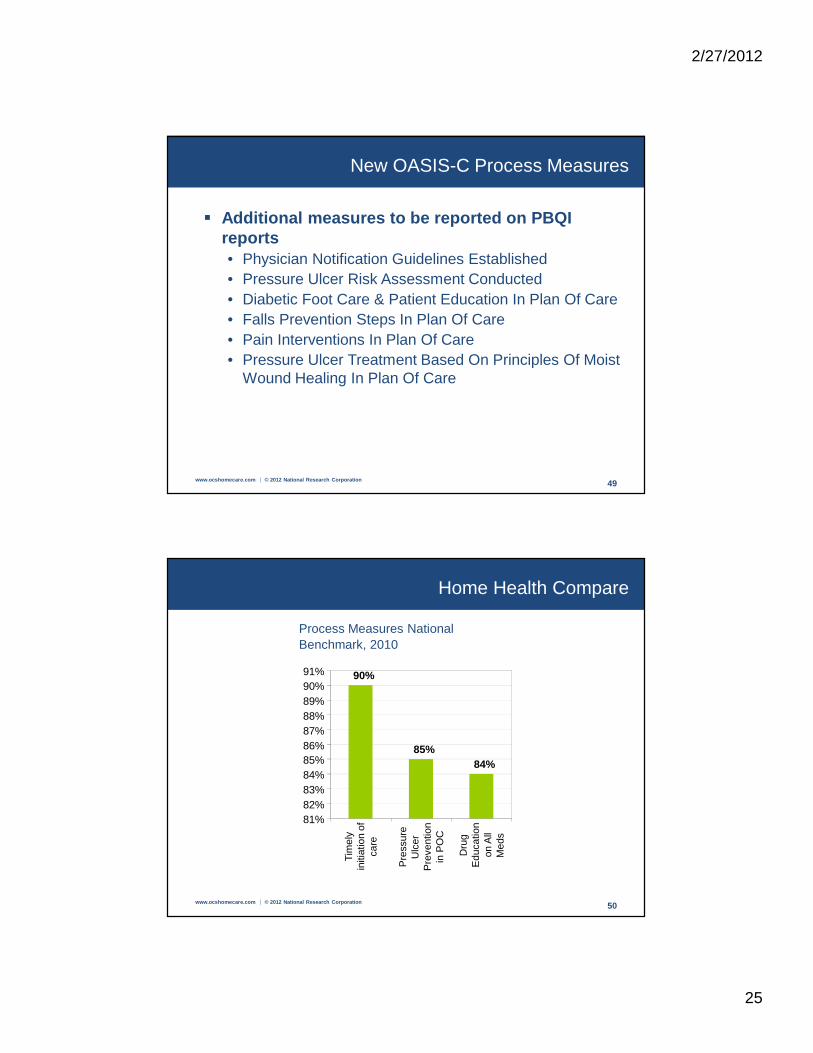
New OASIS-C Process Measures
� Additional measures to be reported on PBQI reports• Physician Notification Guidelines Established• Pressure Ulcer Risk Assessment Conducted• Diabetic Foot Care & Patient Education In Plan Of Care• Falls Prevention Steps In Plan Of Care• Pain Interventions In Plan Of Care• Pressure Ulcer Treatment Based On Principles Of Moist
Wound Healing In Plan Of Care
www.ocshomecare.com | © 2012 National Research Corporation 50
Home Health Compare
Process Measures National Benchmark, 2010
90%
85%84%
81%82%83%84%85%86%87%88%89%90%91%
Tim
ely
initi
atio
n of
care
Pre
ssur
eU
lcer
Pre
vent
ion
in P
OC
Dru
gE
duca
tion
on A
llM
eds

2/27/2012
26
www.ocshomecare.com | © 2012 National Research Corporation 51
Home Health Compare Process Measures
Process Measures - National Benchmark, 2010
93% 94% 97% 97% 97% 94%85%
67%58%
88%
0%10%20%30%40%50%60%70%80%90%
100%
Dep
ress
ion
Fal
ls R
isk
Pai
n
Pre
ssur
e U
lcer
Ris
k
Hea
rt F
ailu
reS
ympt
oms
Add
ress
ed
Pai
n In
terv
entio
nsIm
plem
ente
d
Dia
betic
Foo
tC
are
and
Pat
ient
/Car
egiv
er
Imm
uniz
atio
nR
ecei
ved
for
Cur
rent
Flu
PP
V E
ver
Rec
eive
d
Pre
ssur
e U
lcer
Pre
vent
ion
Impl
emen
ted
Assessment Conducted Care Plan Implementation Prevention
www.ocshomecare.com | © 2012 National Research Corporation 52
HHC – HH-CAHPS Measures
� Two Global Measures to be Reported on HHC• Willingness to Recommend• Overall Rating of Care
� Three Composite Measures will also be Reported on Home Health Compare• These measures are representative of responses from
several individual items• Patient Care• Communication• Specific Care Issues

2/27/2012
27
www.ocshomecare.com | © 2012 National Research Corporation 53
New HH-CAHPS Measures
� CMS will not provide additional reporting• Most HH-CAHPS vendors do
– Consider type of reporting, comparability of benchmarks• Useful additional information
– Trending data– Measures contributing to the composite score – Local benchmarks– Non-top-box information– Drill-down analysis
o By payer or diagnosis
www.ocshomecare.com | © 2012 National Research Corporation 54
Home Health Compare HH-CAHPS Measures
HH-CAHPS National Results, care provided August - October 2010
74%
76%
78%
80%
82%
84%
86%
88%
90%
Overall rating ofcare (responses
of 9 or 10)
Likelihood torecommend
(definitely yes)
Patient care(composite)
Communication(composite)
Specific careissues
(composite)

2/27/2012
28
www.ocshomecare.com | © 2012 National Research Corporation 55
Understanding HH-CAHPS Drivers
� Which populations have higher ratings?• Global ratings• Composite measures
� Which populations have lower ratings?• Specific care issues
� Risk adjustment, which populations to target? � Knowing who to target which issues & when
• Right patient, right intervention, at the right time
www.ocshomecare.com | © 2012 National Research Corporation 56
HH-CAHPS Measures by Diagnosis

2/27/2012
29
www.ocshomecare.com | © 2012 National Research Corporation 57
Talk About Pain and Medications
www.ocshomecare.com | © 2012 National Research Corporation 58
Treated Gently and Courtesy & Respect

2/27/2012
30
www.ocshomecare.com | © 2012 National Research Corporation 5959
Hot Topic: Attention on Fraud & Abuse
� Regulatory Review• Reduce overpayments and waste• Curb fraud and abuse• Multiple efforts from multiple angles, not entirely
disconnected from the overall payment reform efforts
www.ocshomecare.com | © 2012 National Research Corporation 60
Crackdown
� From Managed Health, 2004That nightmare—$150 billion in losses—is one
estimate of the cost of health insurance fraud and abuse in America. According to the Centers for Medicare and Medicaid Services, U.S. healthcare spending reached nearly $1.7 trillion in 2003.
Some quick math shows health insurance fraud and abuse wastes nearly one-tenth of America's healthcare resources.
� From Nixon Peabody, May 2009Health-care fraud enforcement is clearly a top prio rity
of President Obama's administration. Providers should expect to come under increased scrutiny.

2/27/2012
31
www.ocshomecare.com | © 2012 National Research Corporation 61
� Crack-down on overspending, fraud, and abuse – not a new concept, but a renewed interest• 1997: Health Care Fraud and Abuse Control Program
(HCFAC)• 2006: Recovery Audit Contractors (RAC’s)
– Pilot program in 6 states – hospitals and physicians, recouped about $900 million in overpayments (returned $38M in underpayments)
– 2009 – launching into all healthcare, including home care– Paid on commission
• May, 2009: Fraud Enforcement and Recovery Act into law, introducing sweeping changes to the False Claims Act
• May, 2009: Health Care Fraud Prevention and Enforcement Action Team (HEAT) to combat Medicare and Medicaid fraud
Hot Topic: Attention on Fraud & Abuse
www.ocshomecare.com | © 2012 National Research Corporation 62
� Crack-down in home health• March 2009: GAO report• May 2010: WSJ Article and Senate Finance Committee
From USA Today: Fraud and abuse helped boost Medicare spending on home health services 44% over five years as some providers exaggerated patients' medical conditions and others billed for unnecessary services or care they did not provide, a Government Accountability Office report out Friday says.
In examining the issue, the GAO identified: • Fraudulent and abusive practices that may have contributed
to home health spending and utilization, including upcoding, payments to physicians for referrals, payments to beneficiaries for the use of their Medicare identification numbers, and billing for services not rendered.
Hot Topic: Attention on Fraud & Abuse

2/27/2012
32
www.ocshomecare.com | © 2012 National Research Corporation 63
� How will auditors work?• Still largely unknown• Reasonable to expect that data will be mined to identify
agencies of interest
� How can agencies be prepared?• Understand what’s going on in the industry• Understand what’s going on with your agency• Pay attention to new information
Hot Topic: Attention on Fraud & Abuse
www.ocshomecare.com | © 2012 National Research Corporation 64
Episode Distribution – Standard Episodes
Episode Type National
Early/Low (1 st or 2nd episode, < 14 therapy visits) 54.6%
Early/High (1 st or 2nd episode, 14 - 19 therapy visits) 9.4%
Late/Low (3 rd or later episode, < 14 therapy visits) 25.5%
Late/High (3 rd or later episode, 14 – 19 therapy visits) 2.2%
Very High (20+ Therapy visits) 8.3%

2/27/2012
33
www.ocshomecare.com | © 2012 National Research Corporation 65
Crackdown – Potential Measures to be Used
� PPS Metrics that highlight opportunities to “work” the system:• Episodes per patient• Use of diagnoses• Case weight & high domain levels• LUPA’s, outliers, and low-visit episodes• Therapy:
– Thresholds– High Use– Upcodes and downcodes
www.ocshomecare.com | © 2012 National Research Corporation 66
Crackdown – Potential Measures
National Median Values
12%
0%2%4%6%8%
10%12%14%
THERAPYTHRESHOLD -
Percent of "therapyepisodes" receivinga number of therapyvisits that exactly
hits one of the majortherapy thresholds(6, 14, or 20 visits)
25%
0%
35%
DOWNCODES -Percent of episodeswith a case weightthat decreased dueto actual therapybeing lower than
anticipated therapy
23%
0%
5%
10%
15%
20%
25%
HIGH THERAPY -Percent of "therapy
episodes" receiving 14or more therapy visits
30%25%
20%
15%
10%5%

2/27/2012
34
www.ocshomecare.com | © 2012 National Research Corporation 67
Review Agenda
� Identify measures and benchmarks of therapy utilization
� Discuss changes in health policy requirements impacting providing therapy services.
� Understand health policy trends and benchmarks• Prediction vs. actual utilization• Average for agency • Average & median for patient receiving specific
discipline
www.ocshomecare.com | © 2012 National Research Corporation 68
Faculty Contact Information
Roger Herr, PT, MPA, COS-CStrategic Advisor
OCS HomeCareA division of National Research Corporation
1425 Fourth Avenue, 6th FloorSeattle, WA 98101