measuring and mapping landscape quality using the
TRANSCRIPT
MEASURING AND MAPPING LANDSCAPE QUALITY USING THE COMMUNITY PREFERENCES METHOD
DR ANDREW LOTHIAN, DIRECTOR, SCENIC SOLUTIONS
New Zealand Planning Institute Annual Conference Blenheim, 2 May 2012
Section Page Significance of (landscape) beauty 1 Philosophy of beauty 2 Theories of landscape aesthetics 3 Health and economic benefits of landscape quality 5 What landscape is and isn’t 7 How not to measure landscape quality – the wrong paradigm 7 How to measure landscape quality – the right paradigm 9 Method of landscape quality assessment 10 What are the factors that generate landscape quality? 22 Examples of landscape quality ratings 24 Evaluation of method 28 Summary 28 Application to the New Zealand landscape 30 Summary 36 References 37 Appendix 1 Visual impact of wind farms in South Australia 41 Thank you for inviting me to speak to you at your Annual Conference. It’s an honour and I appreciate it greatly. I was actually born in NZ, in Christchurch, but my family moved to Australia when I was only 6 months old and there I grew up and have mainly worked there. So I can’t really claim Kiwi-ship! But I am saddened to see the damage the earthquakes have inflicted on Christchurch, my home town. SIGNIFICANCE OF (LANDSCAPE) BEAUTY
It was an exquisite day. It was one of those days so clear, so still, so silent, you almost feel the earth itself has stopped in astonishment at its own beauty. Katherine Mansfield, 1922. On the Marlborough Sounds.
In today’s economics-focused world, where is there time to appreciate beauty? Is beauty, such as is found in a landscape an expendable frivolity, an irrelevancy, a side issue away from the main game which is the economy? I think not. Why is that we homo sapiens, presumably alone among all animal species, can find beauty in a landscape? Did beauty, and our sensitivity to it, play a role in enabling us as a species to thrive and become the dominant species in the world? Is scenic beauty a luxury extra or is it fundamental to defining us and our place on earth? In a world beset with problems such as disease, malnutrition, corruption, social and economic inequity and environmental degradation of global, regional and local dimensions, why should the beauty of landscapes capture our attention? What can possibly justify spending time and effort on it when so many problems beset us?

Andrew Lothian, Mapping and measuring landscape quality, NZPI Conference, May 2012
2
Many people have endured trials and tribulations often far worse than most of us ever encounter, but in turning their thoughts to beauty, they transcended their circumstances rising above the stress of their environment to a better place. As he entered Auschwitz, the writer, Elie Wiesel described it as “a beautiful day in May. The fragrances of spring were in the air. The sun was setting.” How remarkable that even in these horrendous circumstances, entering a concentration camp, with death all around, Wiesel was sensitive to the beauty also around him. From a similarly tenuous hold on life, Anne Frank wrote:
“The best remedy for those who are afraid, lonely or unhappy is to go outside, somewhere where they can be quiet, alone with the heavens, nature and God. Because only then does one feel that all is as it should be and that God wishes to see people happy, amidst the simple beauty of nature.” (Anne Frank’s Diary)
Beauty enriches the human soul. It lifts our vision to a better world, a world that could be, and a world in which beauty transcends the daily grind. Beauty is worth understanding because it enriches our quality of life, it adds to our enjoyment of life. Beautiful landscapes inject life into us a similar way as art, music and cultural activities. Painting and photographing beautiful landscapes engages our aesthetic sensibilities and challenges our creativity. Soaking up a beautiful landscape is therapeutic and relaxing. Holidaying amidst lovely settings reinvigorates and restores the soul by osmosis, we absorb its beauty into our being and return revitalized. Beautiful landscapes often spark our inner creativity – how many Nobel Prizes had their origins from a walk in the park, a paddle in a stream or a hike in the woods? We choose to go to locations that restore and revitalize us. Re-creation works best amid natural landscapes. PHILOSOPHY OF BEAUTY From at least the time of the ancient philosophers in Greece, and probably well before that, beauty has captivated the human mind. The philosopher’s triad: truth, goodness and beauty are ultimate values that have been the subject of philosophical enquiry by some of the greatest minds. Understanding beauty, like understanding truth and goodness, is one of the big philosophical challenges that has engaged philosophers. From the time of Plato and Aristotle through to the Christian era and the Renaissance, beauty was regarded as residing in the object, as a physical characteristic; beauty lay not in the eyes of the beholder but in the object itself (Lothian, 1999). Christian philosophers such as Augustine (354 – 430), Thomas Aquinas (1224 - 1274), and Bonaventure (c1217 – 1274) regarded beauty as a mirroring God, the Creator. Teleology, the theology of evidence of design in nature reached its zenith in the 17th and 18th centuries, arguing that the order, purpose and beauty found in nature were evidences of God; “For since the creation of the world God’s invisible qualities – His eternal power and divine nature – have been clearly seen” (Romans 1:20). The decline of teleology resulted from the philosophy of Hume and Kant, the romantic view of nature espoused by Rousseau, Goethe, Wordsworth and others, together with the impact of Darwin’s Origin of Species in 1859. Instead of viewing beauty as residing in the object thus providing evidence of the Creator, it was now possible to appreciate beauty as lying in the eyes of the beholder, a subjective approach. John Locke (1632 – 1704), a British empirical philosopher was the first to regard beauty as having both objective and subjective qualities, beauty had “powers to produce various sensations in us” (Hamlyn, 1987). In the 18th century, the century of aesthetics, David Hume (1711 – 1776) and Edmund Burke (1729 – 1797) established beauty as the observer’s subjective response to an object, Hume wrote: “Beauty is no quality in things themselves. It

Andrew Lothian, Mapping and measuring landscape quality, NZPI Conference, May 2012
3
exists merely in the mind which contemplates them, and each mind perceives a different beauty” (Beardsley, 1966). This is entirely contrary to the previous view of beauty lying in the object itself. Planners often hear the saying “unity with variety” as a basic formula of beauty, but as far back as the 18th century Burke and Hume had shown that this formula lacked content and could be applied to many non-beautiful objects. In 1790, the German philosopher, Immanuel Kant wrote his book, Critique of Judgement, a profound and the classic work on aesthetics, Kant stated that the aesthetic experience is our mind's representation of the object and, experienced with disinterest, is pure and is wholly subjective. The state of harmony between an object's imaginative representation and our understanding yields aesthetic pleasure. Such pleasure is neither sensual nor intellectual; it does not involve fulfilling animal appetites and neither does it involve rationality or reason. It does not involve conceptual judgement. Objects that we consider beautiful have a special kind of formal quality dependent on their perceptual properties, a purposiveness of form but not of function – “purposiveness without purpose”. Aesthetic pleasure being free and without cognitive determination, is common to all who experience it. In short, beauty comes not from cognition but from our mind’s subjective response. Kant’s approach is particularly applicable to landscape beauty as it fulfills all of his prerequisites of beauty – landscape beauty is without function and there is no ideal or limit; no conceptual judgement is made, the response is immediate and the pleasure is often shared; the pleasure from landscapes is gained without desire or want for it, the pleasure is universal and is a common response, and landscape beauty is a public, not private, pleasure. After Kant, beauty no longer was regarded as emanating from the object but rather from our mind in viewing it. It was a move supported by the growing understanding of the mind through Freud, Fechner and other psychologists. Following Descartes (1596 – 1650), the Cartesian shears separated what is out there from what is in here (nature from mind) and laid the foundations for the Western subjective view of landscape. However many eastern cultures such as China and Japan, together with traditional cultures such as the Australian Aborigine and the New Zealand Māori view themselves as part of nature, not separated. The Australian Aborigine explains the landscape in terms of Dreamtime, the role played by ancients in shaping the land. The Māori’s tangata whenua, literally “people of the land” or the “placenta” emphasises their intimacy with the land. The approach that I describe in this paper to the measurement and mapping of landscape quality derives from a Western perspective; I do not presume that it will necessarily be accepted by traditional cultures. THEORIES OF LANDSCAPE AESTHETICS Over recent decades there have been hundreds of studies of landscape quality. These indicate what people prefer. To understand why people like what they like requires a theory of landscape aesthetics. Otherwise it may be characterised as “rampantly empirical”. A theory can provide testable predictions as well as explanatory power. Jay Appleton described it thus: “Just as the Brisbane wicket after rain used to be said to reduce all batsmen to an equal plane of incompetence, so this absence of aesthetic theory brings the professional down to the same plane as the man in the street.” (Appleton, 1975). Kant’s approach to aesthetics parallels contemporary evolutionary perspectives of aesthetics, as described by the prospect-refuge theory of Appleton (1975, 1988), the habitat theory of Orians (1980, 1986, Orians & Heerwagen, 1992, Balling and Falk, 1982), Urlich’s

Andrew Lothian, Mapping and measuring landscape quality, NZPI Conference, May 2012
4
affective theory (1983, 1986, Urlich, et al, 1991) and the Kaplans’ information processing theory (Kaplan, S. and R. 1982, 1989, Kaplan, S. 1987, Kaplan, S. & R. and Brown, 1989). The fundamental tenet of these theories is that human perception of scenic quality is rooted in survival; to put it simply, the landscapes humans prefer are survival enhancing. The Kaplans define it thus:
“The central assumption of an evolutionary perspective on preference is that preference plays an adaptive role; that is, it is an aid to the survival of the individual.” (Kaplan, S. & R. 1982).
Aesthetic preferences appear to be stable over time (Coughlin & Goldstein, 1970, Hull & Buhyoff, 1984) and this goes to the heart of why we can ascribe aesthetic preferences to landscapes. On the basis that our landscape preferences are survival enhancing, it would be expected that they would be reasonably constant. Research has also shown that aesthetic preferences are registered extremely quickly, far quicker than we are consciously aware. Studies have compared preferences of scenes viewed for 1/50 and 1/5 second with those of many seconds duration and have found them to be very similar (Herzog, 1984, 1985) (Figure 1).
Source: Herzog, 1984 and 1985
Figure 1 Effect of viewing time on landscape quality preferences
These findings reinforce the survival enhancing purpose of landscape aesthetics. They also indicate that preferences are pre-cognitive, before we think about it. The literature and my own studies have shown that landscape quality preferences are remarkably similar and stable across communities and individuals. This may surprise many as the adage, “beauty lies in the eyes of the beholder”, implies a wide variation of what different individuals regard as beauty. Of course, there is some variation but it follows the bell-shaped curve with the majority close to the mean with a few outliers. The average preferences from my studies are similar regardless of age, gender, education and birthplace. Thus having examined briefly the significance that beauty holds for individuals, even those in perilous situations, the emergence through philosophy of the view that beauty lies in the eyes of the beholder (actually in their minds) and not in the object viewed, and that landscape theory, grounded on an evolutionary perspective, views landscape aesthetics as contributing to human survival, Stephen Kaplan summed it up as follows:

Andrew Lothian, Mapping and measuring landscape quality, NZPI Conference, May 2012
5
“Aesthetic reactions reflect neither a casual nor a trivial aspect of the human makeup. Aesthetics is not the reflection of a whim that people exercise when they are not otherwise occupied. Rather, such reactions appear to constitute a guide to human behaviour that has far-reaching consequences.” (Kaplan, S, 1987)
In talking about landscape quality, I want to convey to you that I am not simply talking about some utilitarian issue, but rather a fundamental human appetite for beauty which contributes to our well being, if not survival as a species. HEALTH AND ECONOMIC BENEFITS OF LANDSCAPE QUALITY Natural scenery employs the mind without fatigue and yet exercises it; tranquilizes it and yet enlivens it; and thus, through the influence of the mind over the body, gives the effect of refreshing rest and reinvigoration to the whole system. Frederick Olmstead, 1865.
Beautiful landscapes are therapeutic, they have health-giving benefits, and they also provide tangible economic benefits. Beautiful scenery is restorative, it calms the soul, reduces stress, enlivens and stimulates creativity. Viewing natural scenes of trees, greenery and water through windows accelerated healing of hospital patients (Ulrich, 1984), reduced anger and violence among residents of Chicago apartments and reduced crime in their neighbourhood (Kuo and Sullivan (2001a and b), and reduced stress for students swotting for exams (Herzog, et al 2003; Staats et al, 2003). Even viewing posters of natural scenes is similarly beneficial (Kweon, et al, 2008; Felsten, 2009). The past several decades has seen considerable research into the healing and restorative effects of viewing nature. I have reviewed 33 such studies (see: www.scenicsolutions.com.au/landscapemiscellany.html), the universal conclusion from which is that exposure to nature through viewing and experiencing nature provides substantial emotional and physiological benefits. The preference for nature scenes is nearly twice that of urban scenes, while the restorative benefits of nature are at least three times as much as cities.
Source: Heerwagen, J.H. & G.H. Orians,1986.
Figure 2a Types of posters in windowless & windowed offices
Source: Hartig & Staats, 2006 Note: attitude scores: 1 negative to 7 very positive
Figure 2b Environmental preferences for mental restoration
As one example among many, offices without windows were dominated by nature posters, whereas people in offices with windows did not feel such a need (Figure 2a). Students who

Andrew Lothian, Mapping and measuring landscape quality, NZPI Conference, May 2012
6
were slightly fatigued preferred to walk in a forest for restoration than through a city, but when more fatigued were even more likely to prefer a walk in a forest (Figure 2b). The economic benefits of the view are a surrogate of the landscape’s value. It is well known that a block around Sydney Harbour is worth a mint, but if it has the trifecta of views of the water, the Sydney Harbour Bridge and the Opera House then it really is a gold mine. House values and the effect of landscape views upon them will reflect the laws of demand and supply prevailing at the particular location. In an area with an abundance of scenic beauty but a low population, the values may be low whereas the presence of a large population will generally increase demand and hence values. This was reflected in a study of New Zealand cities (Bourassa et al, 2005) which found an inverse relationship between the relative abundance of a water view and its effect on house values, the fewer the views, the higher the contribution (Christchurch), and the converse – the more abundant the views, the lower the contribution (Wellington) (Table 1, Figure 3).
Table 1 Relative abundance of view vs contribution to house value Wellington Auckland Christchurch
% of houses with water view 18.6% 11.4% 2.5% Influence of water view to house prices 6.6% 9.7% 10.9%
Source: Bourassa et al, 2005
Figure 3 Inverse relationship between abundance of view and contribution to house value
I reviewed 37 studies from around the world undertaken between 1973 and 2009 that have quantified the influence of landscape views on house values. The average contribution was 17.4%. Thus a property worth, say $300,000, will be worth $352,200 if it has a good view. Multiply this by the hundreds, or in some areas, thousands of properties which enjoy the view, and its worth runs to millions of dollars. Beautiful scenery is extremely valuable in economic terms. With international tourism, it may be a nation’s most valuable asset, far exceeding the value of its tangible exports of minerals

Andrew Lothian, Mapping and measuring landscape quality, NZPI Conference, May 2012
7
and food. Beautiful landscapes underwrite the multi-billion international and domestic tourism industry. A century ago the value of Swiss scenery was well recognized: “Let it not be forgotten that Switzerland regards its scenery as a money-producing asset to the extent of some two hundred million dollars annually” said Allen Chamberlain, a New England advocate, in US Congressional hearings in 1910 (Runte, 1979). In 1915, Congressman Taylor said that Switzerland gained between $10,000 and $40,000 per square mile of scenery per year, money that he wished to see remain in America through the nation establishing its own national parks. In today’s dollars these estimates are around $80,000 - $330,000 per sq km or $3 B - $13B for the entire country, a very substantial sum ! The idea that something as virginal and precious as beautiful scenery should be sullied by thoughts of its monetary worth may seem abhorrent to some, but visitation provides a surrogate of the value that people ascribe to it. Visitors to Australia are not particularly attracted by its cities, despite their qualities, but by its landscapes, its wildlife, and the unique features such as the Great Barrier Reef, Kakadu and Uluru which are to be found outside its cities. Despite the obvious qualities of your New Zealand cities, I feel sure that most visitors from overseas are attracted more by your mountains, lakes and forests. WHAT LANDSCAPE IS AND ISN’T Landscape differs from environment. Although Appleton (1980) refers to landscape as “the environment perceived”, I disagree because the environment covers a far wider set of components, often microscopic or not visible including soils, submerged land (under rivers and lakes), the underlying rocks and geology and the atmosphere, living organisms from microbes to animals, fungi to trees, as well as processes such as the nitrogen cycle and the carbon cycle. The environment is a far larger concept than the landscape. The landscape is the visible surface of the environment. Scenery or scenic is often used as a synonym for landscape but scenery has its roots in the theatre where a scene describes a portion of a play, and scenery is the decorative backdrop on the stage. Viewing a landscape can comprise many views or scenes. I use the term scenic quality interchangeably with landscape quality. Aesthetics is often used in the sense of landscape aesthetics where aesthetics is defined as: "belonging to the appreciation of the beautiful" (Concise Oxford, 1987). Aesthetics thus refers to the human perception of things, including physical landscapes, and in particular associate them with notions of beauty. I refer further to the meaning of landscape when considering the New Zealand landscape. HOW NOT TO MEASURE LANDSCAPE QUALITY - THE WRONG PARADIGM Several decades ago there were a number of attempts in Australia, led by the National Trust, to measure and map landscape quality and these generally ended up in frustrated failure. Generally these attempts sought to measure all the biophysical attributes of the landscape: its soils and geology, biodiversity and geomorphology, rivers and lakes, its views and highlights, all in the expectation (and hope) that somehow out of all this analysis, its inherent landscape quality would emerge. It never did. A significant deficiency was that there was no community validation of the assessments. The method which tried to be applied is summarised by Figure 4.

Andrew Lothian, Mapping and measuring landscape quality, NZPI Conference, May 2012
8
▼
≠ ▼
Figure 4 Traditional landscape quality assessment method – the wrong approach
The failure occurred because analyzing the landscape objectively is a cognitive process of the brain, involving observation, measurement, analysis and synthesis. In contrast, assessing qualitative values, its scenic quality, is an affective process involving one’s likes and dislikes, our preferences, and is inherently subjective. Qualitative values must be assessed by studying preferences, not by analyzing the components. Imagine using the cognitive approach to assess whether we like a piece of music based on the number of its notes, the types of instruments used, the rhythm, pace and other attributes of the music, anything but whether or not we like it. You can apply the same reasoning to other things such as chocolate, travel and even love… I find it particularly exasperating that philosophers had discovered these truths centuries ago yet many practitioners persist with them. Since Kant, few philosophers have believed that beauty resided in the object, rather it lay in the interpretation of the object by our mind. If the lesson of history is that we don’t learn the lessons of history, then look no further. As planners you will be aware of the views of local residents regarding proposals that have been exhibited and how their views are often emotional, in contrast to your cool, detached professional assessment. The clash here is between the two paradigms. The community uses the affective paradigm to express how they feel, their subjective preferences, their likes and dislikes, while the planners employ the cognitive paradigm to explain in a logical, objective way the facts about the proposal. Planners might think that theirs is the only way but expressing preferences is perfectly legitimate and an appropriate way to express the community’s likes and dislikes. A factor however which influences community preferences is their familiarity with the area. I have found in my landscape studies that the ratings of people who live in an area are inevitably higher than non-residents. Table 2 illustrates this by showing the influence of familiarity with the Flinders Ranges in South Australia. Being very familiar lifted the average rating for those persons by 12.5%, or 0.8 on the 1 – 10 scale. Even being slightly familiar enhanced ratings by 8% or 0.5.
Table 2 Influence of familiarity – Flinders Ranges
Familiarity Mean %
Not familiar 6.07 100.0 Slightly familiar 6.57 108.3 Very familiar 6.83 112.5
Source: Lothian, A., 2009. Flinders Ranges Landscape Assessment
Land form Land cover Land use Water Other factors
Map and measure all landscape components
Landscape quality

Andrew Lothian, Mapping and measuring landscape quality, NZPI Conference, May 2012
9
HOW TO MEASURE LANDSCAPE QUALITY - THE RIGHT PARADIGM Although it is a subjective quality, landscape quality can be objectively assessed. In the nineteenth century, the German psychologist, Gustav Fechner (1801 – 87) developed the science of psychophysics, the science of measuring the effect of external stimuli via our senses (sight, sound, taste, smell, touch) on the brain. A vast literature has since been generated on psychophysics. Based on psychophysics, psychologists in the US and other places during the 1980s and onwards applied it to understanding aesthetic preferences. Academics including Gregory Buhyoff, Terry Daniel, Ervin Zube, Rachel and Stephen Kaplan, Herbert Schroeder, Bruce Hull and many others have researched the subject and developed the science of landscape quality assessment. It is on the shoulders of these giants that I developed a practical method and applied it to the wider landscape. Whereas the academic studies looked at particular features or issues requiring resolution, I have applied the psychophysical model in the assessment of landscape quality at a regional level. Common elements in the research methodologies that they developed are: • Selection of standardised scenes for rating; • Choice of a rating scale – e.g. 1 to 10; • Rating instrument – i.e. a means for showing scenes with a rating scale; • Participants to rate the scenes – a sufficient number of raters for statistical analysis.
The projects that I have completed cover, to my knowledge, the largest areas anywhere where landscape quality has been measured and mapped on the basis of community preferences. The approach I outline here is based on the premise that landscape quality assessment must be based primarily on preferences, not cognition. I say “primarily” because, as Zajonc (1980) stated in his widely quoted paper, Feeling and thinking, Preferences need no inferences, “…feeling is not free of thought, nor is thought free of feelings.” Traditionally cognitive psychology held that affect (i.e. feelings, preferences) follow cognition; that our feelings followed the brain’s processing of the subject, however Zajonc argued that affect is pre-cognitive and that cognition and affect are largely independent systems. Others have supported Zajonc’s thesis. Ulrich for example contends that “immediate, unconsciously triggered and initiated emotional responses - not ‘controlled’ cognitive responses - play a central role in the initial level of responding to nature, and have major influences on attention, subsequent conscious processing, physiological responding and behavior” (Ulrich et al, 1991). I appreciate that landscape quality assessment in New Zealand is regarded as a cognitive process, involving analysis of the landscape character and attributes and is essentially descriptive: e.g. “(this) combination of simple landform, evidence of heritage or historic settlement and fragmented landcover patterns gives the (Banks) peninsula its distinctive landscape character and high aesthetic value.” (Boffa Miskell, 2010). In contrast to the Australian studies referred to earlier, the New Zealand studies have the benefit of extensive community consultation and input so that the descriptions of aesthetic value reflect community preferences. A deficiency is that they remain descriptive, not quantitative so are not amenable to statistical analysis.

Andrew Lothian, Mapping and measuring landscape quality, NZPI Conference, May 2012
10
I do not wish to diminish in any way the quality and worth of New Zealand landscape studies such as the Canterbury Regional Landscape Study Review by Boffa Miskell Ltd (2010) but I respectfully wish to present an alternative for consideration. My method may also provide an alternative structured means of fulfilling the Environment Court’s desire for landscape quality assessment to cover the community’s “shared and recognised values”. METHOD OF LANDSCAPE QUALITY ASSESSMENT The 12-step method that I have developed involves using community preferences to measure landscape quality and, through analyzing the results, mapping it at a regional scale (Figure 5). The method provides a structured way of quantifying community landscape quality preferences. Each of the steps is discussed in turn.
Figure 5 Landscape quality assessment method
Photographs Photographs of scenes are generally used to ascertain the preferences of participants. These have obvious advantages over transporting large numbers of people into the field to visit widely dispersed locations. It is clearly impractical to take 3-400 people throughout a large region for the purposes of rating scenic quality. Photographs also enable ratings of scenes
Andrew Lothian, Mapping and measuring landscape quality, NZPI Conference, May 2012
11
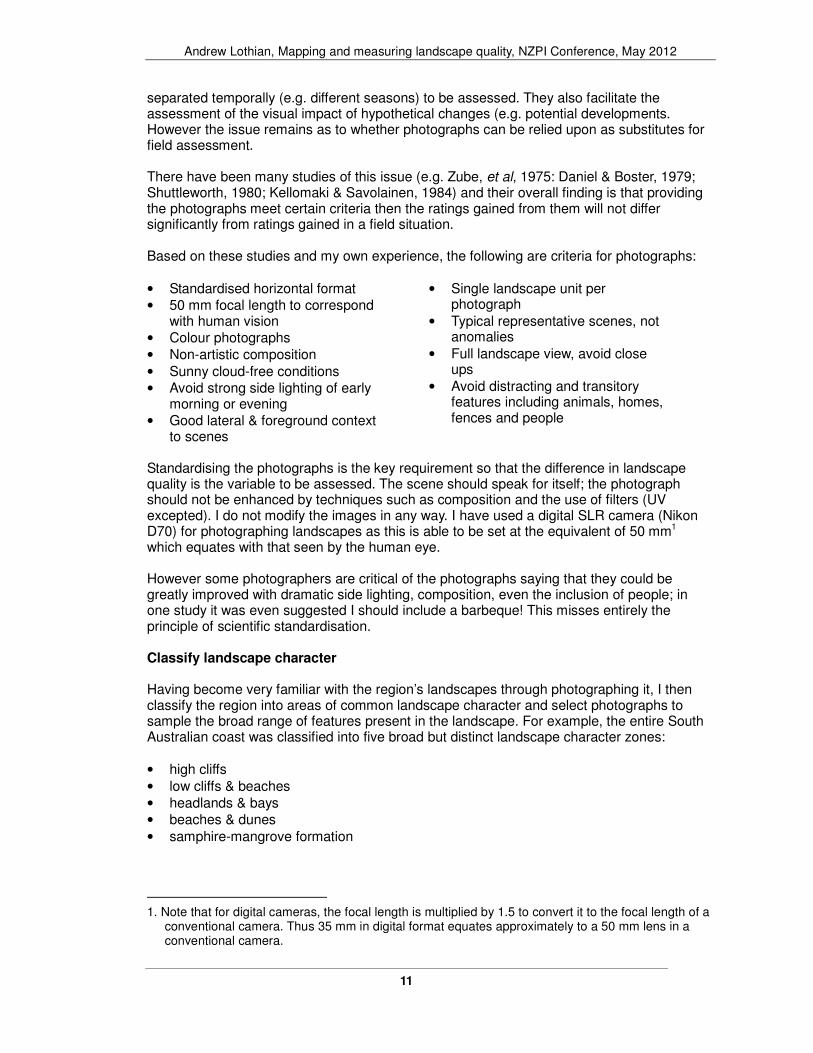
separated temporally (e.g. different seasons) to be assessed. They also facilitate the assessment of the visual impact of hypothetical changes (e.g. potential developments. However the issue remains as to whether photographs can be relied upon as substitutes for field assessment. There have been many studies of this issue (e.g. Zube, et al, 1975: Daniel & Boster, 1979; Shuttleworth, 1980; Kellomaki & Savolainen, 1984) and their overall finding is that providing the photographs meet certain criteria then the ratings gained from them will not differ significantly from ratings gained in a field situation. Based on these studies and my own experience, the following are criteria for photographs: • Standardised horizontal format • 50 mm focal length to correspond
with human vision • Colour photographs • Non-artistic composition • Sunny cloud-free conditions • Avoid strong side lighting of early
morning or evening • Good lateral & foreground context
to scenes
• Single landscape unit per photograph
• Typical representative scenes, not anomalies
• Full landscape view, avoid close ups
• Avoid distracting and transitory features including animals, homes, fences and people
Standardising the photographs is the key requirement so that the difference in landscape quality is the variable to be assessed. The scene should speak for itself; the photograph should not be enhanced by techniques such as composition and the use of filters (UV excepted). I do not modify the images in any way. I have used a digital SLR camera (Nikon D70) for photographing landscapes as this is able to be set at the equivalent of 50 mm1 which equates with that seen by the human eye. However some photographers are critical of the photographs saying that they could be greatly improved with dramatic side lighting, composition, even the inclusion of people; in one study it was even suggested I should include a barbeque! This misses entirely the principle of scientific standardisation. Classify landscape character Having become very familiar with the region’s landscapes through photographing it, I then classify the region into areas of common landscape character and select photographs to sample the broad range of features present in the landscape. For example, the entire South Australian coast was classified into five broad but distinct landscape character zones: • high cliffs • low cliffs & beaches • headlands & bays • beaches & dunes • samphire-mangrove formation
1. Note that for digital cameras, the focal length is multiplied by 1.5 to convert it to the focal length of a
conventional camera. Thus 35 mm in digital format equates approximately to a 50 mm lens in a conventional camera.

Andrew Lothian, Mapping and measuring landscape quality, NZPI Conference, May 2012
12
The classification is at a broad regional level and at a finer grain, many other categories would become apparent. Benchmark scenes Included in every survey are scenes from outside the study area which have a wider range of ratings. These serve to benchmark the regional ratings at a State-wide level. This enables the results to be compared with other regions. While South Australia as a whole ranges from 3 to 8 (1 – 10 scale), in a region such as the Barossa Valley, the ratings were from 4.5 to 6.5, a range of only two units. Including scenes from 3 through to 8 ensures that the scenes within the Barossa are rated on the same basis as the entire State. The scenes from across South Australia totalled 20 – 30 with the total number of scenes in each survey ranging from around 150 to 160. The large number of scenes need not be daunting as participants set their own pace. Internet survey The survey is placed on an Internet site with instructions for participants to rate the landscape quality of the scenes on a 1 (low) to 10 (high) scale. The survey is designed with a number of features: • Scenes are in random order which varies for each participant, and are re-randomised after each
rating so that the same sequence of scenes is unlikely to occur; this overcomes the issue of the rating of a scene being influenced by the previous scene;
• Scenes are changed as the respondent rates each scene; they are not set for a fixed period such as 6 – 8 seconds. A fixed time frustrates the quick respondents while slower respondents are stressed that the scene will change before they are ready. Allowing the respondent to set their own pace means some complete 150 scenes very quickly and others take much longer (Figure 6).
Minutes
67.562.5
57.552.5
47.542.5
37.532.5
27.522.5
17.512.5
7.5
Fre
qu
en
cy
100
80
60
40
20
0
Dial up
Minutes
87.582.5
77.572.5
67.562.5
57.552.5
47.542.5
37.532.5
27.522.5
17.512.5
7.5
Fre
qu
en
cy
160
140
120
100
80
60
40
20
0
Broadband Figure 6 Duration of surveys (Barossa study): dial up and broadband connections
• The postcode of the participant is sought; this enables the local community’s responses to be
compared with those of the wider community. • The participant can leave the survey (e.g. phone calls, visits) and return to it after an elapse of
time; • Comments can be made about the survey whether upon its completion or if the participant leaves
without completion; • The survey includes four demographic questions covering age, gender, level of education, and
whether born in Australia and the results compared with those from the Australian Bureau of Statistics. Inevitably participants in the survey are better educated than the general community as

Andrew Lothian, Mapping and measuring landscape quality, NZPI Conference, May 2012
13
this gives them the interest in participating; for other demographics the samples are fairly comparable. I have found that preferences are very similar across differing demographics which accords with the literature. Our landscape preferences are similar regardless of age, gender, education and so on; not identical but similar, a bell-shaped spread of preferences around the mean. Figure 7 illustrates this by showing the similarity of average ratings across different participant characteristics – the range is only 0.3 from 5.35 – 5.65.
Invitations to participate in a survey are emailed to groups identified in the region that is the subject of the study as well as to the wider South Australian community. Sometimes media advertisements are placed inviting participation and providing the website address.
Figure 7 Mean average ratings by participant characteristics (Barossa study) – exaggerated scale
Lay vs expert raters It may be questioned why the community is used to derive landscape quality ratings rather than persons trained in landscape. Are public preferences a reliable indicator of quality? It is true that art galleries do not purchase paintings on the basis of public taste; indeed often the public is critical of the purchase, but paintings are not bought on the basis of preference (at least not by public galleries) but on the basis of scholarship and knowledge about the artist and the significance of their work. Landscape beauty is a public, not private, pleasure according to Kant and it is therefore fitting that it be assessed by the public. But on the subject of whether ratings provided by landscape experts would be “better” in some way than by the public (i.e. lay persons), according to Stephen Kaplan (1979):
“There is now substantial evidence that experts perceive differently from other people. This is restricted to their area of expertise and, in fact, constitutes an important facet of their expertise. But the fact remains that experts, often without realizing it, do not see their part of the world the way anyone else sees it. Although experts are invaluable resources when used appropriately, they are a dubious source of “objective” judgement about what people care about in the landscape.”
After examining 14 studies of the differences between the expert and the lay in landscape evaluation, I reached the following conclusions: 1. The similarities between lay and expert observers appear to outweigh the differences. Similar
ratings or preferences were found across a wide range of groups, including foresters & city dwellers (Kellomaki & Savolainen, 1984), students, natural resource managers, river users, and

Andrew Lothian, Mapping and measuring landscape quality, NZPI Conference, May 2012
14
university staff (Mosely, 1989), planners, farmers, residents (Sullivan, 1994), landowners & students (Vodak, et al, 1985) and environment professionals, wives & teachers, and secretaries (Zube, 1973).
2. Paradoxically the one professional group whose preferences appear to differ from that of the
community are landscape architects. More surveys found that their preferences differed (Anderson & Schroeder, 1983; Brown, 1985; Buhyoff et al, 1978; Miller, 1984) than studies that found similarities (Craik, 1972, and Schomaker, 1978). These studies covered landscape architects in the US in the 1970s and 1980s and should not necessarily be taken as applicable today, nor to New Zealand practitioners. I appreciate for example that New Zealand landscape studies have involved extensive community consultation.
Using the community to rate the scenes, however, ensures that the results reflect the prevailing community preferences rather than those of a particular professional group. Example of an internet survey The following illustrates the site that participants view as they carry out a survey.
River Murray Landscape Assessment Survey
Welcome to the River Murray Landscape Assessment Survey Purpose of this survey The River Murray is one of South Australia's most popular tourist regions and is of significant environmental value. The Department of Water, Land and Biodiversity Conservation together with the South Australian Murray Darling Basin Natural Resources Management Board have commissioned a study to measure and map the region's scenic quality. The study involves rating a series of photographs of the region for scenic quality and landscape values. Findings from the survey will be used to inform better planning and management of the region's natural resources in the future. You are invited to participate in rating these photographs. The photographs are representative of the Region, which covers the River Murray from the Border to Wellington, Lakes Alexandrina and Albert, and the Coorong. No qualifications or experience are required to participate and the responses will be anonymous. Participants need to be a minimum of 18 years of age. The survey closes on … How it works
• You will be shown a photograph of a scene and asked to rate its scenic attractiveness • The ratings are on a scale of 1 to 10 with 1 being very low and 10 being very high • The rating scale is located at the top of each scene's page - just click the appropriate
number to register your rating for each scene • Once a rating has been recorded you will be automatically shown the next scene.
How long will it take?
• The survey has a total of 150 scenes. How long it takes will depend on how much time you spend rating each scene: it can be completed in less than 15 minutes
• There is no time limit to rate each scene, however, your rating session will end after 30 minutes of inactivity
• Please rate all 150 scenes as this will provide a greater statistical weight to the survey • None of the scenes for rating is repeated • The survey includes scenes from elsewhere in South Australia to provide balance • At the end of the survey, or if you leave before the end, you will be able to provide
comments.

Andrew Lothian, Mapping and measuring landscape quality, NZPI Conference, May 2012
15
Hints
• Use the entire rating scale, don't just sit in the middle around 5 • Judge each scene on its merits • Trust your initial instinct - don't try and analyse your response • Try to ensure you have no distractions (phone, callers etc) before you start the survey • If you feel tired or get interrupted during the survey, take a break, the survey will wait
until you return (for a maximum of 30 minutes). Contact The project coordinator, …, is available if you have any questions on emial : …. or by phone on ….
Start Survey »
© Copyright Scenic Solutions 2006 PAGE 2 River Murray Landscape Assessment Survey
Demographic Information
Please fill in all fields on this form.
This (anonymous) information will be used to help analyse the survey results.
Age GroupPlease indicate your age group
Gender
Female
Male Birthplace
Born in Australia
Not born in Australia Education Please indicate your highest education level attained
Postcode Please indicate your home postcode (if in Australia)
Internet connection speed
This information will be used to reduce your download requirements.
Broadband (I have a fast Internet connection)
Dial-up (I have a slow Internet connection)
Continue »
© Copyright Scenic Solutions 2006

Andrew Lothian, Mapping and measuring landscape quality, NZPI Conference, May 2012
16
PAGE 3
River Murray Landscape Assessment Survey
You are about to start the survey
Example Landscapes
• The survey will start with a series of 4 example landscapes. This will give you an example of the types of landscapes you will be asked to rate during the survey.
• During the example landscapes phase you can continue to the next landscape by either clicking the photograph or the rating buttons at the top of the page (these ratings are not recorded), otherwise the page will automatically progress to the next example landscape after a few seconds.
Start Survey »
© Copyright Scenic Solutions 2006
Example Landscapes
Exit Survey Rating scale above scene: 1 2 3 4 5 6 7 8 9 10
Continue to the next example landscape by clicking the photograph or the rating buttons (above) otherwise this page will automatically progress to the next example landscape.
Example Scene 1
© Copyright Scenic Solutions 2006
Exit Survey

Andrew Lothian, Mapping and measuring landscape quality, NZPI Conference, May 2012
17
Scene for Rating Exit Survey Rating scale above scene: 1 2 3 4 5 6 7 8 9 10
Scene 4 of 150
© Copyright Scenic Solutions 2006
River Murray Landscape Assessment Survey
Thank you for completing the survey
Please feel free to submit any comments you may have about the survey
Please note:
• The survey did not contain any repeated scenes. • Scenes from outside the River Murray, Lakes and Coorong were included to provide a
State-wide basis for the rating.
Submit Comments
No Comments
Back to front page.

Andrew Lothian, Mapping and measuring landscape quality, NZPI Conference, May 2012
18
Technology The technology that is now available enables these landscape surveys to be undertaken in a cost-efficient and task-effective way. Digital photography, the Internet, broadband, email, easy-to-use statistical packages and spreadsheets were not available to the early researchers of landscape quality. When I did my PhD in the 1990s I hauled my carousels of slides and a projector around to groups to rate the scenes. It took me 6 months to gain 319 responses whereas I can now gain several thousand in the space of a month using the Internet. The convenience of sitting at home or at one’s desk doing the survey on the computer is a significant plus over having to do it sitting with a sheet of paper to enter one’s ratings. It also prevents the errors that occur in typing up these ratings. Having had many thousands of people provide ratings over many studies it is amazing how easy people find it and how quickly some do it. The instructions emphasize not analyzing the landscape prior to deciding what to rate it as but rather relying on their instinct and initial impression. This draws on their affective preferences rather than their cognitive, analytical abilities. Scoring landscape components While the Internet survey is underway, I have a small group or groups of people, up to 20, score the various attributes present in the scenes, for example the significance of trees, or water, or the naturalness or diversity present in the scenes. These are scored on a 1 – 5 scale. This is absolutely vital in the analysis of the contribution of each of the components to overall landscape quality. Without these scores, all I have are the ratings of the landscape. The scores for each of these components for each scene enable their contribution to be assessed and the interactions between components, e.g. land cover and naturalness, to be quantitatively measured. Analysis Following completion of the Internet survey, a data set for analysis is then prepared. Firstly the data set is examined for strategic bias - this is where the participant seeks to use the survey for their own objectives, such as rating all the scenes 10 or 1 depending on whether they wanted to highlight or downplay the region. It is easy to identify these anomalies from the overall means and by the sort capability of spreadsheets. Secondly, some respondents do not complete the survey and I generally include for analysis, only those who have completed all or nearly all the survey. Analysis then moves through the demographics of participants, the overall results and then drills into the data to understand the contribution of features in the landscape. The scores of the features that were carried out using a small group are compared with the ratings of those scenes to assess their significance. Figures 8a and 8b show their use from the River Murray study, indicating firstly the influence of cliffs on ratings and secondly, the relationship of cliffs to naturalness scores.

Andrew Lothian, Mapping and measuring landscape quality, NZPI Conference, May 2012
19
1
2
3
4
5
6
7
8
9
10
1 2 3 4 5Cliff score
Rating
Trend line y = 0.75x + 4.16, r
2 = 0.51
Figure 8a Influence of cliffs on ratings
1
2
3
4
5
1 2 3 4 5Cliffs score
Natu
raln
ess s
core
Trend line: y = 0.34x + 2.87, r
2 = 0.26
Figure 8b Relationship between cliff and naturalness scores
A particularly interesting finding from the Barossa Valley study was that the presence of vines actually had a negative influence on ratings (Figure 9a). It also found an inverse relationship between trees and vines (Figure 9b); as the tree score fell (i.e. fewer trees in the landscape), the vine score increased and vice versa. The reason for this is that most of the vineyards had been cleared of trees; what trees remained were around their perimeter, along creek lines or along roadsides. Thus in the Barossa Valley, Australia’s premier wine region, the presence of vines does not add to landscape quality, it is mainly the presence of trees and landforms in the area that create the pleasing landscape.
7
1
2
3
4
5
6
7
8
9
10
1 2 3 4 5
Factor scale
Ra
tin
g s
ca
le
Trend line y = -0.14x + 5.84, R
2 = 0.04
Figure 9a Influence of vines on ratings – Barossa study
1
2
3
4
5
1 2 3 4 5
Vines score
Tre
es
sc
ore
Trend line y = -0.78x + 4.75, R
2 = 0.45
Figure 9b Relationship of vines and trees –
Barossa Study
These examples illustrate the value of combining ratings with the component scores and then examining the relationship between the components. This quantitative understanding is not available through any other means. The final stage of analysis involves the application of multiple regression analysis. This form of regression analysis examines the contribution of many variables such as trees, landforms and water to the ratings. It compares the ratings of the features present with the scores of those features to derive predictive models of landscape quality for the region. The following examples from the Barossa Valley study illustrate their use.

Andrew Lothian, Mapping and measuring landscape quality, NZPI Conference, May 2012
20
Barossa Valley Study Scenic Quality Models First model: Y = 2.79 + 0.43 Natural + 0.26 Water + 0.26 Trees + 0.17 Vines + 0.11 Terrain + 0.08 Barossa Ranges – 0.01 Building; r2 = 0.54, p = 0.000 This model included 7 factors and the correlation coefficient (r2 = 0.54) indicates that these factors explain 54% of the variance. Second model: Y = 3.22 + 0.54 Natural + 0.22 Trees + 0.16 Vines; r2 = 0.52, p = 0.000 This model uses only three key factors and yet explains 52% of the variance. Third model: Y = 3.83+ 0.67 Natural; r2 = 0.43, p = 0.000 This model uses only one factor, naturalness, and provides an acceptable level of explanation. Thus if the naturalness for a given scene was scored out of five and inserted into the algorithm, then the result is the rating. Example: For naturalness score of 3; y = 3.83 + 0.67(3). Therefore y (rating) = 5.84 For naturalness score of 4, y (rating) = 6.50 For naturalness score of 5, y (rating) = 7.19
Apart from using the models for estimating landscape quality ratings, the models also indicate the relative contribution of each factor. Thus the first Barossa model indicates the factors, in descending order of contribution, are: naturalness, water, trees, vines, terrain, view of Barossa Ranges, with the presence of buildings being a negative factor. Mapping landscape quality The analysis undertaken provides a detailed understanding of what generates the landscape quality of the region, what makes it tick. Based on the understanding gained, the landscape quality of the area is then mapped. This is usually undertaken in conjunction with GIS specialists so that landscape quality can be mapped digitally. As examples, Figures 10, 11 and 12 show ratings for South Australia as a whole, for the Barossa Valley region, and for the Flinders Ranges. These maps constitute the outcome of the process that commenced with the photography of the area, obtained the community’s ratings of the selected photographs and analysed these ratings. The maps thus reflect how the community rate the landscape quality of the area. The method provides an alternative way of understanding the landscape quality of an area which may be of benefit to New Zealand. It is appreciated that it is not the only way and that descriptive approaches based on comprehensive community input also have their place.

Andrew Lothian, Mapping and measuring landscape quality, NZPI Conference, May 2012
21
Source: Lothian, 2000
Figure 10 Landscape quality of South Australia

Andrew Lothian, Mapping and measuring landscape quality, NZPI Conference, May 2012
22
Source: Lothian, 2005 Figure 11 Landscape quality of the Barossa
Valley region
Source: Lothian, 2009 Figure 12 Landscape quality of the Flinders
Ranges
A scene may comprise several distinct zones each with its own rating. Thus the scene in Figure 13 involves looking across say a 5.5 rated landscape (fairly flat but with good tree cover and some water) to a low vegetated hill which rates say 6.5. The foreground would rate 5.5 if the hills in the background were absent, and this is its rating with the hills present. The overall rating of the scene is 6.06 which averages the foreground and the background. The 1 – 10 rating scale is a continuum so a rating of, say 6, ranges from 6.00 through to 6.99, rating 7 continues through 7.00 to 7.99 and so on.
Figure 13 Zones of a scene

Andrew Lothian, Mapping and measuring landscape quality, NZPI Conference, May 2012
23
WHAT ARE THE FACTORS THAT GENERATE LANDSCAPE QUALITY? Based on the six studies it is possible to indicate what attributes generate high landscape quality. These attributes are:
• Diversity • Naturalness
• Water • Land form
• Land cover
Diversity is the busyness of the scene; the sum total of the land forms, land uses, land cover, presence of water, colours and textures present in the landscape. Table 3 summarises the algorithms derived from the six studies of landscape quality for each of these attributes.
Table 3 Algorithms of attributes from six studies
Study Diversity Naturalness Water Land form Land cover
South Australia
Y=1.01x+3.28 r2=0.93
Y=0.83x+3.62 r2=0.94
Sea area y = 0.38+ 6.69 r2 = 0.91
Sea movement y =0.46x+6.31 r2 =0.96
Rock faces y = 0.53x+5.59 r2= 0.96
Height of vegetation y=0.49x+4.47, r
2=
0.90; Density of vegetation y=0.38x+4365, r2=0.97
Tree amenity
Tree spacing y = 0.54x+4.32, r2=0.98
Number of trees y = 0.37x+4.46, r
2
=0.93 Tree health y = 0.32x+4.52, r2=0.98
Tree height y = 0.26x+4.58, r2=0.79
Coast Y=1.50x+2.17 r
2 =0.55
y = 1.0x+2.38 r2=0.29
Sea area y = 0.95x+4.42 r2=0.47
Height of terrain y = 0.83x+4.18 r2=0.65
Steepness of terrain y = 0.46x+5.43 r2=0.37
Barossa Ranges
y = 0.77x+3.44 r2 =0.42
Prominence of Ranges y = 0.11x+4.72 r2=0.02;
Terrain y = 0.39x+4.50 r2=0.07
Trees: y = 0.59x+3.68 r2=0.36
River Murray
y=1.04x+3.04 r2 =0.39
y = 0.61x+3.66 r2 =0.24
Significance of water: y = 0.25x+5.53 r2=0.06
Water on floodplains: y = 0.41x+4.91 r2=0.21
Cliffs y = 0.75x+4.16 r2=0.51
Trees: y = 0.38x+5.06 r2=0.09

Andrew Lothian, Mapping and measuring landscape quality, NZPI Conference, May 2012
24
Flinders Ranges
y=1.10x+3.15 r2 =0.66
Y= 0.75 x+3.22 r2=0.26
Spectacular y = 1.10 x+2.84 r2 =0.78;
Terrain y = 0.88 x+3.03 r
2 =0.52
Rockfaces y = 0.49 x+4.94 r2 =0.28
Vegetation y = 0.60 x+4.56 r2=0.30
These equations summarise the relationships between the attributes and the ratings derived in the studies. The equations are of the form: y (landscape quality rating) = slope of trendline X score of attribute + constant e.g. River Murray: y (rating) = 1.04 X score of diversity + 3.04
e.g. y = (1.04 X 5) + 3.04 = 8.24 The correlation coefficient (r2) indicates the spread of data points around the trend line. If all the data lay along the trend line the r2 would be 1.0. A low r2 indicate a wide spread of data so the relationship between the attribute and ratings is not strong. The strength of the relationship is indicated primarily by the coefficient attached to the attribute score, 1.04 in the above example. Such a high coefficient means that for each unit increase in the attribute’s score (e.g. from 3 to 4), the landscape quality rating increases by 1.04. A lower coefficient, say 0.75 indicates ratings increase by 0.75; a number of 0.5 indicates an increase of 0.5 in ratings. The strengths of the relationships, as shown by the attribute score coefficient are as follows:
• Diversity 1.00 to 1.50 mean 0.91 • Naturalness 0.61 to 1.00 mean 0.79 • Water 0.25 to 0.95 mean 0.49 • Land form 0.11 to 1.10 mean 0.62 • Land cover 0.26 to 0.60 mean 0.44
This indicates the strongest influence on ratings in the six studies is diversity, followed in turn by naturalness, land form, water and land cover. The community preferences method enables the influence of the landscape attributes to be estimated quite precisely and quantitatively, not merely by description. EXAMPLES OF LANDSCAPE QUALITY RATINGS South Australian landscapes rate between 3 and 8 on the 1 – 10 scale. The following scenes illustrate scenes at each rating level. As discussed in the previous section, key factors which differentiate the ratings are diversity, naturalness, presence of water, the steepness and significance of land forms, and the nature of land cover.

Andrew Lothian, Mapping and measuring landscape quality, NZPI Conference, May 2012
25
Rating 8
8.16
8.15
8.32
8.20
Rating 7
7.87
7.53
7.79
7.67

Andrew Lothian, Mapping and measuring landscape quality, NZPI Conference, May 2012
26
Rating 6
6.68
6.67
6.67
6.67
Rating 5
5.67
5.63
5.69
5.69

Andrew Lothian, Mapping and measuring landscape quality, NZPI Conference, May 2012
27
Rating 4
4.46
4.38
4.54
4.58
Rating 3
3.80
3.73
3.79
3.79

Andrew Lothian, Mapping and measuring landscape quality, NZPI Conference, May 2012
28
EVALUATION OF METHOD Daniel and Vining (1983) proposed the following evaluation of the psychophysical method upon which the community preferences method is based:
Test Psychophysical method (Community preferences method)
Reliability & sensitivity
Agreement between observers, application to wide range of landscapes and sensitivity to landscape changes.
Validity Use of photographs to represent landscapes, recognise differences between expert and lay raters, validly measures scenic beauty.
Utility Ease of use of method, quantitative precision, objectivity, basis in public perception and judgement. Interval scale ratings enable landscape quality and landscape changes to be measured precisely.
Valuation Quantification of scenic quality along with other social values (e.g. water, timber, jobs, recreation) enables tradeoffs to be assessed.
Swaffield and Foster (2000) proposed tests of methods for landscape quality assessment. The following assesses the community preferences method against these tests:
Test Community preferences method
Validity in measuring landscape quality
The method provides an accurate measure of landscape quality
Reliability – consistency of results
The method is replicable and provides consistent results across studies
Sensitivity The method measures landscape quality to two significant figures (e.g. 6.27)
Credibility The method authentically represents the experience being investigated
Transferability Through use of benchmark scenes the method enables results to be compared across similar studies
Dependability The standardisation of photographs and a precise analytical method minimise researcher biases and variability
Confirmability All the results are publicly available on a website and the spreadsheets used can be checked by third parties
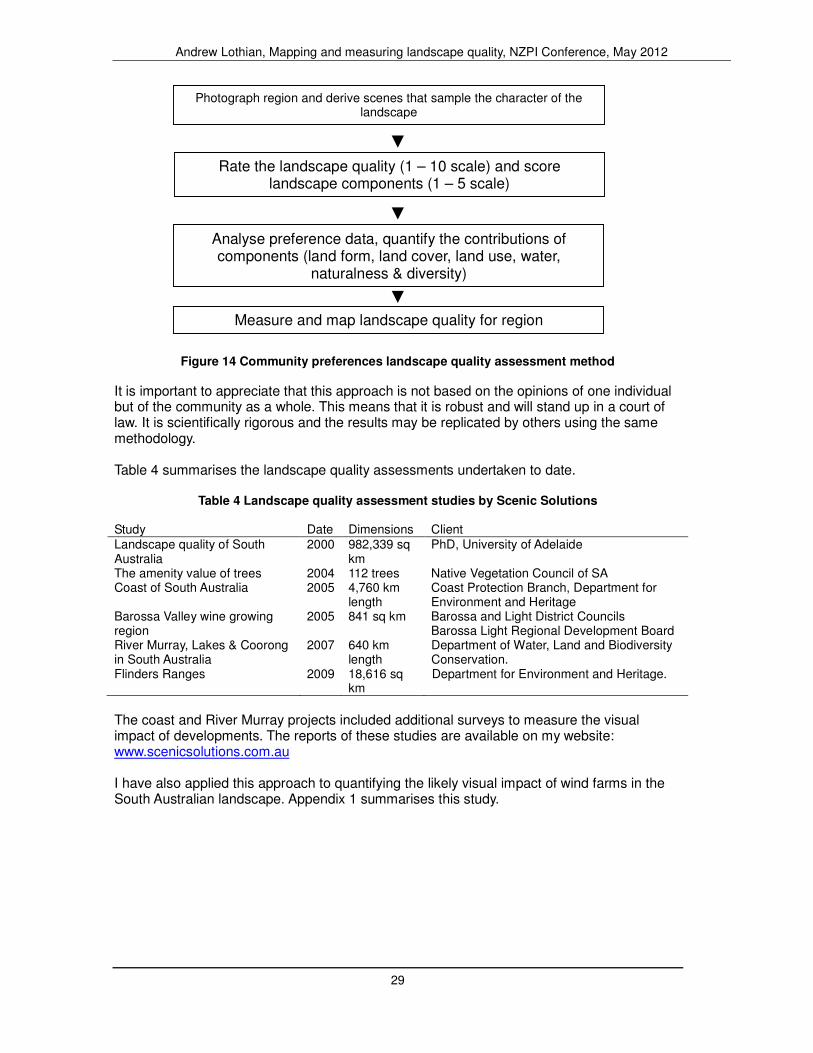
On these assessments the community preferences method passes all of these tests. The real test is whether the client is satisfied with the results and this has been achieved by the studies to date. SUMMARYOF METHOD In contrast to the earlier method that tried to derive landscape quality from documenting and analysing the landscape’s components (Figure 4), the community preferences method turns that on its head (Figure 14). The contributions of the components are identified and quantified at the end of the process instead of at the beginning.
Andrew Lothian, Mapping and measuring landscape quality, NZPI Conference, May 2012
29
▼
▼
▼
Figure 14 Community preferences landscape quality assessment method
It is important to appreciate that this approach is not based on the opinions of one individual but of the community as a whole. This means that it is robust and will stand up in a court of law. It is scientifically rigorous and the results may be replicated by others using the same methodology. Table 4 summarises the landscape quality assessments undertaken to date.
Table 4 Landscape quality assessment studies by Scenic Solutions Study Date Dimensions Client Landscape quality of South Australia
2000 982,339 sq km
PhD, University of Adelaide
The amenity value of trees 2004 112 trees Native Vegetation Council of SA Coast of South Australia 2005 4,760 km
length Coast Protection Branch, Department for Environment and Heritage
Barossa Valley wine growing region
2005 841 sq km Barossa and Light District Councils Barossa Light Regional Development Board
River Murray, Lakes & Coorong in South Australia
2007 640 km length
Department of Water, Land and Biodiversity Conservation.
Flinders Ranges 2009 18,616 sq km
Department for Environment and Heritage.
The coast and River Murray projects included additional surveys to measure the visual impact of developments. The reports of these studies are available on my website: www.scenicsolutions.com.au I have also applied this approach to quantifying the likely visual impact of wind farms in the South Australian landscape. Appendix 1 summarises this study.
Photograph region and derive scenes that sample the character of the landscape
Rate the landscape quality (1 – 10 scale) and score landscape components (1 – 5 scale)
Analyse preference data, quantify the contributions of components (land form, land cover, land use, water,
naturalness & diversity)
Measure and map landscape quality for region

Andrew Lothian, Mapping and measuring landscape quality, NZPI Conference, May 2012
30
APPLICATION TO NEW ZEALAND LANDSCAPE QUALITY The community preferences method for measuring and mapping landscape quality may be readily applied to assess New Zealand's landscape quality2. This should initially be at a whole-of-country basis to provide the overall context for more detailed regional and local assessments. The understanding gained and models derived from a national study would inform regional and local studies. A commitment by New Zealand to assessing its unique and outstanding scenic quality resources would result over time to the development of a body of studies involving many practitioners. Gradually New Zealand’s landscape quality would be quantified and mapped at increasingly detailed levels. New Zealand could be the first nation to measure and map its landscape quality at a national level. Landscape beauty is a national resource, a feature which captures the image of a country and its qualities. Imagine Scotland without its mountains, England without its lovely farmed lowlands enclosed by hedgerows, Canada without its prairies and Rockies, Italy without Tuscany, France without Provence; and New Zealand without its Southern Alps and North Island volcanic cones. Scenic quality is a resource which should be measured in order that it be managed. You cannot (or do not) manage what you do not measure. But more than manage; the very process of measuring identifies scenic quality as a resource, a resource that is worth identifying and protecting. It is reckoned along with a country’s soils, its water resources, mineral resources, wildlife and fisheries, and the quality of its air as a resource worth protecting and managing. But this does not happen generally without its identification as a resource, and identification parallels its measurement. The information gained from these surveys would be of inestimable value, not only in respect of the Resource Management Act, but also in planning, resource management and development assessment. Scenic quality would be factored into regional development plans and also play a significant role in national parks, tourism and recreation planning and management. Resource Management Act New Zealand's Resource Management Act include as objectives (emphasis added):
S 6(a) The preservation of the natural character of the coastal environment (including the coastal marine area), wetlands, and lakes and rivers and their margins, and the protection of them from inappropriate subdivision, use, and development: S 6 (b) the protection of outstanding natural features and landscapes from inappropriate subdivision, use, and development.
The RMA's linking of outstanding natural features and landscapes may be considered a ambiguous, however I understand that the Environment Court has established this to mean outstanding natural features and outstanding natural landscapes. Taken in this way, it establishes two threshold tests, naturalness and outstandingness. My experience is that high levels of perceived naturalness and high landscape quality almost always coincide.
2. In considering the application of the method in the New Zealand context, I have benefited from
reading the Resource Management Act, the judgement of Judge Jackson and the Environment Court (High Country Rosehip Orchards vs MacKenzie District Council) sent to me by Shelagh Noble, and a discussion paper by Dr Michael Steven of landscape assessment in the context of the RMA (Steven, 2012); to both Shelagh and Michael I extend my appreciation.

Andrew Lothian, Mapping and measuring landscape quality, NZPI Conference, May 2012
31
I understand that the “need to be able to define and delineate outstanding natural features and landscapes has become one of the more vexed issues in RMA-based landscape assessment” (Steven, 2012). From my reading there seem to be two key issues:
1. The definition of landscape – what is it in the context of the Resource Management Act?
2. How may natural character, and outstanding natural features and landscapes be defined?
Definition of landscape In defining the term landscape, I went back to first principles and consulted nine dictionaries to derive its meaning. Its primary meaning in all nine dictionaries may be summarised as:
An area of countryside; an expanse of rural scenery; visible features of an area of land; inland scenery; land of a particular type; a view of rural scenery.
Only two dictionaries referred to the aesthetic appeal of the landscape. The secondary meaning of landscape, also common to all, was painting a picture of a landscape, as a picture representing a landscape, or a branch of art representing such pictures. A third and more contemporary meaning was describing the horizontal landscape format of pages instead of the vertical portrait format. The main meaning of landscape is the view of physical visible area/expanse/features /land and a secondary meaning relates to its depiction in paintings. The aesthetic aspect of the landscape is a subsidiary and minor meaning. Thus the definition of landscape is generally taken to not include any judgement or assessment of its worth or quality, rather simply describing its contents and character – e.g. inland scenery, coastal landscape, mountainous scenery. I therefore take the position that landscape is defined as viewing the visible physical entity while the qualitative judgement of the worth of the landscape is its landscape quality or scenic quality. The following definition, which I wrote for Wikipedia, expresses landscape in physical terms.
Landscape comprises the visible features of an area of land, including the physical elements of landforms such as mountains, hills, water bodies such as rivers, lakes, ponds and the sea, living elements of land cover including indigenous vegetation, human elements including different forms of land use, buildings and structures, and transitory elements such as lighting and weather conditions.
Combining both their physical origins and the cultural overlay of human presence, often created over millennia, landscapes reflect the living synthesis of people and place vital to local and national identity. Landscapes, their character and quality, help define the self image of a region, its sense of place that differentiates it from other regions. It is the dynamic backdrop to people’s lives.
The Earth has a vast range of landscapes including the icy landscapes of polar regions, mountainous landscapes, vast arid desert landscapes, islands and coastal landscapes, densely forested or wooded landscapes including past boreal forests and tropical rainforests, and agricultural landscapes of temperate and tropical regions.
The definition of landscape in the European Landscape Convention is:
“Landscape” means an area, as perceived by people, whose character is the result of the action and the interaction of natural and/or human factors.

Andrew Lothian, Mapping and measuring landscape quality, NZPI Conference, May 2012
32
The Explanatory Report takes this further:
"Landscape" is defined as a zone or area as perceived by local people or visitors, whose visual features and character are the result of the action of natural and/or cultural (that is, human) factors. This definition reflects the idea that landscapes evolve through time, as a result of being acted upon by natural forces and human beings. It also underlines that a landscape forms a whole, whose natural and cultural components are taken together, not separately.
This definition includes the concept of perception. Perception is the process whereby the mind, receiving external stimuli via the senses, organises and interprets the sensory information. Because perception involves interpretation which implies assessing the landscape’s worth, this goes beyond merely viewing it to judging it. The viewing of landscape inevitably involves perception, the evaluation of its quality by our mind. The landscape is what lies before our eyes but landscape quality lies behind our eyes, in our mind’s interpretation of the visual field and in our evaluation of its worth. What the landscape comprises is objective fact. Landscape quality is the human subjective response to the physical landscape Viewing, seeing or observing the landscape convey a neutral position, no judgement is implied. Making judgements about the quality of the landscape is landscape quality assessment. While the Resource Management Act does not define landscape (“outstanding natural features and landscapes”), the word “outstanding” conveys a judgement of the landscape so this comprises the landscape as perceived. The term landscape and the definitions focus on land, not water. However landscape is generally taken to include rivers and lakes contained in the landscape. It should also extend to coastal landscapes, or seascapes, the only proviso I believe is that land should provide the visible context for the water. I understand that under the RMA, landscape is considered to include these aspects. How may the protection of outstanding natural features and landscapes be defined? Many questions arise from the Resource Management Act's statement of “the outstanding natural features and landscapes”:
• “outstanding” Relative to what? – the locality, region, nation, world? • “natural” Can a continuum scale from wholly natural to wholly cultural be assumed? • “features” What are the components of the landscape? • “landscapes” definition
The community preferences method can provide the basis for defining a hierarchy of landscape excellence, from the dull and unattractive, through the mediocre to the truly outstanding. A key issue is setting the threshold for outstanding at various spatial contexts. Currently the practice is that local authorities determine what is locally outstanding and regional authorities determine it at the regional level which seems to be a recipe for inconsistency and dispute. The definition of landscape significance in isolation of their national and regional context is fraught with difficulties and likely to be challenged. A better approach is to determine what is outstanding at the national level and then work down through the regions and local areas. Using the landscape quality map that derived from the application of the community preferences method, the threshold for nationally outstanding landscapes under the RMA could, for example, be set at 8 and lesser levels set for regions or localities; e.g.
National outstanding landscapes 8 and above Regional outstanding landscapes 7 and above Local area outstanding landscapes 6 and above
Thus the spatial context for the definition of outstanding landscapes needs to be set. A process for arriving at such thresholds would need to be agreed; it should involve both

Andrew Lothian, Mapping and measuring landscape quality, NZPI Conference, May 2012
33
community and specialist inputs. What is regarded as outstanding at the global level will also be outstanding at the national, regional and local levels. However a site which is considered outstanding at the local level will not necessarily be regarded as outstanding at the other levels (Figure 15).
Spatial level
Global National Regional Local
Global outstanding █ █ █ █
National outstanding █ █ █
Regional outstanding █ █
Local outstanding █
Figure 15 Spatial boundary of outstanding
Setting thresholds in conjunction with the community preferences method provides a consistency of approach and overcomes the issue of inconsistent appraisals of outstanding that beset cases before the Environment Court. It removes the assessment of whether a particular landscape is outstanding from the opinion of an expert witness to that of an objective, disinterested (i.e. having no personal interest or stake in the outcome) assessment that was undertaken prior to and separately from the particular case before the Court. Outstanding can also be considered at a global level; what New Zealand landscapes can be considered outstanding globally? The list of World Heritage sites provides a basis for defining outstanding at the global scale. The Convention defines cultural and natural sites as (emphasis added):
works of man or the combined works of nature and of man, and areas including archaeological sites which are of outstanding universal value from the historical, aesthetic, ethnological or anthropological points of view.
Ten criteria of World Heritage status are defined and these include Criterion 7 natural aesthetics which requires that the area contain superlative natural phenomena or areas of exceptional natural beauty and aesthetic importance. This appears to meet the RMA test of natural and outstanding. The Convention recognises that no area is totally pristine and that all natural areas are in a dynamic state, and to some extent involve contact with people. Three areas in New Zealand have been accepted as of World Heritage significance:
• Te Wahipounamu – South West NZ World Heritage Area incorporating Fjordland, Westland, Mount Aspiring and Mount Cook National Parks
• Tongariro National Park • Sub-Antarctic Islands including the Auckland, Snares, Campbell, Bounty and Antipodes
Islands Of these, Te Wahipounamu and Tongariro National Park have been listed under Criterion 7 (aesthetics) as well as other criteria, however the Sub-Antarctic Islands were not listed under Criterion 7. Thus only Te Wahipounamu and Tongariro National Park can be regarded as outstanding landscapes at a global level.
The New Zealand Department of Conservation (DOC) has also developed a list of further possible World Heritage sites (see www.newzealand.com). Obviously the designated sites fulfil the criterion of outstanding under the RMA but what of other potential areas?

Andrew Lothian, Mapping and measuring landscape quality, NZPI Conference, May 2012
34
I have examined 24 inventories of the Wonders of the World. The term “wonder” is a curious term but widely used in lists of the 7 wonders of the world, wonders of the ancient world, etc. Used as a noun, wonder means “the emotion excited by what is strange and surprising; a feeling of surprised or puzzled interest, sometimes tinged with admiration”, the example given for the latter being the wonder felt at first seeing the Grand Canyon. A bias is apparent in many of the lists towards “wonders” that are located in the country that prepared the list. Thus sites in the United States and other Western nations tend to be over-represented as many of the lists originated in these countries while “wonders” in remote or developing countries are under-represented. The top site, the Grand Canyon, is listed by eleven of the 24 lists followed by Venezuela's Angel Falls and Australia's Great Barrier Reef, both on nine lists. Milford Sound is listed by five (along with such areas as the Norwegian fjords, the Rockies at Banff, the Matterhorn, and the Dead Sea). Rudyard Kipling described Milford Sound as the “Eight Wonder of the World”. No other site in New Zealand is included on 3 or more lists. These lists provide some indication at a global scale of outstanding. It is therefore possible to define outstanding landscapes in New Zealand from a global perspective. Carrying out a survey of New Zealand landscape quality and applying the thresholds suggested earlier would provide the basis for identifying outstanding landscapes at varying spatial levels, national through to local. Turning to the issue of natural, the Environment Court has defined (Long Bay-Okura Great Park Society Inc. v North Shore City Council (A078/2008)) the following criteria for naturalness:
• relatively unmodified and legible landform and relief; • the landscape being uncluttered by structures and/or obvious human influence; • the presence of water (lake, river, sea);
• the presence of vegetation (especially native vegetation) and other ecological patterns. The presence of water and of trees (i.e. indigenous vegetation) are important cues for naturalness. While I agree with these criteria, their assessment pose further problems for applicants in definitions and in reaching consensus on terms such as relatively unmodified, legible landforms, uncluttered, and ecological patterns. I am aware of the work of Dr Vicky Froude (Pacific Eco-logic, 2012) in New Zealand in defining naturalness through measuring:
• An ecological naturalness index (ENI) • A hydrological and geomorphological naturalness index (HGNI) • A freedom from buildings and structures index (FBSI)
The three indices are then combined into an overall natural character index (NCI). Each of the indexes is informed by a set of indicators (e.g. impact of alien mammals on native flora and fauna (terrestrial & freshwater) which are measured by parameters (e.g. a score representing the level of pest control). There are nine indicators and fourteen parameters. The method measures the extent that the current coastal environment has been modified from its original natural condition. This recognises that human awareness of change is often from a relatively recent time perspective and that there has often been very major changes, for example clearance of the vegetation in the catchment has resulted in great siltation of estuaries which allows mangroves to flourish, trees which previously had not been present. This approach fulfils Sec 6(a) of the RMA covering “preservation of the natural character of the coastal environment” and may also be relevant for Sec 6(b) “protection of outstanding natural features and landscapes”. Sec 6(a) may be considered to address the ecological condition of the environment whereas Sec 6(b) addresses the appearance of the landscape.

Andrew Lothian, Mapping and measuring landscape quality, NZPI Conference, May 2012
35
While Froude’s method provides an excellent basis for Sec 6(a), I question whether such a sophisticated method is required for Sec 6(b). From the landscape studies I have completed, naturalness is one of the key attributes that correlates with landscape quality. Participants have no problem in assessing naturalness. It is defined as the perceived natural appearance of the landscape without human presence apparent. I consider naturalness to be an attribute of the landscape which is perceived and judged by the viewer who relies less on any knowledge they may have of its ecological naturalness but rather assesses it against their own standard of the appearance of naturalness. While I consider perceived naturalness to be a sufficient measure for the purposes of landscape assessment which can be informed by objective knowledge of the natural condition of the landscape, my preference is that it be wholly based on perception. This is because my experience has been that the main problem is that the respondent's training may influence their assessment. In a survey I conducted of the amenity value of trees, many of which were large single trees amidst pasture which comprises the classic and much loved pastoral landscape, participants with training in life science, especially botanists, regarded the absence of a shrub layer as meaning the area was grazed and degraded and they therefore scored it low on the natural score. However this is an objective assessment of naturalness, not a perceptual assessment. Thus it is necessary to define it as perceived naturalness rather than ecological naturalness. While pines may be regarded as natural in North America and Europe, they have been introduced into Australia and tend to be disliked, they are certainly not regarded as natural. I disagree with the Environment Court's statement that “natural” is a word indicating a product of nature and can include such things as pasture, exotic tree species (pine), wildlife both wild and domestic...” (Harrison v Tasman District Council (W42/1993)). (emphasis added). While this is referring to nature, not just landscapes, nevertheless, natural must mean without perceived human presence.
Very high High Moderate-High Moderate Moderate – Low Low Very Low
Wholly natural or pristine
Wholly cultural
Source: Steven, 2012 Figure 16 The continuum of naturalness represented as a scale of naturalness with 7 ranges
In the determination of the High Country Rosehip Orchards case, the Court asked “how natural is the Mackenzie Basin's landscape?” and agreed with Dr Steven's comment: “there will likely be landscapes within the Moderate-High range of naturalness (on a 7-point scale) that could be regarded as natural enough for ONL status.” (Figure 16). However I understand from Dr Steven that he was referring to other locations in NZ where the Moderate-High natural status was deemed by courts as outstanding. I consider this is far too broad a range; moderate-high could scarcely be regarded as outstanding; it is only just above the median. This would be the equivalent of 3 or above on a 5 point scale where 5 should be regarded as outstanding. A standard of 3 will include many landscapes that are not outstanding. Thus the threshold for outstanding should be very high on Dr Steven's continuum, or 5 on a five-point scale, but not lower. Dr Steven considers a landscape must rate High or Very High to be counted as outstanding. Dr Steven’s paper refers to possible resistance from landscape professionals to the use of an explicit scale which requires quantification. As this is a key issue to the adoption of the community preferences method that I have described, it needs to be addressed. The clients of the studies I have completed have mainly been planning and environmental agencies as well as local councils. The method employed is easily understood and has wide acceptance among professional practitioners. In many study reports I have included explanations of the statistical terms and concepts to assist their understanding of the

Andrew Lothian, Mapping and measuring landscape quality, NZPI Conference, May 2012
36
outcomes. The difficulty that Dr Steven is probably referring to is the fear by landscape architects or planners that they may be expected to conduct such surveys themselves. This is understandable but unrealistic. The main skills involved cover project management, statistical analysis and Internet survey design and hosting. These professionals are competent in project management and simply need to call in assistance for the other areas. I use a specialist in Internet survey design for all of my projects. A more fundamental issue is that professionals may consider it inappropriate to use a scale to measure landscape quality. Again, my experience is that thousands of survey participants find the scale very satisfying and that it integrates all of their experience, knowledge and expectations regarding landscape quality. The scale provides a simple surrogate for this and is surprisingly robust in its application. The term features in the RMA is addressed in the community preference method through scoring the features present in the landscape. These scores are essential in understanding the contribution of each of the features to the overall landscape quality. SUMMARY My presentation has aimed to explained how landscape quality can be measured using a community preferences approach, and how this can be applied in the New Zealand context to measure landscape quality across the country, while fulfilling the requirements of the Resource Management Act. As researchers apply the method, a body of studies would develop and allow meta-analysis of findings, and their comparison across the country. Gradually New Zealand's unique and outstanding landscapes would be quantified and mapped at increasingly detailed levels. In submitting this method I respect the enormous efforts that practitioners have made in New Zealand to address the issue of landscape quality. My aim is simply to provide them with a further possible alternative to achieve the outcomes they seek. The take home message is: that a community preferences approach to measuring and mapping landscape quality can provide an effective and robust means for measuring landscape quality, thereby fulfilling the RMA objective of “the protection of outstanding natural features and landscapes”. I challenge planners & landscape architects to embrace this new approach. Dr Andrew Lothian Director, Scenic Solutions PO Box 3158 UNLEY, South Australia, 5061 AUSTRALIA E: [email protected] I: www.scenicsolutions.com.au Mob 0439 872 226 Ph (618) 8272 2213

Andrew Lothian, Mapping and measuring landscape quality, NZPI Conference, May 2012
37
REFERENCES Anderson, L.M. & H.W. Schroeder, 1983. Application of wildland scenic assessment methods
to the urban landscape, Landscape Planning, 10, 219 - 237. Appleton, J. 1975. The Experience of Landscape. John Wiley, London. Balling J.D. & J.H. Falk, 1982, Development of visual preference for natural environments,
Environment and Behavior, 14:1, 5 - 28. Beardsley, M.C., 1966. Aesthetics from Classical Greece to the Present. A Short History.
Collier-MacMillan, London. Boffa Miskell Ltd, 2010, Canterbury Regional Landscape Study Review Final Report.
Prepared for Environment Cantebury. Brown, S., 1985. Landscape evolution - anathema or essential, Landscape Design, 157, 9 - 11. Bourassa, S.C, M. Hoesli and J. Sun, 2005, “The price of aesthetic externalities.” Journal of
Real Estate Literature, vol. 13: 2, 167-187. Buhyoff, G.J. & W.A. Leuschner, 1978. Estimating psychological disutility from damaged forest
stands. Forest Science, 24:1, 424 - 432. Craik, K.H., 1972. Appraising the objectivity of landscape dimensions, in: J.V. Krutilla (Ed),
Natural Environments, Studies in Theoretical and Applied Analysis. Resources for the Future, John Hopkins University Press, Baltimore.
Anne Frank: The Diary of a Young Girl Doubleday & Company Coughlin, R.E. & K.A. Goldstein, 1970. The Extent of Agreement Among Observers on
Environmental Attractiveness, RSRI Discussion Paper Series No 37, Regional Science Research Institute, Philadelphia.
Daniel T.C. & R.S. Boster, 1976, Measuring Landscape Esthetics: The Scenic Beauty
Estimation Method. Rocky Mountain Forest and Range Experimental Station, Fort Collins, Colorado, USDA Forest Service Res Paper RM 167.
Daniel, T.C. & J. Vining, 1983. Methodological issues in the assessment of landscape quality,
in: Altman, I. & J.F. Wohlwill, Behavior and the Natural Environment, Plenum Press, New York.
Felsten, G., 2009. Where to take a study break on the college campus: an attention
restoration theory perspective. Jnl Env. Psych., 29, 160 – 167. Hamyln, D.W. 1987. A History of Western Philosophy. Viking Penguin. Herzog, T.R., 1984. A cognitive analysis of preference for field-and-forest environments,
Landscape Research, 9, 10 - 16. Herzog, T.R., 1985. A cognitive analysis of preference for waterscapes, Jnl. Environmental
Psychology, 5, 225 - 241. Herzog, T.R., C.P. Maguire, and M.B. Nebel, 2003. Assessing the restorative components of
environments, Jnl. Env. Psych. 23, 159 – 170.

Andrew Lothian, Mapping and measuring landscape quality, NZPI Conference, May 2012
38
Hull, R.B. & G. J. Buhyoff, 1984. Individual and group reliability of landscape assessments,
Landscape Planning, 11, 67 - 71. Kaplan, S., 1979. Perception and landscape: conceptions and misconceptions. In Elsner, G.H.
& R.C. Smardon [Eds], 1979. Proceedings of Our National Landscape Conference on Applied Techniques for Analysis and Management of the Visual Resource, 23-25 April, 1979, Incline Village, Nevada; Pacific SW Forest & Range Experiment Station, Berkeley.
Kaplan, S. 1987. Aesthetics, affect and cognition: environment preference from an evolutionary
perspective. Environment and Behavior, 19:1, 3-32. Kaplan S. & R. 1982. Cognition and Environment. Praeger, New York. Kaplan, R. & Kaplan S., 1989. The Experience of Nature - A Psychological Perspective.
Cambridge University Press. Kaplan, R., Kaplan S. & T. Brown., 1989. Environment preference: a comparison of four
domains of predictors, Environment and Behavior, 21:5, 509 - 530. Kellomaki, S. & R. Savolainen, 1984. The scenic value of the forest landscape as assessed in
the field and the laboratory, Landscape Planning, 11, 97 - 107. Kuo, F., and W.C. Sullivan, 2001a. Aggression and violence in the inner city Effects of
environment via mental fatigue. Env & Behav. 33:4, 543 – 571. Kuo, F., and W.C. Sullivan, 2001b. Environment and crime in the inner city Does vegetation
reduce crime? Env & Behav. 33:3, 343 – 367. Kweon, B-S, R.S. Ulrich, V.D. Walker & L.G. Tassinary, 2008. Ander and Strees. The role of
landscape posters in an office setting. Environment & Behavior, 40:3, 355 – 380. Lothian, A., 1999. Landscape and the philosophy of aesthetics: is landscape quality inherent
in the landscape or in the eye of the beholder? Landscape and Urban Planning, 44, 177 -198.
Lothian, A., 2000. Landscape Quality Assessment of South Australia. PhD dissertation,
University of Adelaide, Adelaide. Lothian, A., 2004. Amenity Value of Scattered and Isolated Trees. Report to the South
Australian Native Vegetation Council. Adelaide Lothian, A., 2004. Wind energy industry’s responsibility for visual impact: a study of the visual
effects of wind farms in South Australia. Paper given at the 12th International Conference of Greening of Industry Network, Partnerships for Sustainable Development, 7 – 10 Nov, 2004, Hong Kong.
Lothian, A., 2005a. Coastal Viewscapes of South Australia. Report for the Coast Protection
Board, South Australian Department for Environment and Heritage, Scenic Solutions, Adelaide.
Lothian, A., 2005b, Barossa and Light Region Landscape Assessment Study. Report for
Planning SA and the Barossa Council, the Light Regional Council, and the Barossa Light Regional Development Board. Scenic Solutions, Adelaide

Andrew Lothian, Mapping and measuring landscape quality, NZPI Conference, May 2012
39
Lothian, A., 2006. Victor Harbor Landscape Amenity. Report for City of Victor Harbor Scenic Solutions, Adelaide.
Lothian, A., 2006. Measuring and mapping South Australia’s coastal scenic quality. South
Australian Geographer, 21:1, April, 3 – 8. Lothian, A., 2007, South Australian River Murray Landscape Assessment Project. Report for
the Department of Water, Land and Biodiversity Conservation and the South Australian Murray Darling Basin Natural Resources Management Board. Scenic Solutions, Adelaide.
Lothian, A., 2007 Landscape quality assessment studies in South Australia, South Australian
Geographical Journal, 106, 27 – 53, Adelaide. Lothian, A., 2008. Scenic perceptions of the visual effects of wind farms on South Australian
landscapes. Geographical Research. Jnl of the Institute of Australian Geographers. 46:2, June, 196 – 207.
Lothian, A., 2008. Visual impact assessment of some developments in South Australia.
Australian Planner, 45:4, 35 – 41. Lothian, A., 2009. Flinders Ranges Landscape Quality Assessment Project. Report for the
South Australian Department for Environment and Heritage, Scenic Solutions, Adelaide. Lothian, A., 2009. Landscape management for coastal regions: cases of Australia and their
applicability to Korea. Presentation to the International Experts Forum on Landscape Management, Seoul, Republic of Korea, 3 Nov.
Miller, P.A., 1984. A comparative study of the BLM Scenic Quality Rating Procedure and
landscape preference dimensions, Landscape Jnl, 3:2, 123 - 135. Mosley, M.P., 1989, Perceptions of New Zealand River Scenery, New Zealand Geographer,
45:1, 2 - 13. Orians, G.H., 1980. Habitat selection: general theory and applications to human behavior, in:
J.S. Lockard, The Evolution of Human Social Behavior, Elsevier, New York. pp 49 - 66. Orians, G., 1986, An ecological and evolutionary approach to landscape aesthetics, in
Penning-Rowsell, E.C. & D. Lowenthal, Landscape Meanings and Values, Allen & Unwin, London.
Orians, G. & J. H. Heerwagen, 1992. Evolved responses to landscapes, in: J.H. Barlow, L.
Cosmides & J. Tooby, (Eds), The Adapted Mind, Evolutionary Psychology and the Generation of Culture, Oxford University Press, pp 555 - 579.
Pacific Eco-logic, 2012. Refining the QINCCE methodology for measuring coastal natural
character using case studies in Tasman District. Prepared for Tasman District Council. Runte, A., 1979. National Parks, The American Experience. University of Nebraska Press,
Lincoln Schomaker, J.H., 1978. Measurement of preferences for proposed landscape modifications.
Landscape Research, 3, 5 - 9. Shuttleworth, S., 1980. The use of photographs as an environment presentation medium in
landscape studies, Jnl Environmental Management, 11, 61 - 76.

Andrew Lothian, Mapping and measuring landscape quality, NZPI Conference, May 2012
40
Staats, H., A. Kieviet,T. and Hartig, 2003. Where to recover from attentional fatigue: An
expectancy-value analysis of environmental preference. Jnl. Env. Psych., 23, 147 – 157. Steven, M. 2012. Towards a Methodology for Landscape Assessment in the context of the
Resource Management Act. A draft discussion paper. Sullivan, W.C., 1994. Perceptions of the rural-urban fringe: citizen preferences for natural and
developed settings, Landscape and Urban Planning, 29, 85 - 101. Swaffield, SR and Foster, RJ., 2000. Community perceptions of landscape values in the
South Island high country. Science for Conservation 159. Department of Conservation, Wellington.
Ulrich, R.S., 1983, Aesthetic and affective response to natural environment, in I. Altman and
J.F. Wohlwill, Behavior and the Natural Environment, Plenum Press, New York. Ulrich, R.S., 1984. View through a window may influence recovery from surgery. Science, 22,
420 - 421, 27 April. Ulrich, R.S., 1986. Human responses to vegetation and landscapes, Landscape & Urban
Planning. 13, 29 - 44. Ulrich, R.S., R.F. Simons, B.D. Losito, E. Fiorito, M.A. Miles & M. Zelson, 1991. Stress
recovery during exposure to natural and urban environments. Jnl Environmental Psychology, 11, 201 - 230.
Vodak, M.C., P.L. Roberts, J.D. Wellman & G.J. Buhyoff, 1985. Scenic impacts of eastern
hardwood management, Forest Science, 31:2, 289 - 301. Wiesel, E. 1972. Night, Penguin Books. Zajonc, R.B., 1980. Feeling and thinking: preferences need no inferences. American
Psychologist, 35:2, 151-175. Zube, E.H., 1973. Rating everyday rural landscapes of the north-eastern U.S., Landscape
Architecture, 63:4, 370 - 375. Zube, E.H., D. G. Pitt & T. W. Anderson, 1975. Perception and prediction of scenic resource
values of the northeast, In: Zube, E.H., R.O. Brush & J.G. Fabos [Eds], ibid, 151 - 167. Zube, E.H., R.O. Brush & J.G. Fabos (Eds), 1975. Landscape Assessment: Values,
Perceptions and Resources, Dowden, Hutchinson & Ross, Inc, Stroudsburg, Penn

Andrew Lothian, Mapping and measuring landscape quality, NZPI Conference, May 2012
41
Appendix 1 VISUAL IMPACT OF WIND FARMS IN SUTH AUSTRALIA The development of wind farms in Australia was driven initially by the Australian Government’s Renewable Energy (Electricity) Act 2000, which required electricity retailers to provide 2% of generation from renewable sources by 2010. In 2009, the target was upgraded to deliver 20% of Australia’s electricity from renewable sources by 2020. South Australia has already achieved this and is aiming for 33% by 2020. After hydro power, wind is the next largest generator with 22% of renewable electricity in Australia (Clean Energy Australia Report, 2011). The measures were aimed at reducing greenhouse gas emissions while stimulating the development of new green industries. Many forms of renewable energy were permitted ranging from landfill gas, hydro, solar, biomass to wind energy. Since 2000, wind farms started to appear in the Australian landscape. Apart from a few single small turbines in the 1990s, the earliest major wind farm was at Codrington in western Victoria which opened in 2002. Across Australia either operating or under construction are 61 wind farms comprising 1572 turbines with a total generating capacity of 3170 MW. The cost of this has been nearly $8 B. South Australia has 42% of the turbines and Victoria has 32%. Research Project Early in this period, in 2002, I developed a research study to examine the visual impact of wind farms. This was undertaken before any wind farms had been established in South Australia so it provided a theoretical assessment of their likely visual impact.
A total of 21 scenes on the coast (Example - Figure 1) and 47 on agricultural land (Example - Figure 2) were selected where wind farms could be sited. Images of wind farms were inserted into these, scaled appropriately for distance. A set of scenes with the wind farms and without them was assembled and placed in random order so that the same scene did not appear in sequence. The ratings by 311 respondents who rated the scenic quality of the scenes on a 1 (low) to 10 (high) scale provided the basis for analysis and modelling.
Scene without wind farm Rating 8.15
Scene with wind farm Rating 6.43
Figure 1 Coastal scenes without and with a wind farm and their ratings

Andrew Lothian, Mapping and measuring landscape quality, NZPI Conference, May 2012
42
Mt Dutton without wind farm Rating 6.92
Mt Dutton with wind farm Rating 5.34
Figure 2 Inland scenes without and with a wind farm and their ratings
In all of the coastal scenes, the presence of the wind farms lowered scenic quality (Figure 3), from an average of 7.61 without the wind farm to 6.09 with the wind farm, a significant difference of 1.52 (t = 14.06, df 310, p = 0.000) which is a very substantial change on this scale.
Figure 3 Impact of wind farms on coastal landscapes
Agricultural landscapes are generally of lower landscape quality than the coast because water, which enhances landscape quality, is generally absent from the scene. Average ratings were reduced from 5.47 to 5.21, a small but a nevertheless statistically significant difference of 0.26 (Figure 4).
Where the scenic quality of the agricultural landscapes was moderately high (say 5.5 to 7) the presence of the wind farm lowered scenic quality. However a surprise finding was that where the scenic quality was moderate or low (below 5.1, at the cross-over of trend lines in Figure 4) the presence of the wind farm actually increased the scenic quality. This is likely to be because the wind farm added interest to an otherwise dull or mediocre landscape (Figure 5).

Andrew Lothian, Mapping and measuring landscape quality, NZPI Conference, May 2012
43
Figure 4 Impact of wind farms on inland landscapes
Scene without wind farm Rating 4.26
Scene with wind farm Rating 4.94
Figure 5 Agricultural scenes enhanced by the presence of the wind farm
The evidence provided by this study could be used to help determine the optimum locations for wind farms, by identifying no-go areas and for guiding them to areas of minimal impact to the landscape.