measures · measures of success react less, lead better, improve more. buy the book: . book sample...
TRANSCRIPT


MEASURES OF SUCCESS
React Less, Lead Better, Improve More

Measures of Success: React Less, Lead Better, Improve More
Copyright © 2019 by Constancy, Inc. All Rights Reserved.
No part of this publication may be reproduced, stored in a retrieval system or transmitted, in any form or by any means—electronic, mechanical,
photocopying, recording or otherwise—without prior written permission from the publisher, except for the inclusion of brief quotations in a review.
For information about this title or to order other books and/or electronic media, contact the publisher:
Constancy, Inc. PO Box 1102
Colleyville, TX 76034www.MarkGraban.com
ISBN: 978-1-7335194-1-0
Printed in the United States of America
Interior design: 1106 Design
Also by Mark Graban
LEAN HOSPITALSImproving Quality, Patient Safety, and Employee Engagement
( 3 R D E D I T I O N , 2 0 1 6 ) — A V A I L A B L E I N E I G H T L A N G U A G E S — S H I N G O R E S E A R C H A W A R D
HEALTHCARE KAIZENEngaging Front-Line Staff in Sustainable Continuous Improvements
( C O - A U T H O R E D B Y J O E S W A R T Z ) — S H I N G O R E S E A R C H A W A R D
THE EXECUTIVE GUIDE TO HEALTHCARE KAIZENLeadership for a Continuously Learning and Improving Organization
( C O - A U T H O R E D B Y J O E S W A R T Z )
PRACTICING LEANLearning How to Learn How to get Better… Better
( A N T H O L O G Y E D I T E D B Y M A R K G R A B A N , W I T H 1 5 O T H E R A U T H O R S )
Quick Endorsements“With clarity and precision, Mark Graban steps through the process of collecting and analyzing the kind of data you focus on... If you’re navigating a tough business environment, you need this book.”
D A N I E L H . P I N K | AUTHOR OF WHEN AND DRIVE
“Mark Graban has written a readable, informative book to guide any leader who wants to help an organization achieve true and lasting success. Improvement has been made easier thanks to his work.”
E R I C R I E S | AUTHOR OF THE LEAN STARTUP AND THE STARTUP WAY
“The data-driven decision-making techniques in this book will stop you from con-fusing activity with progress and—finally—get things done.”
Q U I N T S T U D E R | FOUNDER , STUDER COMMUNITY INST ITUTE | AUTHOR OF BOOKS , INCLUD ING HARDWIR ING EXCELLENCE
“Mark has hit another home run... the book that everyone who is serious about improvement needs to read.”
D A N M A R K O V I T Z | FOUNDER OF MARKOV ITZ CONSULT ING | AUTHOR OF A FACTORY OF ONE AND BUILD ING THE F I T ORGANIZAT ION
“This book brings much-needed clarity to this important topic and will be invalu-able to anyone seeking to make sustainable improvements to their processes.”
H A R V E Y L E A C H | PR INC IPAL CONSULTANT, THE CONSULTANCY COMPANY, OXFORD , ENGLAND
“This book outlines in understandable terms the complex world of perfor-mance measurement.”
D R . J O H N T O U S S A I N T | EXECUT IVE CHA IRMAN AND CEO , CATALYS IS | AUTHOR OF BOOKS , INCLUD ING ON THE MEND

“... an engaging and practical guide... an essential addition to any Lean or Six Sigma learning library.”
J O N M I L L E R | PARTNER , GEMBA ACADEMY | AUTHOR OF CREAT ING A KA IZEN CULTURE
“Mark Graban taught the KaiNexus team how to understand the story a metric is actually telling over time. We’ve saved time by not overanalyzing every up and down in our metrics — and that’s valuable time we now put to better use.”
D R . G R E G J A C O B S O N | CEO AND CO -FOUNDER , KA INEXUS
“Mark has produced an excellent book to help improvement professionals and leaders alike gain clarity about how their processes are actually performing to drive more relevant improvement. Bravo!”
K A R E N M A R T I N | PRES IDENT, TKMG , INC . | AUTHOR OF BOOKS , INCLUD ING CLAR ITY F IRST AND THE OUTSTAND ING ORGANIZAT ION
“[Mark] shows us precisely how to avoid the data-interpretation traps that can lead us astray in our attempts to improve our systems.”
M AT T H E W E . M AY | AUTHOR , THE ELEGANT SOLUT ION AND WINNING THE BRA IN GAME
“I’ve long thought the world would be a better place if everyone took a statistics class, but this book is much better (and shorter)!”
C R A I G D E A O | MANAG ING D IRECTOR , SPEAKER , AUTHOR — STUDER GROUP, A HURON SOLUT ION
“Too often, organizations waste time and energy responding to short-term fluc-tuations in performance that do not reflect sustained trends. Measures of Success provides leaders with a blueprint for separating signal from noise and focusing resources on lasting improvement.”
Z E Y N E P T O N | ADJUNCT ASSOC IATE PROFESSOR AT M IT SLOAN SCHOOL OF MANAGEMENT | AUTHOR OF THE GOOD JOBS STRATEGY

Table of Contents Foreword by Donald J. Wheeler, Ph.D. . . . . . . . . . . . . . . . . . . . . . . . . . . . . . . . IX
Preface . . . . . . . . . . . . . . . . . . . . . . . . . . . . . . . . . . . . . . . . . . . . . . . . . . . . . . XI
Acknowledgments . . . . . . . . . . . . . . . . . . . . . . . . . . . . . . . . . . . . . . . . . . . . . XV
Introduction . . . . . . . . . . . . . . . . . . . . . . . . . . . . . . . . . . . . . . . . . . . . . . . . XVII
CHAPTER 1: Improving the Way We Improve . . . . . . . . . . . . . . . . . . . . . . . . . . . . . . . . . . . . 1
CHAPTER 2: Using Process Behavior Charts for Metrics . . . . . . . . . . . . . . . . . . . . . . . . . . 25
CHAPTER 3: Action Metrics, not Overreaction Metrics. . . . . . . . . . . . . . . . . . . . . . . . . . . . 47
CHAPTER 4: Linking Charts to Improvement. . . . . . . . . . . . . . . . . . . . . . . . . . . . . . . . . . . 81
CHAPTER 5: Learning From “The Red Bead Game”. . . . . . . . . . . . . . . . . . . . . . . . . . . . . 103
CHAPTER 6: Looking Beyond the Headlines. . . . . . . . . . . . . . . . . . . . . . . . . . . . . . . . . . . 127
CHAPTER 7: Linear Trend Line and Other Cautionary Tales . . . . . . . . . . . . . . . . . . . . . . . 143
CHAPTER 8: Workplace Cases and Examples . . . . . . . . . . . . . . . . . . . . . . . . . . . . . . . . . 175
CHAPTER 9: Getting Started with Process Behavior Charts . . . . . . . . . . . . . . . . . . . . . . 195
APPENDIX A: How to Create Process Behavior Charts . . . . . . . . . . . . . . . . . . . . . . . . . . . 209
APPENDIX B: Summary of Key Points . . . . . . . . . . . . . . . . . . . . . . . . . . . . . . . . . . . . . . . . 231
APPENDIX C: Additional Resources . . . . . . . . . . . . . . . . . . . . . . . . . . . . . . . . . . . . . . . . . 233
About the Author . . . . . . . . . . . . . . . . . . . . . . . . . . . . . . . . . . . . . . . . . . . . . 235

I X
Foreword
I t is an honor to have the privilege to write a foreword for this book by my friend Mark Graban. He has created a guide for using and understanding the data that surround us every day. These numbers are constantly changing. They
go up, and they go down. But what do these changes signify? Some of the changes in the data will represent real changes in the underlying system or process that generated the data. Other changes will simply represent the routine variation in the underlying system when nothing has changed.
So the problem with interpreting the data is deciding when a change in the data represents a real change in the system and when it does not. As a result, there are two ways we can get things right and two ways we can get things wrong. We get things right when the system changes and we interpret the change in the data as a signal of that change. We also get things right when the system does not change and we interpret the change in the data as being merely noise.
We get things wrong when the system does not change but we interpret the data as representing a change. This is the error of interpreting noise as a signal. We also get things wrong when the system changes and we interpret the data as repre-senting no change. This is the error of missing a signal.
Since everyone understands the problem of missing a signal, we usually seek to avoid this error by interpreting every change as a signal. The numbers go up, and that’s a signal. The numbers go down, and that’s a signal. The numbers stay the same, and that’s a signal, too (because we expected them to go up or down). As we run around crying that “the sky is falling,” we do occasionally get it right, but more often than not, we are simply interpreting noise as a signal.
Mark presents the antidote to this disease of interpreting noise as signals. And that is why everyone who is exposed to business data of any type needs to read this book.
Donald J. Wheeler, Ph.D.KNOXV ILLE | 8 JUNE 2018
X I
Preface
W hy did I write this book? I want you and your organization to be more successful, to improve more, and to be less frustrated in your improve-ment efforts. My intent is that this book’s methods will help managers,
executives, business owners, and improvement specialists in any industry use lim-ited time more effectively.
As I’ve worked and talked with leaders throughout my career, I’ve heard many common challenges that aren’t always easily articulated. One leader expressed a vague underlying concern:
“We’re trying really hard, but this approach [of managing]… I don’t know; it seems not to be working.”
For all of the attention placed on performance, goals, and metrics, many leaders haven’t been taught the most modern and effective ways to improve and gauge progress. Some of our common management practices, as taught in business schools or passed down from generation to generation, can actually interfere with improvement. There is a better way.
I see many well-intended leaders doing what they think is best for the organiza-tion and their customers. Or, they’re doing what they think is necessary. But, some of their best efforts and long hours often end up being a waste of time. Leaders and their employees get stressed out; they react; but are they more effective as a result?
Accepting a better way requires first that we recognize problems or shortcom-ings with current management practices.
Another leader told me:
“We have an old-school, command-and-control (if not bullying) cul-ture. Leaders demand better performance and throw goals at people, whether they’re achievable or not. They celebrate when we make a small improvement and come down on us when performance dips.

X I I MEASURES OF SUCCESS
They throw solutions at us instead of helping us develop our improve-ments. We’re trying to shift from a blame-and-shame culture to a data-driven culture.”
I’ve seen too much workplace bullying throughout my career. I’ve seen far too many leaders blaming employees for a system’s poor performance. It’s especially sad to see in healthcare, where the human stakes are so high for everyone involved.
The best efforts of individuals might not be enough to guarantee success for a team or the organization as a whole. We often see great people being defeated by their broken workplace. For example, think of the famous scene from the I Love Lucy show with Lucy and Ethel in the chocolate factory. They’re working hard, and they can’t keep up. A badly designed or managed system defeats good people every time, as they say.
Far too often, leaders at all levels are in the same predicament as Lucy and Ethel. They’re under enormous pressure to improve. They aren’t meeting their targets. Bad results and problems are flying at them faster than they can handle, like chocolates on a conveyor belt. So, everybody is working hard to improve — but the management methods we’ve been taught might not be enough to make a difference.
Thankfully, many organizations are very intentionally trying to move toward more collaborative and participatory management styles. I think this book will help people work together better in the name of improvement.
A different leader said:
“We’re not very good at using data to inform daily decisions and problem solving. We’re trying to build that culture. We need to push daily metrics.”
As we’ll discuss in this book, daily metrics can be more helpful than weekly or monthly metrics. In so many settings, I’ve seen leaders draw poor conclusions about single data points (or two data points). More data points might just mean more overreaction. Again, there is a better way.
I’m fortunate to have learned and used some methods that enable better man-agement decision making. I’m happy I can share them with others. These methods,

PREFACE X I I I
grounded in math and science, help us to be more data driven and to make better decisions that are based on facts instead of opinions, hunches, or feelings. Doing so will reduce the amount of time we spend chasing our tail, if you will, in the name of improvement. We can turn data, metrics, and charts into knowledge, wisdom, action, and better results.
I wouldn’t call this a “statistics book.” I’d consider it to be a “management book” that happens to draw upon a few simple statistical concepts and methods. These methods aren’t complicated; they’re just different. Anyone can use them without a Six Sigma “Belt” or a statistics degree.
Using these methods, we can learn how to distinguish between activity that adds value to the customer and activity that’s wasted motion. Not all motion or effort is useful, even for leaders. We might take pride in being busy, but, a lot of management activity doesn’t lead to progress.
One leader told me:
“Our team meets daily and talks about our metrics. They get better, and then they get worse. Our monthly strategic reviews are the same thing but on a monthly basis. Instead of stating the obvious, such as ‘that measure is better than before,’ can we move to a deeper under-standing of our data that leads to real improvement?”
This book will show you how to draw more timely, more valid conclusions based on your metrics, leading to more focused and effective improvement.
These methods come from a line of legendary thinkers, including the famed management guru W. Edwards Deming, known as “the American who taught the Japanese about quality” after World War II. Deming learned from Walter Shewhart, who invented the “Statistical Process Control” (SPC) methods that Deming built upon to create a broader system of management that included a knowledge of variation, appreciation for a system, psychology, and the theory of knowledge.1
More recently, Donald J. Wheeler, Ph.D. has built upon and spread these methods, including what he dubbed “Process Behavior Charts.”2 He has inspired

X IV MEASURES OF SUCCESS
many, including me, through his seminal book Understanding Variation. I was very fortunate that my father, Bob, had a copy of Dr. Wheeler’s book (along with Deming’s Out of the Crisis) after being a student in classes they taught at General Motors. My browsing of his bookshelf piqued my interest in these topics and opened my eyes to a different way — one that I’ve learned to be a better way. And, I’m extremely honored that Dr. Wheeler wrote the foreword for this book.
Working in many industries has allowed me to test and validate the practical nature of these methods, even if they were not in sync with the organizational cul-ture as a whole. I’m convinced these methods can be impactful, which is why I feel driven to share them through this book and my consulting work.
As Dr. Wheeler says, these management and statistical methods are “a way of thinking, with some tools attached.”3
By reading this book, you’ll learn new methodologies and this new way of thinking. Once you learn to understand variation, it’s impossible to unlearn. You’ll see opportunities to apply these principles every day — in everyday life and your workplace. Hopefully, we can agree that metrics and targets should be used for improvement, not for punishment. I hope this book is helpful. Thanks for reading.
Mark Graban25 JUNE 2018

XV
Acknowledgments and Dedications
Many thanks to my editor, Cheryl Fenske, and my book coach, Cathy Fyock. I’d like to also thank early readers who gave
valuable feedback and helped make this a better book. They include Mike Stoecklein, Shrikant Kalegaonkar, Warren Stokes,
Dan Markovitz, Dan Ackerman, Harvey Leach, and Lewis Lefteroff.
My greatest thanks are due to my loving wife and partner, Amy Gowder Graban. I also thank my parents, Bob and
Marlene Graban, and my in-laws, Charlie and Debbie Gowder. All of them have encouraged my learning and writing over the years. Finally, I’d like to thank the countless number of people who have taken time to teach and mentor me over the years.

XV I I
Introduction
T his book presents a practical, simple method (“Process Behavior Charts”) that separates “signal” from “noise” in our metrics (a.k.a. “performance mea-sures”), so we can learn when and how to evaluate and respond to our met-
rics appropriately over time. By using this method and overreacting less often (or reacting in different ways), we can stop wasting time and start improving more. This will also reduce frustration in the workplace and boost performance through higher morale and increased engagement.
I hope this book will be helpful to many types of readers, including those who will create Process Behavior Charts (including analysts, process improvement spe-cialists, quality department staff, et al.) and those who will primarily consume and use such charts and metrics (including managers, executives, business owners, ven-ture capitalists, and others).
CHAPTER 1 introduces the idea of “what gets measured gets managed” but takes a deeper dive into what “managed” means. Topics in the chapter include choos-ing the right metrics, the danger of arbitrary targets, and the case for why Process Behavior Charts matter: leaders and employees can waste less time “chasing the noise” in a metric, which allows them to spend more time on systematic and sus-tainable improvement.
CHAPTERS 2 AND 3 introduce the Process Behavior Chart method and how to use such charts. Comparisons are drawn to some common existing methods for track-ing metrics and evaluating performance against targets. Why are Process Behavior Charts more effective than two-data-point comparisons, “Bowling Charts,” and the like?
XV I I I MEASURES OF SUCCESS
CHAPTER 4 connects charts and metrics to our goals of improvement and success. The chapter explores methods for turning an unpredictable system into a predict-able system by reacting to signals and, then, how to improve a predictable system in less-reactive ways.
CHAPTER 5 is a narrative description of an exercise that’s effective in learning how to understand variation: “The Red Bead Game” that was made famous by the late, great Dr. W. Edwards Deming. Readers will have a chance to reflect on some of the common management tactics that are generally ineffective in a real workplace.
CHAPTER 6 shows how Process Behavior Charts can be used to dig deeper, beyond statistics found in news headlines. How are comparisons between two data points sometimes misleading? Does the “highest number in X years” mean that there’s a significant shift in our data?
CHAPTER 7 further compares Process Behavior Charts to common management methods and analysis approaches, including linear trend lines, column charts, and more.
CHAPTER 8 comes back to workplace case studies and how we would use Process Behavior Charts to make better management decisions.
CHAPTER 9 explores ideas related to change management and successfully intro-ducing a new method into an organization.
APPENDIX A takes a deeper dive, for those who need it, into the process and method for creating Process Behavior Charts.
The book also includes 10 “Key Points” that will be introduced and revisited, along with three “Core Questions” that we should ask about systems and metrics.

X IX
Summary of Key Points from Measures of Success
KEY POINT #1: We don’t manage the metric; we manage the system that leads to the results, and we lead the people who help us improve the system.
KEY POINT #2: Two data points are not a trend.
KEY POINT #3: “No data have meaning apart from their context.”
KEY POINT #4: A chart will always tell us more than a list of numbers.
KEY POINT #5: The job of management is not just to look backward, but also to look forward and predict, if possible, what is likely to occur.
KEY POINT #6: There is variation in every metric or data set. Process Behavior Charts filter out noise so we can identify signals.
KEY POINT #7: Don’t waste time explaining noise in a metric. There is no simple, single “root cause” for noise.
KEY POINT #8: More timely data are better for improvement. Daily is better than weekly, which is better than monthly, as long as we don’t overre-act to every data point.
KEY POINT #9: If there was an intervention in the system, make it clear in your chart or your discussion of the chart when that change was started or implemented.
KEY POINT #10: When showing the “before” scenario, show enough data points to illustrate the previous level of variation, not just a single data point.

1
C H A P T E R 1
Improving the Way We Improve
M ost organizations are under pressure to perform better. How do we increase sales and production in our family-owned manufacturing com-pany? Can we reduce infection rates in a hospital’s intensive care unit?
Will we get our startup on the growth trajectory that we promised the venture capital firm?
People often feel like they’re on a proverbial performance roller coaster. There are a lot of ups and downs. There’s anticipation, excitement, and some-times yelling — whether from excitement or fear. The emotional roller coaster of metrics and the way leaders react (or overreact) to them can be exhausting. This book is meant to help you get off the performance roller coaster, both stabilizing and systematically improving your results instead of ending up right back where you started.
Leaders might be under pressure to judge performance on a daily (or even hourly) basis. Color coding performance as “red is bad, green is good” can lead to a lot of overreaction, which then wastes the time of managers and their employees. Does any of this help us improve?
In an age of “big data,” we are too often drowning in numbers and informa-tion. Using the methods in this book, we can turn a flood of data into a con-trolled flow of knowledge and insight that allows us to evaluate performance better, focusing our efforts on sustainable improvement instead of knee-jerk reactions. When do our reactions, no matter how well intended, end up hamper-ing improvement?

2 MEASURES OF SUCCESS
The desire (or need) to improve doesn’t mean that an organization knows how to do so. It doesn’t mean leaders know how to look at their performance mea-sures in ways that determine if they are actually improving. Do they know how to look for meaningful changes in performance, or are they guessing or relying on gut feel? Do they use rules of thumb, such as “you must investigate and explain every data point that’s below the target” or “you must find a root cause and give a corrective action plan for every below-average week?”
In an age of “big data,” we might be drowning in numbers and information.
Leaders might ask the following questions:
• Are we reaching our goals or targets?• What do we expect our future performance to be?• How do we know if a change has led to a meaningful improvement?• Can we discover if a system’s performance is degrading before it falls back
into the red?• How often are leaders pressured to make metrics look good instead of
improving the system and its underlying performance?
Some leaders might not ask those questions. Or, they might not know how to answer all of them. This book will help us answer the first four questions. The fifth is something to think about and consider for your own setting.
Measures Matter, but Don’t Forget About ManagingAn expression that’s often shared on social media or in email signatures is:
“What gets measured, gets managed.”
A statement like this emphasizes the importance of measurement, but it’s frustrat-ingly vague about how to manage or improve what is measured. Focusing on “what gets measured” is the reality in modern organizations. Measuring is easy; managing is hard.
Organizations often measure too many things, losing sight that the “K” in the common “KPI” acronym means “Key Performance Indicators,” not “Ka-jillion

CHAPTER 1 : IMPROVING THE WAY WE IMPROVE 3
Performance Indicators.” More measures might mean more work — and possibly more overreaction — instead of more improvement.
When under pressure to improve metrics, leaders and employees will pay attention. They’ll talk about the metrics. They might assign somebody to be responsible for each one. They might form teams. That doesn’t mean they know the best way to manage the metric, and it doesn’t mean they know how to improve the system that generates those results.
Measuring is easy; managing is hard.
Can we measure everything in life (or our workplace) that matters? No, as Deming said:
“The most important figures that one needs for management are unknown or unknowable, but successful management must never-theless take account of them.”4
The reality is that we have to do our best to choose measures that matter (or our boss tells us what to measure) — and then manage those measures in the best (or least dysfunctional) way possible.
What Are the Right Metrics?Leaders are often told what to measure, causing organizational harm and dysfunc-tion. Sometimes, we get the opportunity to choose metrics or have some input. Hopefully, we have metrics that matter instead of things that are easy to measure.
While there is a risk that the methods in this book could be used to “better manage” the wrong metrics, the focus of this book is to best manage and improve the metrics that we have. For a deeper treatment about what metrics to choose and how to set targets, books on the following methodologies could be helpful (see Appendix C):
• Balanced Scorecard• Strategy Deployment• Lean Startup

4 MEASURES OF SUCCESS
A “balanced scorecard” of metrics helps protect against the dysfunctions that can result from focusing too much on any single metric. For example, if cost is the primary metric, managers might be pressured into actions that hurt safety, quality, or other important measures. Think of all of the problems caused by companies that focused solely on growth at any cost.
Strategy deployment (or “hoshin kanri,” in Japanese) is an important compo-nent of the “Lean” management approach.5 Lean organizations in various indus-tries often use a balanced scorecard of metrics such as safety, quality, delivery, cost, and morale. These metrics should be relatable to people at all levels, so they feel like they can initiate improvements that contribute to their local metrics and the success of the organization as a whole.
From “Vanity Metrics” to “Actionable Metrics”The “Lean Startup” movement asks important questions about what to mea-sure. Eric Ries coined the phrase “vanity metrics” to describe our measures that “give the rosiest possible picture.”6 Instead of looking at the things that paint a picture of success, we should look at metrics that are truly our KPIs for our organization.
If we’re using metrics to evaluate the success of an improvement initiative, are we choosing metrics or manipulating them to tell a story of success, no matter what actually happened? Or, are we using metrics honestly to evaluate if we are getting better, getting worse, or if we’re in the awkward in-between state of having a metric that seems to be fluctuating?
Ries suggests we replace vanity metrics with what he calls “actionable metrics,” where “data must demonstrate clear cause and effect and be related to changes” to our product, our services, or our system.7 Otherwise, we’re just randomly trying a bunch of improvements, and that’s no way to run a business.
One classic example of a vanity metric is the number of visitors that come to a website. This number is easily measured, and we would hope to see a trend that increases, always going “up and to the right,” as entrepreneurs often say. But, higher website traffic-numbers might be meaningless if that does not translate

CHAPTER 1 : IMPROVING THE WAY WE IMPROVE 5
into increased sales. What’s easy to measure isn’t always what’s meaningful to our business.
Other examples of vanity metrics might include the number of “Lean Six Sigma Green Belts” we have trained or certified or the number of improvements and projects that are completed. Those are easy to count, but it’s also too easy to lose focus on the measures that matter, such as quality, market share, and profit.
As Ries wrote in his second book, The Startup Way:
“The fact that your site has seen an uptick in visitors doesn’t mean your product is more popular or you’re more successful.”8
KaiNexus, a startup I have worked with, does measure website traffic. But, more important metrics include profit, which is driven by revenue, which is driven by sales, which are converted from qualified leads, that often start as web-site visitors.
If KaiNexus lost sight of the real objective, they could publish really popular “clickbait” type articles that might attract a large audience. Instead, the company’s inbound marketing process is designed to attract people who are likely to pursue buying their type of software.
The Dangers of Arbitrary and Unachievable TargetsWhere we see a metric, we usually see a target. That’s the reality of modern orga-nizations. Leaders spend a lot of time debating whether this year’s target should be something really specific, such as the possibly insignificant difference between 34.17 and 34.634.
As an aside, some people use the words “goal” and “target” interchangeably. In this book, we’ll adopt the other convention that says a goal is a longer-term ideal objective, such as the goal of “zero preventable harm” in a hospital, while a target is shorter term and helps us gauge progress toward the ultimate goal.
I’ve seen too many cases where an organization didn’t hit their target one year, only to then set the same target the next. Or, they’ve optimistically set an even-higher target. The implication in most organizations seems to be, “If we choose

6 MEASURES OF SUCCESS
the right metrics and set challenging targets, then improvement will happen.” If it were only so easy, everybody would be hitting their targets, whether that’s increas-ing sales in a startup or reducing falls in a hospital. This is why Deming would always ask an important and challenging question: “By what method?”9
It’s not enough to set targets and demand better results. Too many people believe that empowerment means setting aggressive targets and then leaving people alone to figure out how to meet them. Collaborating with staff doesn’t mean a leader is micromanaging. Working together to improve our systems and processes will lead to better results.
In the wrong kind of organizational culture, setting arbitrary targets can become very dysfunctional. One of Deming’s famous “14 points for management” reads:
“Eliminate slogans, exhortations, and targets for the workforce asking for zero defects and new levels of productivity. Such exhortations only create adversarial relationships, as the bulk of the causes of low quality and low productivity belong to the system and thus lie beyond the power of the workforce.”10
I’ve worked in the type of culture that Deming warned about. So, I under-stand how an “us versus them” environment creates unbearable stress when leaders demand performance that’s unrealistic and then blame employees for not meeting that impossible standard.
It’s not enough to set targets and demand better results.
There’s a difference between an arbitrary target and one that’s a “law of nature,” a term used by Donald J. Wheeler, Ph.D. to describe a target that has a scientific basis, such as a 60-minute target for the “door-to-needle” time for stroke patients to get treatment. An example of an arbitrary target might be “We need to increase sales by 25% this year.” A target is still arbitrary if it’s based on a competitive benchmark, last year’s performance, or an organizational target that has been passed down from senior leaders.

CHAPTER 1 : IMPROVING THE WAY WE IMPROVE 7
As Brian Joiner wrote in Fourth Generation Management, there are three things that can happen when people are pressured to hit a target without having the proper support and an effective improvement methodology. The first two are dysfunctional and are too often easier than the third, and preferred, alternative:
1. Distort the numbers2. Distort the system3. Improve the system11
We see many examples of this in the news, and we might see them in our own workplaces. In recent years, we’ve seen the CEO of Wells Fargo set an arbi-trary target of “eight is great,” meaning each customer should have eight different accounts. Since the target was unreasonable, thousands of tellers signed customers up for accounts they didn’t need or didn’t know about — and then got fired for being “unethical.” Eventually, the CEO was forced out, into retirement.12
In the United States Veterans Health Administration, local clinic managers were put under pressure to keep waiting times for patients under 14 days. Even though the Congressional Budget Office called the target “unrealistic,” people in dozens of offices created secret waiting lists (a paper waiting list to get on the offi-cial waiting list in the computer) or other such distortions to make results look better than they were. Again, some employees and local managers were fired for what were arguably very systemic problems.13
I recently heard a funny story about a fitness center that asked departing cus-tomers to push one of four buttons that rated their visit as one of the following:
• a very smiley face• a somewhat smiley face• a somewhat frowny face• a very frowny face
The gym’s manager and staff were promised an incentive if a certain number of customers hit the “very smiley” button each month. They might have feared being punished for not hitting that target. What did the employees figure out? They

8 MEASURES OF SUCCESS
learned that they could hit the “very smiley face” button a few times each time they walked nearby, which boosted that metric. Problem solved?
However, it’s possible to have a culture where a meaningful goal or target is shared by all. An organization like that tends to have supportive leaders and a spirit of “we’re all in it together.” Effective managers don’t just set targets; they work together with people to hit those targets.
Paul O’Neill, former CEO of Alcoa, set an audacious goal for an important measure: zero employee harm in their workplaces around the world. Such a goal could have been demoralizing if it seemed impossible, and people feared punish-ment. However, his leadership style made it clear that accountability started with him and that the company would work together toward that ideal, without blam-ing or punishing anyone for not reaching that ideal target. During his tenure as CEO, Alcoa reduced “lost workdays per injury per 100 workers” from 1.86 to 0.2 (a reduction of 89%). After O’Neill’s retirement, thanks to the culture and meth-odologies that he left in place, the rate fell to 0.125 by 2012.14
The Questions We Should Ask About Our NumbersIf an executive tells the VP of sales, “Revenue is 10% below our target this month” or “Sales are down 5%,” it’s easy to say, “That’s bad.” But, is such a compari-son meaningful?
Many organizations limit their analysis of performance to simple comparisons to a goal, target, or budget. Or, a metric is compared to a previous time period or against an average. What does that tell us? Not much — and not enough to improve.
Let’s look at one metric that’s tracked by a health clinic laboratory and medi-cal office team: the percentage of urinalysis test results that have been completed and received prior to the patient’s appointment with their provider.
If we post a single data point on a whiteboard, as illustrated below, it might be obvious that we didn’t meet the target this week. We can only color code data points as bad (red) or good (green). A single data point doesn’t mean we can determine anything about trends, and it doesn’t tell us how to improve.

CHAPTER 1 : IMPROVING THE WAY WE IMPROVE 9
The lab manager might tell the team, “Our percentage dropped from 66% to 49% last week.” What does the context of a second data point tell us? Can we draw solid conclusions about performance trends?
I propose three high-level questions that are helpful, if not necessary, for improvement:
Question 1: Are we achieving our target or goal?Question 2: Are we improving?Question 3: How do we improve?
Hopefully, this book will help you decide that all three questions are import-ant and deserve attention.
To answer Question 1 in this case, we are currently not hitting the target, or at least we did not meet our target in either of the last two weeks. Does this mean we can ever hit the target without taking some drastic action? We can’t answer that question without additional data and the right analysis. If we were currently hitting the target, we still might have interest in reaching even-higher levels of per-formance, which requires answers to our next questions.

10 MEASURES OF SUCCESS
The second data point was lower than the first. Does that mean that it’s going to keep going down, or is the metric fluctuating within some range? We can’t tell how our performance is trending with a simple whiteboard, scoreboard, or dashboard that displays just a data point or two. Question 2 is important since improvement is necessary when we are not meeting our target. Improvement might be desirable even when targets are being met.
Effective managers don’t just set targets; they work together with people to hit those targets.
Having just one or two data points doesn’t help us know where to get started in answering Question 3. Was one of those data points an outlier, or were they both within the typical range? Being able to answer that question helps us know when we should react and investigate with urgency and when we should step back to take a more measured and systematic approach to improvement, as we’ll discuss in Chapter 4. There are times when we’re hitting our target some or most of the time, so we still need to know how to improve.
The methods in this book will help us make better decisions about charts and metrics. We’ll be able to draw better cause-and-effect connections between our improvement efforts and our results. Moreover, we’ll waste less of our valuable time since we’ll stop overreacting to every up and down in the metric.
We’ll be able to answer more specific versions of those three core questions:
Question 1: Are we achieving our target or goal?a. Are we doing so occasionally?b. Are we doing so consistently?
Question 2: Are we improving?a. Can we predict future performance?
Question 3: How do we improve?a. When do we react?b. When do we step back and improve the system?c. How can we prove we’ve improved?

CHAPTER 1 : IMPROVING THE WAY WE IMPROVE 11
The aim of this book is not learning how to create charts for our metrics; it’s about improving performance through these methods and these questions.
We’ll waste less of our valuable time since we’ll stop overreacting to every up and down in the metric.
Measuring and Managing Personal or Organizational HealthLet’s look at a personal measurement (and management) challenge that might sound familiar. Can you represent and measure your health with a single metric? Probably not. Let’s say “fitness” is your high-level objective. That’s difficult to measure directly, and it’s not a single number. We might decide that weight is more easily measured, and we have a hypothesis that says lower weight equals better fitness, which would then lead to better health, better quality of life, and a longer life.
Others might choose a handful of what we could call “process metrics” that include weight, body-fat percentage, blood pressure, and total cholesterol. Others might choose different metrics that are more relevant to their own health, conditions, and risks. A balanced scorecard that represents one’s health can pre-vent the dysfunctions that can result from focusing too much on any one metric.
For each metric, we (or a doctor) would typically set a target. If there is a gap between our current performance and the target, we work to close that gap through various forms of improvement activity. Hopefully, we are going about that in a systematic way instead of randomly trying different solutions or quick fixes.
Weight is just a number. I don’t manage the number; I do what I can to manage the system (including diet and exercise) that leads to the number (results). There are also factors that I can’t control, such as genetics or environmental factors.
The word “results” should remind us that any metric is the result of some work, process, or system. In a workplace, our “process measures,” such as the number of new marketing contacts generated each day in sales, should lead to a “results mea-sure” of new customers, revenue, or profit. This brings us to our first key point:

12 MEASURES OF SUCCESS
KEY POINT #1: We don’t manage the metric; we manage the system that leads to the results, and we lead
the people who help us improve the system.
As I’ve learned, working out three times a week with a trainer might lead to a net weight gain that occurs as the result of losing fat and adding muscle. One might be troubled if our high-level aim was defined only as weight. But, somebody aiming for fitness or health as an objective might readily accept a higher weight, especially when one’s pants fit better and the heart is performing more efficiently.
A few years back, my weight approached 200 pounds for the first time. I iden-tified a gap between my current weight and a target of 185 pounds (it was admit-tedly arbitrary and not based on science). Measurement was important, but I also learned not to overreact to every small fluctuation in my weight. I learned to weigh myself at a consistent time each day to eliminate the effect of how weight naturally fluctuates during the day. I improved my own personal system (exercising more and using an app to track calories) and reached my target over a few months.
I learned to look at my weight as a range of numbers that naturally fluctuates a bit from day to day instead of thinking of it as a single number that always had to remain the same. Small fluctuations didn’t cause alarm, but larger changes would ideally draw more attention (and analysis of how my diet or exercise had changed).
It can be difficult to sustain an improved system. Case in point, my weight over time has crept back up to 200 pounds for a variety of reasons. The answer to why my weight increased again can’t be answered by asking, “What went wrong yesterday (or last week)?” It’s more related to patterns and changes in behavior over time. Maybe I can blame aging and metabolism.
I’ve demonstrated that I know how to lose weight. Why didn’t I take correc-tive action when my weight went up to 190? Why am I reacting again only now that I’m back at 200? I had stopped measuring my weight, perhaps due to being on the road too much and then being in denial about my weight creeping back up. Choosing not to look at a metric isn’t a good strategy for improvement.
If managing one’s own personal system is difficult, think of how much more challenging this is in an organization — not just improving performance but also

CHAPTER 1 : IMPROVING THE WAY WE IMPROVE 13
sustaining the gains. How often do we let an organizational metric get really bad before we respond and ask questions about improvement? How can we manage more effectively?
Reducing Waste Through “Lean”Time is a precious commodity. Leaders, including startup founders, nurse manag-ers, and plant managers, all have to make constant choices about how to allocate their limited time and attention. Urgent (but hopefully proverbial) fires pop up regularly, data gets thrown at us, and we’re expected to respond. You might be told, “Don’t just sit there — do something!”
How often do our choices about when and how to react end up consuming more of our time, to little real benefit? Does a series of non-stop reactive, knee-jerk responses to changes in performance metrics help us reach our goals?
I’ve spent almost 25 years studying and practicing the “Lean” management methodology. Toyota is considered the originator of Lean, but these methods and mindsets are being used in healthcare and many other workplaces. Toyota has long emphasized that we should reduce the “waste of motion,” as one of the “eight types of waste.”15 With Lean, we aim to improve efficiency and flow by reducing waste, interruptions, defects, and delays, instead of focusing on doing the actual work more quickly. We can do more with less without overburdening people.
This applies to factory workers, nurses, and other frontline employees in any workplace. We can also reduce waste in knowledge work. Wasted motion can occur even when we’re sitting in a chair, thinking, typing, or moving our mouse. The idea also applies to leaders. Meetings are held, lines are drawn on charts, data points are circled, solutions are offered. But, how often does this activity turn out to be a different type of waste? This management waste might be more difficult to see than the waste in physical work, but it also might be more damaging to an organization.
Ries wrote, in The Lean Startup, about how wasteful it is to have software developers spend years working on software that doesn’t get purchased by custom-ers after it’s finally released. He asked a very important question at the end of the book, something that’s both a matter of respect and organizational performance:

14 MEASURES OF SUCCESS
“If we stopped wasting people’s time, what would they do with it?”16
That time can be better used for more productive activities that better serve our customers and lead to more success for ourselves and our organizations.
We can do more with less without overburdening people.
The methods in this book will help you save time by teaching you when and how to react (or not react) to changes in metrics, allowing you to focus your efforts on important and necessary improvement activity.
How Do We Manage Our Metrics?For my consulting company, is the number of visitors to my blog a vanity metric, particularly since I don’t make much money from advertising or other revenue streams that correlate directly to more people reading my blog?
Metrics that are more important for my business include the number of new consulting or speaking clients. Higher blog traffic might help further that goal. I can’t prove, statistically, that months with higher blog traffic result in more speak-ing and consulting work. That might be a function of the quality of my posts (or other factors that are in or out of my control).
Assuming blog traffic does matter, how would I go about best managing that metric? When we look at metrics the wrong way, it’s too easy to draw an incorrect conclusion, one that leads to an unrealistic view of our current situation. Or, it’s often too easy to intentionally distort or cherry pick numbers to tell the story we want to tell.
In the case of website metrics, we could modify the Ries quote to say some-thing slightly different but still important:
“The fact that your site has seen an uptick in visitors this week doesn’t mean your website is getting more visitors consistently over time.”
CHAPTER 1 : IMPROVING THE WAY WE IMPROVE 15
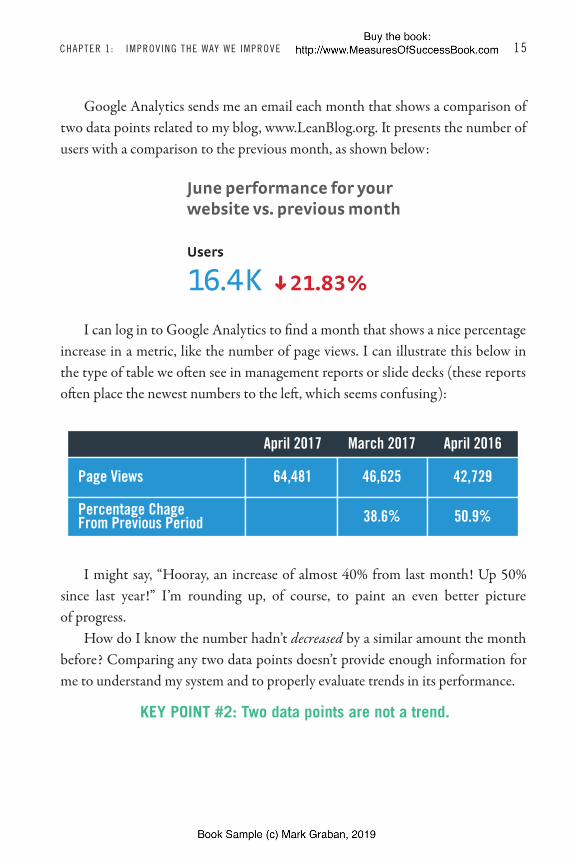
Google Analytics sends me an email each month that shows a comparison of two data points related to my blog, www.LeanBlog.org. It presents the number of users with a comparison to the previous month, as shown below:
June performance for yourwebsite vs. previous month
1 6 .4K 21.83%
Users
I can log in to Google Analytics to find a month that shows a nice percentage increase in a metric, like the number of page views. I can illustrate this below in the type of table we often see in management reports or slide decks (these reports often place the newest numbers to the left, which seems confusing):
April 2017
Page Views
Percentage ChageFrom Previous Period
April 2016March 2017
64,481 46,625
38.6% 50.9%
42,729
I might say, “Hooray, an increase of almost 40% from last month! Up 50% since last year!” I’m rounding up, of course, to paint an even better picture of progress.
How do I know the number hadn’t decreased by a similar amount the month before? Comparing any two data points doesn’t provide enough information for me to understand my system and to properly evaluate trends in its performance.
KEY POINT #2: Two data points are not a trend.

16 MEASURES OF SUCCESS
Thankfully, I don’t have investors or an executive whom I’m trying to con-vince that 40% improvement is going to happen every month. I’d only be fooling myself to think so, and doing that doesn’t help improve my business. Ries always warns against creating “success theater.”
One form of “success theater” is using or displaying metrics in a way that makes performance look better than it is. As Ries wrote, “Energy invested in suc-cess theater is energy that could have been used to build a sustainable business.”17 Another form of success theater would be unethical tactics that artificially boost the number of page loads (an example of the distortions that Joiner warned about).
“The fact that your site has seen an uptick in visitors this week doesn’t mean your website is getting more visitors consistently.”
After the 38.6% increase in April, the May traffic number shows a 38.7% decline from the month before:
May 2017
Page Views
Percentage ChageFrom Previous Period
May 2016April 2017
39,517 64,481
-38.7% -1.3%
40,039
Well, so much for that trend I might have hoped for. My blog traffic came back down to earth or regressed to the mean, perhaps. I could emphasize that the drop from May 2016 was very small.
These numbers tell me something (but not much) about the past. What could I expect to see for blog traffic in the future? Can I better understand past perfor-mance in a way that predicts future performance? Yes, by using a “Process Behavior Chart,” which will be introduced in the next chapter.
Comparing two data points means we are missing a lot of context, including the other months’ data and the trends we might see by looking at more data.
As Wheeler wrote in Understanding Variation:

CHAPTER 1 : IMPROVING THE WAY WE IMPROVE 17
KEY POINT #3: “No data have meaning apart from their context.”18
If comparing two numbers isn’t very helpful, organizations often try to pro-vide additional context by displaying tables with many numbers on bulletin boards or electronic dashboards.
It’s very difficult for people to see trends in a table of numbers, the way some of my blog data is shown below. This style of presenting a metric over time is some-times called a “scorecard.” Or, it’s often referred to as a “Bowling Chart” because it’s like the grid you’d use to keep score when going bowling, with numbers going from left to right.
Jan-16 Feb-16 Mar-16 Apr-16 May-16 Jun-16 Jul-16 Aug-16 Sep-16 Oct-16 Nov-16 Dec-16
48074 43519 42518 42749 40039 37336 30454 37670 35860 36817 37919 32542
Jan-17 Feb-17 Mar-17 Apr-17 May-17 Jun-17 Jul-17 Aug-17 Sep-17 Oct-17 Nov-17 Dec-17
50241 45044 44493 60373 37152 29048 29361 30899 30532 34912 31796 24222
Is my blog traffic increasing or decreasing? It’s hard to tell. The best we can usu-ally do is to compare a point to the previous year or to the same month in the pre-vious year. We might look at the first few data points and the last few — but there’s a risk that we might draw the wrong conclusion from this visualization of the data.
Sometimes, these Bowling Charts have color coding that compares each month’s data point to a target, as shown below. Data points that are better than a target are shaded green, while months that miss the target are shaded red.
True North Pillar Metric Desired Direction Jan-16 Feb-16 Mar-16 Apr-16 May-16 Jun-16 Jul-16 Aug-16 Sep-16 Oct-16 Nov-16 Dec-16
Quality & Safety Falls with Severe Injury DOWN Actual 0 1 0 0 1 0 0 0 0
Target 0 0 0 0 0 0 0 0 0 0 0 0
Quality & Safety CLABSI DOWN Actual 0 0 1 0 0 1 2 0 0
Target 0 0 0 0 0 0 0 0 0 0 0 0
Quality & Safety CAUTI DOWN Actual 1 0 0 0 0 0 0 1 1
Target 0 0 0 0 0 0 0 0 0 0 0 0
Team Engagement Necessary Information Available Survey UP Actual 67.3% 50.8% 48.3% 70.4% 46.9% 40.6% 61.3% 70.5% 50.9%
Target 80.0% 80.0% 80.0% 80.0% 80.0% 80.0% 80.0% 80.0% 80.0% 80.0% 80.0% 80.0%
Patient Experience Likelihood to recommend UP Actual 76.4% 78.4% 80.5% 70.0% 46.0% 40.0% 60.0% 70.0% 50.0%
Target 79.9% 79.9% 79.9% 79.9% 79.9% 79.9% 79.9% 79.9% 79.9% 79.9% 79.9% 79.9%
Patient Experience Hospital rating UP Actual 76.4% 77.7% 77.6% 77.6% 77.2% 77.6% 77.0% 75.0% 63.0%
Target 77.5% 77.5% 77.5% 77.5% 77.5% 77.5% 77.5% 77.5% 77.5% 77.5% 77.5% 77.5%

18 MEASURES OF SUCCESS
A red/green Bowling Chart answers Question 1: “Are we meeting our targets?” We might try to answer Questions 1a and 1b, “Are we meeting our targets occa-sionally or consistently?” by counting the number of green and red boxes.
The Bowling Chart doesn’t easily answer Question 2: “Are we improving?” We might vaguely determine we’re getting better if we see more red to the left of the chart and more green to the right. But how can we tell if those changes are significant and sustainable? How can we predict future performance?
Additionally, this binary good-or-bad analysis does not help us answer Questions 3a and 3c about “When do we react?” and “How will we know if we improve?” Which, if any, of those red numbers represent something worth react-ing to?
When presented with a Bowling Chart with a large number of metrics, the red and green color coding doesn’t help us prioritize our investigation and improve-ment efforts. What if six of our 10 metrics are red right now? Does each of those merit the same response? Which metric has the biggest gap between target and actual? Does a metric going from green to red over time mean that anything has changed in the underlying system?
What if all 10 metrics on the scorecard are green? Does that mean we have unchallenging targets? Does “all green” mean there’s no need for problem solving or improvement? Does a metric remaining green mean that nothing has changed or that nothing is degrading in the process? We’ll come back to these questions in Chapter 4.
Graphs Are More Helpful Than NumbersA graph or a chart is a much more effective way of making sense of data and met-rics. A chart is pictorial, and our human brain processes images much better than lists of numbers. Watch a cable business channel and you’ll see they usually show a graph of a company’s stock performance over time instead of a table of num-bers showing the stock price on different days. Unfortunately, their scroll at the bottom of the screen shows a constant stream of two-data-point comparisons of a stock’s price compared to yesterday.

CHAPTER 1 : IMPROVING THE WAY WE IMPROVE 19
Th ere’s no technological excuse for bombarding people with tables of numbers instead of presenting a chart. Charts are easy to produce with modern technology. We can even use very old “technology” to draw them by hand. Th e Bowling Chart shown above could be replaced with six graphs that would give much more infor-mation about trends to the consumer of that data. Six graphs would take up more space on a bulletin board but would help a leader and their team save time and improve more.
When given two data points, such as “blog traffi c is higher this month,” draw-ing a Run Chart to visualize that limited data set isn’t very helpful, either, as we see below:
Run Chart (LeanBlog.org Page Loads)
70,000
60,000
50,000
40,000
30,000
20,000
10,000
-
Jan-16
Feb-16
Mar-16
Apr-16
May
-16
Jun-16
Jul-16
Aug-16
Sep-16
Oct-16
Nov
-16
Dec-16
Jan-17
Feb-17
Mar-17
Apr-17
May
-17
Jun-17
Jul-17
Aug-17
Sep-17
Oct-17
We’re missing important context that tells us if the diff erence between those numbers is routine or exceptional. How much do the numbers normally change from month to month? All we know from this treatment of the data is that the April 2017 number is higher than it was in March 2017.
Even saying that April is 39% higher than March doesn’t provide much con-text, since we don’t know if it normally fl uctuates that much month to month. It’s possible that a large percentage change is not statistically signifi cant; it’s also con-ceivable that a small percentage change would be signifi cant in a diff erent metric and situation.

20 MEASURES OF SUCCESS
KEY POI N T #4: A chart will always tell us more than a list of numbers.
A Run C hart tells us much more than two numbers or a table of many num-bers, as seen below:
Run Chart (LeanBlog.org Page Loads) 70,000
60,000
50,000
40,000
30,000
20,000
10,000
-
Jan-16
Feb-16
Mar-16
Apr-16
May
-16
Jun-16
Jul-16
Aug-16
Sep-16
Oct-16
Nov
-16
Dec-16
Jan-17
Feb-17
Mar-17
Apr-17
May
-17
Jun-17
Jul-17
Aug-17
Sep-17
Oct-17
As you learn and practice this methodology, I hope you’ll challenge others when they present two data points or a simple before-and-aft er comparison. You can ask them to “plot the dots,” as some professionals from the National Health Service in England say, using the Twitter hashtag #plotthedots.19
What do you see? What does the chart tell you?Th e Run Chart tells the honest story that my blog traffi c fl uctuates from
month to month. Th e Bowling Chart tries to tell us the same thing, but it’s much easier to hear what Deming and Wheeler call “the voice of the process” when we allow a chart to speak to us.
Alternatively, the “voice of the customer” tells us what is required, such as a specifi cation or target. We hope the voice of the process tells us that our system is capable of meeting those needs all of the time. If not, we need to improve.
“It’s muc h easier to hear the voice of the process when we allow a chart to speak to us.”

CHAPTER 1 : IMPROVING THE WAY WE IMPROVE 21
Th inking back to the whiteboard and the urinalysis metric from earlier in this chapter, a Run Chart conveys much more context and information:
Run Chart (% UAs Completed Before Appt)100%
90%
80%
70%
60%
50%
40%
30%
20%
10%
0%
Goal = 100%
Target = 75%
6/5/17
6/12
/17
6/19
/17
6/26
/17
7/3/17
7/10
/17
7/17
/17
7/24
/17
7/31
/17
8/7/17
8/14
/17
8/21
/17
8/28
/17
9/4/17
9/11
/17
9/18
/17
9/25
/17
10/2/17
10/9/17
10/16/17
10/23/17
10/30/17
11/6/17
11/13/17
Th e chart shows the target and 12 weeks of data. We can answer Question 1 a little better now. It appears we have never reached our target, and it seems unlikely to happen unless we can improve the system that produces those results. We can try to answer Question 2 by saying that the metric seems to be fl uctuating — some weeks are better than others. Does this chart help us answer Question 3 about how to react and improve? Not really.
Th e same system, with the same people doing the same work in the same situ-ation, will not always produce the exact same results each day, each week, or each month. Th is is a fact of life — there’s always variation in a metric. Th is was true in my blog traffi c, and it was true in the urinalysis example. As Deming said, “Life is variation.”20

22 MEASURES OF SUCCESS
The question we will answer soon is “How much variation is routine and to be expected in this particular situation?” If we discover that the variation in our metric is about the same over time and it’s centered around a stable average, we then have a performance measure that allows us to predict future performance. The Process Behavior Chart methodology, to be introduced in the next chapter, helps us answer our three core questions in a way that Bowling Charts and Run Charts cannot.
KEY POINT #5: The job of management is not just to look backward but also to look forward and predict, if possible, what is likely to occur.
Metrics are most often used to look backward and to make evaluations about past performance. But, we also need to prepare for the future of our organization and its performance.
As the late MIT professor Myron Tribus said:
“Managing a company by means of the monthly report is like trying to drive a car by watching the yellow line in the rear-view mirror.”21
Glancing back at the Run Chart for my blog traffic data, it looks like the April data point is indeed a significant increase from the previous months. Before April, the metric seemed to be fluctuating around an average. Is this April increase something exceptional? Does it deserve our attention or an investigation? Do we have to guess? How would we know? As you will see in Chapter 2, the Process Behavior Chart points the way.
Summary of Key Points Introduced So Far:
KEY POINT #1: We don’t manage the metric; we manage the system that leads to the results, and we lead the people who help us improve the system.
KEY POINT #2: Two data points are not a trend.
KEY POINT #3: “No data have meaning apart from their context.”

CHAPTER 1 : IMPROVING THE WAY WE IMPROVE 23
KEY POINT #4: A chart will always tell us more than a list of numbers.
KEY POINT #5: The job of management is not just to look backward, but also to look forward and predict, if possible, what is likely to occur.
Three Core Questions:Question 1: Are we achieving our target or goal?
a. Are we doing so occasionally?b. Are we doing so consistently?
Question 2: Are we improving?a. Can we predict future performance?
Question 3: How do we improve?a. When do we react?b. When do we step back and improve the system?c. How can we prove we’ve improved?

25
C H A P T E R 2
Using Process Behavior Charts for Metrics
As we saw in Chapter 1, Run Charts tell us much more than a single data point, a comparison description, or a table of numbers. The Process Behavior Chart (PBC) methodology is even more helpful since it provides a way to answer
our core questions about performance and improvement. The PBC method not only tells us if we’re meeting our goals or targets (Question 1), it also helps us say, based on three simple rules, if our metric is improving, getting worse, or just fluc-tuating (Question 2). The chart and these rules can tell us when to react and when to step back and look at improving the underlying process (Question 3).
The PBC tells us when the system that produces our metric has changed, for the better or the worse. It won’t tell us why it changed, but the PBC tells us when to go investigate. The PBC method will focus our efforts, saving some of our valu-able time by helping us learn when not to react, using our valuable time, instead, for systematic improvement.
A Process Behavior Chart is a form of what’s more generally called a “Control Chart” or a “Statistical Process Control (SPC) Chart.” It’s also sometimes called an “Individuals Control Chart with a Moving Range.” That’s a mouthful.
Wheeler coined the Process Behavior Chart term, suggesting that the word “control,” while intended to have a benign connotation, nevertheless has “baggage” associated with it.22 Another argument for “Process Behavior Chart” is that it’s a more accurate descriptive phrase, as the chart, well, explains the behavior of the process.
A PBC is a pairing of two specialized and related Run Charts.

26 MEASURES OF SUCCESS
The first, called the “X Chart” (or “Individuals Chart”), contains the data points from a metric. The second, the “Moving Range Chart” (or “MR Chart”), shows us the amount of point-to-point variation between each data point on the X Chart, information that is useful in a different way. The charts are designed to be used together, but using the X Chart alone can still help us greatly, and it sim-plifies the approach.
Our main focus, for now, is learning how to interpret PBCs that have already been created, as that’s what most leaders will do. The charts might be created by analysts or improvement specialists (and Appendix A is there for them). Leaders at all levels can use this methodology to make better decisions, to save time by not reacting to every up and down in a metric and use that saved time to improve more effectively.
The X ChartWe create an X Chart by plotting our metric as we would on a Run Chart. We then also perform some simple calculations that allow us to add three very helpful horizontal lines that help us interpret the chart:
• A “Central Line” (typically the average)• An “Upper Natural Process Limit”• A “Lower Natural Process Limit”
The Natural Process Limits are the guardrails that tell us where a predictable metric is going to fluctuate over time — unless the system changes.
Below is an X Chart for a period of about six weeks in 2016, after my initial weight loss, when my weight fluctuated around an average. My target weight was 185, which is shown as the dashed blue line:
Leaders at all levels can use this methodology to make better decisions, to save time by not reacting to every up and down in a
metric and use that saved time to improve more effectively.

CHAPTER 2 : US ING PROCESS BEHAVIOR CHARTS FOR METRICS 27
X Chart (Weight)188
187
186
185
184
183
182
181
180
5/27
/16
5/28
/16
5/29
/16
5/30
/16
5/31
/16
6/1/16
6/2/16
6/3/16
6/4/16
6/5/16
6/6/16
6/7/16
6/8/16
6/9/16
6/10
/16
6/11
/16
6/12
/16
6/13
/16
6/14
/16
6/15
/16
6/16
/16
6/17
/16
6/18
/16
6/19
/16
6/20
/16
6/21
/16
6/22
/16
6/23
/16
6/24
/16
6/25
/16
6/26
/16
6/27
/16
6/28
/16
6/29
/16
6/30
/16
7/1/16
7/2/16
7/3/16
7/4/16
7/5/16
Upper Natural Process Limit
Lower Natural Process Limit
Average
Target = 185
Th e X Chart calculations use a a baseline of historical data, ideally 20 data points (or as few as six data points to create temporary limits to start). In Appendix A, you can fi nd the detailed methodology for these calculations. Aft er this baseline is created, future data points are evaluated against the initial average and limits.
It should be emphasized that the Natural Process Limits are calculated. Th ey are not chosen by the creator of the chart. Th e limits should not be confused with any management targets for the metric or specifi cations that come from a customer.
We’ll soon learn how the baseline PBC tells us if our system is “predictable” or not, using that term in a very specifi c way. If the PBC is a predictable system, the PBC makes useful predictions about future performance, answering Question 2a, something that Bowling or Run Charts cannot do. A predictable metric tends to remain predictable, unless something changes signifi cantly in the system. In a pre-dictable system, we’d expect future performance to fl uctuate within the range of the Natural Process Limits, usually spending roughly equal time on both sides of the average.

235
About the Author
M ark Graban is an internationally recognized consultant, published author, professional speaker, and blogger.
He builds upon a deep education in engineering and management, with practical experience working with executives and frontline employees in multiple industries to synthesize and practice methods, including Lean manage-ment, continuous improvement, statistical methods, and people-centered leader-ship approaches.
Mark’s goal is to help others learn how to improve and sustain performance. In his healthcare work, this means improving the quality of care and patient safety, while also reducing cost and improving the workplace experience. Across multiple sectors, he focuses on improving the customer (or patient) experience, to help the
236 MEASURES OF SUCCESS
development of leaders and employees, and to build stronger, more adaptive orga-nizations for the long term.
He has learned, practiced, and taught these methodologies in settings includ-ing manufacturing, healthcare, and technology startups. Working independently since 2010, and in partnership with other consulting groups, Mark enjoys work-ing with organizations that are looking for better ways to improve, with leaders who are willing to lead that charge.
Mark is also a Senior Advisor for healthcare clients with the firm Value Capture. He works as a Senior Advisor to the technology and software com-pany KaiNexus.
Mark earned a Bachelor of Science in Industrial Engineering from Northwestern University as well as a Master of Science in Mechanical Engineering and an MBA as a Fellow in the MIT Sloan Leaders for Global Operations Program.
To learn more, you can visit Mark’s website at www.markgraban.com.
Please Share Your Feedback and ThoughtsIf you have any feedback, please email me any time at [email protected]. Feel free to schedule a phone call or web meeting with me (www.MarkGraban.com/cal) to discuss the topics in this book and your implementation efforts.
Finally, if you like the book, please tell others and write a review on Amazon.com. Anything you can do to help promote the ideas in this book would be much appreciated, whether that’s sharing on social media (mainly LinkedIn) or through professional groups or societies in which you participate.
Thanks!Mark [email protected]