measurements of thermo-mechanical … of thermo-mechanical characteristics of pems for failure...
TRANSCRIPT

Measurements of Thermo-Mechanical Characteristics of PEMs for Failure Analysis and Reliability
Evaluation
Measurements of Thermo-Mechanical Characteristics of PEMs for Failure Analysis and Reliability
EvaluationAlexander Teverovsky
QSS Group, Inc.\Goddard [email protected]
Ashok SharmaNASA/GSFC
iMAPS’04 2
PurposePurpose
Review the effect of TM characteristics of MC in PEMs, in particular Tg, on environmental reliability stress testing (HAST and HTSL).Demonstrate the value of TMA for reliability evaluation and failure analysis of plastic encapsulated devices.
Review the effect of TM characteristics of MC in PEMs, in particular Tg, on environmental reliability stress testing (HAST and HTSL).Demonstrate the value of TMA for reliability evaluation and failure analysis of plastic encapsulated devices.
iMAPS’04 3
OutlineOutline
What is Tg and how it can be measured?Typical Tg values and temperatures for reliability testing of PEMs.How Tg might affect reliability stress testing:• HAST• HTSL
Application of TMA for evaluation and FA:• Pop-corning effect in Ta capacitors;• Delaminations after HAST;• Wire bond failures in parts with silicone die
coating.
iMAPS’04 4
Measurements of the Glass Transition Temperature
Measurements of the Glass Transition Temperature
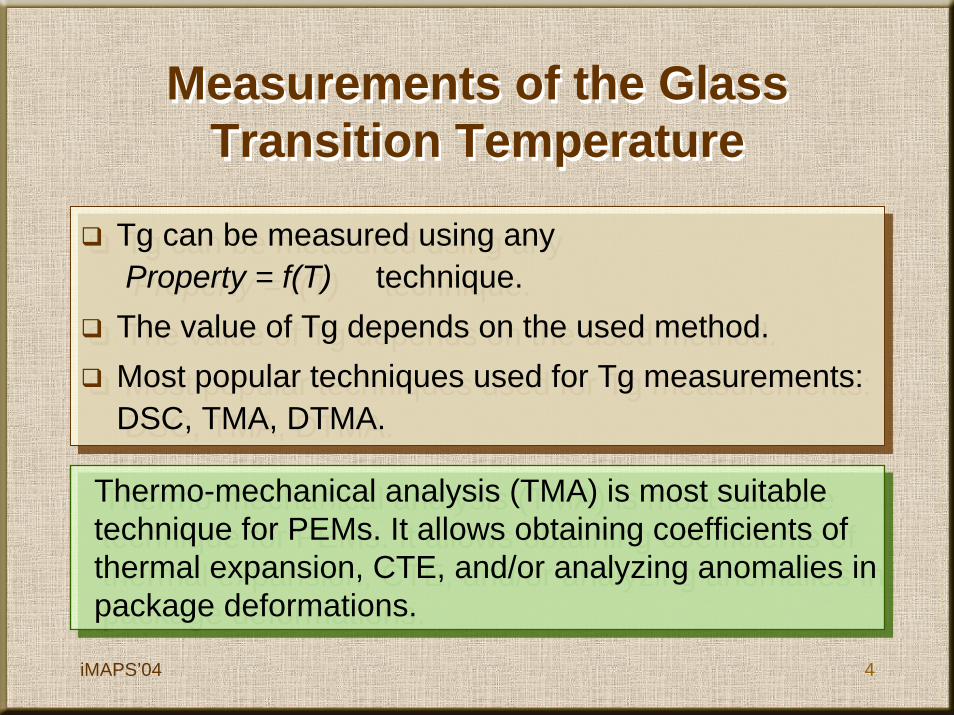
Tg can be measured using anyProperty = f(T) technique.The value of Tg depends on the used method.Most popular techniques used for Tg measurements: DSC, TMA, DTMA.
Tg can be measured using anyProperty = f(T) technique.The value of Tg depends on the used method.Most popular techniques used for Tg measurements: DSC, TMA, DTMA.
Thermo-mechanical analysis (TMA) is most suitable technique for PEMs. It allows obtaining coefficients of thermal expansion, CTE, and/or analyzing anomalies in package deformations.
Thermo-mechanical analysis (TMA) is most suitable technique for PEMs. It allows obtaining coefficients of thermal expansion, CTE, and/or analyzing anomalies in package deformations.
iMAPS’04 5
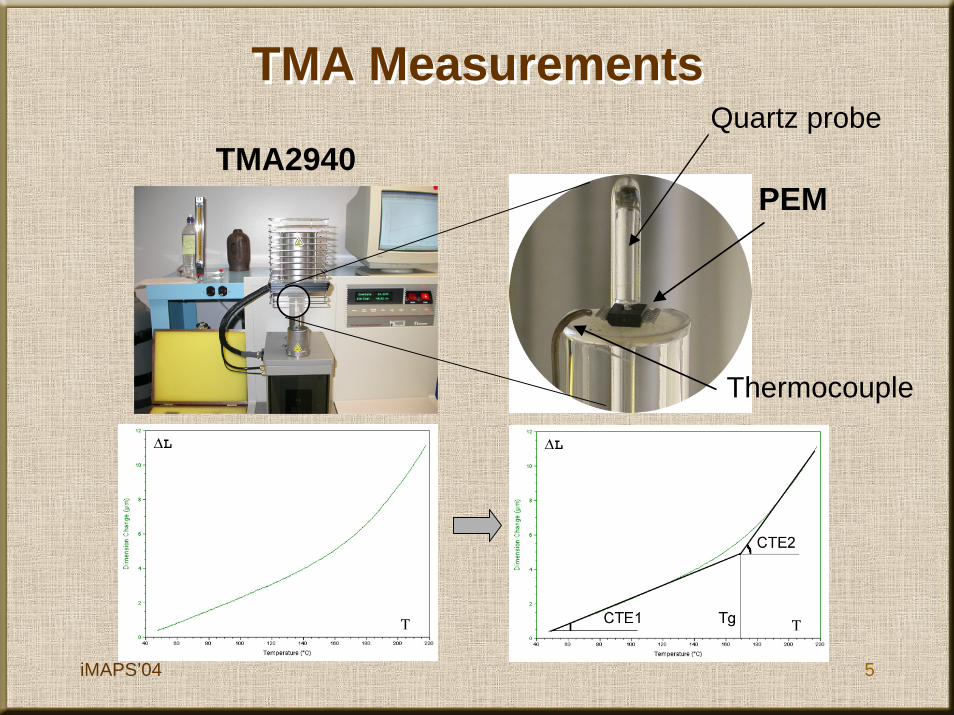
TMA MeasurementsTMA Measurements
TMA2940PEM
Quartz probe
Thermocouple
iMAPS’04 6
Typical Screening and Qualification Tests for High-Reliability ApplicationsTypical Screening and Qualification
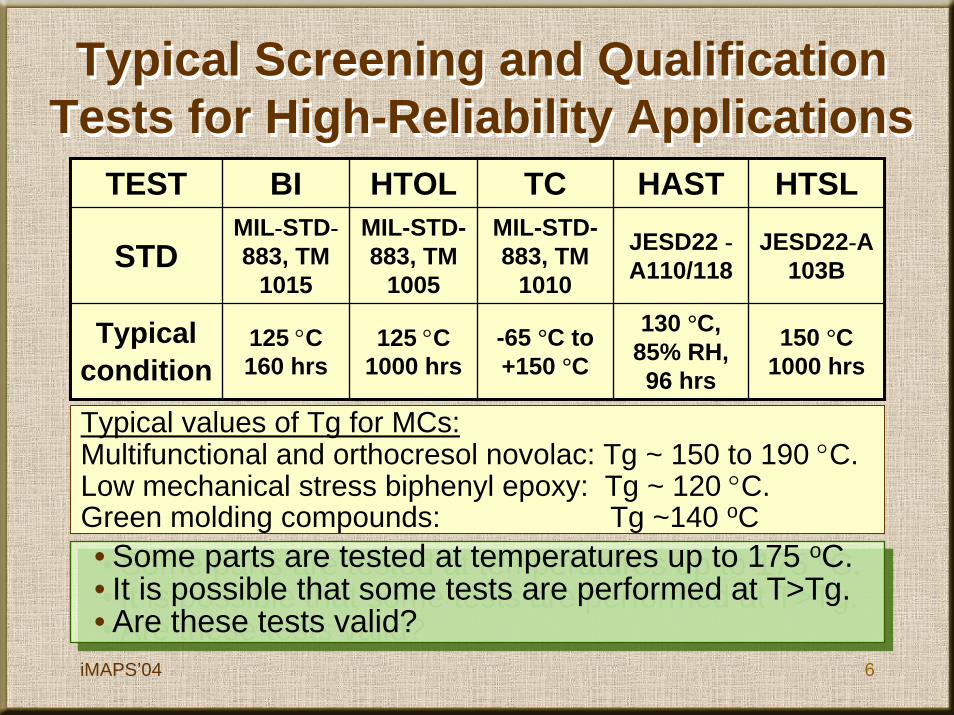
Tests for High-Reliability ApplicationsTEST BI HTOL TC HAST HTSL
STDMIL-STD-883, TM
1015
MIL-STD-883, TM
1005
MIL-STD-883, TM
1010
JESD22 -A110/118
JESD22-A103B
Typical condition
125 °C 160 hrs
125 °C 1000 hrs
-65 °C to +150 °C
130 °C, 85% RH, 96 hrs
150 °C 1000 hrs
Typical values of Tg for MCs:Multifunctional and orthocresol novolac: Tg ~ 150 to 190 °C.Low mechanical stress biphenyl epoxy: Tg ~ 120 °C. Green molding compounds: Tg ~140 oC
• Some parts are tested at temperatures up to 175 oC.• It is possible that some tests are performed at T>Tg.• Are these tests valid?
• Some parts are tested at temperatures up to 175 oC.• It is possible that some tests are performed at T>Tg.• Are these tests valid?

iMAPS’04 7
Does Thermal Stability of MC Depend on Tg?
Does Thermal Stability of MC Depend on Tg?
TGA for MC with different TgTGA for MC with different Tg TGA measurements of MCs with different Tgshowed that materials with Tg ~135 oC had higher stability compared to MC with Tg ~ 175 oC.The most thermally stable polymers, silicone rubbers and Teflon, have extremely low Tg of-20 to -120 oC for the rubbers and -90 oC for Teflon.
TGA measurements of MCs with different Tgshowed that materials with Tg ~135 oC had higher stability compared to MC with Tg ~ 175 oC.The most thermally stable polymers, silicone rubbers and Teflon, have extremely low Tg of-20 to -120 oC for the rubbers and -90 oC for Teflon.
90
92
94
96
98
100
300 400 500 600temperature, oC
wei
ght,
%
170 C138 C173 C174 C133 CTg~173 oC
Tg~135 oC
Tg is not an indicator of thermal stability of MC
Tg is not an indicator of thermal stability of MC

iMAPS’04 8
HAST: Mechanisms of Tg EffectHAST: Mechanisms of Tg Effect
Compression caused by the shrinkage of encapsulantprevents water needed for corrosion from accumulating at the bond pad surface. At T>Tg, the probability of delaminations increases.Mechanical stresses in the presence of moisture:
Compression caused by the shrinkage of encapsulantprevents water needed for corrosion from accumulating at the bond pad surface. At T>Tg, the probability of delaminations increases.Mechanical stresses in the presence of moisture:
[ ]δαασ ×−−×−×∝ CMETTgE SiMC )()(
Moisture swelling might have an effect equivalent to temperature increase on 50 to 70 oC.
Moisture swelling might have an effect equivalent to temperature increase on 50 to 70 oC.

iMAPS’04 9
HAST: Test ResultsHAST: Test Results24 part types encapsulated in different plastic packages (mostly linear devices) were tested in a HAST chamber.Test conditions:130 oC, 85% RH, 250 hrs under bias.Sample size: 30 pcs.
24 part types encapsulated in different plastic packages (mostly linear devices) were tested in a HAST chamber.Test conditions:130 oC, 85% RH, 250 hrs under bias.Sample size: 30 pcs.
HAST failures for differentPEMs vs. Tg of MCs
HAST failures for differentPEMs vs. Tg of MCs
020406080
100
120 130 140 150 160 170 180
Tg, oC
HA
ST fa
ilure
s, %
• No correlation between Tg and HAST failures.• Tg is not the major factor; however, it might affect test
results.
• No correlation between Tg and HAST failures.• Tg is not the major factor; however, it might affect test
results.

iMAPS’04 10
HAST: FA ResultsHAST: FA Results
SOIC16 SSOP28 TO220
•Excessive delaminations after HAST is a common effect in PEMs.
•The probability of delaminations might depend on Tg.•Delaminations might introduce new failure mechanisms.
•Excessive delaminations after HAST is a common effect in PEMs.
•The probability of delaminations might depend on Tg.•Delaminations might introduce new failure mechanisms.
Acoustic microscopy of parts before (left) and after (right) HAST at 130 oC/85% RH/96 hrs.

iMAPS’04 11
HTSL: WB Degradation, Mechanism IHTSL: WB Degradation, Mechanism I
Au/Al WB degradation limits reliability of PEMs at high temperatures.Degradation mechanism involves:• release of chemically active molecules from
MC; • diffusion of the molecules to bonds;• chemical reaction with the Al/Au intermetallic
(dry corrosion).If diffusion limits the process, then exceedingTg might accelerate transport of the corrosive molecules.
intermetallic
voids
• There is no evidence that diffusion of corrosive molecules is the limiting factor of the process.
• D(T) characteristics are not known.
• There is no evidence that diffusion of corrosive molecules is the limiting factor of the process.
• D(T) characteristics are not known.

iMAPS’04 12
HTSL: WB Degradation, Experimental Data
HTSL: WB Degradation, Experimental Data
Arrhenius plots for mean life of parametric and WB failures,
175 <T< 225 oC
Arrhenius plots for mean life of parametric and WB failures,
175 <T< 225 oC
At T < 190 oC:Ea ~1.3 to 1.8 eV.
At 190 < T < 225 oCEa ~0.55 to 0.68 eV.
Different activation energies below and above Tc ~190 oCindicate changes in degradation mechanism.
At T < 190 oC:Ea ~1.3 to 1.8 eV.
At 190 < T < 225 oCEa ~0.55 to 0.68 eV.
Different activation energies below and above Tc ~190 oCindicate changes in degradation mechanism.
100
1000
10000
100000
0.0019 0.002 0.0021 0.0022 0.00231/T, 1/K
mea
n lif
e, h
r
OP WBAD WBAD paramOP param

iMAPS’04 13
WB degradation: Mechanism II.WB degradation: Mechanism II.Discoloration of MC after HTSL
voids insideWB and alongthe periphery
T < Tc
T > Tc
air path
Discoloration of MC after HTSL
voids insideWB and alongthe periphery
T < Tc
T > Tc
air path
MC tinted not only along the surface of the package, but also along the lead frame, die, and wire bonds.
At HT there is a free pass allowing air to reach internal areas of the package.
A gap is forming at a critical temperature Tc > Tg to allow thermo-oxidative degradation of MC in vicinity of WB.
MC tinted not only along the surface of the package, but also along the lead frame, die, and wire bonds.
At HT there is a free pass allowing air to reach internal areas of the package.
A gap is forming at a critical temperature Tc > Tg to allow thermo-oxidative degradation of MC in vicinity of WB.
iMAPS’04 14
Anomalies during TMA Measurements
Anomalies during TMA Measurements
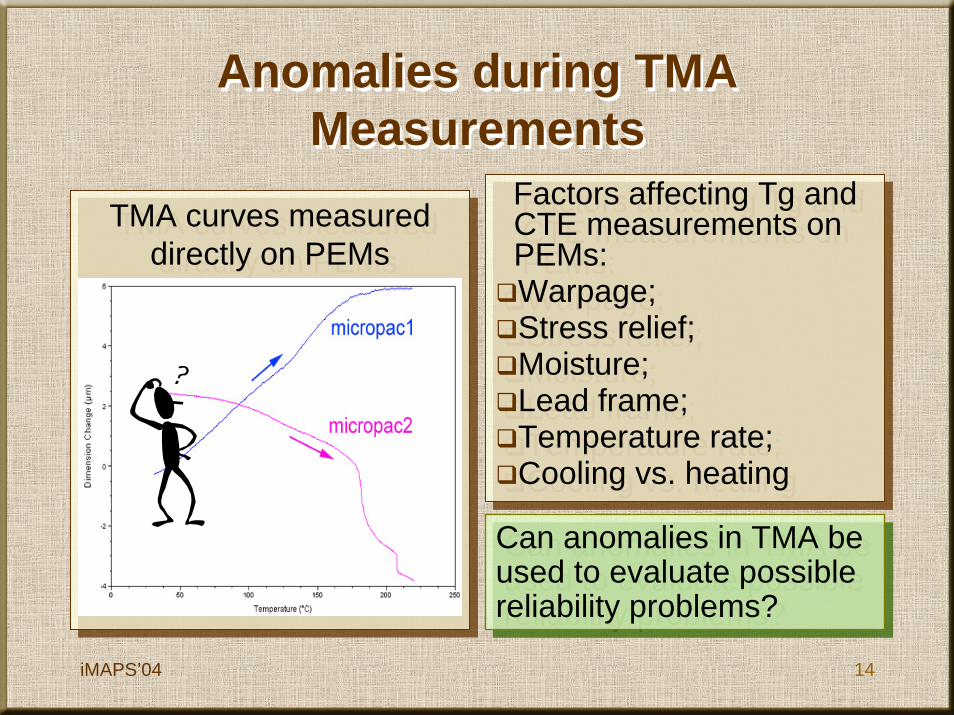
Factors affecting Tg and CTE measurements on PEMs:Warpage;Stress relief;Moisture;Lead frame;Temperature rate;Cooling vs. heating
Factors affecting Tg and CTE measurements on PEMs:Warpage;Stress relief;Moisture;Lead frame;Temperature rate;Cooling vs. heating
TMA curves measured directly on PEMs
TMA curves measured directly on PEMs
Can anomalies in TMA be used to evaluate possible reliability problems?
Can anomalies in TMA be used to evaluate possible reliability problems?

iMAPS’04 15
TMA application: Pop-corning in chip Ta capacitors?
TMA application: Pop-corning in chip Ta capacitors?
4.7 uF RT storageCycling to 200, 220, 230, and 240 oC
15 min bake at each extreme T
-505
101520253035
0 50 100 150 200 250Temperature, oC
Defo
rmat
ion,
µm 4.7 uF RT storage
Cycling to 200, 220, 230, and 240 oC15 min bake at each extreme T
-505
101520253035
0 50 100 150 200 250Temperature, oC
Defo
rmat
ion,
µm
22 uF Cycling to 220 oC
15 min bake at extreme T
-5
15
35
55
75
95
115
0 50 100 150 200 250
Temperature, oC
Def
orm
atio
n, µ
m
RT storagePCT 121 oC/100% RH
22 uF Cycling to 220 oC
15 min bake at extreme T
-5
15
35
55
75
95
115
0 50 100 150 200 250
Temperature, oC
Def
orm
atio
n, µ
m
RT storagePCT 121 oC/100% RH
condition N Average Std. Dev.long RT 5 17.61 3.72
vacuum storage 3 3.85 5.38121oC/100% RH 4 17.53 8.65
Amplitude of spikes, µm
Deformation spikes were observed during first heating up cycles (20 0C/min).There is a trend of increasing amplitude of spikes after moisture sorption.
Deformation spikes were observed during first heating up cycles (20 0C/min).There is a trend of increasing amplitude of spikes after moisture sorption.
Deformationspikes
iMAPS’04 16
TMA application: HAST-induced delaminations
TMA application: HAST-induced delaminations
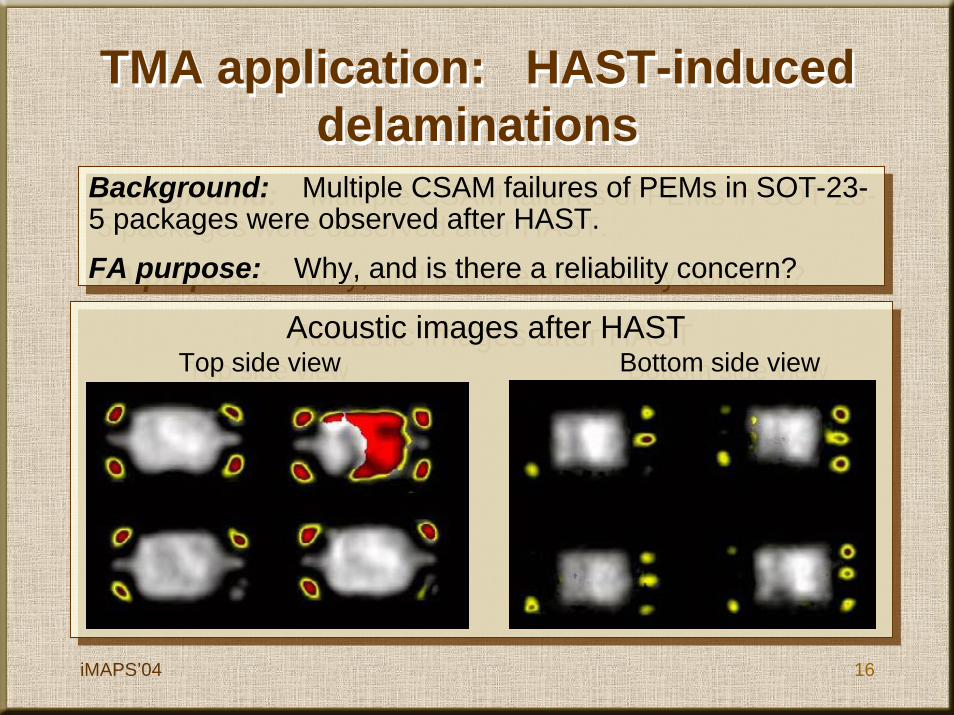
Background: Multiple CSAM failures of PEMs in SOT-23-5 packages were observed after HAST.
FA purpose: Why, and is there a reliability concern?
Background: Multiple CSAM failures of PEMs in SOT-23-5 packages were observed after HAST.
FA purpose: Why, and is there a reliability concern?
Acoustic images after HASTTop side view Bottom side view
Acoustic images after HASTTop side view Bottom side view
iMAPS’04 17
HAST-induced delaminations. Cont’d.HAST-induced delaminations. Cont’d.
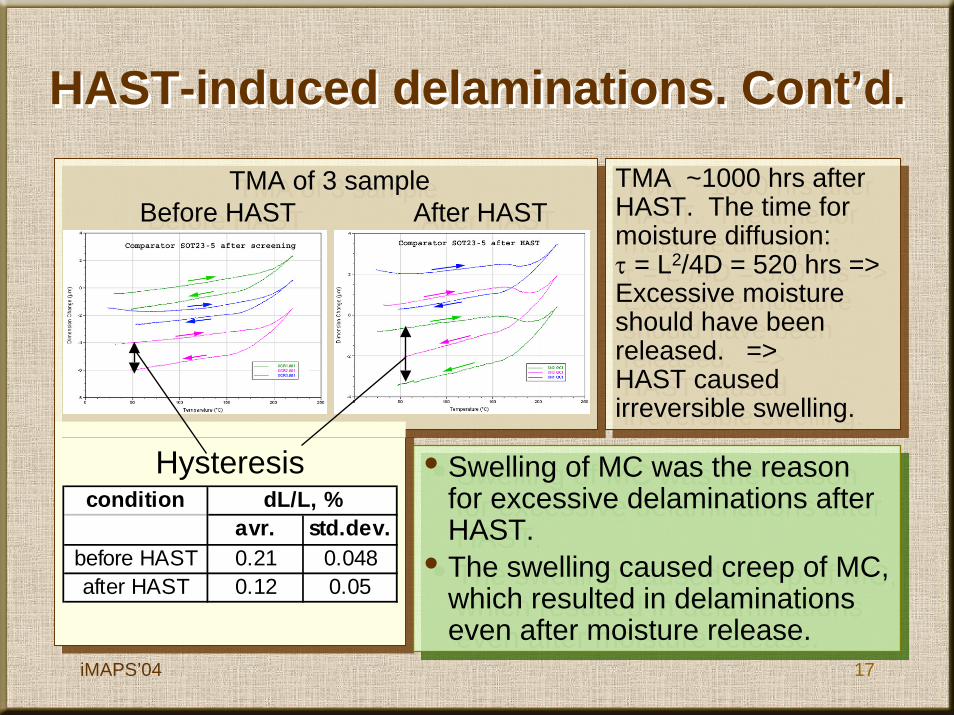
TMA ~1000 hrs after HAST. The time for moisture diffusion:τ = L2/4D = 520 hrs => Excessive moisture should have been released. => HAST caused irreversible swelling.
TMA ~1000 hrs after HAST. The time for moisture diffusion:τ = L2/4D = 520 hrs => Excessive moisture should have been released. => HAST caused irreversible swelling.
TMA of 3 sampleBefore HAST After HAST
TMA of 3 sampleBefore HAST After HAST
Hysteresiscondition
avr. std.dev.before HAST 0.21 0.048after HAST 0.12 0.05
dL/L, %• Swelling of MC was the reason
for excessive delaminations after HAST.
• The swelling caused creep of MC, which resulted in delaminationseven after moisture release.
• Swelling of MC was the reason for excessive delaminations after HAST.
• The swelling caused creep of MC, which resulted in delaminationseven after moisture release.

iMAPS’04 18
How critical delaminations are?How critical delaminations are?
To evaluate the risk related to delaminations, three groups of parts were subjected to preconditioning according to JEDEC JESD22-A113 (three runs through the solder reflow chamber) and 1000 temperature cycles from-55 oC to 125 oC.
To evaluate the risk related to delaminations, three groups of parts were subjected to preconditioning according to JEDEC JESD22-A113 (three runs through the solder reflow chamber) and 1000 temperature cycles from-55 oC to 125 oC.
Effect of TC on electrical characteristics
Effect of TC on electrical characteristics
0
0.5
1
1.5
2
2.5
init SMT220
100 TC 300 TC 1000TC
VOS,
mV
HAST SCAM failures DC0018screening CSAM failures DC 0018Uscreened DC00 20
• No failures during TC.• The parts manifested only minor changes in electrical
characteristics.
• No failures during TC.• The parts manifested only minor changes in electrical
characteristics.

iMAPS’04 19
Delaminations at Secondary BondsDelaminations at Secondary Bonds
• Delamination at gold-to-silver wire bonding at finger tips of leads is a common defect in PEMs.
• Secondary bonds are strong enough to provide reliable connection even in the presence of delaminations.
• Delamination at gold-to-silver wire bonding at finger tips of leads is a common defect in PEMs.
• Secondary bonds are strong enough to provide reliable connection even in the presence of delaminations.
Cross-section of a typical secondary bond delaminationindicates a gap above the bond area
Silver plating
iMAPS’04 20
TMA application: wire bond failures during TC
TMA application: wire bond failures during TC
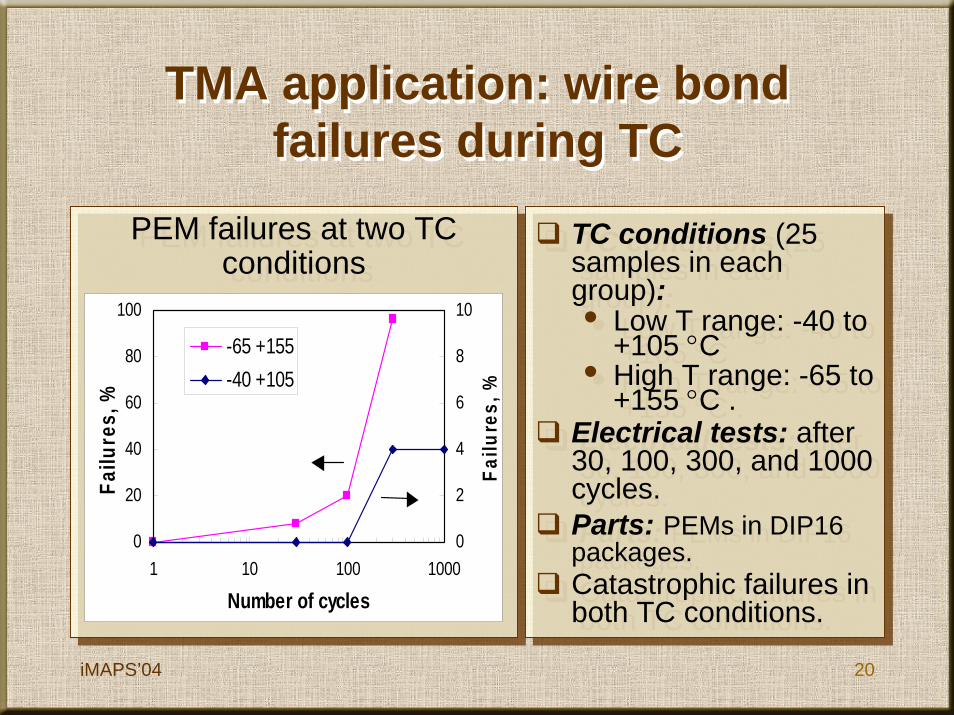
PEM failures at two TC conditions
PEM failures at two TC conditions
TC conditions (25 samples in each group):• Low T range: -40 to
+105 °C• High T range: -65 to
+155 °C . Electrical tests: after 30, 100, 300, and 1000 cycles.Parts: PEMs in DIP16 packages.Catastrophic failures in both TC conditions.
TC conditions (25 samples in each group):• Low T range: -40 to
+105 °C• High T range: -65 to
+155 °C . Electrical tests: after 30, 100, 300, and 1000 cycles.Parts: PEMs in DIP16 packages.Catastrophic failures in both TC conditions.
0
20
40
60
80
100
1 10 100 1000
Number of cycles
Failu
res,
%
0
2
4
6
8
10
Failu
res,
%
-65 +155-40 +105

iMAPS’04 21
X-ray and cross-sectioning confirmed wire bond fracturesX-ray and cross-sectioning confirmed wire bond fractures
Wire bond failures during TC. Cont’d.Wire bond failures during TC. Cont’d.
Silicone die coating
Pictures courtesy of F.Felt
NormalpartNormalpart
FailedpartFailedpart
fractures
iMAPS’04 22
Wire bond failures during TC. Cont’d.Wire bond failures during TC. Cont’d.
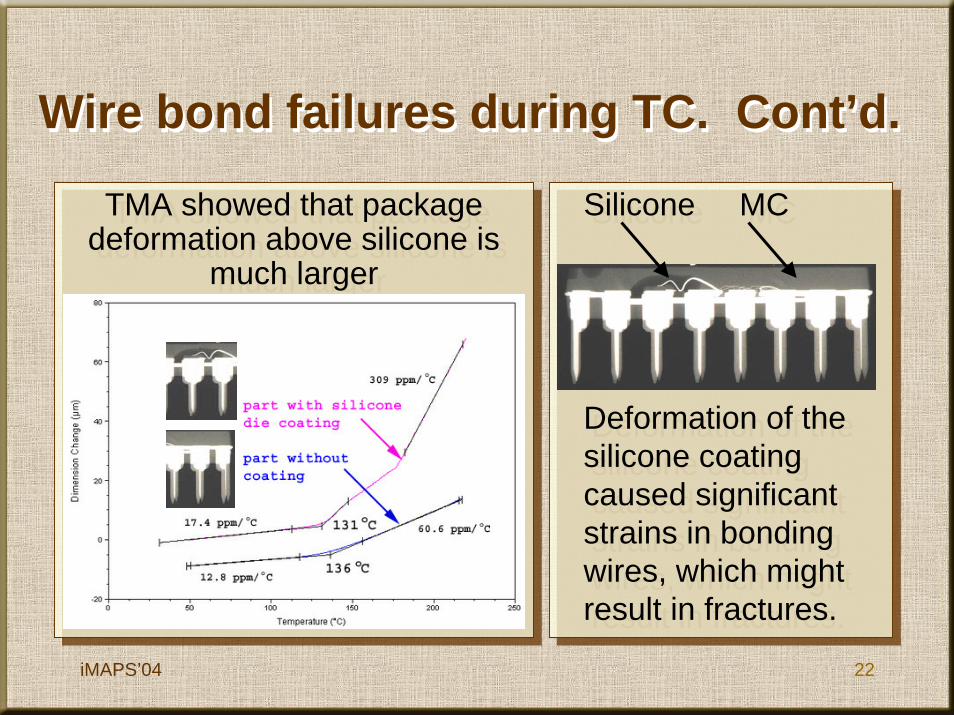
TMA showed that package deformation above silicone is
much larger
TMA showed that package deformation above silicone is
much larger
Silicone MC
Deformation of the silicone coating caused significant strains in bonding wires, which might result in fractures.
Silicone MC
Deformation of the silicone coating caused significant strains in bonding wires, which might result in fractures.

iMAPS’04 23
Mechanism of WB Failures During TC.Mechanism of WB Failures During TC.•LT: silicone shrinks, clamps
the wire and pools it from MC.•HT: the clamp is released and
silicone slides along the wire.•Repeat cycling eventually
causes fracture.
•LT: silicone shrinks, clamps the wire and pools it from MC.
•HT: the clamp is released and silicone slides along the wire.
•Repeat cycling eventually causes fracture.
Low T
High T Low T
RT
fracture
MC
silicone
Elongation of Au wires ~ 3 to 6 %. =>This type of failures is more likely to happen with thick enough layers of die coating.Elongation of Au wires ~ 3 to 6 %. =>This type of failures is
more likely to happen with thick enough layers of die coating.

iMAPS’04 24
ConclusionsConclusions
Accelerated stress testing at T > Tg might introduce new failure mechanisms and should be considered for analysis of long-term reliability of PEMs based on high-temperature testing.TMA is a useful tool for reliability evaluation and failure analysis of plastic encapsulated devices.Swelling of MC increases the probability of delaminations during testing at T ~ Tg and might affect results of HAST.The thickness of silicone die coatings affects deformation of PEMs and the probability of wire bonds failures.
Accelerated stress testing at T > Tg might introduce new failure mechanisms and should be considered for analysis of long-term reliability of PEMs based on high-temperature testing.TMA is a useful tool for reliability evaluation and failure analysis of plastic encapsulated devices.Swelling of MC increases the probability of delaminations during testing at T ~ Tg and might affect results of HAST.The thickness of silicone die coatings affects deformation of PEMs and the probability of wire bonds failures.