measurements of selected naval radar emissions for ... report tr-15-510 measurements of selected...
TRANSCRIPT
NTIA Report TR-15-510
Measurements of Selected Naval Radar Emissions for Electromagnetic
Compatibility Analyses
Frank H. Sanders John E. Carroll
Geoffrey A. Sanders Lawrence S. Cohen
U.S. DEPARTMENT OF COMMERCE • National Telecommunications and Information Administration
report series

NTIA Report TR-15-510
Measurements of Selected Naval Radar Emissions for Electromagnetic
Compatibility Analyses
Frank H. Sanders John E. Carroll
Geoffrey A. Sanders Lawrence S. Cohen
U.S. DEPARTMENT OF COMMERCE
October 2014

DISCLAIMER
Certain commercial equipment and materials are identified in this report to specify adequately the technical aspects of the reported results. In no case does such identification imply recommendation or endorsement by the National Telecommunications and Information Administration, nor does it imply that the material or equipment identified is the best available for this purpose.
iii


CONTENTS
Figures............................................................................................................................................ vi
Abbreviations and Symbols .......................................................................................................... vii
Executive Summary ....................................................................................................................... ix
1. Introduction ..................................................................................................................................11.1 The Need to Measure Radar Emissions for EMC Analyses ..................................................2
2. Radar Emission Spectrum Measurements ...................................................................................42.1 Stepped-Frequency Emission Spectrum Measurement Technique .......................................4 2.2 Shipborne Radar 1 Emission Spectrum Measurement ..........................................................5 2.3 Shipborne Radar 3 Emission Spectrum Measurement ..........................................................9
3. Radar Time Domain Measurements ..........................................................................................113.1 Shipborne Radar 1 Time Domain Measurement Results .....................................................11 3.2 Shipborne Radar 3 Time Domain Measurement Results .....................................................13
4. Summary and Conclusions ........................................................................................................164.1 Summary of Work and Results ............................................................................................16 4.2 Conclusions ..........................................................................................................................16 4.3 Recommendations for Future Work ....................................................................................17
5. References ..................................................................................................................................18
v
FIGURES
Figure 1. Block diagram schematic of RF front end needed for radar spectrum measurements. ..................................................................................................................................4
Figure 2. NTIA RSMS-4 measuring Shipborne Radar 1 radiated emissions in Maryland. .........................................................................................................................................6
Figure 3. Block diagram schematic of Shipborne Radar 1 emission spectrum measurement. ...................................................................................................................................7
Figure 4. Majority of the measured Shipborne Radar 1 emission spectrum. Radar peak power has been normalized to 0 dB at f0. Shaded region is identified for band sharing in the FCC NPRM. .....................................................................................................8
Figure 5. Entire measured Shipborne Radar 1 emission spectrum, normalized to 0 dB at f0 as in Figure 4. Spike at 3920 MHz and hump at 4000 MHz are radar emissions. .........................................................................................................................................8
Figure 6. Block diagram schematic of the Shipborne Radar 3 emission spectrum measurement. ...................................................................................................................................9
Figure 7. Shipborne Radar 3 measured emission spectra in multiple operational modes, normalized to 0 dB across f0 frequencies as in Figures 4 and 5. Shaded region has been identified for band sharing in the FCC NPRM. ...................................................10
Figure 8. Envelope of an individual, on-tuned Shipborne Radar 1 pulse. .....................................11
Figure 9. Envelope of off-tuned (50 MHz) Shipborne Radar 1 pulse showing rabbit-ears effect. ...........................................................................................................................12
Figure 10. Shipborne Radar 1 pulse sequence showing antenna main-beam shape. .....................12
Figure 11. Shipborne Radar 1 beam-scanning pattern, which repeats every 4 sec. .......................13
Figure 12. Envelope of a Radar 3 pulse that was on-tuned to the measurement system at the beginning (0 µs) and which gradually off-tuned from the measurement system as it progressed to 52 µs. Off-tuning occurred in 13-µs increments; this behavior is a type of rabbit ears effect.................................................................14
Figure 13. Envelope of a completely off-tuned Radar 3 pulse, showing rabbit ears effect. .............................................................................................................................................14
Figure 14. Shipborne Radar 3 emissions observed on a single frequency (3600 MHz) for 40 seconds. .....................................................................................................................15
vi
ABBREVIATIONS AND SYMBOLS
AWG arbitrary waveform generator
EMC Electromagnetic compatibility
FCC Federal Communications Commission
FDR frequency dependent rejection
FNPRM Further Notice of Proposed Rulemaking
ITS Institute for Telecommunication Sciences
LNA low noise amplifier
LTE Long Term Evolution
NPRM Notice of Proposed Rulemaking
NESEA Naval Electronic Systems Engineering Activity
NSWC Naval Surface Warfare Center
NRL Naval Research Laboratory
NTIA National Telecommunications and Information Administration
OOB out-of-band
OSM Office of Spectrum Management
RF radiofrequency
VSA vector signal analyzer
VSG vector signal generator
YIG yttrium iron garnet
vii

EXECUTIVE SUMMARY
Recently, the Federal Communications Commission (FCC) issued a Notice of Proposed Rulemaking (NPRM) in FCC Docket 12-354 [1], regarding possible future spectrum sharing between radar and non-radar systems in the band 3550–3650 MHz (called here the 3.5 GHz band). A Further NPRM (FNPRM, NG Docket 12-354 [2]) has followed. The NPRM documents call for tests and measurements to investigate the compatibility of broadband communications systems and incumbent federal radars operating in that band. As part of ongoing spectrum sharing studies for this band, NTIA’s Office of Spectrum Management (OSM) has studied electromagnetic characteristics of both incumbent and yet-to-be-developed government systems in the 3.5 GHz band in the NTIA Fast Track Report [3]. NTIA has also issued three reports addressing measurement results for radar-to-LTE interference ([4] and [5]) and LTE-to-radar interference [6]. The radar that is the subject of [6] is identified as Shipborne Radar 1 in the Fast Track Report.
This report extends existing knowledge by examining in detail the emissions of two radars, identified as Shipborne Radar 1 and Shipborne Radar 3 in the Fast Track Report, that operate at or near 3.5 GHz. NTIA, working with the Naval Research Laboratory (NRL), Naval Surface Warfare Center (NSWC) and Naval Electronic Systems Engineering Activity (NEASEA) has measured the emissions of Shipborne Radars 1 and 3 in the frequency domain and the time domain. The frequency domain measurements have been obtained with up to 130 dB of dynamic range and the time domain measurements have been obtained from sub-microsecond scales to scales of tens of seconds at a time. Summary graphs are presented in this report. Many additional time domain plots at many radar frequencies have been recorded. Time domain recordings have been collected on both the radar fundamental frequencies and in the radars’ out-of-band (OOB) and spurious regions.
The emission spectra of Shipborne Radars 1 and 3 have been measured in bandwidths of 1 MHz and 8 MHz, respectively, in this report. This is in accord with existing recommendations for best practices in radar emission measurements [7]. However, LTE stations are expected to routinely implement bandwidths of 10 or 20 MHz. The result of observing these radars’ emissions in wider bandwidths than 1 MHz and 8 MHz, respectively, is to raise the power level of their OOB and spurious emissions relative to the power levels observed on their fundamental frequencies. In other words, 10 or 20 MHz wide LTE receivers will see the OOB and spurious levels of these radars as being higher than shown in the data graphs in this report, relative to the power measured at the radars’ fundamental frequencies. As described in Appendix G of [7], the amount of this offset will be about 15log10(BLTE/Bradar), where BLTE is the bandwidth of the LTE receiver (either 10 or 20 MHz) and Bradar is the bandwidth of the radar spectrum measurement (either 1 or 8 MHz) regions. For example, the correction factor between a 20 MHz LTE receiver channel bandwidth and the radar OOB power level measured in an 8 MHz bandwidth will be 15log(20/8) = 6 dB.
ix
MEASUREMENTS OF SELECTED NAVAL RADAR EMISSIONS FOR ELECTROMAGNETIC COMPATIBILITY ANALYSES
Frank H. Sanders,1 John E. Carroll,1 Geoffrey A. Sanders,1 Lawrence S. Cohen2
In response to proposals to introduce new Long Term Evolution (LTE) radio systems into the 3550–3650 MHz (called 3.5 GHz) portion of radio spectrum in the United States, a joint team of National Telecommunications and Information Administration (NTIA) and U.S. Navy electronics engineers performed measurements on the emissions of radars identified as Shipborne Radars 1 and 3 in the NTIA Fast Track Report. These radar types are deployed on many Navy surface vessels. Radar 1 operates in the band of interest; Radar 3 operates in adjacent spectrum. Although intentional Radar 3 emissions are not transmitted in the band of interest, it produces measurable out-of-band (OOB) and spurious emissions in the 3.5 GHz band. In this report, the authors present measured broadband Radar 1 and 3 emission spectra and time domain characteristics. These data encapsulate the OOB and spurious-region signal characteristics that possible future coastal broadband wireless base station receivers may see from these radars’ operations in littoral waters. As such, these data may be used in electromagnetic compatibility analyses for future 3.5 GHz spectrum sharing.
Keywords: electromagnetic compatibility (EMC); Long Term Evolution (LTE); NTIA Fast Track Report; radar emissions; spectrum monitoring; spectrum sharing
1. INTRODUCTION
Recently, the Federal Communications Commission (FCC) issued a Notice of Proposed Rulemaking (NPRM) in FCC Docket 12-354 [1], regarding possible future spectrum sharing between radar and non-radar systems in the band 3550–3650 MHz (called here the 3.5 GHz band). A Further NPRM (FNPRM, GN Docket 12-354 [2]) has followed. The FCC documents call for tests and measurements to investigate the compatibility of broadband communications systems and incumbent federal radars operating in that band. The new 3.5 GHz communication systems envisioned for the 3.5 GHz band will be Long Term Evolution (LTE) microcells deployed at terrestrial locations.
As part of ongoing spectrum sharing studies for this band, NTIA’s Office of Spectrum Management (OSM) has studied electromagnetic characteristics of both incumbent and yet-to-be-developed government systems in the 3.5 GHz band in the NTIA Fast Track Report [3].
1 The first three authors are with the Institute for Telecommunication Sciences, National Telecommunications and Information Administration (NTIA), U.S. Dept. of Commerce, 325 Broadway, Boulder, CO 80305. 2 The author is with the Naval Research Laboratory, U.S. Dept. of Defense, 4555 Overlook Ave. SW, Washington, DC 20375.
These government systems include, but are not limited to, radars that operate in near-shore (littoral) waters around the United States. The Fast Track Report analyzes possible exclusion zone requirements for new, terrestrial 3.5 GHz systems relative to littoral-zone radar operations. As a follow-on to the Fast Track Report, NTIA has published three recent reports addressing measurement results for radar-to-LTE interference [4], [5] and LTE-to-radar interference [6]. The radar that is the subject of [6] is identified as Shipborne Radar 1 in the Fast Track Report.3
Spectrum at and adjacent to the 3.5 GHz band is heavily utilized by Fast Track Report Shipborne Radars 1 and 3 operating in American coastal waters. These radars’ transmitted beams scan 360 degrees around their ship platforms, working at distances up to hundreds of nautical miles from the ships. Their beams scan over both open ocean expanses and littoral shorelines. The lower-edges (3 dB points) of the radars’ search beams are typically tilted above any given ship’s local horizon at an angle of about 0.5 to 1.0 angular degrees. Additional information about 3.5 GHz radar systems is presented in [3].
This report extends the work of [3], [4], [5] and [6] by examining in detail the frequency domain and time domain emission characteristics of Shipborne Radars 1 and 3. The measurements have been performed in adherence to the best-practices criteria provided in [7]. These data are intended to advance spectrum-sharing studies for the 3.5 GHz band.
1.1 The Need to Measure Radar Emissions for EMC Analyses
Even though air search radars’ main beams are tilted slightly above local horizons, sidelobe emissions of such radars couple strongly into shoreline areas, as described for example in [8]. While [8] describes the incidence of target-of-opportunity 3.5 GHz radar emissions at a shoreline location and is essentially an environmental survey, spectrum sharing studies also require electromagnetic compatibility (EMC) analyses that are based on detailed, wide dynamic range measurements of emissions from individual radars. Such measurements show in particular the rate of roll-off of radar spectrum emissions as a function of off-tuning from radar center frequencies. Such measurements will show, e.g., that a radar transmitter’s emission levels might be reduced by 80 dB relative to the power at the fundamental when a receiver is off-tuned from the fundamental by, say, 60 MHz.
It is sometimes suggested that emission measurements are not needed because it can be assumed that radar transmitters will operate at emission mask limits. This assumption is nearly always false. As demonstrated in [9], for example, radar out-of-band (OOB) and spurious emissions are nearly always substantially lower than emission mask limits, often by tens of decibels. This was true for the older-model radars described in [9] and the authors observe that this trend has continued for newer radars. EMC studies that assume that radar emissions are as high as emission mask limits will usually grossly overestimate the power levels of radar OOB and spurious emissions and thus may also overestimate required frequency and distance separations needed for compatible operations between systems.
3 LTE-to-radar interference effects have not been studied for Shipborne Radar 3 because that radar operates in spectrum adjacent to the 3.5 GHz band; there should be no co-channel operations between this radar and new 3.5 GHz communication systems.
2

The only way to accurately ascertain the OOB and spurious emission levels of operational radars for EMC analyses is to actually measure those emissions as radiated. The authors performed such a set of radiated measurements in July and August 2013 on emissions of Shipborne Radars 1 and 3 at two Navy shore facilities in Maryland and Virginia, respectively. NTIA worked with the Naval Research Laboratory (NRL), the Naval Surface Warfare Center (NSWC) and the Naval Electronics Systems Engineering Activity (NESEA) to obtain the radar emission data. The results of those measurements are presented here.
3

2. RADAR EMISSION SPECTRUM MEASUREMENTS
2.1 Stepped-Frequency Emission Spectrum Measurement Technique
EMC analyses often require radar emission spectrum measurements with a dynamic range of 100 dB or more. Available test and measurement instrumentation does not achieve such wide dynamic ranges. This includes swept-frequency and high-speed time-domain sampling systems. To overcome this limitation and achieve dynamic ranges of as much as 120 dB in radar emission measurements, a measurement system with the characteristics described in [7] needs to be used.
As described in [7] and shown in Figure 1, the measurement system requires a radio frequency (RF) front end with three major components: a variable RF attenuator, a tunable bandpass filter, and a low-noise amplifier (LNA). The RF attenuator extends the dynamic range of the measurement system, the bandpass filter rejects high-power radar power when the measurement system is off-tuned from the radar fundamental frequency, and the LNA provides a low measurement system noise figure (high sensitivity to weak signals) in low-power portions of the radar emission spectrum.
Figure 1. Block diagram schematic of RF front end needed for radar spectrum measurements.
4

The key to operation of the measurement system is to step across the radar spectrum one frequency at a time. Stepping means tuning the measurement system to a single frequency and then waiting long enough at that frequency for the radar to aim its beam at the measurement system as it scans across the sky. For frequency-hopping radars, this interval needs to be long enough for the radar to direct its beam toward the measurement system and do so while tuned to the measurement system’s frequency (for measurements within the center-frequency portion of the spectrum). When a measurement has been completed at a tuned frequency, the measurement system is tuned (stepped) to the next frequency to be measured. The frequency interval between tuning steps is usually equal to the resolution bandwidth of the measurement system. The entire stepped-frequency measurement process is described in detail in [7].
Because the radar emission spectrum is measured a single frequency at a time, the amount of RF attenuation that is invoked at the RF front end can be gradually adjusted as the measurement progresses. Zero attenuation is used in the lowest-power parts of the spectrum, and maximum attenuation is used at radar center frequencies. If a measurement system has 60 dB of instantaneous dynamic range and up to 70 dB of attenuation available in the RF front end, the total dynamic range of the measurement can be as much as (60 dB + 70 dB) = 130 dB. In practice, it is rare to achieve more than 120 dB. This is due to the lack of available power from even the highest-power radars, even at small separation distances between the radars and the measurement system.
2.2 Shipborne Radar 1 Emission Spectrum Measurement
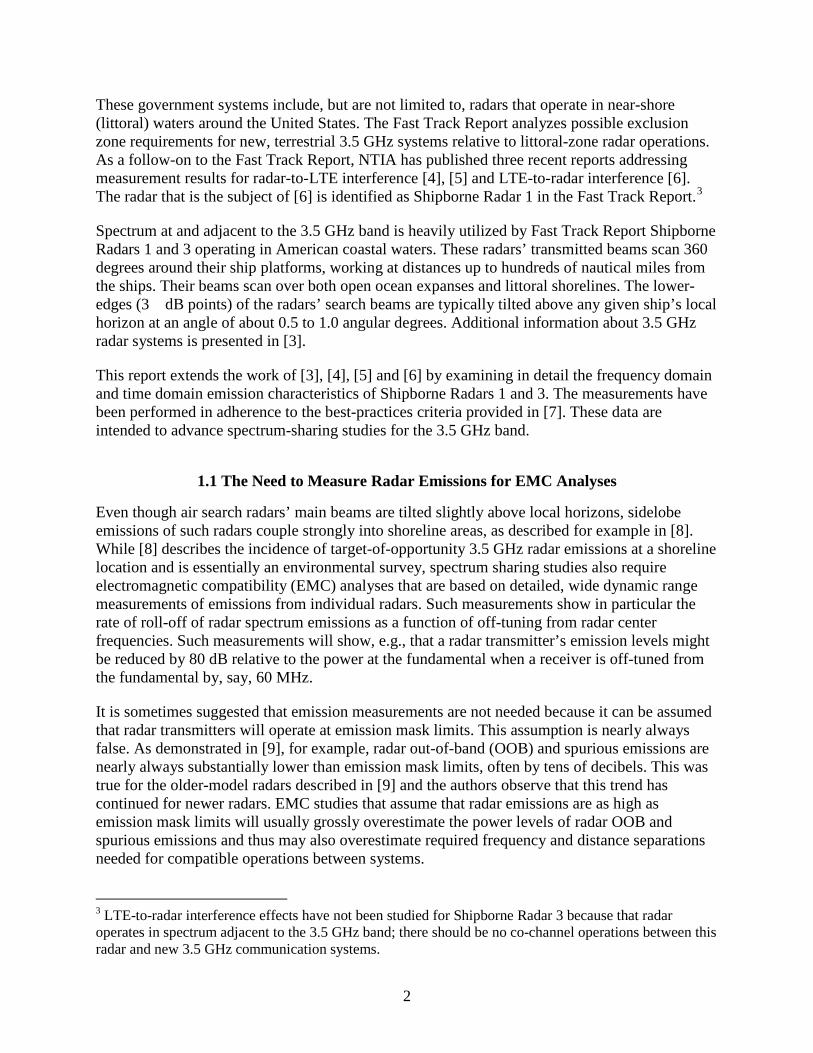
The Shipborne Radar 1 emission spectrum measurement was performed with the NTIA Radio Spectrum Measurement System, Version 4 (RSMS-4). The RSMS is pictured during those measurements in Figure 2. A block diagram schematic of the Radar 1 measurement is shown in Figure 3. The radar antenna and the RSMS-4 measurement antenna were at nearly the same height, with a separation of 1022 m (3353 ft.).4 The radar was operated normally during the measurements, with its antenna rotating.
The measured Radar 1 emission spectrum is shown in Figures 4 and 5. The measurements have a dynamic range of 120 dB. Power levels in those figures have been normalized to 0 dB at the radar’s fundamental frequency. Figure 4 shows the majority of the measurable spectrum. Figure 5 shows a more extended spectrum measurement that contains a low-power hump where higher-frequency emissions are observed through the radar’s output waveguide filter. Radar 1 units may be individually tuned anywhere within 3500–3700 MHz (including all of the band-sharing shaded region of Figure 4), although current rules restrict the highest operational frequency to 3650 MHz in littoral zones. The radar’s emissions meet the NTIA Radar Spectrum Emission Criteria (RSEC) mask limits [10].
4 The RSMS dish antenna’s high gain in the direction of the radar discriminated in favor of the radar signal and against off-axis signals. While the stepped radar spectrum measurement was running, the measurement personnel monitored the received signals in the time domain at each measurement frequency. They watched the radar’s characteristic time-domain antenna-rotation behavior at each step, and could tell if non-radar signals, which would not have had the radar’s rotational characteristic, had intruded. The measurement personnel thus verified that only Shipborne Radar 1 signal power was observed during the measurement.
5

Figure 2. NTIA RSMS-4 measuring Shipborne Radar 1 radiated emissions in Maryland.
6
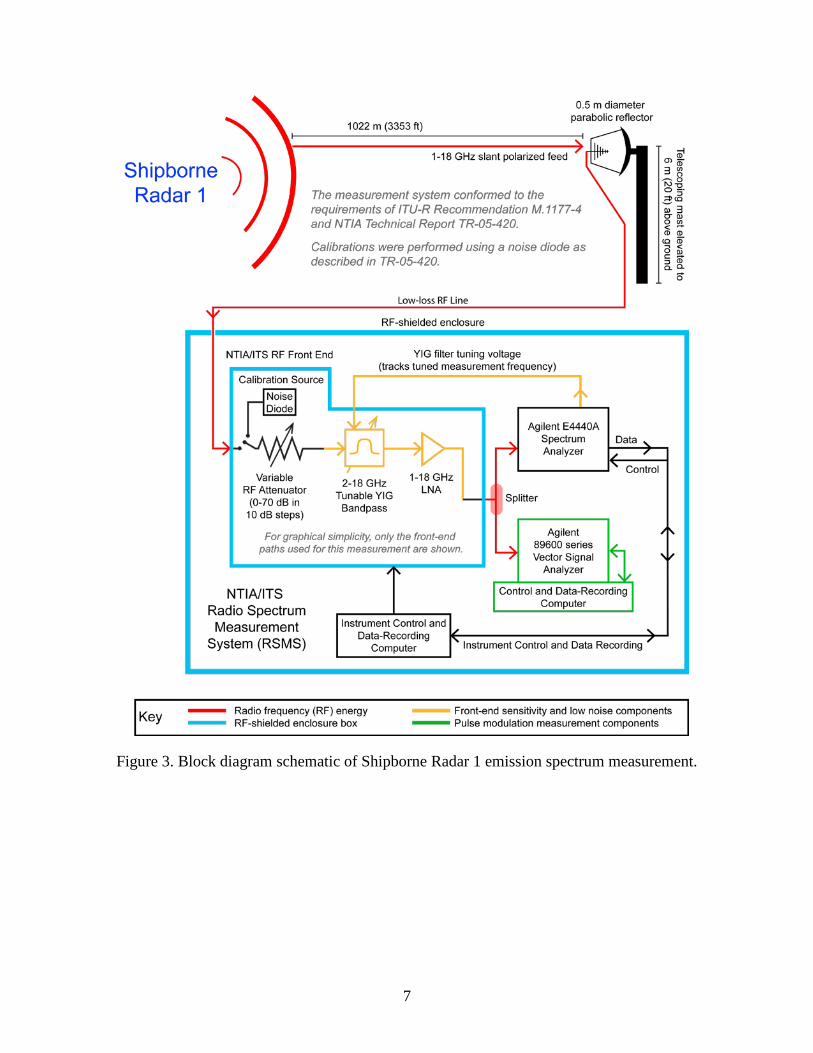
Figure 3. Block diagram schematic of Shipborne Radar 1 emission spectrum measurement.
7
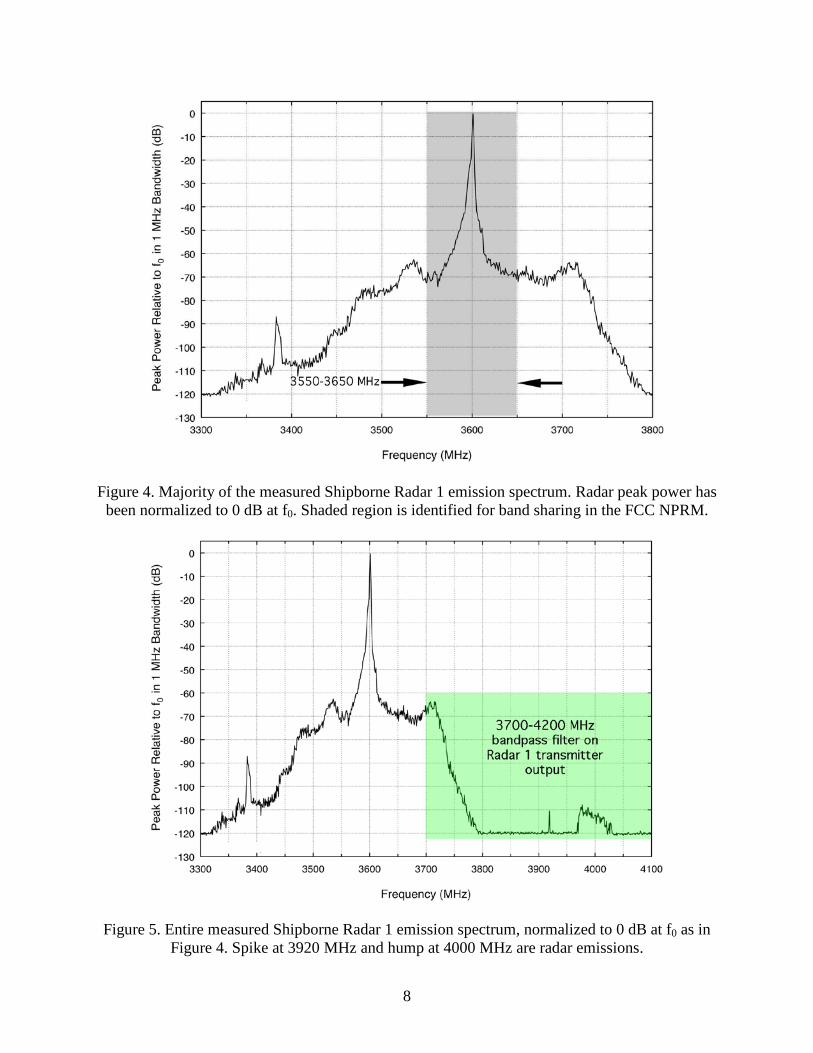
Figure 4. Majority of the measured Shipborne Radar 1 emission spectrum. Radar peak power has been normalized to 0 dB at f0. Shaded region is identified for band sharing in the FCC NPRM.
Figure 5. Entire measured Shipborne Radar 1 emission spectrum, normalized to 0 dB at f0 as in Figure 4. Spike at 3920 MHz and hump at 4000 MHz are radar emissions.
8

2.3 Shipborne Radar 3 Emission Spectrum Measurement
The Shipborne Radar 3 emission spectrum measurements were performed at a distance of 225 m (738 ft.)5 from the radar. A Navy S-band horn antenna on a high tower was used in lieu of the RSMS-4 parabolic antenna. The Navy antenna was positioned high enough to intercept main-beam power from the radar array. The measurement arrangement is shown in Figure 6.
Figure 6. Block diagram schematic of the Shipborne Radar 3 emission spectrum measurement.
5 The distances at which Radars 1 and 3 were measured met far-field criteria. Site contingencies determined the exact distances at which the RSMS was positioned for measurements on each radar.
9

Radar 3 was operated in multiple modes during the measurement series. The results of each mode measurement are shown in Figure 7. The dynamic range of the measurements is as much as 130 dB, the theoretical maximum for the RSMS-4 measurement system. All Radar 3 emission spectrum power levels have been normalized to 0 dB across the radar’s fundamental frequency range.
Figure 7. Shipborne Radar 3 measured emission spectra in multiple operational modes, normalized to 0 dB across f0 frequencies as in Figures 4 and 5. Shaded region has been identified
for band sharing in the FCC NPRM.
10

3. RADAR TIME DOMAIN MEASUREMENTS
3.1 Shipborne Radar 1 Time Domain Measurement Results
While the RSMS-4 was positioned for the Shipborne Radar 1 spectrum measurements, the authors measured the radar’s time domain characteristics as well. The measurement system configuration was the same as shown in Figure 3. Time domain data were collected with both the VSA depicted in that diagram and with the spectrum analyzer operated in a zero-hertz frequency span mode.
Figure 8 shows an individual Radar 1 pulse envelope when the measurement system was on-tuned to the radar (in this case 3601 MHz). When a measurement or monitoring system is off-tuned from the radar, the classic rabbit ears behavior as described in [12] should occur. The authors observed this effect in off-tuned pulse measurements, as shown in Figure 9. Figure 10 shows the pulse-to-pulse spacing of Radar 1 as well as the shape of its main beam. The pulse interval is 1 ms with 19–20 pulses occurring between the 3 dB points of the main beam. Figure 11 shows the radar’s radiation pattern (essentially its antenna pattern) over a complete 360 degree beam scan around the horizon. Radar 1 completes this scan cycle every 4 seconds.
So, any on-shore monitoring station will observe about 20 high-amplitude pulses with 1 ms spacing once every 4 seconds when Shipborne Radar 1 is operating off-shore. If the monitoring station is on-tuned to the radar, the pulse widths will be measured at 1 µs. But if the station is off-tuned from the radar, the pulses will exhibit the rabbit ears effect [11] and the apparent pulse widths will appear to be less than 1 µs.
Figure 8. Envelope of an individual, on-tuned Shipborne Radar 1 pulse.
11

Figure 9. Envelope of off-tuned (50 MHz) Shipborne Radar 1 pulse showing rabbit-ears effect.
Figure 10. Shipborne Radar 1 pulse sequence showing antenna main-beam shape.
12

Figure 11. Shipborne Radar 1 beam-scanning pattern, which repeats every 4 sec.
3.2 Shipborne Radar 3 Time Domain Measurement Results
As shown in Figure 7, Shipborne Radar 3 operates entirely outside the 3.5 GHz band, but its off-tuned emissions (out-of-band and spurious) do occur at measurable levels in the 3.5 GHz band. A nearly on-tuned Shipborne Radar 3 pulse envelope is shown in Figure 12. When the pulse begins it is on-tuned with the measurement system, but then it off-tunes itself from the measurement system in a step-wise fashion (every 13 µs) during its 52 µs duration. A pulse envelope measured when the pulse was completely off-tuned from the measurement system for its entire duration is shown in Figure 13; as would be expected, it shows rabbit ears behavior [12] across its entire width. Since Shipborne Radar 3 always operates below 3550 MHz, it will always be off-tuned from any 3.5 GHz monitoring system and will therefore always show rabbit ears features.
Figure 14 shows a long series (40 seconds’ worth) of Radar 3 pulses, such as would be observed in littoral zones when these radars are operating off-shore. The Radar 3 emissions in Figure 14 lack the regularity of the Radar 1 emissions in Figure 11 because the Radar 3 beam scans electronically rather than mechanically and frequency-hops as it operates.
13

Figure 12. Envelope of a Radar 3 pulse that was on-tuned to the measurement system at the beginning (0 µs) and which gradually off-tuned from the measurement system as it progressed to
52 µs. Off-tuning occurred in 13-µs increments; this behavior is a type of rabbit ears effect.
Figure 13. Envelope of a completely off-tuned Radar 3 pulse, showing rabbit ears effect.
14
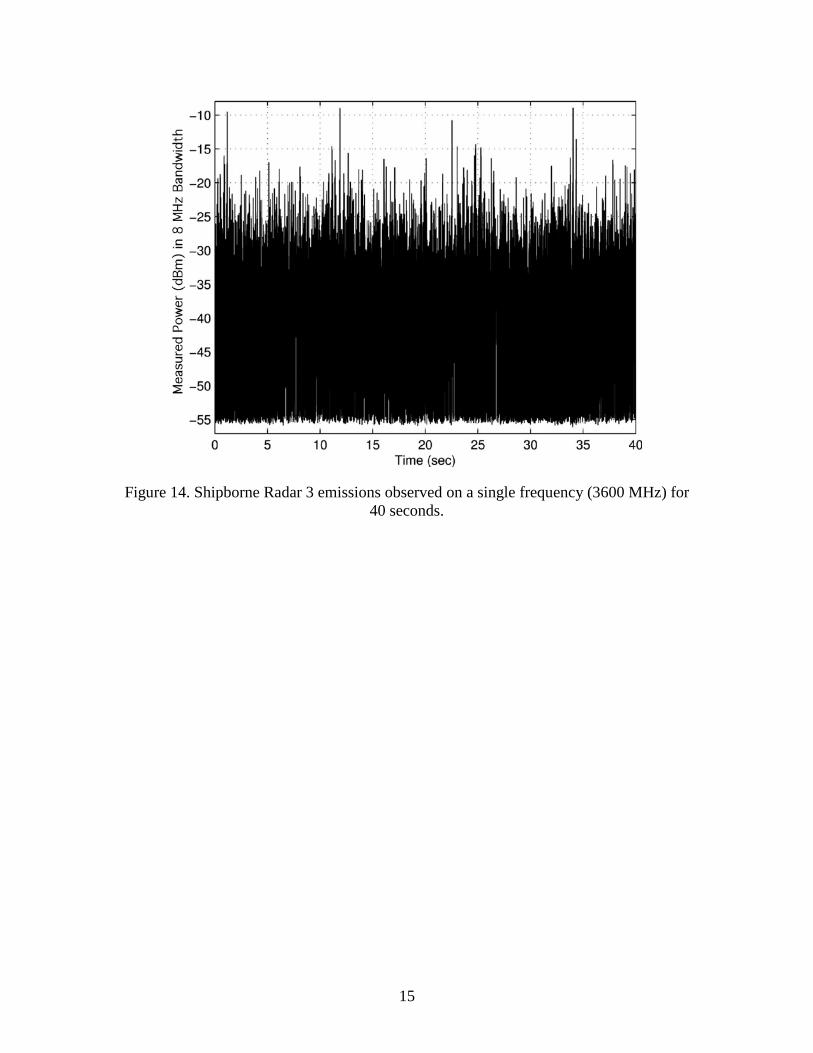
Figure 14. Shipborne Radar 3 emissions observed on a single frequency (3600 MHz) for 40 seconds.
15

4. SUMMARY AND CONCLUSIONS
4.1 Summary of Work and Results
NTIA, working with NRL, NSWC and NESEA, has measured the emissions of Fast Track Report Shipborne Radars 1 and 3 in the frequency domain and the time domain. The frequency domain measurements have been obtained with up to 130 dB of dynamic range and the time domain measurements have been obtained from sub-microsecond scales to scales of tens of seconds at a time. Summary graphs have been presented in this report. Many additional time domain plots at many radar frequencies have been recorded. Time domain recordings have been collected on both the radar fundamental frequencies and in the radars’ OOB and spurious regions.
4.2 Conclusions
Although the Shipborne Radar 1 and 3 emissions meet the NTIA RSEC emission limits, these radars do produce appreciable OOB and spurious emissions, as documented in this report. These emissions may need to be taken into account in possible future spectrum sharing at 3.5 GHz.
If the radars are on-tuned to monitoring systems, then the radars’ nominal pulse widths (about 1 µs for Shipborne Radar 1 and 52 µs for Shipborne Radar 3) will be observed. But if monitoring systems are off-tuned from the radars’ emissions, then the rabbit ears effect will cause the pulse widths to appear shorter than these values. Since Shipborne Radar 3 always operates outside the 3.5 GHz band, monitoring systems in that band will always see Radar 3 pulses with the rabbit ears effect.
The radar emissions for these two radars have been measured in bandwidths of 1 MHz and 8 MHz, respectively. This is in accord with the recommendations of [7]. However, LTE stations are expected to routinely implement bandwidths of 10 and 20 MHz. As described in Appendix G of [7], the result of observing these radars’ emissions in wider bandwidths than 1 MHz and 8 MHz, respectively, is to raise the power level of their OOB and spurious emissions relative to the power levels observed on their fundamental frequencies. In other words, 10 or 20 MHz wide LTE receivers will see the OOB and spurious levels of these radars as being higher than shown in the data graphs in this report. As documented in Appendix G of [7], the amount of increase can be expected to be about 15log of the bandwidth increase.6 For the Shipborne Radar 1, for example, 15log(20/1) = 20 dB higher OOB and spurious levels (relative to the measured power at the radar fundamental) than shown in Figures 5 and 6. For Shipborne Radar 3, for example, 15log(20/8) = 6 dB higher OOB and spurious levels to be expected in a 20 MHz wide LTE receiver than shown in Figure 7.
6 Theoretically, the measured power levels of peak-detected pulsed emissions should vary as 20log of the bandwidth ratio while peak-detected noise should vary as 10log of the bandwidth ratio. The empirically observed 15log variation in peak-detected spurious and OOB pulsed-spectrum emission power occurs because those emissions are neither purely pulsed signal nor pure noise, as evidenced by the rabbit ears effect. They are in-between the states of pure pulses and noise, and their physical behavior reflects this fact with the coefficient of 15 in their rate of power variation with bandwidth.
16
4.3 Recommendations for Future Work
• Based on results of previous NTIA investigations of radar-to-earth station interference [12], LTE receivers may experience RF front end saturation and power overload in littoral zones. Therefore, 3.5 GHz LTE receivers should be tested, when they become available from manufacturers, to determine the non-linear effects of saturation and front-end overload from radar signals.
• The frequency domain responses of the IF stages of additional 3.5 GHz radar receivers and LTE stations need to be measured or acquired in order to perform frequency dependent rejection (FDR) calculations for spectrum sharing.
• The effects of a variety of radar beam-dwell periods should be examined for LTE base station receivers.
• Using data from this report and from the tasking described above, frequency-distance separation curves need to be developed for spectrum sharing between 3.5 GHz radars and LTE systems.
The final step in all of this work will be a comparison of the frequency-distance separation curves (including 3.5 GHz propagation characteristics) for radar-to-LTE interference and LTE-to-radar interference. That comparison will determine which scenario (which interference direction) is the limiting factor for future band sharing.
17

5. REFERENCES
[1] Federal Communications Commission, “Proposal to Create a Citizen’s Broadband Service in the 3550-3650 MHz Band,” FCC Docket No. 12-354, 12 Dec. 2012. http://www.fcc.gov/document/enabling-innovative-small-cell-use-35-ghz-band-nprm-order
[2] Federal Communications Commission, “Amendment to the Commission’s Rules with Regard to Commercial Operations in the Band 3550-3650 MHz,” FCC Gaussian noise Docket No. 12-354, 23 Apr. 2014. http://apps.fcc.gov/ecfs/document/view?id=7521099242
[3] U.S. Dept. of Commerce, National Telecommunications and Information Administration, “An Assessment of the Near-Term Viability of Accommodating Wireless Broadband Systems in the 1675-1710 MHz, 1755-1780 MHz, 3500-3650 MHz, 4200-4220 MHz and 4380-4400 MHz Bands (President's Spectrum Plan Report),”Oct. 2010. http://www.ntia.doc.gov/files/ntia/publications/fasttrackevaluation_11152010.pdf
[4] Sanders, F. H., J. E. Carroll, G. A. Sanders and R. L. Sole, “Effects of Radar Interference on LTE Base Station Receiver Performance,” NTIA Technical Report TR-14-499, U.S. Dept. of Commerce, Dec. 2013. http://www.its.bldrdoc.gov/publications/2742.aspx
[5] Sanders, G. A., J. E. Carroll, G. A. Sanders and R. L. Sole, “Effects of Radar Interference on LTE (FDD) eNodeB and UE Receiver Performance in the 3.5 GHz Band,” NTIA Technical Report TR-14-506, U.S. Dept. of Commerce, Jul. 2014. http://www.its.bldrdoc.gov/publications/2759.aspx
[6] Sanders, F. H., J. E. Carroll, G. A. Sanders, R. L. Sole, R. J. Achatz and L. S. Cohen, “EMC Measurements for Spectrum Sharing Between LTE Signals and Radar Receivers,” NTIA Technical Report TR-14-507, U.S. Dept. of Commerce, Jul. 2014. http://www.its.bldrdoc.gov/publications/2760.aspx
[7] Sanders, F. H., R. L. Hinkle and B. J. Ramsey, “Measurement Procedures for the Radar Spectrum Engineering Criteria (RSEC),” NTIA Technical Report TR-05-420, U.S. Dept. of Commerce, Mar. 2005. http://www.its.bldrdoc.gov/publications/2450.aspx
[8] Cotton, M. G. and Dalke, R., “Spectrum Occupancy Measurements of the 3550–3650 MHz Maritime Radar Band Near San Diego, California,” NTIA Technical Report TR-14-500, U.S. Dept. of Commerce, Jan. 2014. http://www.its.bldrdoc.gov/publications/2747.aspx
[9] Matheson, R. J., J. D. Smilley, G. D. Falcon and V. S. Lawrence, “Output Tube Emission Characteristics of Operational Radars,” NTIA Technical Report TR-82-92, U.S. Dept. of Commerce, Jan. 1982. http://www.its.bldrdoc.gov/publications/2081.aspx
[10] Chapter 5 of “Manual of Regulations and Procedures for Federal Radio Frequency Management (Redbook),” U.S. Dept. of Commerce, May 2013 edition, http://www.ntia.doc.gov/page/2011/manual-regulations-and-procedures-federal-radio-frequency-management-redbook
18
[11] Sanders, F. H., “The Rabbit Ears Pulse Envelope Phenomenon in Off-Fundamental Detection of Pulsed Signals,” NTIA Technical Report TR-12-487, U.S. Dept. of Commerce, Jul. 2012. http://www.its.bldrdoc.gov/publications/2678.aspx
[12] Sanders, F. H., R. L. Hinkle and B. J. Ramsey “Analysis of Electromagnetic Compatibility Between Radar Stations and 4 GHz Fixed-Satellite Earth Stations,” NTIA Technical Report TR-94-313, U.S. Dept. of Commerce, Jul. 1994. http://www.its.bldrdoc.gov/publications/2340.aspx
19
NTIA FORM 29 U.S. DEPARTMENT OF COMMERCE (4-80) NATIONAL TELECOMMUNICATIONS AND INFORMATION ADMINISTRATION
BIBLIOGRAPHIC DATA SHEET
1. PUBLICATION NO. TR-15-510
2. Government Accession No.
3. Recipient’s Accession No.
4. TITLE AND SUBTITLE Measurements of Selected Navy Radar Emissions for Electromagnetic Compatibility Analyses
5. Publication Date October 2014 6. Performing Organization Code NTIA ITS.T/NTIA OSM
7. AUTHOR(S) Frank H. Sanders, John E. Carroll, Geoffrey A. Sanders, Lawrence S. Cohen
9. Project/Task/Work Unit No. 6469000-200 8. PERFORMING ORGANIZATION NAME AND ADDRESS
Institute for Telecommunication Sciences National Telecommunications & Information Administration U.S. Department of Commerce 325 Broadway Boulder, CO 80305
10. Contract/Grant Number.
11. Sponsoring Organization Name and Address National Telecommunications & Information Administration Herbert C. Hoover Building 14th & Constitution Ave., NW Washington, DC 20230
12. Type of Report and Period Covered
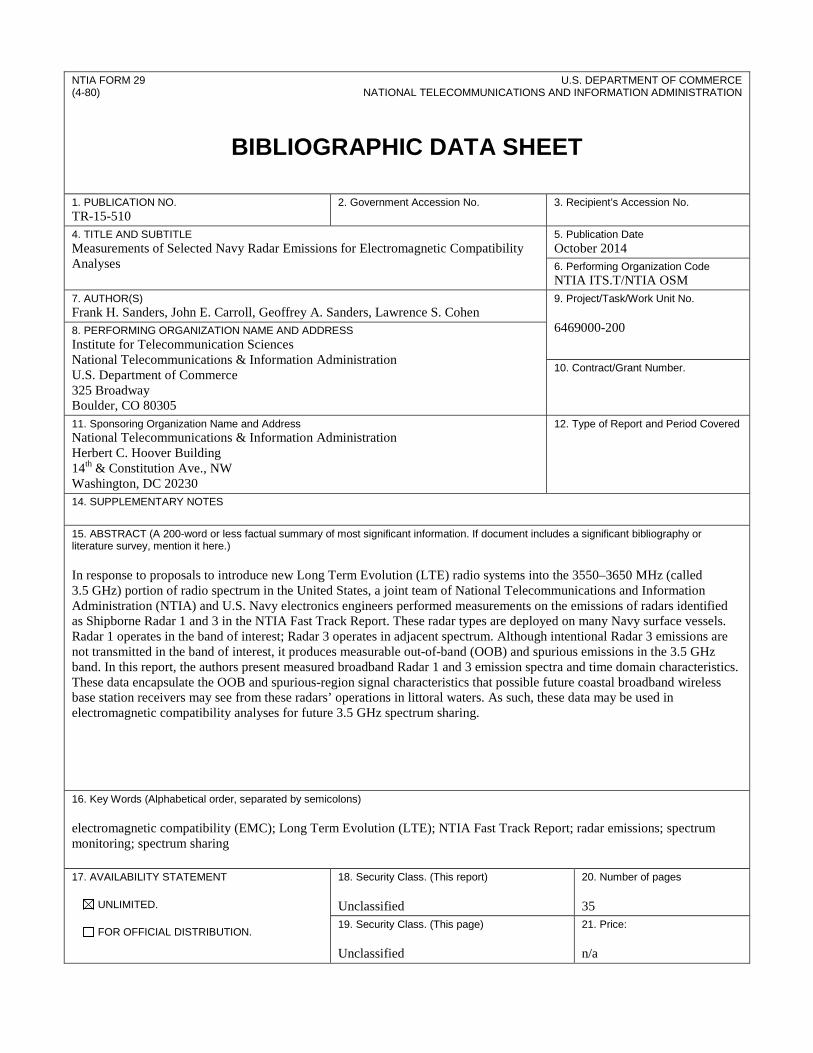
14. SUPPLEMENTARY NOTES 15. ABSTRACT (A 200-word or less factual summary of most significant information. If document includes a significant bibliography or literature survey, mention it here.) In response to proposals to introduce new Long Term Evolution (LTE) radio systems into the 3550–3650 MHz (called 3.5 GHz) portion of radio spectrum in the United States, a joint team of National Telecommunications and Information Administration (NTIA) and U.S. Navy electronics engineers performed measurements on the emissions of radars identified as Shipborne Radar 1 and 3 in the NTIA Fast Track Report. These radar types are deployed on many Navy surface vessels. Radar 1 operates in the band of interest; Radar 3 operates in adjacent spectrum. Although intentional Radar 3 emissions are not transmitted in the band of interest, it produces measurable out-of-band (OOB) and spurious emissions in the 3.5 GHz band. In this report, the authors present measured broadband Radar 1 and 3 emission spectra and time domain characteristics. These data encapsulate the OOB and spurious-region signal characteristics that possible future coastal broadband wireless base station receivers may see from these radars’ operations in littoral waters. As such, these data may be used in electromagnetic compatibility analyses for future 3.5 GHz spectrum sharing.
16. Key Words (Alphabetical order, separated by semicolons) electromagnetic compatibility (EMC); Long Term Evolution (LTE); NTIA Fast Track Report; radar emissions; spectrum monitoring; spectrum sharing 17. AVAILABILITY STATEMENT UNLIMITED. FOR OFFICIAL DISTRIBUTION.
18. Security Class. (This report)
Unclassified
20. Number of pages 35
19. Security Class. (This page)
Unclassified
21. Price: n/a
NTIA FORMAL PUBLICATION SERIES NTIA MONOGRAPH (MG)
A scholarly, professionally oriented publication dealing with state-of-the-art research or an authoritative treatment of a broad area. Expected to have long-lasting value.
NTIA SPECIAL PUBLICATION (SP)
Conference proceedings, bibliographies, selected speeches, course and instructional materials, directories, and major studies mandated by Congress.
NTIA REPORT (TR)
Important contributions to existing knowledge of less breadth than a monograph, such as results of completed projects and major activities. Subsets of this series include:
JOINT NTIA/OTHER-AGENCY REPORT (JR)
This report receives both local NTIA and other agency review. Both agencies’ logos and report series numbering appear on the cover.
NTIA SOFTWARE & DATA PRODUCTS (SD)
Software such as programs, test data, and sound/video files. This series can be used to transfer technology to U.S. industry.
NTIA HANDBOOK (HB)
Information pertaining to technical procedures, reference and data guides, and formal user's manuals that are expected to be pertinent for a long time.
NTIA TECHNICAL MEMORANDUM (TM)
Technical information typically of less breadth than an NTIA Report. The series includes data, preliminary project results, and information for a specific, limited audience.
For information about NTIA publications, contact the NTIA/ITS Technical Publications Office at 325 Broadway, Boulder, CO, 80305 Tel. (303) 497-3572 or e-mail [email protected].