measurement and prediction of the rate of loss of sulphur dioxide from beer
TRANSCRIPT

J Sci Food Agric 1996,70,337-340
Measurement and Prediction of the Rate of Loss of Sulphur Dioxide from Beer David R Ilett, Shaun Burke and William J Simpson* BRF International, Nutfield, Redhill, Surrey, RH1 4HY, UK (Received 4 May 1995; revised version received 24 July 1995; accepted 30 August 1995)
Abstract: The total sulphur dioxide (SO,) concentration of beers decreases during storage, essentially following first-order kinetics. Beers differ in the rate at which they lose SO,. Half-lives for total SO, loss in 22 commercial beers stored at 25°C ranged from 37.7 days to more than 1000 days. The rate of loss could be predicted from beer compositional data using partial least squares (PLS) regres- sion modelling. Initial concentrations of total SO,, sugars and ions were impor- tant factors in the models.
Key words: beer, sulphur dioxide, multivariate statistics.
INTRODUCTION
In beer, sulphur dioxide (SO,) has antimicrobial activ- ity, antioxidant activity and masks the flavour of some carbonyl compounds. The concentration of SO, in beer decreases during storage. The rate of loss approximates to first-order kinetics, is proportional to storage tem- perature and depends to some extent on initial total SO, concentration (Ilett and Simpson 1995). The rate and extent of SO, loss has implications for maintenance of fresh flavour, since SO, masks the flavour of some carbonyl compounds in beer. In this study, we mea- sured the rate at which total SO, was lost from different commercial lager beers. Multivariate statistical methods were then used to model SO, loss rates using data obtained from analysis of beer composition.
MATERIALS AND METHODS
Twenty two locally purchased canned and bottled lager beers were used. Total sulphur dioxide contents were measured, in triplicate, using the p-rosaniline assay (ASBC 1992) on five occasions, approximately equally spaced over an 80 days period of storage at 25°C. Rates of total SO, loss were calculated (as half-lives) from plots of log[SO,] against time. In addition, the initial chemical and physical composition of the beers was
* To whom correspondence should be addressed.
determined by measuring 37 parameters (Table 1). These were standard beer analyses, supplemented with specialist analyses. Dissolved oxygen contents were not measured, as commercial beers are packaged in such a way as to exclude oxygen, and measurements made some time after packaging are of little relevance.
Attempts were made to predict the rate of total SO, loss using partial least squares (PLS) regression and neural network (NN) modelling using the Unscrambler (version 5.5) and Neural Unscrambler (version 2.0) soft- ware packages, respectively (CAM0 A/S, N-7011, Trondheim, Norway). All PLS calibrations were carried out using the following settings:
model centre = mean values for the variables; default weights = l/standard deviation; outlier detection = on (limit = 3.00); leverage detection = on (limit = 0.900); calibration method = PLS1; validation method = random cross-validation in the case of preliminary models (number of segments = 21) or test set validation in the case of the final model (number of beers in test set = 5).
For a detailed discussion of the significance of these parameters see Marten and Naes (1993).
RESULTS AND DISCUSSION
Loss of total SO, from the beers approximated to first- order kinetics, confirming previous findings (Ilett and Simpson 1995). However, the rate of total SO, loss
337 J Sci Food Agric 0022-5142/96/$09.00 0 1996 SCI. Printed in Great Britain

338
TABLE 1 Beer composition (summary statistics on 16 canned and six bottled lager beers)
D R Ilett et a1
Analysis Method" Mean Standard Minimum Maximum deviation
Initial SO, (mg litre- ') PH Colour ("EBC) Bitternees (BU) Chloride (mg litre- ') Nitrate (mg litre- ') Phosphate (mg litre- ') Sulphate (mg litre - I )
Sodium (mg litre- ') Ammonium (mg litre- ') Potassium (mg litre-') Magnesium (mg litre- ') Calcium (mg litre - ') Present gravity (degrees - 1000) Attenuation limit (degrees - 1000) Carbon dioxide (g litre- ') Head retention value (Sec) Free amino nitrogen (mg litre- ') Lange haze (Haze units) Ethanol (YO vol) Total Soluble Nitrogen (mg litre-') Diacetyl (free) (mg litre - ') 2,3-Pentanedione (mg litre-') Acetaldehyde (mg litre-') DMS (pg litre-') Ethyl acetate (mg litre-') iso-Butyl Acetate (mg litre-') iso-Amy1 Acetate (mg litre-. ') Ethyl hexanoate (mg litre- ') n-Propanol (mg Iitre- ') iso-Butanol (mg litre-') iso-Amy1 alcohol (mg litre- ') Dextrins (g litre- ') Fructose (g litre- ') Glucose (g litre- l )
Maltose (g litre-') Maltotriose (g litre-') Total sugars (g litre-') SO, half-life (days)
Anon (1975) IOB IOB IOB Ion exchange chromatography Ion exchange chromatography Ion exchange chromatography Ion exchange chromatography Ion exchange chromatography Ion exchange chromatography Ion exchange chromatography Ion exchange chromatography Ion exchange chromatography IOB IOB IOB EBC IOB EBC IOB IOB IOB IOB IOB IOB IOB IOB IOB IOB IOB IOB IOB HPLC HPLC HPLC HPLC HPLC IOB Ilett and Simpson (1995)
4.29 4.24 9.40
19.23 199.00 12.77
457.50 197.86 56.86 19.45
374.45 56.50 3 1 *OO 7.75 5.76 5.19
79.91 66.17 0.59 4.46
529.91 0.03 0.02 4.08
40,77 15.85 0.04 2.26 0.13
13.43 13.98 59.59 13.06 0.5 1 0.91 4.09 2.04
20.62 139.29
3.43 0.18 1.62 5.52
78.70 9.59
195.45 101.12 49.99 12.06
140.50 16-48 26.07
3.43 3.42 0.17 9.86
29.02 0.24 1.96
158.22 0.02 0.01 1.99
25.45 9.69 0.03 4.70 0.07 5.43 5.82
19.90 10.51 0.70 1.50 3.54 1.01
10.46 205.16
1.1 3.92 6
12 77 0
208 50 12 2
185 32 11
- 1.4 0.28
4.8 56 34 0.26 0.95
320 0 0 1.3 0 1.1 0 0.09 0.02 2.2 1.4 7.6 0.86 0.05 0.07 0.74 0.17 5.39
37.7
14.7
12 34
369 44
835 378 209 48
761 87
130
13
99 136
4.58
13.1
5.4
1.14 9.49
0.07 0.05 9.4
42.9
888
96
0.12
0.34 23
26.9 29.1
107 45.36
3.32 6.51
14.12 3.76
52.38 1O3Sb
~ ~~
IOB, Institute of Brewing approved method; EBC, European Brewery Convention approved method; HPLC, high per-
Beer i: Outlier in data set excluded from PLS analysis. formance liquid chromatography.
varied. In the case of one beer (i), the rate of total SO, loss was very low, the half-life being in excess of 1000 days. Total SO, was lost more rapidly in the other 21 beers, for which the half-lives ranged from 37.7 to 221 days (mean 96.5 days excluding beer i).
Beer i (SO, half-life = 1038 days) was removed from the data set because it was identified as a outlier. Using the 'Unscrambler', outliers are detected by testing the residuals for each new PLS component included in a model (Martens and Nzs 1993). The correlation matrix for the remaining 21 beers showed that four individual
parameters correlated significantly (Pearson's corre- lation coefficient test, test value = 0.433, n = 21, t o 5% significance level) with the rate of total SO, loss. These parameters were phosphate (r = 0.492), potassium (r = 0.496), magnesium (r = 0.541) and maltose (r = 0.455). It is pertinent to note that two significant correlations among the 37 variables would have been expected by chance alone.
To improve the PLS model, six compositional parameters (pH, CO, , diacetyl and 2,3-pentanedione, iso-butylacetate and ethyl hexanoate) were removed
Prediction of loss of total SO2 339
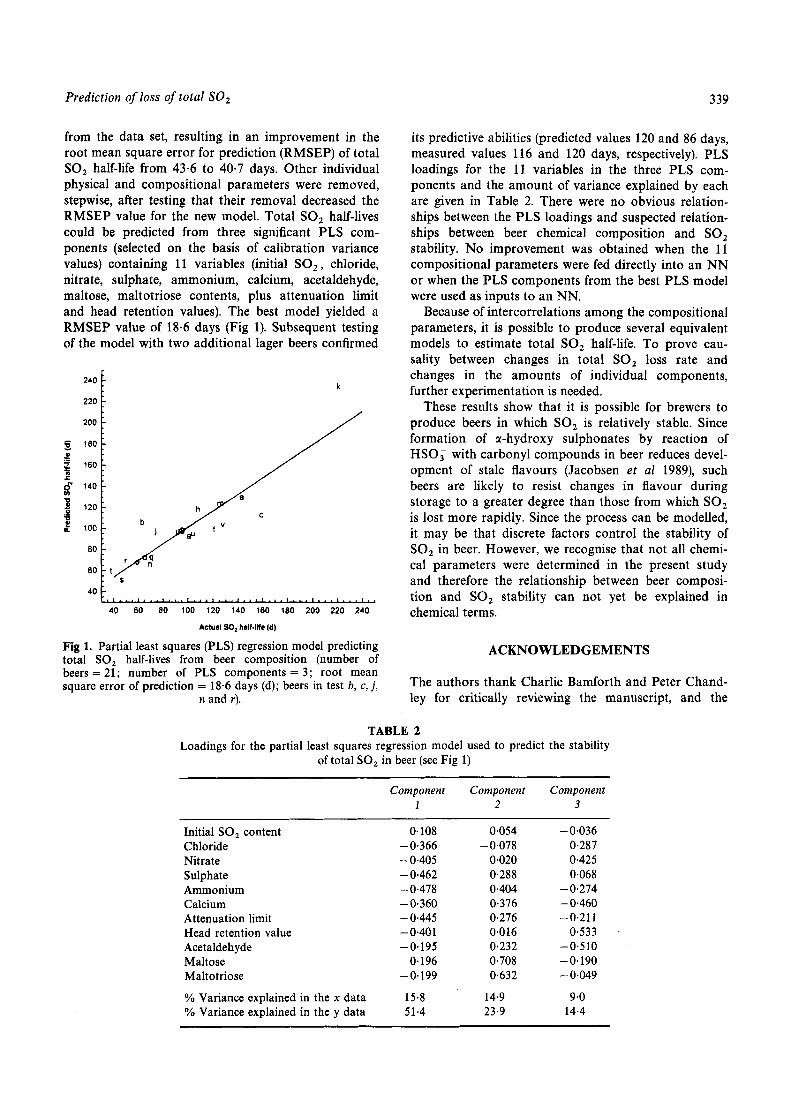
from the data set, resulting in an improvement in the root mean square error for prediction (RMSEP) of total SO, half-life from 43.6 to 40.7 days. Other individual physical and compositional parameters were removed, stepwise, after testing that their removal decreased the RMSEP value for the new model. Total SO, half-lives could be predicted from three significant PLS com- ponents (selected on the basis of calibration variance values) containing 11 variables (initial SO, , chloride, nitrate, sulphate, ammonium, calcium, acetaldehyde, maltose, maltotriose contents, plus attenuation limit and head retention values). The best model yielded a RMSEP value of 18.6 days (Fig 1). Subsequent testing of the model with two additional lager beers confirmed
k
/
80 L / -
40 60 80 100 120 140 160 180 200 220 240
Actual SO, half-Ilk (d)
Fig 1. Partial least squares (PLS) regression model predicting total SO, half-lives from beer composition (number of
its predictive abilities (predicted values 120 and 86 days, measured values 116 and 120 days, respectively). PLS loadings for the 11 variables in the three PLS com- ponents and the amount of variance explained by each are given in Table 2. There were no obvious relation- ships between the PLS loadings and suspected relation- ships between beer chemical composition and SO, stability. No improvement was obtained when the 11 compositional parameters were fed directly into an NN or when the PLS components from the best PLS model were used as inputs to an NN.
Because of intercorrelations among the compositional parameters, it is possible to produce several equivalent models to estimate total SO, half-life. To prove cau- sality between changes in total SO, loss rate and changes in the amounts of individual components, further experimentation is needed.
These results show that it is possible for brewers to produce beers in which SO, is relatively stable. Since formation of a-hydroxy sulphonates by reaction of HSO; with carbonyl compounds in beer reduces devel- opment of stale flavours (Jacobsen et a1 1989), such beers are likely to resist changes in flavour during storage to a greater degree than those from which SO, is lost more rapidly. Since the process can be modelled, it may be that discrete factors control the stability of SO, in beer. However, we recognise that not all chemi- cal parameters were determined in the present study and therefore the relationship between beer composi- tion and SO, stability can not yet be explained in chemical terms.
ACKNOWLEDGEMENTS
beers = 2i; number of PLS componknts = 3; ‘root mean square error of prediction = 18.6 days (d); beers in test b, c, j ,
n and r). The authors thank Charlie Bamforth and Peter Chand- ley for critically reviewing the manuscript, and the
TABLE 2 Loadings for the partial least squares regression model used to predict the stability
of total SO, in beer (see Fig 1)
Component Component Component 1 2 3
-~ ~
Initial SO, content Chloride Nitrate Sulphate Ammonium Calcium Attenuation limit Head retention value Acetaldehyde Maltose Maltotriose
% Variance explained in the x data % Variance explained in the y data
0.108 - 0.366 - 0.405 - 0.462 - 0.478 - 0.360 -0.445 - 0.401 -0.195
0.196 -0.199
15.8 51.4
0.054 - 0.078
0.020 0.288 0.404 0.376 0.276 0.016 0,232 0.708 0.632
14.9 23.9
- 0.036 0.287 0.425
- 0.068 - 0.274 - 0.460 -0.211
0.533 -0.510 -0.190 - 0.049
9.0 14.4

340 D R Ilett et a1
Director General of BRF International for permission to publish.
Iktt D R, Simpson W J 1995 Loss of sulphur dioxide during storage of bottled and canned beers. Food Res Int 28 393- 396.
Jacobsen T, Hage T, Lie S 1989 Determination of SO, and oxygen during storage of bottled beer. In: European Brewery Convention, Proceedings of the 22nd Congress. IRL Press, Oxford, UK, pp 733-739.
Martens H, NZs T 1993 In: Multivariate Calibration. John Wiley and Sons Ltd, Chichester, UK, pp 267-296.
REFERENCES
ASBC 1992 Methods of Analysis (8th edn.) American Society of Brewing Chemists, St Paul, MN, USA, Method Beer- 31