sulphur dioxide, hydrogen sulphide, volatile organic ... · sulphur dioxide, hydrogen sulphide,...
TRANSCRIPT

International Journal of Scientific & Engineering Research, Volume 5, Issue 8,August-2014 1262 ISSN 2229-5518
IJSER © 2014 http://www.ijser.org
Title: The impact of gas flaring on the air quality: a case study of Izombe in earstern Nigeria
Author: Chiemezie Nwakire
Abstract:
The impact of gas flaring on the air quality using Izombe as a case study was investigated using chemical air pollutants. The chemical pollutants investigated were Nitrogen dioxide, Sulphur dioxide, Hydrogen Sulphide, Volatile Organic Compounds, Carbon monoxide and Suspended Particulate Matter. Three samples were taken for each of the chemical pollutants at a distance of 100m, 200m and 300m away from the flare stack. Data collected at these distances were analyzed using both descriptive statistics and non-parametric technique. The analysis showed that the mean concentration of these pollutants was 0.83ppm for NO2, 1.91ppm for SO2, 0.95ppm for H2S, 2.96ppm for VOCs, 1.61ppm for CO, and 7.11ppm for SPM; all exceeded Federal Environmental Protection Agency (FEPA) stipulated Standard. The adoption of current reliable and efficient technologies for emission control was recommended.
Key words: Gas flaring, air quality, emission control, FEPA, chemical air pollutants
1. INTRODUCTION
The atmosphere (air) is a protective blanket which nurtures life on the earth surface and
protects it from the hostile environment of outer space. It is composed of 78.1% Nitrogen,
20.8% Oxygen and a number of other gases such as Argon, Carbon dioxide, Methane and
water vapour that total about 1%, as can be seen in Table 1. Most of the air is held close to
the earth surface by the gravitational force (Enger and Smith, 2004).
1.1 Background of study
Air pollution is the presence in the outer door atmosphere of one or more contaminants such
as dust, mist, Odour, smoke or vapour in such quantities, characteristics and duration as to
make them actually harmful or potentially injurious to human, plants and animals or property
or which unreasonably interfere with the comfort of life and property (Villasenor et al.,
IJSER

International Journal of Scientific & Engineering Research, Volume 5, Issue 8,August-2014 1263 ISSN 2229-5518
IJSER © 2014 http://www.ijser.org
2003). Man in his quest to improve his standard of living through technological development
introduces substances that pollute the air and other areas of the environment (Briggs, 2005).
This concept of air pollution has been observed to cause death and respiratory disease to
living things as well as damage to monuments and other archaeological structures in the past
(Akpan, 2008). The major sources of air pollution are transportation engines, power and heat
generation, industrial processes, burning of solid waste and flaring of natural gases associated
with crude oil extraction.
In Nigeria, air pollution has been occurring long before independence. One of the major
sources of air pollution in Nigeria today is the flaring of natural gas in the Niger Delta region.
Nigeria is notably “the world’s biggest flarer” of natural gas. There are over 1000 gas flaring
points in Nigeria (Efe, 2003) with at least 10 of them visible from outer space through
satellites.
Gas flaring is the controlled burning of waste natural gases associated with oil production.
One of the main sources is the “solution gas” trapped in underground oil supplies, which is
released when oil is brought to the surface. Gas flaring is used to eliminate gas when the
volume is insufficient to warrant recovery or collecting it is not economical (UKOOA, 2005).
Shewechuk (2002, in Akpan 2008), stated that world-wide, about 115 billion cubic meters of
gas are flared or vented into the atmosphere every year. Of this quantity, Nigeria alone flares
almost 23billion cubic meters every year. The consequences of this act of excessive flaring is
of a large contribution to global warming and climate change due to the emission of large
quantities of the two major green house gases carbon dioxide and methane (Briggs, 2005).
Another major consequence of gas flaring is sour gas (Hydrogen Sulphide) and sulphur
oxides emission, the end product of these compounds when it combines with atmospheric
oxygen and water is acid rain.
Gas flaring in Nigeria also has other direct consequences on the local environment. This can
easily be seen as all vegetation surrounding is damaged and some are completely destroyed
for as much as 50meters and more (Efe, 2003). The increase in temperature as well as the
release of sooth and other toxic gases emanating from the flare site causes immense health
problems and infrastructural damage in the communities nearest to flare sites (Nwaugo et al.,
2006). In local Nigerian communities such as Izombe in Oguta Local Government Area of
IJSER

International Journal of Scientific & Engineering Research, Volume 5, Issue 8,August-2014 1264 ISSN 2229-5518
IJSER © 2014 http://www.ijser.org
Imo state, two flare sites exist and associated gases have been flared for over 20 years now,
the impact of gas flaring on the lives of the inhabitants and their environment are profound.
1.2 Statement of problem
There has been a phenomenal damage to the quality of air in Izombe community in Oguta
Local Government Area of Imo state, due to high level of gas flaring emission into the air.
The gases released into the atmosphere as a result of gas flaring includes; Carbon monoxide
(CO), Sulphur dioxide (SO2), Nitrogen dioxide (NO2), Hydrogen Sulphide (H2S), Methane,
Soot, and Suspended Particulate Matter (SPM) have resulted to damages in the quality of air
and human health in the community.
1.3 Aims and objectives
The aim of this work is to investigate and assess the impact of gas flaring on the air quality.
This aim will be achieved through the following objectives:
To determine the level of air pollutants such as carbon monoxide (CO), sulphur
dioxide (SO2), Nitrogen dioxide (NO2), Particulate matter (soot) and Hydrogen
Sulphide (H2S) in Izombe community in Oguta Local Government Area of Imo state,
To assess the impact of the pollutant on the physical environment such as vegetation,
structures and monuments.
To provide useful guide and suggestion that will help in the cleanliness and
improvement of aesthetic nature of the affected environment.
To recommend existing technologies for curbing gas flaring to protect our
atmosphere.
1.4 Significance of the study
Air pollution through gas flaring emissions is a serious problem confronting the inhabitants
of Izombe community in Oguta Local Government Area of Imo state. There is need to
highlight the hazardous levels of air pollutants concentration in the air. This will help to
enlighten people on the present and future effects of the pollutants on their air quality.
IJSER

International Journal of Scientific & Engineering Research, Volume 5, Issue 8,August-2014 1265 ISSN 2229-5518
IJSER © 2014 http://www.ijser.org
The study will also provide reference material for further research work in areas with similar
problems.
1.5 Scope of the study
The major area of concentration of this study is Izombe community in Oguta Local
Government Area of Imo State, Nigeria.
The study will cover sampling various air pollutants at the flare sites and interpreting the
sample results. It will also include observations of the effects of the pollutants in the area.
2. MATERIAL AND METHOD
Izombe is situated in Oguta, Imo, Nigeria. Its geographical co-ordinates are 5052’00” North,
6052’0’’ East (Fig. 1). Izombe is a community in Oguta (Fig. 2) local government Area of Imo
state, covering a land mass of 8,665.6 hectares of land. It covers a land mass of 8,665.6
hectares of land. However figure 3 shows the particular area of the study which was Izombe
and its neighboring towns.
2.1 Climatic condition
Izombe community has a humid tropical climate. The climate is extremely influenced by its
nearness to the Atlantic Ocean. Two seasons are experienced in this community (wet and
dry). The dry seasons runs from November to March of the following year while Wet season
starts April to October of the same year.
The area experiences high annual rainfall of 2200mm. Rainfall peaks are June and September
and a short break of low rainfall in August.
Relative humidity of Izombe community is usually about 85% in the rainy season and
decreases to 45% in dry season with ambient temperature ranging from 24.5oC to 33oC in wet
season and 25.5oC to 37oC in dry season (Nwaugo et al., 2006)
IJSER

International Journal of Scientific & Engineering Research, Volume 5, Issue 8,August-2014 1266 ISSN 2229-5518
IJSER © 2014 http://www.ijser.org
The winds in Izombe community are south Westerly and North Eastly. The south Westerly,
wind are experienced in the area in the rainy season and wind speed ranges from 0.3ms-1 to
1.5ms-1 in rainy season and 0.3ms-1 to 45ms-1 in dry season.
The south Westerly wind is from the Atlantic Ocean while the East and West Easterly winds
are variants of the North-Eastern air mass from the Sahara desert (Ministry of Aviation Imo
state, 2004).
2.2 Reasearch methodology
A reconnaissance survey was carried out around the community and at the sites where the
natural gas is flared. The survey was conducted at production periods. This survey was based
on the direct participation and observation. During the reconnaissance survey, the various
points at which gas is flared were identified. Also another sample was identified at the
community itself where the impact of the flare is paramount.
The approximate distance of the flaring site from the community is 1000meter. The samples
were taken from a distance of 100m, 200m, 300m and a control outside the flare area. The
readings were taken and the average noted.
2.3 Types of data needed
The types of data needed by the researchers are the chemical aspect of the gaseous pollutants
and the atmospheric particulate quality in the area. The pollutants needed by the researcher
include:
1. Carbon monoxide
2. Nitrogen dioxide
3. Nitrous oxides
4. Sulphur dioxide
5. Hydrogen sulphide
6. Volatile Organic Compounds (VOCs)
7. Suspended particulate matter
The above are the atmospheric particulate quality and chemical pollutants needed by the
researcher for the purpose of analyzing the effect of gas flaring on Izombe Community.
IJSER

International Journal of Scientific & Engineering Research, Volume 5, Issue 8,August-2014 1267 ISSN 2229-5518
IJSER © 2014 http://www.ijser.org
2.4 Method of data collection
Data was collected through primary and secondary sources.
2.4.1 Primary sources: Primary sources are means through which raw and original research
data can be generated for analysis and interpretation. The primary sources used are direct
observations and sampling done with the multiple gas monitor equipment.
During the reconnaissance survey, visibilities through the sky were observed; notes were
taken in the following area;
• Roofs of buildings in the community and neighbouring communities like Ngbele.
• Sing post and status that are vulnerable to industrial (gas flare) emission impact.
• The effects of pollutants on leaves of the plants within the site were gas is flared.
2.4.2 Secondary sources: The secondary data sources were obtained from works by other
researcher fgathered in:
• Environmental Journals
• Environmental Text Books
• Scientific Magazines
• Seminars
2.5 Method of sampling and analysis
The analysis was dependent on an in-situ test carried out using the Multi-Gas monitor and a
suspended particulate matter meter.
These two machines mentioned above are used by Environmental Agencies (FEPA) to detect
gases and particulate matter in hazardous environments. It is programmed to provide
continuous exposure monitoring of toxic organic and inorganic gases, oxygen combustible
gases and suspended particulate matter for workers in hazardous environment.
The location was approximately three quarters of the way down along straight run of
ductwork (Bodger, 2003). The flow was relatively calm in the study location and as a result,
IJSER

International Journal of Scientific & Engineering Research, Volume 5, Issue 8,August-2014 1268 ISSN 2229-5518
IJSER © 2014 http://www.ijser.org
the sample was more representative for stationary sources such as stack emission, the
sampling site and the number of traverse points used for the collection affects the quality of
data. Depending on the stack geometry, a cross section of the stack perpendicular to the gas
flow was divided into specified number of equal area. The required number and location of
traverse points was determined by gas velocity measurement and sample extraction.
2.5.1 Sampling operation: Izombe gas flaring station was chosen for this work. Air samples
were collected from three spots of the station. These were 100, 200 and 300 meters away
from the flare site and a control taken much outside the flow station area.
After confirming the battery level of the portable Multi-gas monitor (Fig. 4) and suspended
particulate matter meter (Fig. 5), the instruments were switched on and exposed up into the
atmosphere to a height of about 2 meters in the direction of the prevailing wind and readings
were taken and recorded at stability.
At each sampling point, three readings were taken within an interval of 5-10 minutes as soon
as the readings on the LCD screen normalize and were static. The values of the sample were
recorded and the instrument switched off. For each point three samples where taken and the
average recorded to remove bias.
3. RESULTS PRESENTATION
In table 2, three locations were tested for which are 100m, 200m and 300m away from the
flare point at the flow station. A control sample was collected at an area outside the flow
station for comparison. The concentration of NO2 varied with increase in distance away from
the flare point.
In table 3, the values for the concentration of sulphur dioxide gas emitted decreased as the
distance increased away from the flare point at the flow station. The control has the least
value of SO2 gas with value 0.61ppm.
In table 4, the values for the concentration of sulphur dioxide gas emitted decreased as the
distance increased away from the flare point at the flow station. H2S gas was not present at
the control.
IJSER

International Journal of Scientific & Engineering Research, Volume 5, Issue 8,August-2014 1269 ISSN 2229-5518
IJSER © 2014 http://www.ijser.org
In table 5, the values for the concentration of sulphur dioxide gas emitted decreased as the
distance increased away from the flare point at the flow station. VOCs gases were not present
at the control.
In table 6, the values for the concentration of Carbon monoxide gas emitted decreased as the
distance increased away from the flare point at the flow station. The control has the least
value of CO gas with value 0.67ppm which is below the FEPA standard.
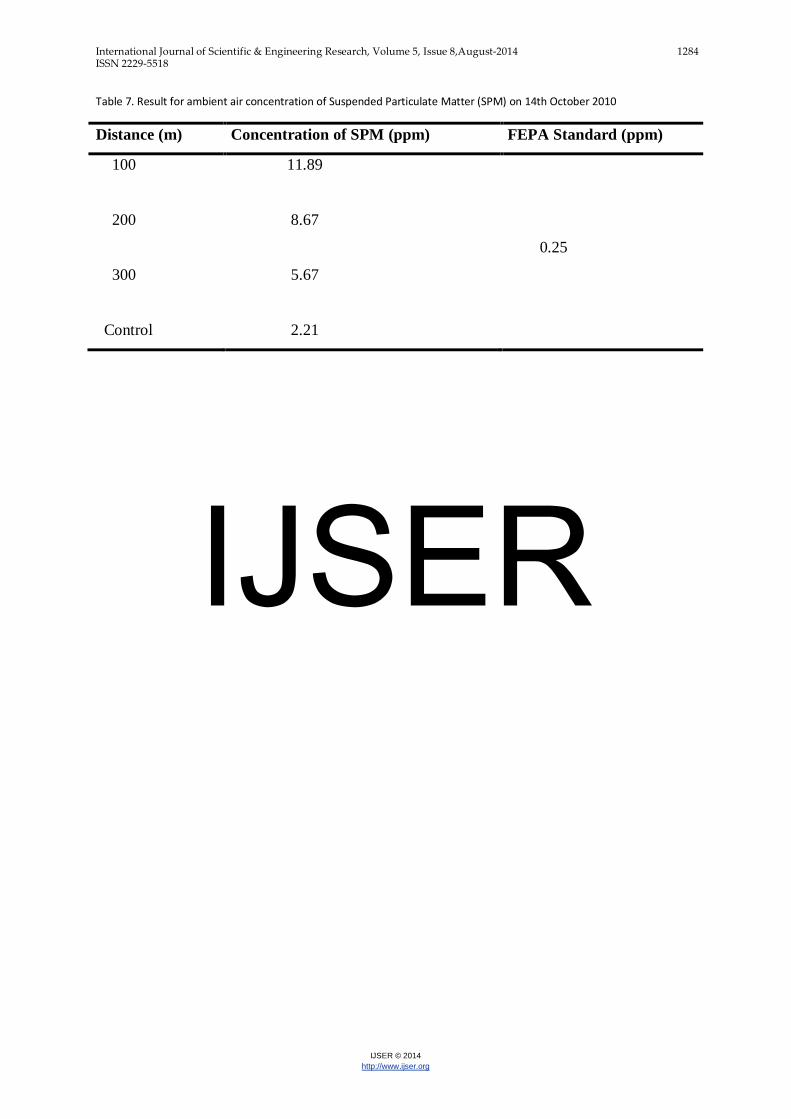
In table 7, all the readings exceeded FEPA stipulated standard including the control. The
concentration of suspended Particulate matter decreased with an increase in distance away
from the flare jets. The highest concentration was at a distance of 100m away from the flare
jet followed by 200m and 300m respectively.
From table 8, the mean concentration for NO2 in Izombe community is 0.83ppm, for SO2 the
mean concentration value is 1.91ppm, for H2S, the mean concentration value is 0.95ppm, for
CO, the mean concentration value is 2.96ppm, for VOCs, the mean concentration value is
1.61ppm and for SPM, the mean concentration value is 7.11ppm. Also the concentration of
Suspended particulate Matter (SPM) was found to be the highest with a value of 7.11ppm.
NO2 and H2S were found to be the lowest with a value of 0.83ppm and 0.95ppm
respectively.
3.1 Discussion
The results obtained are presented in the previously mentioned tables (see tables 2-8), the
analysis of the results showed that the concentration level of all pollutants sampled exceeded
the legal stipulated FEPA standard.
However, at the flow station examined, the highest concentration of NO2 was the samples
collected at a distance of 100m away from the flare jets, followed by 200m and 300m (see
table 2). There was not much difference between the 300m samples and the control.
A similar trend was also observed with the concentration of SO2 emitted. As expected, the
highest concentration of sulphur dioxide released was observed at a distance of 100m away
from the flare point. It gradually decreased away from the flare point. The difference between
300m and the control was significant (see table 3).
IJSER

International Journal of Scientific & Engineering Research, Volume 5, Issue 8,August-2014 1270 ISSN 2229-5518
IJSER © 2014 http://www.ijser.org
The same trends were observed in the concentration of H2S emitted. The concentration of
Hydrogen sulphide released at a distance of 100m was the highest followed by 200m and the
300m. The difference between the samples collected at a distance of 300m and the control in
the flow station examined was not significant (see table 4).
Table 5 shows that the gas flaring contributes the quality of volatile organic compounds
(VOCs) in the atmosphere as values obtained from 100m samples were the highest 3.01ppm.
At a distance of 200m (2.21ppm) of VOCs was detected. The valued reduced to 1.21ppm at a
distance of 300m away from the flare jet.
The results shown in table 6 prove that gas flaring contributes to the quantity of carbon in the
atmosphere. At a distance of 100m away from the flare jet, 5.31ppm of carbon monoxide was
emitted. The concentration reduced as I moved away from the flare jet. At a distance of 200m
(3.20ppm) of CO was obtained followed by 2.63ppm at a distance of 300m. The difference
between the sample collected at a distance of 300m away from the flare jet and the control
was significant.
The effect of Suspended Particulate Matter (SPM) when it’s above the FEPA permissible
limit on the atmosphere is experience in the (Izombe) community near the flare site. Table 7
reveals that SPM in Izombe flare site is above the FEPA standard for air. At a distance of
100m, (11.89ppm) of Suspended Particulate matter was emitted against 0.25ppm of FEPA
stipulated standard. Suspended Particulate Matter contributes to haze in the atmosphere there
by reducing visibility.
The results obtained in this work show a marked trend as all parameter considered showed a
gradient away from the flare points in the flow station. This picture indicates that crude oil
though is of high economic value to Nigeria has adverse gas flaring effect accompanying it
(Adeninye et al., 2003; Akpan, 2008; Atevure, 2005).
The high value of sulphur dioxide (SO2), Nitrogen dioxide (NO2) and Carbon monoxide
(CO) can be attributed to the constant flaring of natural gas. Atmospheric Sulphur, Nitrogen
and Carbon one force to combine with elemental Oxygen forming acidic oxides which
dissolves in rain water to produce dilute Sulphuric, Nitrous/Nitric and Carbonic acids
(Nwaugo et al., 2006; Botkin and Keller 1998). Similarly the SPM observed is highest at the
flare point as expected. The high particles emitted are as a direct effect of the heat (Leachey
IJSER

International Journal of Scientific & Engineering Research, Volume 5, Issue 8,August-2014 1271 ISSN 2229-5518
IJSER © 2014 http://www.ijser.org
et al., 2008). Gas flaring contributes to the quantity of the atmospheric pollutant examined in
the study area.
4. CONCLUSION
Gas flaring is a globally unacceptable act, which has a great number of implications on the
environment. This study has revealed yet another aspect of pollution on our environment. It
has shown that the air quality in Izombe Community has been affected by the activities of the
flow station in the area. The increase in the presence of all the air pollutants examined is as a
result of gases (fumes) emitted from the flaring jets at in the flow station.
Undoubtedly, man’s environment is continually suffering from different forms of
environmental abuse owing to man’s economic and technological activities. One of such is
the situation of Izombe ambient air as revealed by this research.
Acidification, loss of vegetation and health impairment (mostly respiratory problems and
sometimes cancer) are the outcome of these activities. Izombe community is not exempted
from these problems.
The worst is that this resultant impact will increase as the population continues to grow
especially in developing countries like Nigeria and Oil producing communities like Izombe.
Since the rise in the concentration levels of these pollutants is an “evil wind” that blows both
the local and global environment no good and since all evidence obtained in this study
suggests that air pollutants from Izombe ambient air are at high concentration levels and as
such are potential threat to human health and well being. The necessity is now overdue to
embark upon aggressive campaign from minimization and control of these pollutants.
It is expected in addition that this work will be improved upon by more sophisticated and
detailed studies and even taken further to examination of the health impacts of these
pollutants on people. And oil companies should not be opaque to funding of studies of this
kind but instead should be responsive and encourage more researchers by individuals and
Non Governmental Organizations (NGO’s).
IJSER

International Journal of Scientific & Engineering Research, Volume 5, Issue 8,August-2014 1272 ISSN 2229-5518
IJSER © 2014 http://www.ijser.org
5. REFERENCES
Adeniye E.O, Olusule R., Anyaye A. (2003). Environmental and scioeconomic impacts of oil spillage and gas flaring in the petroleum producing of Riverine Areas in Nigeria: The petroleum industry and Nigerian Environment. Proceedings of 2003 International Oil Seminar, NNPC, 3:130-35.
Atevure B.S (2005). Processes of Oil Production and Environmental Degradation: An Overview. Journal of Environmental Analysis 2: 76-85.
Akpan, E.E (2008). The impact of Oil Industry on Environmental degradation in Akwa Ibom State. Environmental Analyst., 4:18-32.
Bodger K. (2003). Fundamentals of Environmental Sampling, Government Institutes, Rockville M.D
Botkin D.B. and Keller E.A (1998). Environmental Science Earth as a living Planet. Second edition. John Wiley and Sons Canada.
Briggs G.A (2005). Plume rise Predictions. Lectures on Air pollution and Environmental Impact Analyses. American meteorological society: 59-111
Efe S.I. (2003). Effects of Gas Flaring on Temperature and Adjacent Vegetation in the Niger Delta Environment. International Journal of Environmental Issue 11(1) : 91-101.
Enger D. E. and Smith F. B., (2004) Environmental Science. A study of Interrelationships. New York. Mc Graw Hill: 386-414
Leachey D. M., Preston K. and Strosher M. (2008). Theoretical and Observational Assessments of Flare Efficiencies. Journal of Air Waste Management Association. 51(12):1610-1616. Nwaugo V.O., Onyeagba R.A., and Nwachukwu N.C. (2006). Effects of Gas Flaring on Soil Microbial Spectrum in Parts of Niger Delta area of Southern Nigeria. African Journal of Biotechnology 5(19): 1824-1826.
UKOOA (2005). United Kingdom Offshore Operator’s Association. Guidelines On Atmospheric Emissions Inventory: 431-501.
Villasenor R., et al. (2003). An Air Quality Emission Inventory offshore Operations. Journal of Atmospheric Environment 37:3713-3729.
IJSER

International Journal of Scientific & Engineering Research, Volume 5, Issue 8,August-2014 1273 ISSN 2229-5518
IJSER © 2014 http://www.ijser.org
Table 1. Composition of unpolluted dry air and the approximate total masses of the different constitutens of the atmosphere (Many trace gases are not listed)
Constituent Molecular
Formula Volume/Fraction
Total Mass (millions
metric tonnes)
Nitrogen
Oxygen
Argon
Carbon dioxide
Neon
Helium
Methane
Krypton
Hydrogen
Nitrous Oxide
Carbon monoxide
Ozone
Sulphur dioxide
Nitrogen dioxide
N2
O2
Ar
CO2
Ne
He
CH4
Kr
H2
N2O
CO
O3
SO2
NO2
78.09%
20.8%
0.93%
0.038%
18ppm
5.8ppm
1.3ppm
1ppm
0.5ppm
0.85ppm
0.1ppm
0.08ppm
0.001ppm
0.001ppm
3,850,000,000
1,180,000,000
65,000,000
8,500,000
64,000
37,000
37,000
15,000
180
1,900
5,00
8,000
11
8
IJSER

International Journal of Scientific & Engineering Research, Volume 5, Issue 8,August-2014 1274 ISSN 2229-5518
IJSER © 2014 http://www.ijser.org
Figure 1. Map of Nigeria showing Imo state
IJSER

International Journal of Scientific & Engineering Research, Volume 5, Issue 8,August-2014 1275 ISSN 2229-5518
IJSER © 2014 http://www.ijser.org
Figure 2. Map of Imo state showing Oguta Local Government Area IJSER

International Journal of Scientific & Engineering Research, Volume 5, Issue 8,August-2014 1276 ISSN 2229-5518
IJSER © 2014 http://www.ijser.org
Figure 3. Map of Oguta indicating Izombe community
IJSER

International Journal of Scientific & Engineering Research, Volume 5, Issue 8,August-2014 1277 ISSN 2229-5518
IJSER © 2014 http://www.ijser.org
Figure 4. Multi-gas monitor
IJSER

International Journal of Scientific & Engineering Research, Volume 5, Issue 8,August-2014 1278 ISSN 2229-5518
IJSER © 2014 http://www.ijser.org
Figure 5. Suspended particulate matter (SPM) detector
IJSER

International Journal of Scientific & Engineering Research, Volume 5, Issue 8,August-2014 1279 ISSN 2229-5518
IJSER © 2014 http://www.ijser.org
Table 2. Result for ambient air concentration of Nitrogen dioxide
Distance (m) Concentration of NO2 (ppm) FEPA Standard (ppm) 100 200 300 Control
1.36 1.02 0.90 0.02
0.06
IJSER

International Journal of Scientific & Engineering Research, Volume 5, Issue 8,August-2014 1280 ISSN 2229-5518
IJSER © 2014 http://www.ijser.org
Table 3. Result for ambient air concentration of Sulphur dioxide
Distance (m) Concentration of SO2 (ppm) FEPA Standard (ppm)
100 200 300 Control
3.51 2.30 1.23 0.61
0.10
IJSER

International Journal of Scientific & Engineering Research, Volume 5, Issue 8,August-2014 1281 ISSN 2229-5518
IJSER © 2014 http://www.ijser.org
Table 4. Result for ambient air concentration of Hydrogen Sulphide
Distance (m) Concentration of H2S (ppm) FEPA Standard (ppm) 100 200 300 Control
2.30 1.10 0.41 0.00
0.10
IJSER

International Journal of Scientific & Engineering Research, Volume 5, Issue 8,August-2014 1282 ISSN 2229-5518
IJSER © 2014 http://www.ijser.org
Table 5. Result for ambient air concentration of Volatile Organic Compounds
Distance (m) Concentration of VOCs (ppm) FEPA Standard (ppm) 100 200 300 Control
3.01 2.21 1.21 0.00
0.50
IJSER

International Journal of Scientific & Engineering Research, Volume 5, Issue 8,August-2014 1283 ISSN 2229-5518
IJSER © 2014 http://www.ijser.org
Table 6. Result for ambient air concentration of Carbon Monoxide
Distance (m) Concentration of CO (ppm) FEPA Standard (ppm) 100 200 300 Control
5.31 3.20 2.63 0.67
1.00
IJSER
International Journal of Scientific & Engineering Research, Volume 5, Issue 8,August-2014 1284 ISSN 2229-5518
IJSER © 2014 http://www.ijser.org
Table 7. Result for ambient air concentration of Suspended Particulate Matter (SPM) on 14th October 2010
Distance (m) Concentration of SPM (ppm) FEPA Standard (ppm)
100
200
300
Control
11.89
8.67
5.67
2.21
0.25
IJSER

International Journal of Scientific & Engineering Research, Volume 5, Issue 8,August-2014 1285 ISSN 2229-5518
IJSER © 2014 http://www.ijser.org
Table 8. Results table of mean concentration of the six gases in parts per millioin on the 14th October 2010
Distance (m) NO2 SO2 H2S CO VOCs SPM
100
200
300
Control
1.36
1.02
0.90
0.02
3.51
2.30
1.23
0.61
2.30
1.10
0.41
0.00
5.31
3.21
2.63
0.67
3.01
2.21
1.21
0.00
11.89
8.67
5.67
2.21 Mean
Concentration
of Pollutants
0.83
1.91
0.95
2.96
1.61
7.11
FEPA Standards 0.06 0.10 0.10 0.50 1.00 0.25
IJSER