measurement and practical incidence on cotton trading · pdf filemeasurement and practical...
TRANSCRIPT
WITHIN AND BETWEEN BALE VARIABILITY OF INSTRUMENTAL DATA: MEASUREMENT AND PRACTICAL INCIDENCE ON COTTON TRADI NG FOR
COTTON PRODUCED IN AFRICA
Gourlot (1) J.-P., Aboe (2) M., Lukonge (3) E. (1) CIRAD, UPR SCA, F-34398 Montpellier, France
(2) Association Interprofessionnelle du Coton (AIC), Parakou, Benin (West Africa) (3) LZARDI, Mwanza, Tanzania
ABSTRACT Thanks to technical and technological developments during the last decades, the international commerce of cotton is gradually moving from the manual and visual classification to classification based on the results through instrumental testing. Change from one technique to the other requires studying their respective modalities and possibilities of application. Thus, commercial practices based on manual and visual classing agreed on the usage of an arbitration process and compromised tolerances allowing the settlement of possible litigations between sellers and buyers. It is then required to do the same for instrumental classing data, in particular in the cotton production conditions in Africa. The variability study of the fibre technological characteristics is a crucial step forward in the definition of the conditions of good realization of instrumental testing in order to limit the litigation risk between cotton producers in Africa and their international customers. It is also required to be more specific and to adapt the actual arbitral procedures to the instrumental classing. To perform the variability study, Dr. Everina LUKONGE, post-doc employee, in Eastern and South-Eastern Africa, and Modeste ABOE, PhD student, in West and Central Africa were involved. They were taking hundreds of samples from several ginning mills per region in fourteen African countries, while the same ginning mills were continuing to sample bales on the long-run during two crop seasons. All collected samples were tested in the laboratories of the respective Regional Technical Centres (RTCs) in Tanzania and in Mali. Thousands of results of samples tested by instruments were and are statistically monitored. The objective is to define operating methods for bale sampling and for testing collected cotton samples in order to warrant gained results and thus to limit the litigation risk between seller and buyer of the produced fibres. These instructions / recommendations are adding up to the ones which were given by the RTCs during the training sessions according to the best laboratory practices during the CFC/ICAC/33 Project duration (2007-2012). Our results show that classing can be done with a similar method as the one used in the USA for the saw-ginned African cotton. Calculations such as ‘averaging’ can be done for increasing the precision of the data which is assigned to each bale produced.
The instrumental classing is technically feasible in Africa; it only remains to make it possible on an everyday basis. 1 - INTRODUCTION Cotton is the main raw fibre textile in the world and fibres are pressed into bales for its trading. The bale is the trading unit of cotton on international markets like New-York, Alexandria, Liverpool, Bremen, etc. where the quotations depend on the actual situation (balance between offer and demand), of stock levels and of the production expectations. The value of each bale also depends on the bale quality and of the fibre characteristics. As cotton fibres are a raw material, the characterization of their quality is required by the industry to match the productivity expectations at the transformation stages, such as spinning, weaving and knitting, dyeing and finishing. The characterization of their quality is also required for predicting the quality of the final products that are made using these fibres (Sasser and Smith, 1984). This explains why cotton trading is based on fibre characteristics as determined during the classification process where the ‘quality’ of the fibres is evaluated worldwide before their trading. The cotton segment in the United States of America (USA) has since 1991been the first to use measuring instruments for trading cotton. These instruments measure micronaire the fibre length, length uniformity, fibre strength and colour (reflectance and yellowness) amongst other characteristics. These fibre technological characteristics are used for bale classing, for arranging bales in lots and finally to promote and sell the fibres. They also serve the purpose of setting the machines along the textile industry. In other production zones, for instance in Africa, no technological characteristic is regularly measured to sell cotton bales. In this case, the classification mostly remains manual and visual. However, the instruments present in these locations help in characterizing samples of the local production to check the overall quality of cotton fibre produced and to help cotton research and development teams by providing the fibre data for their researched cotton varieties. It is observed that for some decades now, some production origins have achieved to provide instrumental data to the industry while some others do not. In very few African countries, classification thanks to instrumental data is used. Getting the step forward from a manual and visual classification to an instrumental classification using the same techniques as in the USA could lead to quality claims as the production modalities are different. We did not find any technical or scientific publication stating that the actual use of existing techniques, methods and instruments can be applied in other cotton production conditions, especially in Africa.
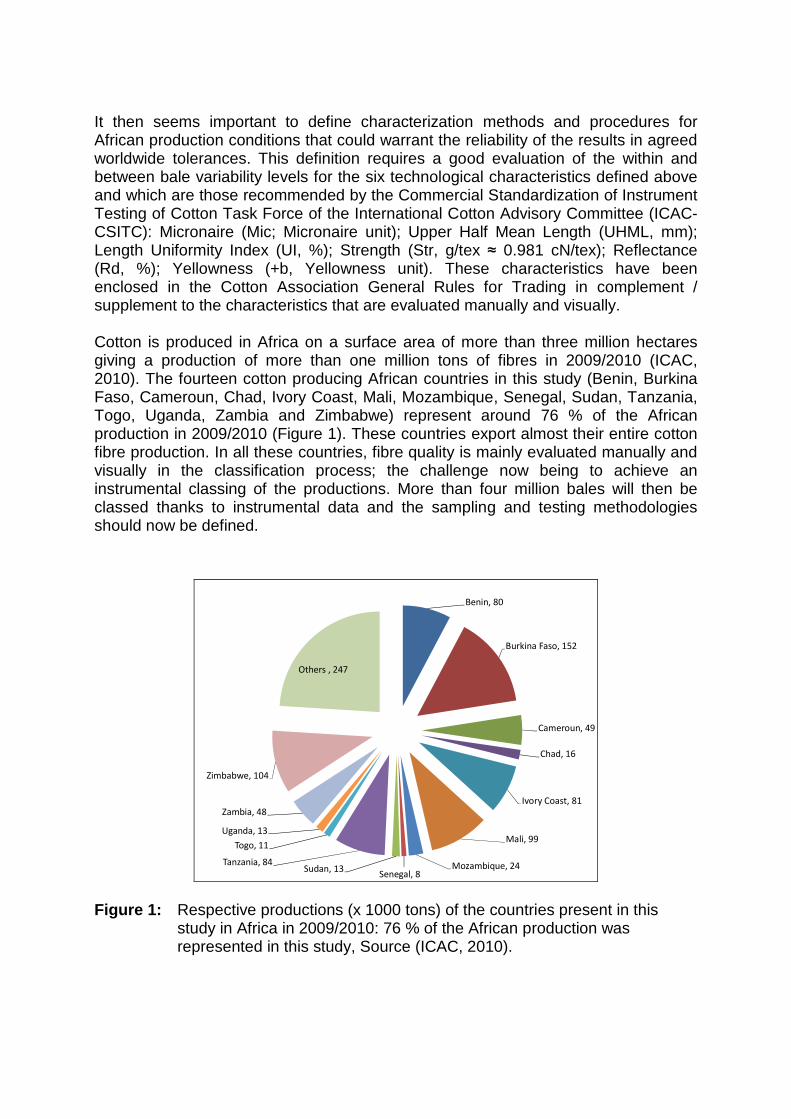
It then seems important to define characterization methods and procedures for African production conditions that could warrant the reliability of the results in agreed worldwide tolerances. This definition requires a good evaluation of the within and between bale variability levels for the six technological characteristics defined above and which are those recommended by the Commercial Standardization of Instrument Testing of Cotton Task Force of the International Cotton Advisory Committee (ICAC-CSITC): Micronaire (Mic; Micronaire unit); Upper Half Mean Length (UHML, mm); Length Uniformity Index (UI, %); Strength (Str, g/tex ≈ 0.981 cN/tex); Reflectance (Rd, %); Yellowness (+b, Yellowness unit). These characteristics have been enclosed in the Cotton Association General Rules for Trading in complement / supplement to the characteristics that are evaluated manually and visually. Cotton is produced in Africa on a surface area of more than three million hectares giving a production of more than one million tons of fibres in 2009/2010 (ICAC, 2010). The fourteen cotton producing African countries in this study (Benin, Burkina Faso, Cameroun, Chad, Ivory Coast, Mali, Mozambique, Senegal, Sudan, Tanzania, Togo, Uganda, Zambia and Zimbabwe) represent around 76 % of the African production in 2009/2010 (Figure 1). These countries export almost their entire cotton fibre production. In all these countries, fibre quality is mainly evaluated manually and visually in the classification process; the challenge now being to achieve an instrumental classing of the productions. More than four million bales will then be classed thanks to instrumental data and the sampling and testing methodologies should now be defined.
Figure 1: Respective productions (x 1000 tons) of the countries present in this study in Africa in 2009/2010: 76 % of the African production was represented in this study, Source (ICAC, 2010).
Benin, 80
Burkina Faso, 152
Cameroun, 49
Chad, 16
Ivory Coast, 81
Mali, 99
Mozambique, 24Senegal, 8
Sudan, 13Tanzania, 84
Togo, 11
Uganda, 13
Zambia, 48
Zimbabwe, 104
Others , 247

2 - COTTON CLASSING IS MOVING FROM MANUAL AND VISUA L CLASSING TOWARDS INSTRUMENT CLASSING
The industrial demands for objective and reliable cotton fibre test results are increasing rapidly. Cotton with insufficient verification of its quality will result in difficulties in cotton processing. Thus the cotton trade and industry and major cotton importing countries like China are integrating instrument testing results in trade. Cotton with insufficient verification of its quality will result in price reduction for the producers or exclusion from the market. Developed cotton growing countries, like the USA, have already built up their national cotton quality assessment systems and instrumental classification has resulted in a competitive advantage for the USA in global marketing. It is obvious that the establishment of an adequate instrumental cotton testing system based on high volume instruments for the cotton producing countries in Africa and elsewhere would facilitate the access of their cotton to diverse global markets. The ICAC-CSITC Task Force also works on a global harmonization system for improving the reliability of instrument data and for ensuring that all results are obtained at a common internationally agreed level and sensitivity anywhere on Earth. Since 2007, an international verification of test laboratories and their results is proposed to laboratories with the quarterly CSITC inter-laboratory round-test for improving the reliability of test results and for improving the confidence in their reliability. Thanks to all the efforts of normalization and of harmonization, trade is more and more confident in instrumental data. As a consequence, the percentage of bales classed with instrumental data has been improving from 18% in the 1990s to 47% in the 2010s (Figure 2). However, to follow market demands and then to improve this share especially in regions where the cropping systems are less mechanized, the sampling and testing procedures may have to be adapted accordingly. Indeed, precisions of the measurements are fully depending on the variability of the fibre characteristics at various scales, some being considered in this research.
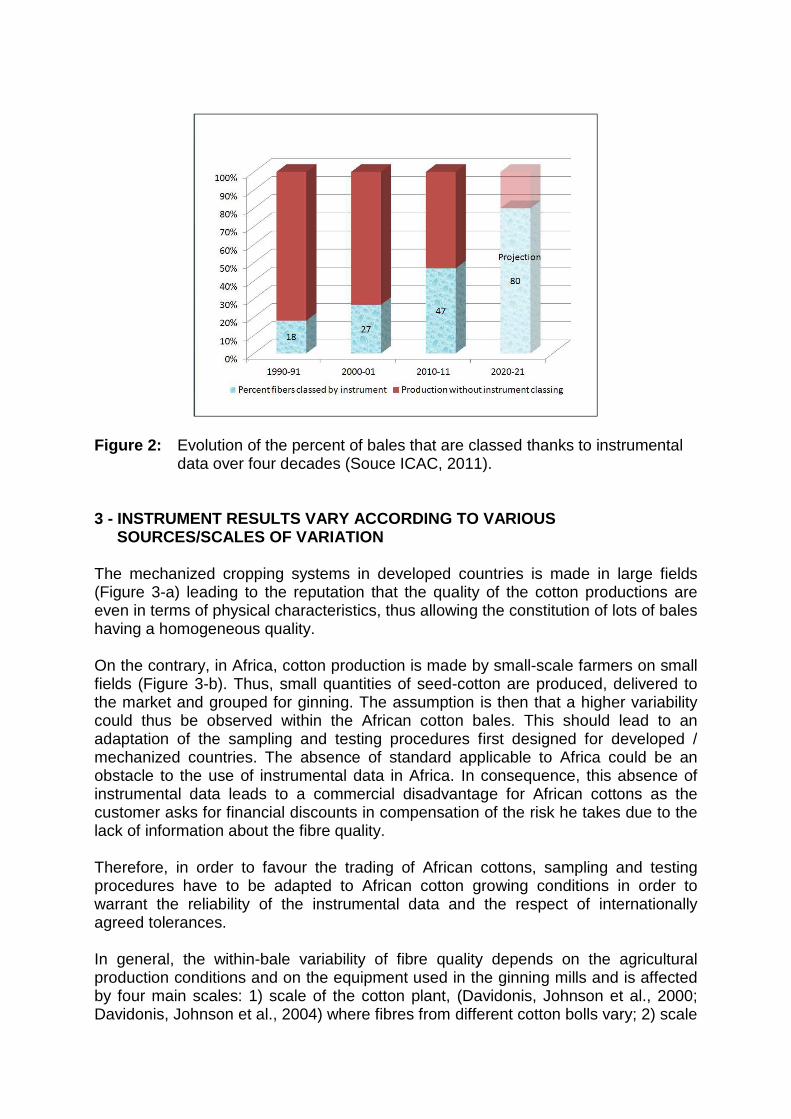
Figure 2: Evolution of the percent of bales that are classed thanks to instrumental
data over four decades (Souce ICAC, 2011). 3 - INSTRUMENT RESULTS VARY ACCORDING TO VARIOUS
SOURCES/SCALES OF VARIATION The mechanized cropping systems in developed countries is made in large fields (Figure 3-a) leading to the reputation that the quality of the cotton productions are even in terms of physical characteristics, thus allowing the constitution of lots of bales having a homogeneous quality. On the contrary, in Africa, cotton production is made by small-scale farmers on small fields (Figure 3-b). Thus, small quantities of seed-cotton are produced, delivered to the market and grouped for ginning. The assumption is then that a higher variability could thus be observed within the African cotton bales. This should lead to an adaptation of the sampling and testing procedures first designed for developed / mechanized countries. The absence of standard applicable to Africa could be an obstacle to the use of instrumental data in Africa. In consequence, this absence of instrumental data leads to a commercial disadvantage for African cottons as the customer asks for financial discounts in compensation of the risk he takes due to the lack of information about the fibre quality. Therefore, in order to favour the trading of African cottons, sampling and testing procedures have to be adapted to African cotton growing conditions in order to warrant the reliability of the instrumental data and the respect of internationally agreed tolerances. In general, the within-bale variability of fibre quality depends on the agricultural production conditions and on the equipment used in the ginning mills and is affected by four main scales: 1) scale of the cotton plant, (Davidonis, Johnson et al., 2000; Davidonis, Johnson et al., 2004) where fibres from different cotton bolls vary; 2) scale
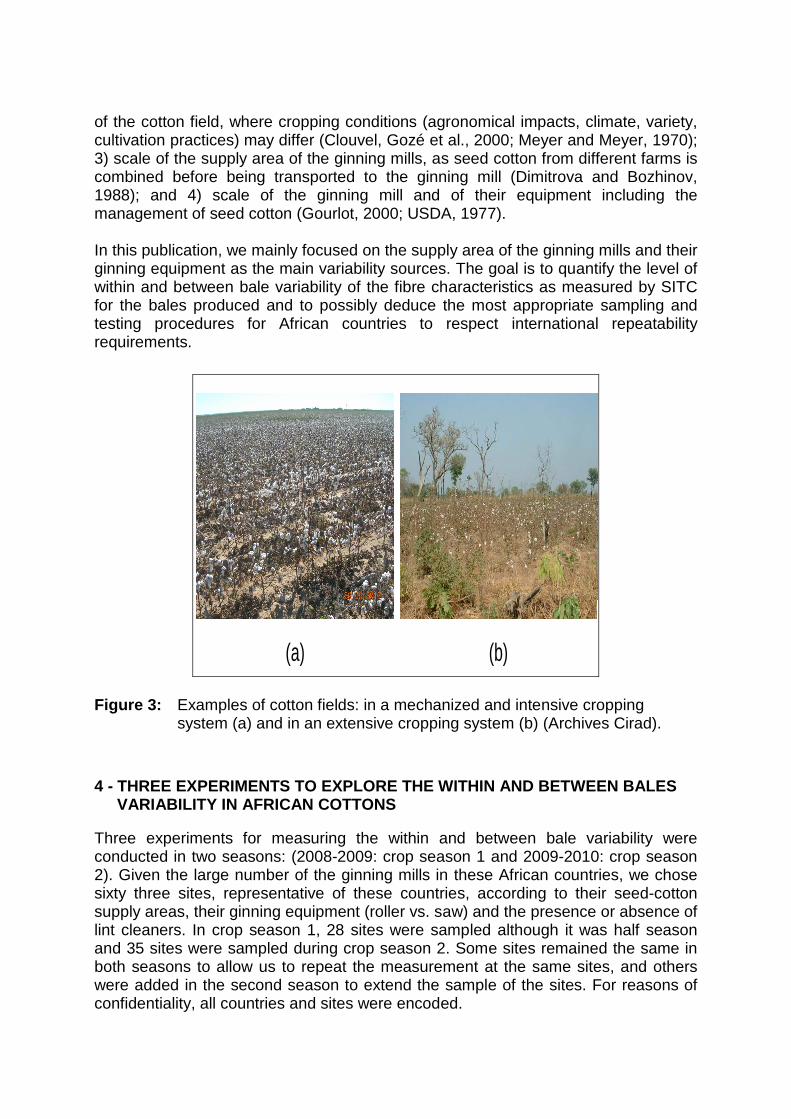
of the cotton field, where cropping conditions (agronomical impacts, climate, variety, cultivation practices) may differ (Clouvel, Gozé et al., 2000; Meyer and Meyer, 1970); 3) scale of the supply area of the ginning mills, as seed cotton from different farms is combined before being transported to the ginning mill (Dimitrova and Bozhinov, 1988); and 4) scale of the ginning mill and of their equipment including the management of seed cotton (Gourlot, 2000; USDA, 1977). In this publication, we mainly focused on the supply area of the ginning mills and their ginning equipment as the main variability sources. The goal is to quantify the level of within and between bale variability of the fibre characteristics as measured by SITC for the bales produced and to possibly deduce the most appropriate sampling and testing procedures for African countries to respect international repeatability requirements.
Figure 3: Examples of cotton fields: in a mechanized and intensive cropping system (a) and in an extensive cropping system (b) (Archives Cirad).
4 - THREE EXPERIMENTS TO EXPLORE THE WITHIN AND BET WEEN BALES
VARIABILITY IN AFRICAN COTTONS Three experiments for measuring the within and between bale variability were conducted in two seasons: (2008-2009: crop season 1 and 2009-2010: crop season 2). Given the large number of the ginning mills in these African countries, we chose sixty three sites, representative of these countries, according to their seed-cotton supply areas, their ginning equipment (roller vs. saw) and the presence or absence of lint cleaners. In crop season 1, 28 sites were sampled although it was half season and 35 sites were sampled during crop season 2. Some sites remained the same in both seasons to allow us to repeat the measurement at the same sites, and others were added in the second season to extend the sample of the sites. For reasons of confidentiality, all countries and sites were encoded.
(a) (b)

We assumed that seed cotton transported in different trucks came from various villages; this would thus induce different levels of variability when the seed cotton differed from one village or another in one single bale and between bales. In our experiments, we assumed that eighteen 225 kg bales of fibres can be produced from every seed-cotton truck. So, to insure that each sampled bale comes from a different village in our experiment A, we decided to select one bale out of every 20 at each site (Figure 4, experiment A). In experiment A, one sample per bale from eight different layers (8 samples per bale, Figure 5, experiment A) was collected from every sampled bale (one out of twenty during that day of production in each selected site). In each site, a total of 10 bales were sampled in crop season 1 and limited to 5 bales in crop season 2. In experiment B, one sample was taken by the cutter method from every bale in that day´s production, from 200 consecutive bales in season 1 and from 100 bales in season 2. In these conditions, 10 bales were common in experiment A and B in season 1 and 5 bales in season 2 at all selected sites (Figure 4 and Figure 5, experiment B).
Figure 4: Conjunction of sampling protocols in experiments A and B during the same day of bale production in the selected gins.
Bale n
Bale n + 20
Samples taken in 8 layers for Experiment A
Samples by the cutter method for Experiment B
No sample taken
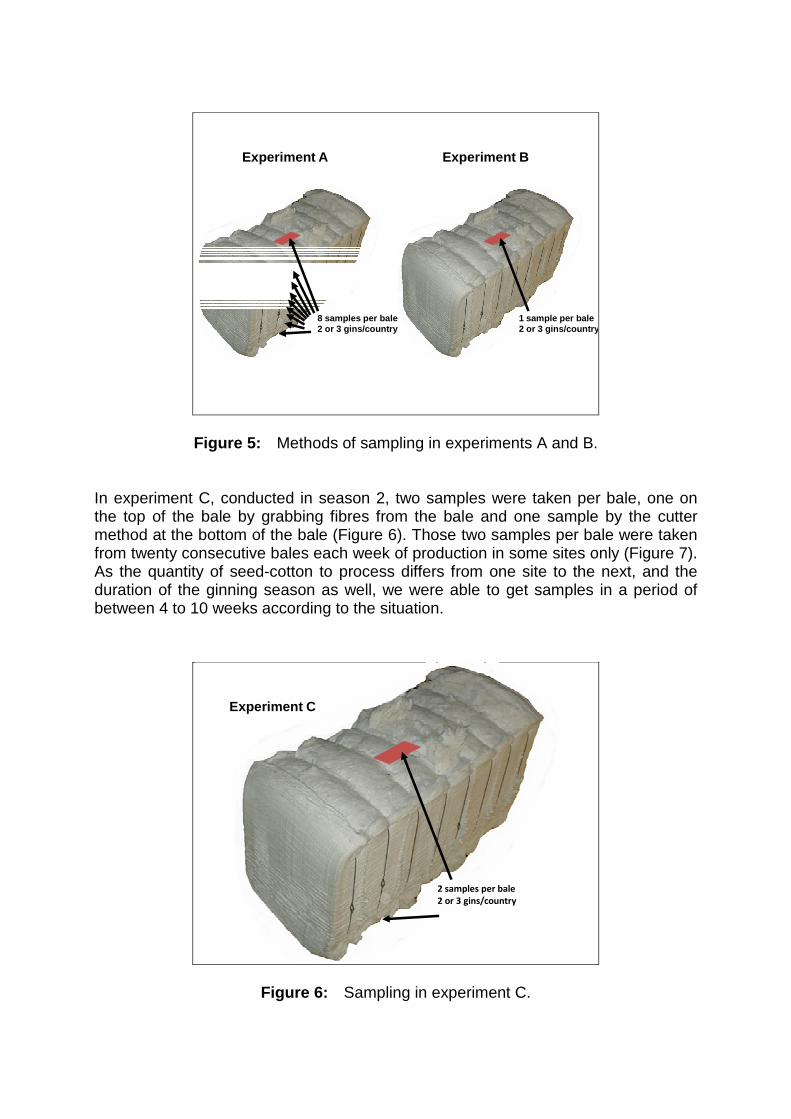
Figure 5: Methods of sampling in experiments A and B. In experiment C, conducted in season 2, two samples were taken per bale, one on the top of the bale by grabbing fibres from the bale and one sample by the cutter method at the bottom of the bale (Figure 6). Those two samples per bale were taken from twenty consecutive bales each week of production in some sites only (Figure 7). As the quantity of seed-cotton to process differs from one site to the next, and the duration of the ginning season as well, we were able to get samples in a period of between 4 to 10 weeks according to the situation.
Figure 6: Sampling in experiment C.
8 samples per bale2 or 3 gins/country
1 sample per bale2 or 3 gins/country
Experiment A Experiment B
2 samples per bale
2 or 3 gins/country
Experiment C
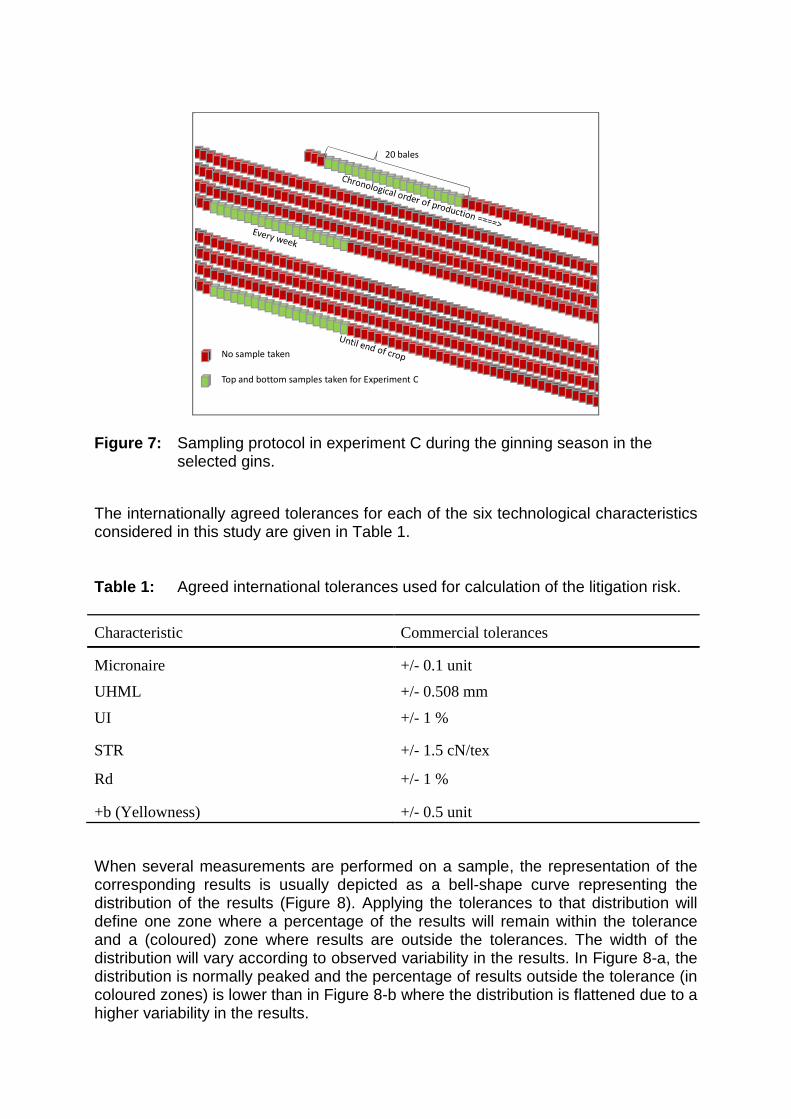
Figure 7: Sampling protocol in experiment C during the ginning season in the selected gins.
The internationally agreed tolerances for each of the six technological characteristics considered in this study are given in Table 1. Table 1: Agreed international tolerances used for calculation of the litigation risk.
Characteristic Commercial tolerances
Micronaire +/- 0.1 unit
UHML +/- 0.508 mm
UI +/- 1 %
STR +/- 1.5 cN/tex
Rd +/- 1 %
+b (Yellowness) +/- 0.5 unit When several measurements are performed on a sample, the representation of the corresponding results is usually depicted as a bell-shape curve representing the distribution of the results (Figure 8). Applying the tolerances to that distribution will define one zone where a percentage of the results will remain within the tolerance and a (coloured) zone where results are outside the tolerances. The width of the distribution will vary according to observed variability in the results. In Figure 8-a, the distribution is normally peaked and the percentage of results outside the tolerance (in coloured zones) is lower than in Figure 8-b where the distribution is flattened due to a higher variability in the results.
Top and bottom samples taken for Experiment C
No sample taken
20 bales
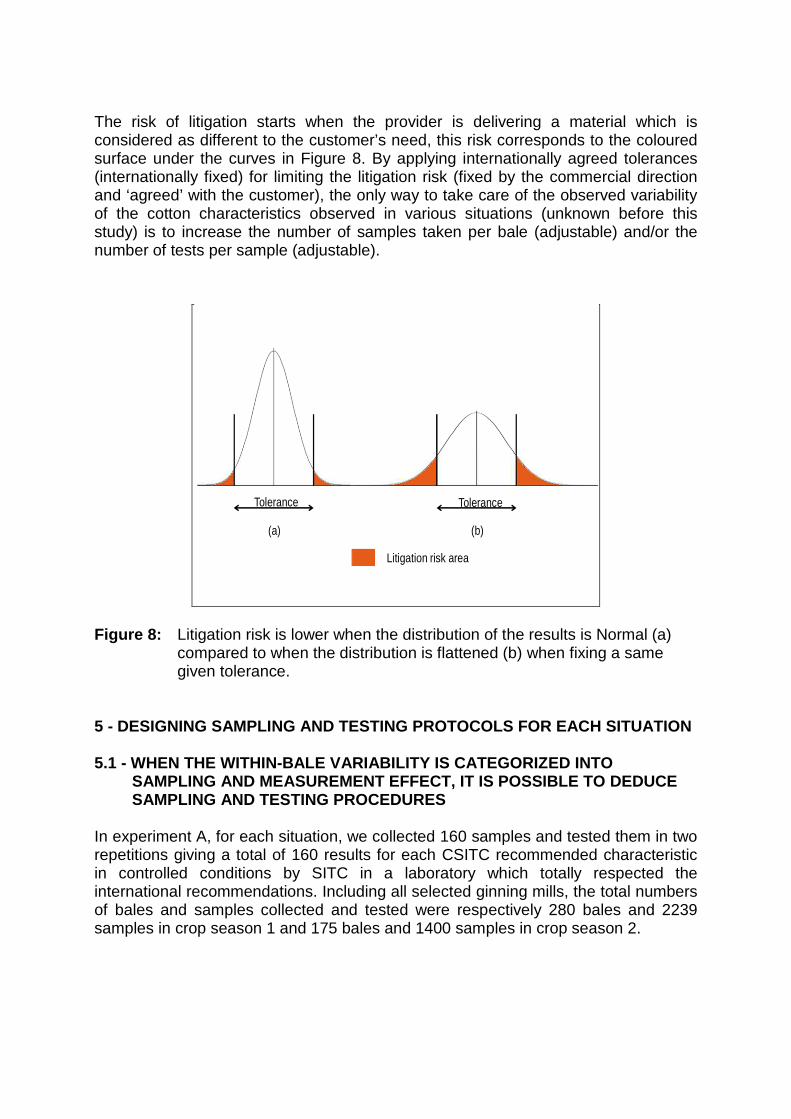
The risk of litigation starts when the provider is delivering a material which is considered as different to the customer’s need, this risk corresponds to the coloured surface under the curves in Figure 8. By applying internationally agreed tolerances (internationally fixed) for limiting the litigation risk (fixed by the commercial direction and ‘agreed’ with the customer), the only way to take care of the observed variability of the cotton characteristics observed in various situations (unknown before this study) is to increase the number of samples taken per bale (adjustable) and/or the number of tests per sample (adjustable).
Figure 8: Litigation risk is lower when the distribution of the results is Normal (a) compared to when the distribution is flattened (b) when fixing a same given tolerance.
5 - DESIGNING SAMPLING AND TESTING PROTOCOLS FOR EA CH SITUATION 5.1 - WHEN THE WITHIN-BALE VARIABILITY IS CATEGORIZ ED INTO
SAMPLING AND MEASUREMENT EFFECT, IT IS POSSIBLE TO DEDUCE SAMPLING AND TESTING PROCEDURES
In experiment A, for each situation, we collected 160 samples and tested them in two repetitions giving a total of 160 results for each CSITC recommended characteristic in controlled conditions by SITC in a laboratory which totally respected the international recommendations. Including all selected ginning mills, the total numbers of bales and samples collected and tested were respectively 280 bales and 2239 samples in crop season 1 and 175 bales and 1400 samples in crop season 2.
Tolerance Tolerance
(a) (b)
Litigation risk area
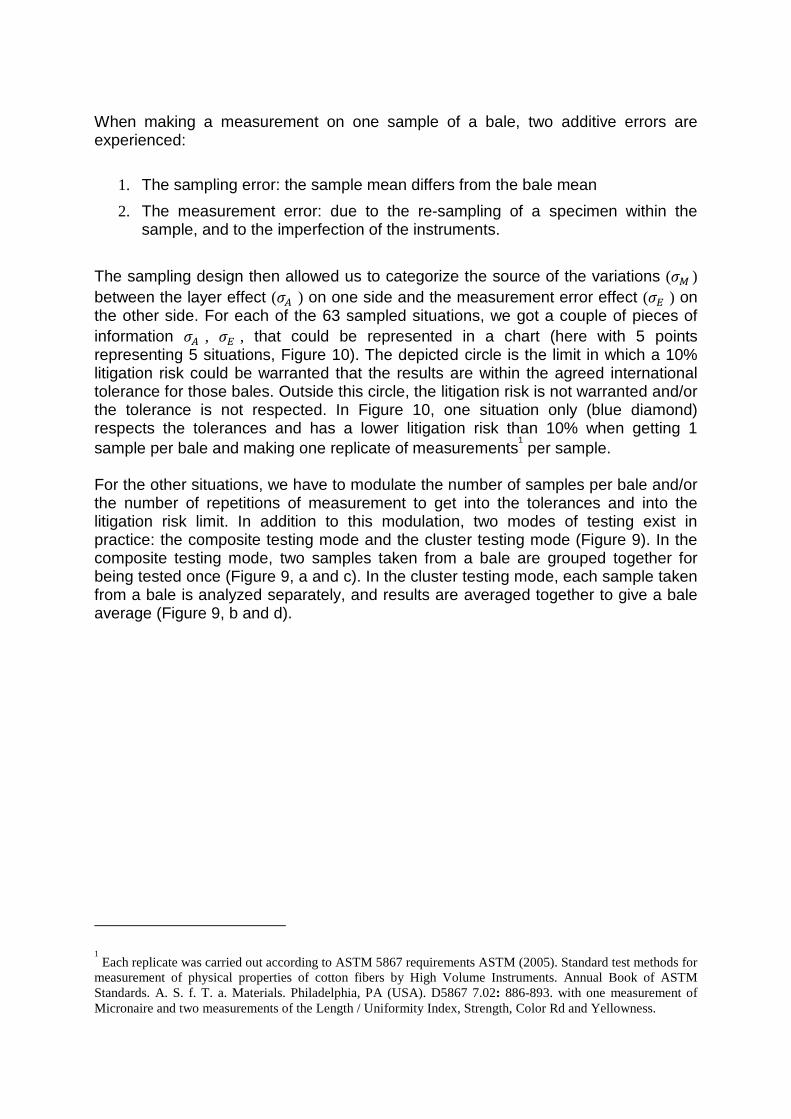
When making a measurement on one sample of a bale, two additive errors are experienced:
1. The sampling error: the sample mean differs from the bale mean
2. The measurement error: due to the re-sampling of a specimen within the sample, and to the imperfection of the instruments.
The sampling design then allowed us to categorize the source of the variations (�� ) between the layer effect (�� ) on one side and the measurement error effect (�� ) on the other side. For each of the 63 sampled situations, we got a couple of pieces of information �� , �� , that could be represented in a chart (here with 5 points representing 5 situations, Figure 10). The depicted circle is the limit in which a 10% litigation risk could be warranted that the results are within the agreed international tolerance for those bales. Outside this circle, the litigation risk is not warranted and/or the tolerance is not respected. In Figure 10, one situation only (blue diamond) respects the tolerances and has a lower litigation risk than 10% when getting 1 sample per bale and making one replicate of measurements
1 per sample.
For the other situations, we have to modulate the number of samples per bale and/or the number of repetitions of measurement to get into the tolerances and into the litigation risk limit. In addition to this modulation, two modes of testing exist in practice: the composite testing mode and the cluster testing mode (Figure 9). In the composite testing mode, two samples taken from a bale are grouped together for being tested once (Figure 9, a and c). In the cluster testing mode, each sample taken from a bale is analyzed separately, and results are averaged together to give a bale average (Figure 9, b and d).
1 Each replicate was carried out according to ASTM 5867 requirements ASTM (2005). Standard test methods for
measurement of physical properties of cotton fibers by High Volume Instruments. Annual Book of ASTM Standards. A. S. f. T. a. Materials. Philadelphia, PA (USA). D5867 7.02: 886-893. with one measurement of Micronaire and two measurements of the Length / Uniformity Index, Strength, Color Rd and Yellowness.
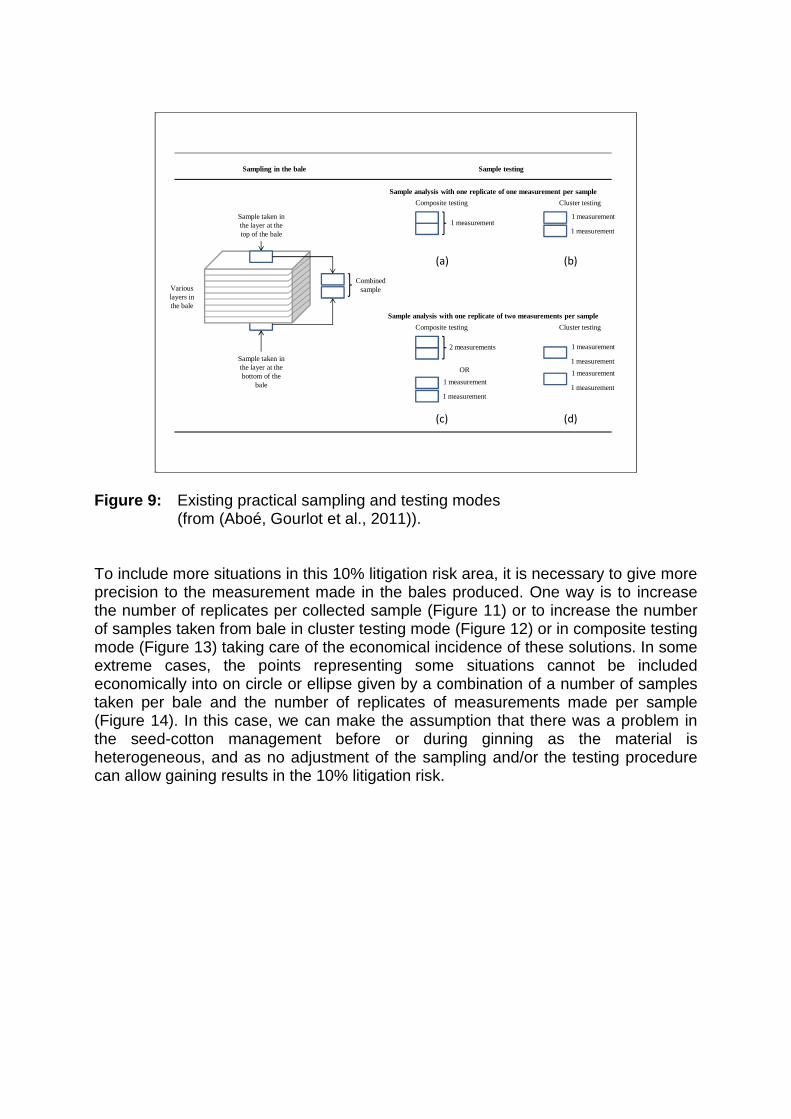
Figure 9: Existing practical sampling and testing modes (from (Aboé, Gourlot et al., 2011)).
To include more situations in this 10% litigation risk area, it is necessary to give more precision to the measurement made in the bales produced. One way is to increase the number of replicates per collected sample (Figure 11) or to increase the number of samples taken from bale in cluster testing mode (Figure 12) or in composite testing mode (Figure 13) taking care of the economical incidence of these solutions. In some extreme cases, the points representing some situations cannot be included economically into on circle or ellipse given by a combination of a number of samples taken per bale and the number of replicates of measurements made per sample (Figure 14). In this case, we can make the assumption that there was a problem in the seed-cotton management before or during ginning as the material is heterogeneous, and as no adjustment of the sampling and/or the testing procedure can allow gaining results in the 10% litigation risk.
Various layers in the bale
Sample analysis with one replicate of one measurement per sample
Composite testing Cluster testing
1 measurement1 measurement
1 measurement
Sample analysis with one replicate of two measurements per sample
Composite testing Cluster testing
2 measurements
OR
Sample taken in the layer at the top of the bale
Sample taken in the layer at the bottom of the
bale
Sampling in the bale Sample testing
1 measurement
1 measurement
1 measurement
1 measurement
(a) (b)
(c) (d)
Combined sample
1 measurement
1 measurement
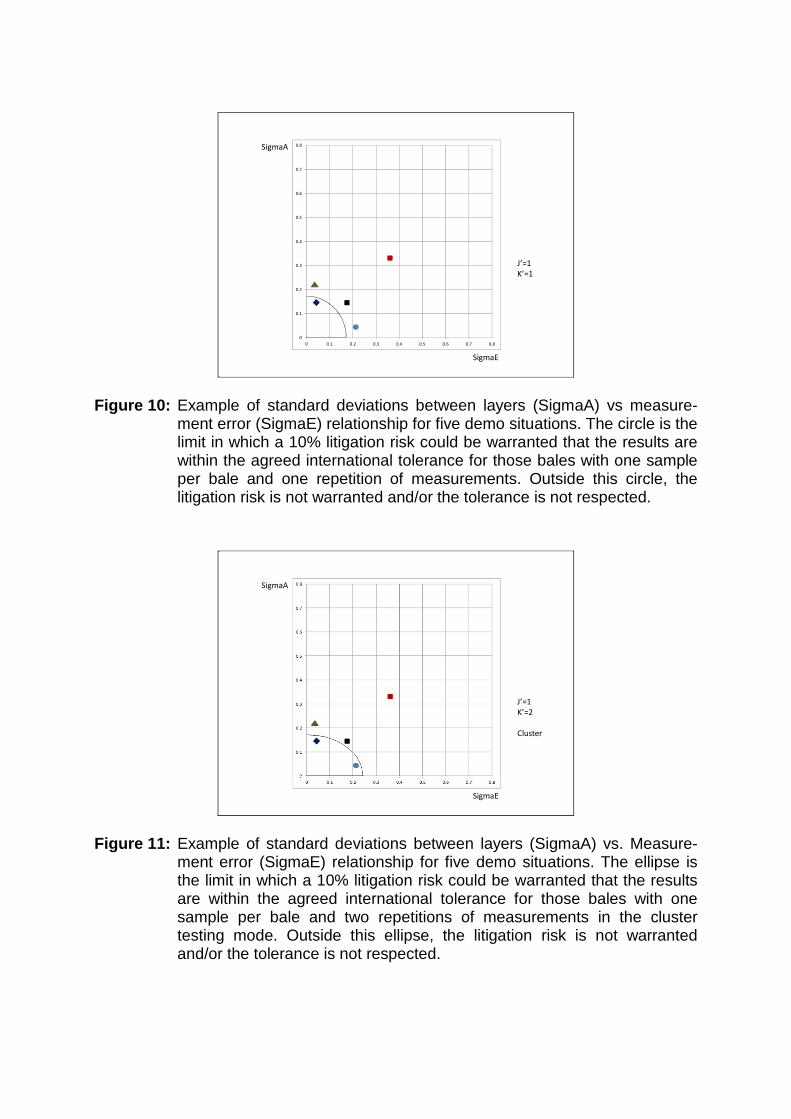
Figure 10: Example of standard deviations between layers (SigmaA) vs measure-ment error (SigmaE) relationship for five demo situations. The circle is the limit in which a 10% litigation risk could be warranted that the results are within the agreed international tolerance for those bales with one sample per bale and one repetition of measurements. Outside this circle, the litigation risk is not warranted and/or the tolerance is not respected.
Figure 11: Example of standard deviations between layers (SigmaA) vs. Measure-ment error (SigmaE) relationship for five demo situations. The ellipse is the limit in which a 10% litigation risk could be warranted that the results are within the agreed international tolerance for those bales with one sample per bale and two repetitions of measurements in the cluster testing mode. Outside this ellipse, the litigation risk is not warranted and/or the tolerance is not respected.
J’=1
K’=1
0
0.1
0.2
0.3
0.4
0.5
0.6
0.7
0.8
0 0.1 0.2 0.3 0.4 0.5 0.6 0.7 0.8
SigmaE
SigmaA
J’=1
K’=2
Cluster
SigmaE
SigmaA

Figure 12: Example of standard deviations between layers (SigmaA) vs. Measure-ment error (SigmaE) relationship for five demo situations. The ellipse is the limit in which a 10% litigation risk could be warranted that the results are within the agreed international tolerance for those bales with two samples per bale and one repetition of measurements in the cluster testing mode. Outside this ellipse, the litigation risk is not warranted and/or the tolerance is not respected.
Figure 13: Example of standard deviations between layers (SigmaA) vs. Measure-ment error (SigmaE) relationship for five demo situations. The ellipse is the limit in which a 10% litigation risk could be warranted that the results are within the agreed international tolerance for those bales with two samples per bale and one repetition of measurements in the composite testing mode. Outside this ellipse, the litigation risk is not warranted and/or the tolerance is not respected.
J’=2
K’=1
Cluster
0
0.1
0.2
0.3
0.4
0.5
0.6
0.7
0.8
0 0.1 0.2 0.3 0.4 0.5 0.6 0.7 0.8
SigmaE
SigmaA
J’=2
N’=1
Composite
0
0.1
0.2
0.3
0.4
0.5
0.6
0.7
0.8
0 0.1 0.2 0.3 0.4 0.5 0.6 0.7 0.8
SigmaE
SigmaA
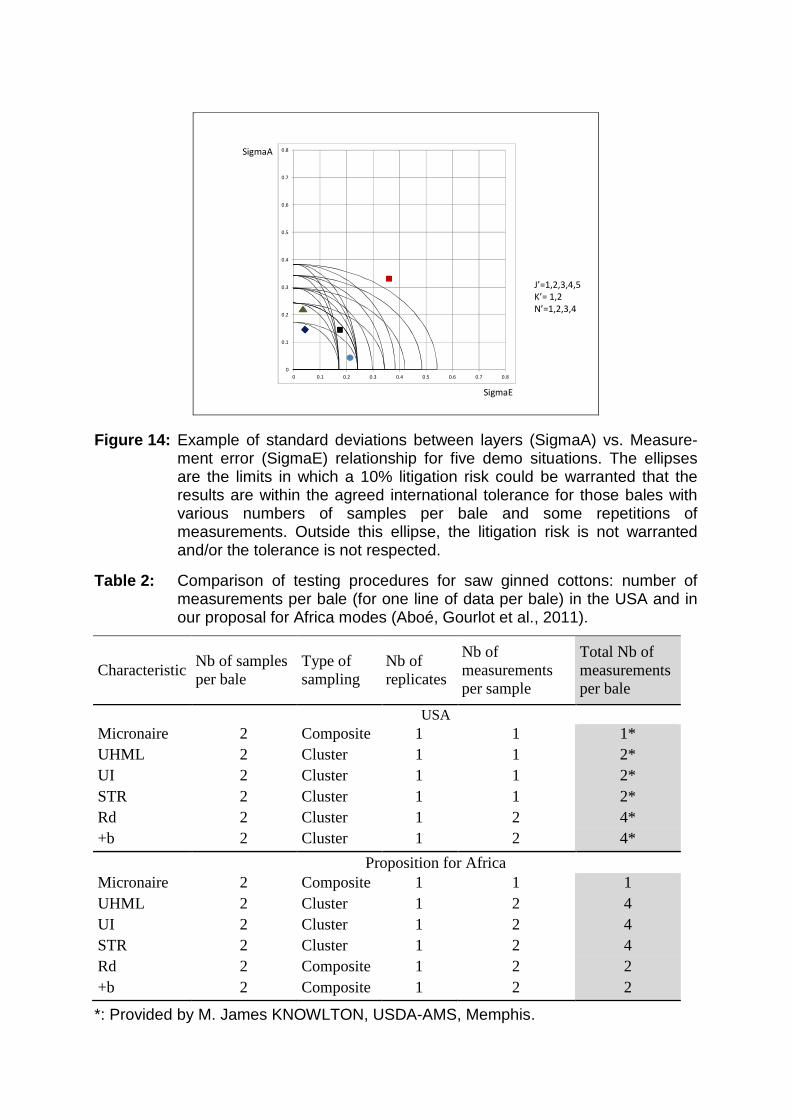
Figure 14: Example of standard deviations between layers (SigmaA) vs. Measure-ment error (SigmaE) relationship for five demo situations. The ellipses are the limits in which a 10% litigation risk could be warranted that the results are within the agreed international tolerance for those bales with various numbers of samples per bale and some repetitions of measurements. Outside this ellipse, the litigation risk is not warranted and/or the tolerance is not respected.
Table 2: Comparison of testing procedures for saw ginned cottons: number of measurements per bale (for one line of data per bale) in the USA and in our proposal for Africa modes (Aboé, Gourlot et al., 2011).
Characteristic Nb of samples per bale
Type of sampling
Nb of replicates
Nb of measurements per sample
Total Nb of measurements per bale
USA Micronaire 2 Composite 1 1 1* UHML 2 Cluster 1 1 2* UI 2 Cluster 1 1 2* STR 2 Cluster 1 1 2* Rd 2 Cluster 1 2 4* +b 2 Cluster 1 2 4*
Proposition for Africa Micronaire 2 Composite 1 1 1 UHML 2 Cluster 1 2 4 UI 2 Cluster 1 2 4 STR 2 Cluster 1 2 4 Rd 2 Composite 1 2 2 +b 2 Composite 1 2 2
*: Provided by M. James KNOWLTON, USDA-AMS, Memphis.
0
0.1
0.2
0.3
0.4
0.5
0.6
0.7
0.8
0 0.1 0.2 0.3 0.4 0.5 0.6 0.7 0.8
J’=1,2,3,4,5
K’= 1,2
N’=1,2,3,4
SigmaE
SigmaA
In summary, for saw ginned cottons, we found that African cotton can be sampled and tested in a comparable procedure to the one used in the USA (Table 2). For roller ginned cotton, a future publication will propose a sampling and testing procedure. 5.2 - WHEN THE BETWEEN-BALES VARIABILITY IS LOW, IT IS ALSO
POSSIBLE TO IMPROVE THE PRECISION OF MEASUREMENTS O N ONE BALE BY THE DATA OF OTHER SURROUNDING BALES; CONCEP T OF ‘AVERAGING’ CALCULATION
In experiment B, more than 9 000 samples were collected and tested twice in a randomized order in a laboratory respecting the recommendations of ICAC-CSITC Task Force and international standards. In experiment C, more than 1 500 samples (among 4 000 expected) were collected and tested in the same conditions as above. From these experiments B and C, various cases were observed: in the best situations, the fibre characteristics of the consecutive bales are quite homogeneous (Figure 15). In the worst situations, the fibre characteristics may strongly vary from one bale to the next (Figure 18). In the best situations, it could be possible to simplify the sampling and testing procedures as we could use the statistic method called “krigging” for averaging results from bales before and/or after the one being evaluated. Figure 16 show the evolution of a function of the variance between measurements on bales at various distances from the bale which is considered (up to 20 in this figure). We observe that a plateau exists at a distance of around 5 bales, meaning that we can calculate the value of a bale n using the data from 5 bales as depicted in Figure 17 (Dx are coefficients applied to bale values M�
���� at distance x). In the worst situations (Figure 18), the plateau is difficult to deduce (Figure 19) as cotton characteristics vary from one bale to the next. It will then be by agreement between provider and customer that the value of a bale n could be calculated using the data from a given number of surrounding bales.

Figure 15: Example of UHML readings (mm) in replicate 1 and in replicate 2 for 100 consecutive bales in one situation. UHML is quite stable along the bales.
Figure 16: Example of semi variogram when the cotton ‘quality’ is homogeneous along the consecutive bales that are produced in a gin.
26.00
26.50
27.00
27.50
28.00
28.50
29.00
29.50
408410 408430 408450 408470 408490 408510
mm
Bales
UHML rep 1 UHML rep 2

Figure 17: Example of 'averaging' calculation for giving the value of bale n for each characteristic.
Figure 18: Example of UHML readings (mm) in replicate 1 and in replicate 2 for 200 consecutive bales in one situation. UHML is not stable along the bales.
Bale
nBale
n+1 Bale
n+2
Bale
n-1
Bale
n-2
(D-2 . M-2) + (D-1 . M-1) + (M) + (D+1 . M+1) + (D+2 . M+2)
D-2 + D-1 + 1 + D+1 + D+2
D-2
D-1
D+2
D+1
M-1
M-2
M
M+1M+2
Value of Bale n =
25.00
25.50
26.00
26.50
27.00
27.50
28.00
28.50
29.00
29.50
15550 15600 15650 15700 15750
mm
Bales
UHML rep1 UHML rep 2

Figure 19: Example of semi variogram when the cotton ‘quality’ is not homogeneous along the consecutive bales that are produced in a gin.
In addition, the experiment C gives indications about the evolution of the averages of within-bale variability (Figure 20) and of between bales along the season in one situation (Figure 21). Figure 20 represents the averaged within-bale variances for a given situation where decreasing trends can be observed for both UHML and UI. In Figure 21, the between bales variances also decrease along the season for UHML (nothing clear for UI).
Figure 20: Evolution of the within-bale standard deviations of UHML (mm) on Y axis and of Uniformity Index (diameter of the dots, in %) along the ginning season in one situation.
0
0.1
0.2
0.3
0.4
0.5
0.6
0 1 2 3 4 5 6 7 8 9 10
Sta
nd
ard
de
via
tio
n o
f U
HM
L (m
m)
Week in ginning season
Diameter of the dot ≈ 1/5 of Standard deviation of Length Uniformity

Figure 21: Evolution of the between bales standard deviations of UHML (mm) on Y axis and of Uniformity Index (diameter of the dots, in %) along the ginning season in one situation.
6 - PRACTICAL INCIDENCE ON COTTON TRADING FOR COTTO N PRODUCED
IN AFRICA The proposed sampling and testing procedures, at this point valid for saw ginned cottons, were designed for fourteen African countries. However, in some cases where the points are too far from the origin in the Sigma A vs. Sigma E charts, these procedures are not applicable: the hypothesis was to improve the seed-cotton practices first. For better understand of those results, specific studies should also be done to deduce the best practices to put in place in order to limit the variability of fibre characteristics at low levels. At this point, the proposed sampling and testing procedures should be used for the cotton produced in some ginning mills in order to be validated once. All sites which participated in this study will receive a personalized and confidential report with technical recommendations and can be the ones to start / continue / improve the instrumental classing in Africa. The ginning mills using these sampling and testing procedures will be able to group bales into lots of homogeneous levels, to improve their seed-cotton management and to begin to measure the financial benefit of using instrumental data for cotton classification and to finally justify the instrumental classification in Africa. Finally, the procedures should be tested for a serie of seasons as the variability may depend on several annual factors. The goal is to ensure that classification results are reliable for the customers at anytime at the expected level.
0
0.05
0.1
0.15
0.2
0.25
0.3
0.35
0.4
0 1 2 3 4 5 6 7 8 9 10
Sta
nd
ard
de
via
tio
n o
f U
HM
L (m
m)
Week in ginning season
Diameter of the dot ≈ ¼ of Standard deviation of Length Uniformity

7 - CONCLUSION: INSTRUMENTAL CLASSING IS TECHNICALL Y FEASIBLE IN AFRICA; IT ONLY REMAINS TO MAKE IT POSSIBLE ON A N EVERY DAY BASIS
In experiment A, the within bale variance was categorized as sampling variance on one hand and as replicate variance on the other. This allowed us to propose sampling and testing procedures. The goal was to respect agreed international tolerances at defined litigation risk level in trading cotton. These procedures can be adjusted / improved by observing the evolution of the between bales variability, as shown in experiments B and C, in order to favour the respect of commercial tolerances and to lower the litigation risk at the lot level. Using the procedures proposed and based on African conditions, Sub-Saharan Africa can now start the instrumental classing of the produced cotton fibres with a sampling and a testing procedure that respects international standards. Therefore, the litigation risk at bale and lot levels can be restricted at low levels. In addition, the usage of instrumental testing should lead to improvement of seed cotton management. Repeating our experimental protocol over several years in Africa will enable improvement in the control of within bale and between bales variability levels of fibre characteristics. By improving the seed-cotton-management and ginning processes, the costs of sampling and testing procedures will then be reduced while the reliability of measurements used for cotton classification will be maintained or even improved. The ultimate goal is to enable users to have the same confidence in the results of instrumental classing “made in Africa” as in any other place on Earth. 8 - ACTUAL LIMITATIONS OF THE STUDY In this study, we did not consider reproducibility conditions that could appear when results may be different from one classing laboratory to the next. It will be also necessary to periodically quantify the within-bale variability for each situation in order to ensure the litigation risk for any given situation. When looking at the roller-ginned cottons collected data, it may be that adjustments in the proposed sampling and testing procedures will be necessary in the future as roller-ginned cottons are usually less homogeneous than saw-ginned cottons. Finally, we did limit the litigation risk to 10% for any single bale while commercial agreements and contracts generally concern lots of several bales and the General Rules of Cotton Associations; the lot litigation risk will have to be evaluated as well.

9 - ACKNOWLEDGMENTS The authors wish to thank the financial contributors who made this study possible. The study was undertaken as part of project CFC/ICAC/33 Commercial Standardization of Instrument Testing of Cotton, which was funded by the Common Fund for Commodities, an intergovernmental financial institution established within the framework of the United Nations, headquartered in Amsterdam, the Netherlands, and by the European Union in the framework of its "All ACP Agricultural Commodities Programme” under the sponsorship of the International Cotton Advisory Committee (ICAC) Washington (USA) and implemented by the Faserinstitut Bremen (FIBRE), Germany. The authors would like to thank the staff/team of the “Centre Technique Régional de Classement Instrumental du Coton d'Afrique de l'Ouest et du Centre” (AOC-CTRCIC), Ségou, Mali, and the staff/team of the “Regional Technical Center for the Eastern and Southern Africa”, Dar Es Salaam, Tanzania, who performed all the fibre characterizations for the present study. The authors wish to thank the cotton companies who allowed us to take samples in their facilities for running this experiment. The authors wish to thank Dr. Eric GOZÉ for his strong support in processing all the acquired data during these studies. 10 - DISCLAIMER This report was prepared within the project CFC/ICAC/33. The views expressed are not necessarily shared by the Common Fund for Commodities and/or the European Commission and/or the International Cotton Advisory Committee. The designation employed and the representation of material in this report do not imply the expression of any opinion whatsoever on the part of the Common Fund for Commodities and/or the European Commission or the International Cotton Advisory Committee concerning the legal status of any country, territory, city or area or its authorities, or concerning the delineation of its frontier or boundaries. 11 - BIBLIOGRAPHY Aboé, M., J.-P. Gourlot, E. Gozé, P. Hublé and A. Sinoiméri (2011). New findings on within bale repeatability of standardized instruments for testing cotton measurements on cotton fiber produced in West and Central Africa. Textile Research Journal (Sous presse): 42 p. ASTM (2005). Standard test methods for measurement of physical properties of cotton fibers by High Volume Instruments. Annual Book of ASTM Standards. A. S. f. T. a. Materials. Philadelphia, PA (USA). D5867 7.02: 886-893.

Clouvel, P., E. Gozé, R. Sequeira, J. Dusserre and M. Crétenet (2000). Variability of cotton fiber quality. New frontiers in cotton research : Proceedings. - Washington : ICAC, 2000. Davidonis, G. H., A. S. Johnson, C. H. Campbell and J. A. Landivar (2000). Fiber property variability in green lint cotton at seed and boll level. Proceedings / 1(1): 592-593. Davidonis, G. H., A. S. Johnson and R. M. Johnson (2004). Quantification of Within-Plant and Within-Field Yield and Fiber Variability. Crop management. Dimitrova, L. and M. Bozhinov (1988). Variability of cotton fiber properties caused by genotype and some environmental factors. Plant Science vol.25:n° 9: 27-34. Gourlot, J.-P. (2000). Les tendances dans la standardisation du coton sur le marché mondial. Rôle et place de la recherche pour le développement des filières cotonnières en évolution en Afrique : actes. - Montpellier : CIRAD, 2000. ICAC (2010). Cotton World Statistics: Bulletin of the International Cotton Advisory Committee 295 p. Meyer, V. G. and J. R. Meyer (1970). Some sources of variability in boll and fiber properties of cotton (Gossypium hirsutum L.). Sasser, P. E. and C. B. Smith (1984). High Volume Instrument test system a tool for textile manufacturing. International Committee on Cotton Testing Methods, Bremen. USDA, Ed. (1977). Cotton ginners handbook. Agricultural handbook n° 503. Washington, D.C., USA.