mdm 4ui unit 4: probability distributions for discrete
TRANSCRIPT

MDM 4UIUnit 4: Probability
Distributions for Discrete Variables
Day 1: Discrete Probability Distributions

Key Concepts:● A probability distribution shows the probabilities of all possible
outcomes in an experiment.● The sum of all probabilities in any distribution is 1.● A probability histogram graphs the relative frequency of the
random variable. The area of each bar represents the probability of the variable.
● Expectation, or expected value, is the weighted average value of the random variable. It can be a non-integer value.
●

Discrete Random Variable:
Continuous Random Variable:
A variable that can have only certain values within a range. For example, the sum of dice, the number of students in a class, etc. These are often whole numbers or integers.
A variable that can have an infinite number of values within a range. For example, the volume of a container, the mass of an object, etc. These are often decimals and can be extended infinitely.

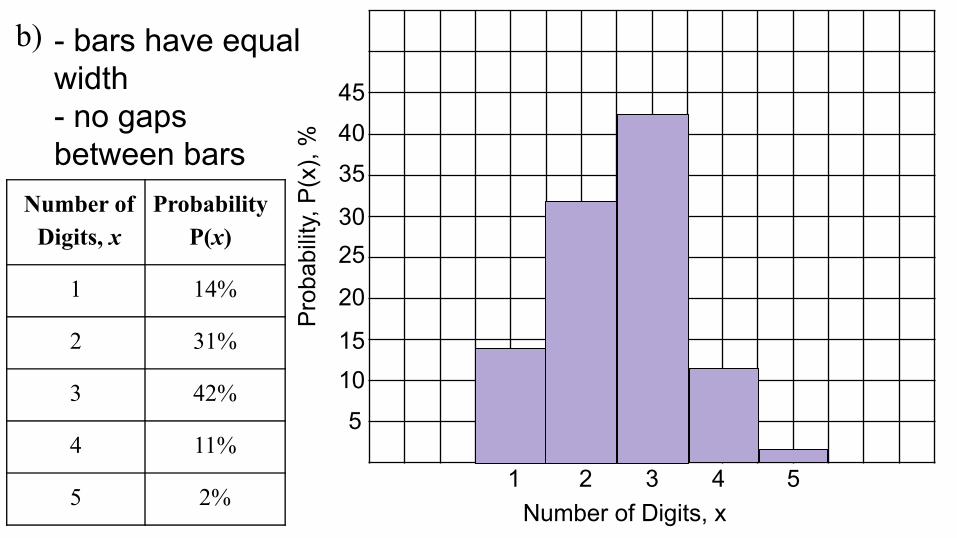
Example 1: Constructing a Probability HistogramThe table gives the probability distribution of the number of digits in street addresses of a large city.a. Identify the random variable.b. Construct a probability histogram.c. Explain the meaning of the individual bars in the histogram.d. Calculate the sum of the probabilities. Comment on the result.
a) The random variable is the number of digits in the street address. It is discrete.
Number of Digits, x
ProbabilityP(x)
1 14%
2 31%
3 42%
4 11%
5 2%
b)
Pro
babi
lity,
P(x
), %
Number of Digits, x1 2 3 4 5
15
30
35
5
10
20
25
40
45
- bars have equal width- no gaps between bars

c)
d)
Each bar has a width of 1 and a height of the appropriate probability. This means that the probability can be thought of as the area of the rectangle in the histogram.
P(sum) = 14 + 31 + 42 + 11 + 2 = 100
All possible outcomes are listed in the table.

Expectation (Expected Value):
Example 2: Expectation of a Probability Distributiona. Make a tree diagram and show the probability distribution for
the number of girls in a family of three children.b. Make a probability histogram for this distribution.c. Calculate the expectation for the number of girls in a family of
three children.
● Denoted E(X)● E(X) of a probability distribution is the predicted average of
all possible outcomes.● E(X) is equal to the sum of all the products of each outcome
with its probability.

a.
Random Variable (X) is the number of girls in the family. It is discrete.
G
B
G
B
G
B
G
BG
BGBGB
Number of Girls,
x
Distribution of Girls
Frequency Probability, P(x)
0
1
2
3
BBB
GBB, BGB, BBGGGB, BGG, GBG
GGG
1
3
3
1

b.
Pro
babi
lity,
P(x
)
Number of Girls, x1 20 3

Number of Girls, x
Probability, P(x)
x × P(x)
0
1
2
3
SUM
c.
∴ If you have 3 children, you should expect 1.5 to be girls.*Expected value is a mathematical average and should NOT be rounded to the nearest whole number!

Example 3: Expected ValueA hospital is having a fundraising lottery to raise money for cancer research. A ticket costs $10, and 2,000,000 tickets are available. There are four levels of prizes: one $5,000,000 grand prize, three $100,000 second prizes, ten $1,000 prizes and 2,000 free tickets for next year’s lottery.a. Create a probability distribution chart for this lottery.b. Determine the expected value for each ticket.c. Explain the meaning in part b.

Prize, x Frequency Probability, P(x)
x × P(x)
a.
Random Variable (X) is the value of the prize. It is discrete. b.
5 000 000
100 000
1 000
10
0
1
3
10
2 000
1 997 986
c.
For every $10 ticket, you should expect to win $2.67 (or lose $7.33)

Homework: p. 277 - 279 #2, 3, 4, 7, 12