mccormick &schmicks seafood restaurants inc. −...
TRANSCRIPT

FORM 10−K
SEC Filing
McCormick &Schmicks Seafood Restaurants Inc. − MSSR
Filing Date: March 14, 2006
Filing Period: December 31, 2005
DESCRIPTIONAnnual report which provides a comprehensive overview of the company for the past year
This SEC filing is published for the sole use of Thomson StreetEvents clients. It may not be duplicated, reproduced or retransmitted in whole or in partwithout the express permission of Thomson Financial. All rights reserved.

Table of Contents
Part IIIof this Form 10−K incorporates by reference information from the registrant s Proxy Stateme
PART IITEM1
. BUSINESS
ITEM1
A. RISK FACTORS
ITEM1
B. UNRESOLVED STAFF COMMENTS
ITEM2
. PROPERTIES
ITEM3
. LEGAL PROCEEDINGS
ITEM4
. SUBMISSION OF MATTERS TO A VOTE OF SECURITY HOLDERS
ITEM4
A. EXECUTIVE OFFICERS AND OTHER KEY EMPLOYEES
PART IIITEM5
. MARKET FOR THE REGISTRANT S COMMON EQUITY AND RELATED STOCKHOLDERMATTERS
ITEM6
. SELECTED FINANCIAL DATA
ITEM7
. MANAGEMENT S DISCUSSION AND ANALYSIS OF FINANCIAL CONDITION ANDRESULTS OF OPERATIONS
ITEM7
A. QUANTITATIVE AND QUALITATIVE DISCLOSURES ABOUT MARKET RISK
ITEM8
. FINANCIAL STATEMENTS AND SUPPLEMENTARY DATA
ITEM9
. CHANGES IN AND DISAGREEMENTS WITH ACCOUNTANTS ON ACCOUNTING ANDFINANCIAL DISCLOSURE
ITEM9
A. CONTROLS AND PROCEDURES
ITEM9
B. OTHER INFORMATION
PART IIIITEM1
0. DIRECTORS AND EXECUTIVE OFFICERS OF THE REGISTRANT
ITEM1
1. EXECUTIVE COMPENSATION
ITEM1
2. SECURITY OWNERSHIP OF CERTAIN BENEFICIAL OWNERS AND MANAGEMENT ANDRELATED STOCKHOLDER MATT
This SEC filing is published for the sole use of Thomson StreetEvents clients. It may not be duplicated, reproduced or retransmitted in whole or in partwithout the express permission of Thomson Financial. All rights reserved.

ITEM1
3. CERTAIN RELATIONSHIPS AND RELATED TRANSACTIONS
ITEM1
4. PRINCIPAL ACCOUNTANT FEES AND SERVICES
PART IVITEM1
5. EXHIBITS AND FINANCIAL STATEMENT SCHEDULES
SIGNATURESEX−10.9 (SUMMARY OF DIRECTOR AND EXECUTIVE OFFICER COMPENSATION FOR FISCAL2006)EX−21.1 (SUBSIDIARIES OF MCCORMICK &SCHMICK'S SEAFOOD RESTAURANT)
EX−31.1 (CERTIFICATION OF THE CHIEF EXECUTIVE OFFICER PURSUANT TO RULE 13A−14(A))
EX−31.2 (CERTIFICATION OF THE CHIEF FINANCIAL OFFICER PURSUANT TO RULE 13A−14(A))
EX−32.1 (CERTIFICATION OF THE CHIEF EXECUTIVE OFFICER PURSUANT TO 18 U.S.C.SECTION 1350)EX−32.2 (CERTIFICATION OF THE CHIEF FINANCIAL OFFICER PURSUANT TO 18 U.S.C. SECTION1350)
This SEC filing is published for the sole use of Thomson StreetEvents clients. It may not be duplicated, reproduced or retransmitted in whole or in partwithout the express permission of Thomson Financial. All rights reserved.

Table of Contents
UNITED STATES
SECURITIES AND EXCHANGE COMMISSION
Washington, D.C. 20549
FORM 10−K
⌧ ANNUAL REPORT PURSUANT TO SECTION 13 OR 15(d) OF THE SECURITIES EXCHANGE ACT OF 1934
For the fiscal year ended December 31, 2005
or
¨ TRANSITION REPORT PURSUANT TO SECTION 13 OR 15(d) OF THE SECURITIES EXCHANGE ACT OF 1934
Commission File Number 000−50845
MCCORMICK & SCHMICK’S SEAFOOD RESTAURANTS, INC.
(Exact Name of Registrant as Specified in its Charter)
Delaware 20−1193199(State or other jurisdiction of
incorporation or organization)(I.R.S Employer
Identification No.)
720 SW Washington Street, Suite 550 Portland, Oregon 97205 (Address of principal executive offices) (Zip Code)
Registrant’s telephone number, including area code: (503) 226−3440
Securities registered pursuant to Section 12(b) of the Act: None
Securities registered pursuant to Section 12(g) of the Act:
Common Stock, par value $0.001 per share
Indicate by check mark whether the registrant is a well−known seasoned issuer, as defined in Rule 405 of the Securities Act. Yes ¨ No ⌧
Indicate by check mark whether the registrant is not required to file reports pursuant to Section 13 or Section 15(d) of the Act. Yes ¨ No ⌧
Indicate by check mark whether the registrant (1) has filed all reports required to be filed by Section 13 or 15(d) of the Securities Exchange Act of 1934during the preceding 12 months (or for such shorter period that the registrant was required to file such reports), and (2) has been subject to such filingrequirements for the past 90 days. Yes ⌧ No ¨
Source: McCormick & Schmicks, 10−K, March 14, 2006

Indicate by check mark if disclosure of delinquent filers pursuant to Item 405 of Regulation S−K (Section 229.405 of this chapter) is not contained herein,and will not be contained, to the best of registrant’s knowledge, in definitive proxy or information statements incorporated by reference in Part III of this Form10−K or any amendment to this Form 10−K. ⌧
Indicate by check mark whether the registrant is a large accelerated filer, accelerated filer, or a non−accelerated filer. See definition of “accelerated filerand large accelerated filer” in Rule 12b−2 of the Exchange Act. (Check one):
Large accelerated filer ¨ Accelerated filer ⌧ Non−accelerated filer ¨
Indicate by check mark whether the registrant is a shell company (as defined in Rule 12b−2 of the Act). Yes ¨ No ⌧
The aggregate market value of the voting and non−voting common stock held by non−affiliates (based on the closing price on December 30, 2005 on TheNasdaq Stock Market National Market) was $199.5 million. There were 14,179,606 shares of common stock outstanding as of February 17, 2006.
DOCUMENTS INCORPORATED BY REFERENCE
Part III of this Form 10−K incorporates by reference information from the registrant’s Proxy Statement for the 2006 Annual Meeting of Stockholders.
Source: McCormick & Schmicks, 10−K, March 14, 2006

Table of ContentsTABLE OF CONTENTS
PART I 1ITEM 1. BUSINESS 1ITEM 1A. RISK FACTORS 12ITEM 1B. UNRESOLVED STAFF COMMENTS 18ITEM 2. PROPERTIES 18ITEM 3. LEGAL PROCEEDINGS 18ITEM 4. SUBMISSION OF MATTERS TO A VOTE OF SECURITY HOLDERS 18ITEM 4A. EXECUTIVE OFFICERS AND OTHER KEY EMPLOYEES 18
PART II 20ITEM 5. MARKET FOR THE REGISTRANT’S COMMON EQUITY AND RELATED STOCKHOLDER MATTERS 20ITEM 6. SELECTED FINANCIAL DATA 21ITEM 7. MANAGEMENT’S DISCUSSION AND ANALYSIS OF FINANCIAL CONDITION AND RESULTS OF OPERATIONS 23ITEM 7A. QUANTITATIVE AND QUALITATIVE DISCLOSURES ABOUT MARKET RISK 38ITEM 8. FINANCIAL STATEMENTS AND SUPPLEMENTARY DATA 39ITEM 9. CHANGES IN AND DISAGREEMENTS WITH ACCOUNTANTS ON ACCOUNTING AND FINANCIAL DISCLOSURE 62ITEM 9A. CONTROLS AND PROCEDURES 62ITEM 9B. OTHER INFORMATION 62
PART III 63ITEM 10. DIRECTORS AND EXECUTIVE OFFICERS OF THE REGISTRANT 63ITEM 11. EXECUTIVE COMPENSATION 63ITEM 12. SECURITY OWNERSHIP OF CERTAIN BENEFICIAL OWNERS AND MANAGEMENT AND RELATED STOCKHOLDER
MATTERS 63ITEM 13. CERTAIN RELATIONSHIPS AND RELATED TRANSACTIONS 63ITEM 14. PRINCIPAL ACCOUNTANT FEES AND SERVICES 63
PART IV 64ITEM 15. EXHIBITS AND FINANCIAL STATEMENT SCHEDULES 64
SIGNATURES 65
i
Source: McCormick & Schmicks, 10−K, March 14, 2006

Table of ContentsForward Looking Statements
This Annual Report on Form 10−K contains forward−looking statements within the meaning of Section 27A of the Securities Act of 1933 and Section 21Eof the Securities Exchange Act of 1934. Forward−looking statements represent our expectations or beliefs concerning future events, including the following: anystatements regarding future sales, costs and expenses and gross profit percentages; any statements regarding the continuation of historical trends; any statementsregarding the expected number of future restaurant openings and expected capital expenditures; and any statements regarding the sufficiency of our cash balancesand cash generated from operating and financing activities for future liquidity and capital resource needs. In addition, the words “believes,” “anticipates,”“plans,” “expects,” “should,” “estimates” and similar expressions are intended to identify forward−looking statements. We have identified significant factors thatcould cause actual results to differ materially from those stated or implied in the forward−looking statements in Item 1A, “Risk Factors.”
Reorganization in Connection with Initial Public Offering
In connection with our initial public offering in July 2004, we converted McCormick & Schmick Holdings LLC, a Delaware limited liability company,into McCormick & Schmick’s Seafood Restaurants, Inc., a Delaware corporation. Because our operations are conducted by wholly owned subsidiaries, theconversion did not affect our financial statements, except with respect to information regarding the membership units in McCormick & Schmick Holdings LLC.Except where specifically noted, references in this Annual Report on Form 10−K to “we” or to “the Company” means McCormick & Schmick Holdings LLC forperiods before July 20, 2004 and McCormick & Schmick’s Seafood Restaurants, Inc. for periods on and after July 20, 2004.
PART I
ITEM 1. BUSINESS
Overview
McCormick & Schmick’s Seafood Restaurants, Inc. is a leading national seafood restaurant operator in the affordable upscale dining segment. For morethan 34 years, we have successfully grown our business to 59 restaurants in 24 states at December 31, 2005 by focusing on serving a broad selection of freshseafood.
Our daily−printed menu typically contains between 85 and 100 made−to−order dishes, including an extensive selection of international, national, regionaland local species of seafood. Our signature “Fresh List,” prominently displayed at the top of our daily−printed menu, features 30 to 40 varieties of fresh seafood,based on product availability, price and customer preferences. We also offer alternatives to seafood, including prime aged beef, creative salads and fresh pastadishes.
Our restaurants are designed to capture the distinctive characteristics of each local market, positioning us to compete successfully in a sector comprisedprimarily of locally owned and operated seafood restaurants. We seek to create an inviting atmosphere which allows us to attract a diverse customer base of menand women, primarily ages 30 to 60, typically college−educated and in the middle to upper−middle income brackets. We believe the combination of ourrestaurant atmosphere and our extensive menu offering and broad range of price points appeals to a diverse customer base from casual diners, families andtourists to business travelers and special occasion diners.
We believe we are the only high quality seafood restaurant that operates on a national scale. We believe we have successfully differentiated ourselves fromour competitors by focusing on the following core strengths of our business model.
Fresh Seafood
Our primary business focus for more than 34 years has been to consistently offer a broad selection of fresh seafood, which we believe commands strongloyalty from our customers. Our daily−printed menu typically
1
Source: McCormick & Schmicks, 10−K, March 14, 2006
Table of Contentscontains between 85 and 100 made−to−order dishes, including an extensive selection of nationally available species such as Atlantic lobster, Dungeness crab andAlaskan halibut, as well as seasonal products such as wild King salmon, Columbia River sturgeon, Sashimi grade tuna, exotic Hawaiian catch and an extensivevariety of cold water oysters. The executive chef and general manager at the majority of our restaurants tailor the menu, at least once daily, based on theavailability of different species of fresh seafood, price and customer preferences.
We believe we successfully differentiate our concept from both independent local seafood restaurants and national and regional seafood restaurant chainsby including in our daily−printed menu our signature “Fresh List” of typically 30 to 40 fresh seafood items, sourced from throughout the United States and fromselect international locations. We are able to offer a wide variety of consistently fresh, high quality seafood through our close relationships with reputable localand national seafood vendors. We encourage our vendors to adopt preferred and sustainable fishing practices to guarantee the current and future quality andsupply of our seafood. During our daily “fresh talk,” the executive chef at each of our restaurants educates our restaurant staff on the menu items of the day so wecan effectively communicate the sourcing, freshness, quality and method of preparation of our products to our customers.
Attraction of Our Full−Service Bar
We consider our bar operations to be an integral part of the “McCormick & Schmick’s” brand and central to our broad appeal. We believe the success ofour first restaurant, Jake’s Famous Crawfish, was largely driven by its bar operation, which enhanced the dining room business by creating a social forum andbuilding clientele. Our bar operation remains a cornerstone of our restaurant concept, showcasing our commitment to traditionalism and quality. We attractpatrons to our bar as a final destination, where they can enjoy a broad selection of liquors, wines and beers in a traditional yet lively environment. Our cocktaildrinks are created using traditional methods and are hand−shaken, hand−poured and made with freshly squeezed juices, underlining our focus on product quality.We also offer value−priced items from our full restaurant menu at our bars, which tends to attract younger customers whom we aim to develop into regularrestaurant customers.
As a result of our focus on our bar operations as an integral part of our business, our bars drive sales to our restaurants. We run our bar operations as aprofit center rather than a mere holding area for diners. In 2005, alcohol sales, predominantly from our bar, accounted for approximately 30% of our revenuesand contributed higher gross margins than food sales, allowing us the flexibility to offer lower prices on some of our menu items, which helps us maintain ourbroad appeal.
Broad Appeal of Our Concept
We believe we appeal to a broad range of customers by providing an attractive price−value proposition, with prices that are generally more affordable thanthose of our upscale competitors. Additionally, we believe we offer service that is superior to that of most casual dining operators. The price of a typical meal,including beverages, ranges from $16 to $28 for lunch and $37 to $62 for dinner, with an average of approximately $21 and $47, respectively. Over the past fewyears, we have enhanced our menu to offer our customers a more affordable dining option by including a selection of lower priced items on our menu. Forexample, we offer a variety of lunch specials starting at $5.95. We believe even the price sensitive diner values our superior service, and we have receivedrecognition from our customers and industry awards for our service quality.
The combination of our high quality seafood, pricing strategy and customer service enables us to attract a broad customer demographic. Most of ourcustomers are 30 to 60 years old, primarily college−educated, in the middle to upper−middle income brackets and split relatively evenly between male andfemale customers, with a significant number of our customers comprising the post−war baby boomer generation. These baby boomers, who are the largestsegment of the U.S. population (approximately 26% of the total) and a primary driver in the restaurant industry, generally have the greatest level of disposableincome and tend to be more focused on better health and specialized diets than other age groups. As our core customers, we believe baby boomers typically
2
Source: McCormick & Schmicks, 10−K, March 14, 2006

Table of Contentsprefer restaurants that offer higher quality food items, stronger flavor profiles and wider menu diversity. In addition to this core customer base, our bar operationsallow us to also capture the 25 to 35 year old professionals, positioning us to attract a younger clientele as dedicated restaurant customers.
Our broad appeal is supported by our catering and banquet services which we offer both in our restaurants and at other locations as customers request. Ourpresence in and near hotels enables us to expand the reach of our banquet offerings. In 2005, banquets accounted for approximately 10% of our revenues.
Entrepreneurial Culture with Corporate Control
A key component of our success for over 34 years and under successive owners has been our commitment to promoting and sustaining an entrepreneurialculture throughout our restaurants while maintaining strong corporate oversight and financial controls. Within this strong corporate infrastructure, each restauranthas profit and loss responsibility and a high degree of operating autonomy. The executive chef and general manager at each restaurant have the flexibility, withinclearly defined corporate guidelines, to structure menus to cater to customer preferences in that restaurant’s market and respond to changes in product availabilityand market conditions. We offer quarterly and annual cash performance incentives to exempt employees at the restaurant level based on the unit’s revenues,profitability and costs, compliance with corporate administrative and payroll guidelines, and the success of other initiatives, such as local communityinvolvement.
We believe our entrepreneurial culture helps us to attract and retain highly qualified and motivated individuals. We have historically retained substantiallyall of our regional chefs and regional managers and our retention rate for our unit general managers and executive chefs is approximately 80%. We believe ourdecentralized, employee−oriented, entrepreneurial culture creates a sense of pride in our company and allows us to ensure quality service execution at therestaurant level. We believe the stability of our management team and operating personnel, coupled with our disciplined but entrepreneurial culture, position usfor the continued success and growth of our concept.
Portability of Our Brand
We have expanded the McCormick & Schmick’s seafood restaurant concept throughout the United States and have competed successfully with bothnational and regional restaurant chains and independent local operators, due in part to the flexibility of our real estate model and our nationwide infrastructure. AtDecember 31, 2005, we operated 59 restaurants in 24 states across the United States and plan to open as many as 30 additional restaurants over the next threeyears.
Our restaurants are designed to have broad consumer appeal. We customize our restaurant design and appearance to appeal to local consumer affinities andpreferences, and have many restaurants located in buildings that have local significance, including some historic buildings. We have a proven track record ofsuccessfully opening restaurants in a variety of sizes, typically ranging from 6,000 to 14,000 square feet and in a number of real estate formats, including bothfreestanding and in−line locations. We believe the flexibility of our real estate model is a competitive advantage, allowing us to cost−effectively andopportunistically open restaurants in attractive markets without being constrained by a standard prototype or other limiting real estate factors.
We compete on a unit−by−unit basis with independent local restaurant operators while leveraging the operating strengths of our national infrastructure. Wehave successfully executed our concept at the local level while maintaining quality and consistency on a national basis in a manner that is not formulaic and thatenables us to celebrate the uniqueness of each of our markets. We believe the breadth and scale of our restaurant operations and our over 34 years of experiencein the business give us a competitive advantage in terms of the quality, sourcing and freshness of our menu offerings, and flexibility of price points, making ourmodel difficult to replicate. This competitive advantage contributes to our brand’s reputation for quality and service in the affordable upscale dining sector,which we believe commands strong loyalty from our customers.
3
Source: McCormick & Schmicks, 10−K, March 14, 2006

Table of ContentsOur Growth Strategy
We believe our flexible business model, combined with our fresh menu offerings, professional customer service and inviting restaurant environment,provide us with significant opportunities to further grow our business. Key elements of our growth strategy include the following:
Expansion in Existing Markets
We remain focused on the disciplined growth of our McCormick & Schmick’s brand in our existing markets. We believe we have established thenecessary market analysis and site selection procedures for identifying new unit opportunities in these markets. In particular, we will continue to evaluateopportunities in affluent suburban areas near existing units in downtown areas to better diversify our presence in existing markets. This strategy enables us toachieve a higher degree of market penetration and brand awareness, resulting in increased repeat business from our broad and diverse customer base.Additionally, we will further leverage the economies of scale of our operations to enhance our competitive advantage against independent local competitors,principally in the areas of advertising, purchasing and distribution infrastructure. We intend to open six restaurants in existing markets in 2006.
Entry into New Markets
In selecting new market opportunities, we continue to focus on downtown and affluent suburban areas that have large middle to upper−middle incomepopulations, have high customer traffic from thriving businesses or retail markets, and that are convenient for and appealing to business and leisure travelers. Wewill continue to promote the McCormick & Schmick’s brand image and our broad appeal by opening new restaurants in prime real estate locations and bycustomizing each new restaurant to the local market. We intend to open two additional restaurants in new markets in 2006.
Capture of Ancillary Business Opportunities
We will continue to pursue secondary opportunities that are complementary to our primary concept and further our growth objectives. We operate sixrestaurants under the name M&S Grill and one under the name Jake’s Grill, each of which offers an alternative menu to that of our seafood restaurants. Theserestaurants are located near our existing seafood restaurants to take advantage of management and operating efficiencies. We will also continue to considercatering opportunities and management agreements with hotels. We believe entering into management agreements with hotels gives our brand additionalexposure to business and leisure travelers, requires minimal initial investment and is therefore low−risk, and is profitable. We operate two restaurants undermanagement agreements with hotels.
Unit Level Economics
Our average investment per restaurant opened since 1997 has been approximately $2.7 million, including leasehold improvements, furniture, fixtures andequipment, and net of landlord incentive allowances. As a result of the reduction in the size of our restaurant prototype, to facilitate our entry into a greatervariety of markets and provide us with increased flexibility with site selection, we anticipate that our average investment per restaurant will be approximately$2.4 million going forward, consistent with the average investment incurred for the restaurants we opened in 2005. We believe our focus on a traditional décorhas allowed us to benefit from lower restaurant−level maintenance or upgrade costs than those incurred by some of our competitors.
The average unit volume for restaurants opened from 1997 through 2002 was approximately $5.4 million by the third year of operations. These restaurantswere, on average, approximately 10,300 square feet each. Since the beginning of 2002, we have opened 22 new company−owned restaurants, which averagedapproximately 7,900 square feet each. Our growth model assumes average unit volumes for our 8,000 square feet restaurants of $4.4 million in the third year ofoperations.
4
Source: McCormick & Schmicks, 10−K, March 14, 2006

Table of ContentsMenu, Food Preparation, Quality Control and Purchasing
Most of our menu items are prepared from scratch daily at each restaurant and each order is assembled when the order is placed with the kitchen staff.Each restaurant has an executive chef responsible for overseeing kitchen operations, including planning the daily−printed menu and ordering necessaryingredients and supplies. Each executive chef is assisted by two to four sous chefs, who help to manage food preparation and service timing.
We maintain strict quality standards at all of our restaurants. We expect each of our employees to adhere to these standards, and it is the responsibility ofthe general manager and the executive chef at each restaurant to ensure these standards are upheld. We are committed to providing our guests with high quality,fresh products and superior service. We regularly hold senior management meetings designed to re−emphasize McCormick & Schmick’s philosophy, culture,standards of operation and culinary development. Through use of our standard training materials and our commitment to the hiring, development and training ofchefs, we are able to maintain high standards and guidelines for our regularly purchased seafood species.
At the restaurant level, purchasing is primarily directed by the executive chef, who is trained in our purchasing practices and philosophy and is supervisedby an experienced regional chef. To provide the freshest ingredients and products and to improve operating efficiencies between purchase and use, eachexecutive chef determines the daily requirements for food ingredients, products and supplies. The executive chef orders accordingly from local suppliers andregional and national distributors. Fresh seafood is sourced through multiple vendors in varying geographic regions and delivered daily to each restaurant.
We encourage each of our restaurants to purchase seafood from a network of preferred vendors we have identified as consistently supplying seafood thatmeets our high standards. The identification and selection of seafood suppliers is reviewed regularly based on product quality, sanitation, fishing practices,pricing and customer service. We prefer suppliers who use day−boats rather than those who are at sea for multiple days because their product is typically fresher.Our national and regional presence allows us to achieve better quality and pricing terms for key products, such as fresh fin fish and shellfish, than most of ourcompetitors. Other food products, such as prime beef and dry goods, are sourced primarily from SYSCO Corporation, a national food distributor, while liquor,beer and wine are purchased from local distributors. SYSCO accounted for approximately 12% of our food purchases in 2005. No other vendor accounted formore than 10% of our purchases in 2005.
Restaurant Design and Atmosphere
Our restaurant designs and décor are intended to capture distinctive attributes of each local market, varying from traditional New England−style fishhouses to contemporary dinner houses with waterfront views. Some of our restaurants are located in historic buildings, which reinforces our commitment to localdesign elements and further promotes the appeal and ambience of our restaurants. Our flexible approach to our restaurant designs contributes to the uniqueness ofeach restaurant and allows us to successfully compete in a sector comprised primarily of independent, locally−owned and operated seafood restaurants.
Our restaurants are generally modeled after two styles:
• “turn−of−the−century” style, which blends different types and colors of wood; and
• classic art deco style.
Additionally, our interior décor fosters an inviting atmosphere that we believe is equally appealing to both men and women.
Our wait staff and bartenders are typically uniformed in traditional white jackets and black ties and are committed to providing our guests with service tofurther enhance their dining experience.
5
Source: McCormick & Schmicks, 10−K, March 14, 2006

Table of ContentsOur Full Service Bar
We believe the success of our first restaurant, Jake’s Famous Crawfish, was largely driven by its bar operation. This enhanced the restaurant’s dining roombusiness by building clientele and serving as a social forum. Our bar operation remains a cornerstone of our restaurant concept and central to our broad appeal.We seek to attract patrons to our bar as a final destination, where they can enjoy a broad selection of liquors, wines and beers in a traditional yet livelyenvironment. Our focus on traditional mixing methods reinforces our appeal and underlines our focus on product quality and professional service. Our cocktaildrinks are hand−poured and shaken and all our juices are freshly squeezed. We also offer value−priced items from our full restaurant menu at our bars, whichtends to attract younger customers whom we aim to develop into regular restaurant customers.
We operate our bars to drive sales to our restaurants. Each bar is a profit center, rather than a mere holding area for diners. In 2005, alcohol sales accountedfor approximately 30% of our revenues in our restaurants and contributed higher gross margins than food sales, allowing us the flexibility to offer lower prices onsome of our menu items, which helps us maintain our broad appeal.
Layout and Use of Space
Our restaurant model offers us the flexibility to open restaurants in prime downtown or suburban areas. We have a proven track record of openingrestaurants in sizes typically ranging from 6,000 to 14,000 square feet and in a range of real estate formats, including both freestanding and in−line locations. Thetypical size for our current restaurant prototype is 8,000 square feet. We believe the flexibility of our real estate model is a competitive advantage, allowing us tocost−effectively and opportunistically open restaurants in attractive markets without being constrained by a standard prototype or other limiting real estatefactors.
6
Source: McCormick & Schmicks, 10−K, March 14, 2006

Table of ContentsRestaurant Locations, Lease Arrangements and Management Fee Arrangements
At December 31, 2005, we operated 59 restaurants in 24 states. We lease all of our restaurant sites, except for the two we operate under managementagreements. Terms vary by restaurant, but we generally lease space for 10 to 20 years and negotiate one to three five−year renewal options.
Restaurant Name City Year Opened
AlabamaMcCormick & Schmick’s Seafood Restaurant Birmingham 2004
ArizonaMcCormick & Schmick’s Seafood Restaurant Phoenix 1999
CaliforniaMcCormick & Schmick’s Seafood Restaurant Irvine 1989McCormick & Kuleto’s Seafood Restaurant San Francisco 1991McCormick & Schmick’s Seafood Restaurant Los Angeles 1992McCormick & Schmick’s Seafood Restaurant Pasadena 1993McCormick & Schmick’s a Pacific Seafood Grill Beverly Hills 1994McCormick & Schmick’s Seafood Restaurant El Segundo 1998Spenger’s Fresh Fish Grotto Berkeley 1999The Seafood Brasserie* Santa Rosa 2002McCormick & Schmick’s Seafood Restaurant San Jose 2004McCormick & Schmick’s Seafood Restaurant* San Diego 2004
ColoradoMcCormick’s Fish House & Bar Denver 1987McCormick & Schmick’s Seafood Restaurant Denver 2004
District of ColumbiaMcCormick & Schmick’s Seafood Restaurant Washington 1996M&S Grill Washington 1998McCormick & Schmick’s Seafood Restaurant Washington 2004
FloridaMcCormick & Schmick’s Seafood Restaurant Orlando 2002
GeorgiaMcCormick & Schmick’s Seafood Restaurant Atlanta 2000McCormick & Schmick’s Seafood Restaurant Atlanta 2002
IllinoisMcCormick & Schmick’s Seafood Restaurant Chicago 1998
IndianaMcCormick & Schmick’s Seafood Restaurant Indianapolis 2005
MarylandMcCormick & Schmick’s Seafood Restaurant Baltimore 1998McCormick & Schmick’s Seafood Restaurant Bethesda 1999M&S Grill Baltimore 2003
MassachusettsMcCormick & Schmick’s Seafood Restaurant Boston 2000McCormick & Schmick’s Seafood Restaurant Boston 2001
MichiganMcCormick & Schmick’s Seafood Restaurant Troy 2001
MinnesotaMcCormick & Schmick’s Seafood Restaurant Minneapolis 2000
7
Source: McCormick & Schmicks, 10−K, March 14, 2006

Table of Contents
Restaurant Name City Year Open
MissouriMcCormick & Schmick’s Seafood Restaurant Kansas City 2000M&S Grill Kansas City 2005
NevadaMcCormick & Schmick’s Seafood Restaurant Las Vegas 1998
New JerseyMcCormick & Schmick’s Seafood Restaurant Hackensack 2002McCormick & Schmick’s Seafood Restaurant Bridgewater 2003
New YorkMcCormick & Schmick’s Seafood Restaurant New York 2004
North CarolinaMcCormick & Schmick’s Seafood Restaurant Charlotte 2005McCormick & Schmick’s Seafood Restaurant Charlotte 2005
OregonJake’s Famous Crawfish Portland 1972McCormick & Schmick’s Seafood Restaurant Portland 1979McCormick’s Fish House & Bar Beaverton 1981McCormick & Schmick’s Harborside at the Marina Portland 1985Jake’s Grill / Jake’s Catering Portland 1994The Heathman Restaurant Portland 2000M&S Grill Tigard 2005
PennsylvaniaMcCormick & Schmick’s Seafood Restaurant Philadelphia 2001McCormick & Schmick’s Seafood Restaurant Pittsburgh 2005
Rhode IslandMcCormick & Schmick’s Seafood Restaurant Providence 2004
TexasMcCormick & Schmick’s Seafood Restaurant Houston 1999McCormick & Schmick’s Seafood Restaurant Dallas 2003McCormick & Schmick’s Seafood Restaurant Austin 2004
VirginiaMcCormick & Schmick’s Seafood Restaurant Reston 1997McCormick & Schmick’s Seafood Restaurant McLean 2000M&S Grill Reston 2004McCormick & Schmick’s Seafood Restaurant Arlington 2004
WashingtonMcCormick’s Fish House & Bar Seattle 1977McCormick & Schmick’s Seafood Restaurant Seattle 1984McCormick & Schmick’s Catering at the Museum of Flight in Seattle Seattle 1994McCormick & Schmick’s Harborside on Lake Union Seattle 1996McCormick & Schmick’s Seafood Restaurant Bellevue 2005
* We operate these restaurants under management agreements.
Site Selection
We believe our site selection strategy is critical to our growth strategy. We carefully consider potential markets and we devote substantial time and effortto evaluating each potential restaurant site. We identify new
8
Source: McCormick & Schmicks, 10−K, March 14, 2006

Table of Contentsrestaurant development opportunities through an established real estate broker network and developer relationships. Our site specifications are flexible and webelieve we consider a broader range of possible locations than most of our regional and national competitors. The criteria we consider in developing ourexpansion plans and in siting new restaurants include:
• population density and the income and educational level of the population;
• competitive conditions and price points;
• estimates of the return on investment;
• available square footage and lease economics;
• the proximity of hotels and office space and the density of pedestrian and vehicle traffic;
• the suitability of the site for an affordable, upscale restaurant with a traditional ambience;
• capacity expansion possibilities; and
• management’s experience in the market and the locations of our existing restaurants.
A majority of our restaurants are located in high−traffic, metropolitan areas and several are located in historic buildings. We believe there are manyadditional markets that meet our demographic and geographic profiles.
Of our 59 restaurants, including the two we operate under management agreements, 20 were opened within the last three years and 27 were opened withinthe last five years. Although our expansion has increased in the last five years, we believe it has been steady, controlled and prudent. We opened sevenrestaurants in 2005 and our plan for 2006 includes the opening of eight restaurants. We anticipate opening ten, twelve and fourteen restaurants in 2007, 2008 and2009, respectively. The typical lead−time from the selection of a location to the opening of a restaurant at that location is approximately twelve to fifteen months.
Marketing and Advertising
The goals of our marketing efforts are to:
• increase comparable restaurant sales by attracting new guests;
• increase the frequency of visits by our current guests;
• support new restaurant openings to achieve sales and profit goals; and
• communicate and promote the uniqueness, appeal, quality and consistency of our brand.
In 2005, our marketing expenditures, 93% of which were allocated at the local level, constituted approximately 2.5% of revenues.
Source: McCormick & Schmicks, 10−K, March 14, 2006

Local Marketing
Approximately 60 days before a scheduled restaurant opening, our local public relations firms collaborate with the local media to publicize our restaurantopening and to generate awareness of our brand. For example, we typically host several social events in the local community to generate publicity before theofficial opening of a restaurant. Post−opening, we maintain a strong relationship with our public relations firms and remain focused on our commitment topromoting our brand in the local market through various programs, such as cooking demonstrations by our chefs or discussions on seafood and related offeringson local news broadcasts. We also advertise with local daily and weekly publications, key monthly magazines and local business journals in most urban markets.
We expect each of our restaurants to actively promote our special holiday programs and sponsor community events, such as donations, charitable andnon−profit organizations and visual and performing cultural arts activities. We believe that, in addition to benefiting our local communities, these activitiesgenerate positive media attention and publicity for our brand and enhance our local public image.
9
Source: McCormick & Schmicks, 10−K, March 14, 2006

Table of ContentsNational Marketing
In 2005, we incurred approximately 16% of our advertising expenditures at the national level. Our national campaign focuses on national periodicals suchas United Airlines’, Delta Airlines’, Northwest Airlines’ and Alaska Airlines’ in−flight magazines and WHERE Magazine. Additionally, we advertise across thenational network of The Business Journal publication.
To reinforce our broad differentiation, we highlight the breadth and freshness of our seafood, in both local and national advertising. We periodically offerpromotional certificates and maintain contact with organizations in the travel and convention industries, such as hotels, travel agents, convention centers andlocal shops, to further enhance both brand and restaurant location awareness and to target specific guest groups.
Operations
Restaurant Management
Our restaurant operations are organized into three divisions (West Coast, Southeast and Northeast), each with a vice president of operations overseeing allaspects of restaurant operations within the designated division, including financial performance, new restaurant openings, capital expenditure requests,management development and marketing.
Thirteen multi−unit managers, of whom five are regional managers and eight are regional chefs, are each responsible for five to eleven restaurants andreport to a vice president of operations. Both regional managers and regional chefs are responsible for overall restaurant operations, but have an increased focuson their respective areas of expertise. For example, regional chefs focus more heavily on negotiating food costs, ensuring high food quality, developing andnurturing executive and sous chefs and being responsive to overall kitchen staff needs. Regional managers focus primarily on revenues, profitability,front−of−house management and marketing issues.
Our typical restaurant management team consists of a general manager and an executive chef, two to four assistant managers, two to four sous chefs and,in some cases, a meeting planner/banquet coordinator. The remaining restaurant−level employees are non−salaried personnel varying in number based onrestaurant size. Our typical restaurant employs 80 to 90 full−time and part−time employees. The general manager is responsible for all management functions,including purchasing (other than food), hiring and firing and oversight of restaurant−level bookkeeping and cash controls. The executive chef is responsible formanaging all kitchen functions, including training, menu design and food purchasing, quality and presentation.
We emphasize frequent interaction between our vice presidents, regional managers and restaurant level management. As a result, neither vice presidentsnor regional managers operate out of our corporate office and are routinely accessible to restaurant staff.
All management levels in operations, from vice presidents to assistant managers, participate in incentive bonus programs. These incentive programs aredesigned to establish specific goals and objectives and to ensure accountability and reward performance.
Restaurant Operations
Our restaurants are generally open 365 days each year, serve lunch and dinner and are generally open from 11:00 a.m. to 11:00 p.m. Sunday throughThursday and 11:00 a.m. to 1:00 a.m. Friday and Saturday. In 2005, dinner comprised approximately 76% of our revenues, while lunch comprised approximately24% of revenues, and our restaurants served an average of 1,100 guests per week during lunch and 1,600 guests per week during dinner. To accommodate guestswho have limited time available during lunch, we offer a 45−minute lunch guarantee.
Additionally, we offer catering and banquet services both in our restaurants and at other locations as customers request. Our presence in and near hotelsenables us to expand the reach of our banquet offerings. In 2005, banquets accounted for approximately 10% of our revenues.
10
Source: McCormick & Schmicks, 10−K, March 14, 2006

Table of ContentsEmployees
As of December 31, 2005 we employed 5,401 persons, of whom 530 were salaried and 4,871 were hourly personnel. None of our employees arerepresented by unions and we consider our relationship with our employees to be good. Our employees are summarized by major functional area in the tablebelow.
Functional AreaNumber ofEmployees
VPs/regional managers/regional chefs 16General managers 61Assistant managers 190Executive chefs 60Sous chefs 157Non−salaried restaurant staff 4,834Corporate salaried 46Corporate non−salaried 37
Total 5,401
Management Information Systems
All of our information processing is managed from our headquarters in Portland, Oregon. Point−of−sale terminals at each unit allow us to generate thedaily reports needed to manage our restaurants and our business. These reports include, among other things, daily and weekly revenues, guest counts, meal periodsales breakouts and food and liquor consumption. The data from the point of sale system is electronically transferred each night to a third party intranet provider,with the data then accessible by us through the Internet. Financial operating results are reviewed at the corporate office and studied by unit level and regionalmanagement. Variances from expectations are analyzed and addressed at frequent financial meetings.
Industry and Competition
Industry
We operate in a highly competitive industry that is affected by changes in consumer eating habits and dietary preferences, population trends and trafficpatterns, and local and national economic conditions. Key competitive factors in the industry include the taste, quality and price of the food products offered,quality and speed of guest service, brand name identification, attractiveness of facilities, restaurant location, and overall dining experience. We believe wecompete favorably with respect to each of these factors and have successfully overcome the following barriers faced by seafood restaurants:
• developing and maintaining consistent, reliable sources of high quality, fresh seafood;
• it is often not possible to hedge against increases in seafood costs;
• the preparing and handling of seafood is more complicated than for other types of cuisine; and
• consumer tastes in seafood products vary from region to region.
Competition
While we compete with a range of restaurant operators for consumers’ dining preferences and with both restaurants and retailers for site locations andpersonnel requirements, we consider our principal competitors to include the following:
• independent, local seafood houses;
Source: McCormick & Schmicks, 10−K, March 14, 2006

• regional seafood restaurant concepts, such as Cameron Mitchell’s, King’s Seafood, Landry’s Seafood, Legal Sea Foods, Oceanaire and Roy’s; and
11
Source: McCormick & Schmicks, 10−K, March 14, 2006

Table of Contents
• upscale “steak and chop” houses such as Capital Grille, Morton’s, Ruth’s Chris, Smith & Wollensky and The Palm, among others.
Available Information
We make available free of charge on or through our website at www.mccormickandschmicks.com our annual reports on Form 10−K, quarterly reports onForm 10−Q, current reports on Form 8−K and amendments to these reports filed or furnished pursuant to Section 13(a) or 15(d) of the Exchange Act as soon asreasonably practicable after we file these materials with the Securities and Exchange Commission. These materials are also available on the Security andExchange Commission’s website at www.sec.gov.
ITEM 1A. RISK FACTORS
Restaurant companies have been the target of class−actions and other lawsuits alleging, among other things, violation of federal and state law.
We are subject to a variety of claims arising in the ordinary course of our business brought by or on behalf of our customers or employees, includingpersonal injury claims, contract claims, and employment−related claims. In recent years, a number of restaurant companies have been subject to lawsuits,including class−action lawsuits, alleging violations of federal and state law regarding workplace, employment and similar matters. A number of these lawsuitshave resulted in the payment of substantial damages by the defendants. Similar lawsuits have been instituted against us from time to time. Regardless of whetherany claims against us are valid or whether we are ultimately determined to be liable, claims may be expensive to defend and may divert time and money awayfrom our operations and hurt our performance. A judgment significantly in excess of our insurance coverage for any claims could materially adversely affect ourfinancial condition or results of operations, and adverse publicity resulting from these allegations may materially adversely affect our business. We may incursubstantial damages and expenses resulting from lawsuits, which could have a material adverse effect on our business.
Our ability to expand our restaurant base is influenced by factors beyond our control and therefore we may not be able to achieve our planned growth.
Our growth strategy depends in large part on our ability to open new restaurants and to operate these restaurants profitably. Delays or failures in openingnew restaurants could impair our ability to meet our growth objectives. We have in the past experienced delays in restaurant openings and may experience similardelays in the future. Our ability to expand our business successfully will depend upon numerous factors, including:
• hiring, training and retaining skilled management, chefs and other qualified personnel to open, manage and operate new restaurants;
• locating and securing a sufficient number of suitable new restaurant sites in new and existing markets on acceptable lease terms;
• managing the amount of time and construction and development costs associated with the opening of new restaurants;
• obtaining adequate financing for the construction of new restaurants;
• securing governmental approvals and permits required to open new restaurants in a timely manner, if at all;
• successfully promoting our new restaurants and competing in the markets in which our new restaurants are located; and
• general economic conditions.
Some of these factors are beyond our control. We may not be able to achieve our expansion goals and our new restaurants may not be able to achieveoperating results similar to those of our existing restaurants.
12
Source: McCormick & Schmicks, 10−K, March 14, 2006

Table of ContentsUnexpected expenses and low market acceptance could adversely affect the profitability of restaurants that we open in new markets.
Our growth strategy includes opening restaurants in markets where we have little or no operating experience and in which potential customers may not befamiliar with our restaurants. The success of these new restaurants may be affected by different competitive conditions, consumer tastes and discretionaryspending patterns, and our ability to generate market awareness and acceptance of the McCormick & Schmick’s brand. As a result, we may incur costs related tothe opening, operation and promotion of these new restaurants that are greater than those incurred in other areas. Even though we may incur substantialadditional costs with these new restaurants, they may attract fewer customers than our more established restaurants in existing markets. Sales at restaurants weopen in new markets may take longer to reach our average annual sales, if at all. As a result, the results of operations at our new restaurants may be inferior tothose of our existing restaurants. We may not be able to profitably open restaurants in new markets.
Our growth may strain our infrastructure and resources, which could slow our development of new restaurants and adversely affect our ability to manageour existing restaurants.
We opened nine company−owned restaurants and began operating an additional restaurant under a management contract in 2004. We opened sevencompany−owned restaurants in 2005 and we plan to open eight in 2006. Our expansion and our future growth may strain our restaurant management systems andresources, financial controls and information systems. Those demands on our infrastructure and resources may also adversely affect our ability to manage ourexisting restaurants. If we fail to continue to improve our infrastructure or to manage other factors necessary for us to meet our expansion objectives, ouroperating results could be materially and adversely affected.
Our ability to raise capital in the future may be limited, which could adversely impact our growth.
Changes in our operating plans, acceleration of our expansion plans, lower than anticipated sales, increased expenses or other events described in thissection may require us to seek additional debt or equity financing. Financing may not be available on acceptable terms and our failure to raise capital whenneeded could negatively impact our growth and our financial condition and results of operations. Additional equity financing may be dilutive to the holders ofour common stock, and debt financing, if available, may involve significant cash payment obligations and covenants that restrict our ability to operate ourbusiness.
Our operations are susceptible to changes in food availability and costs, which could adversely affect our operating results.
Our profitability depends significantly on our ability to anticipate and react to changes in seafood costs. We rely on local, regional and national suppliers toprovide our seafood. Increases in distribution costs or sale prices or failure to perform by these suppliers could cause our food costs to increase. We could alsoexperience significant short−term disruptions in our supply if a significant supplier failed to meet its obligations. The supply of seafood is more volatile thanother types of food. The type, variety, quality and price of seafood is subject to factors beyond our control, including weather, governmental regulation,availability and seasonality, each of which may affect our food costs or cause a disruption in our supply. Changes in the price or availability of certain types ofseafood could affect our ability to offer a broad menu and price offering to customers and could materially adversely affect our profitability.
Our operating results may fluctuate significantly and could fall below the expectations of securities analysts and investors due to seasonality and otherfactors, resulting in a decline in our stock price.
Our operating results may fluctuate significantly because of several factors, including:
• our ability to achieve and manage our planned expansion;
• our ability to achieve market acceptance, particularly in new markets;
13
Source: McCormick & Schmicks, 10−K, March 14, 2006

Table of Contents
• our ability to raise capital in the future;
• changes in the availability and costs of food;
• the loss of key management personnel;
• the concentration of our restaurants in specific geographic areas;
• our ability to protect our name and logo and other proprietary information;
• changes in consumer preferences or discretionary spending;
• fluctuations in the number of visitors or business travelers to downtown locations;
• health concerns about seafood or other foods;
• our ability to attract, motivate and retain qualified employees;
• increases in labor costs;
• the impact of federal, state or local government regulations relating to our employees or the sale or preparation of food and the sale of alcoholicbeverages;
• the impact of litigation;
• the effect of competition in the restaurant industry; and
• economic trends generally.
Our business also is subject to seasonal fluctuations. Historically, sales in most of our restaurants have been higher during the second and fourth quarter ofeach year. As a result, our quarterly and annual operating results and restaurant sales may fluctuate significantly as a result of seasonality and the factorsdiscussed above. Accordingly, results for any one fiscal quarter are not necessarily indicative of results to be expected for any other quarter or for any year andcomparable restaurant sales for any particular future period may decrease. Our operating results may also fall below the expectations of securities analysts andinvestors. In that event, the price of our common stock would likely decrease.
A decline in visitors or business travelers to downtown areas where our restaurants are located could negatively affect our restaurant sales.
Many of our restaurants are located in downtown areas. We depend on both local residents and business travelers to frequent these locations. If the numberof visitors to downtown areas declines due to economic or other conditions, changes in consumer preferences, changes in discretionary consumer spending or forother reasons, our revenues could decline significantly and our results of operations could be adversely affected.
If we lose the services of any of our key management personnel our business could suffer.
Source: McCormick & Schmicks, 10−K, March 14, 2006

We depend on the services of our key management personnel, including Saed Mohseni, our chief executive officer, and Douglas L. Schmick, ourpresident. If we lose the services of any members of our senior management or key personnel for any reason, we may be unable to replace them with qualifiedpersonnel, which could have a material adverse effect on our business and growth. We do not carry key person life insurance on any of our executive officers.
Many of our restaurants are concentrated in local or regional areas and, as a result, we are sensitive to economic and other trends and developments in theseareas.
We operate five restaurants in the Seattle, Washington area, seven in the Portland, Oregon area and 10 in California; our East Coast restaurants areconcentrated in and around Washington, D.C. As a result, adverse economic conditions, weather and labor markets in any of these areas could have a materialadverse effect on our overall results of operations. For example, ice storms in northwestern Oregon in January 2004 affected sales at six, or 13%, of our thenexisting restaurants.
14
Source: McCormick & Schmicks, 10−K, March 14, 2006

Table of ContentsIn addition, given our geographic concentrations, negative publicity regarding any of our restaurants in these areas could have a material adverse effect on
our business and operations, as could other regional occurrences such as local strikes, oil spills, terrorist attacks, energy shortages or increases in energy prices,droughts or earthquakes or other natural disasters.
Our success depends on our ability to protect our proprietary information. Failure to protect our trademarks, service marks or trade secrets could adverselyaffect our business.
Our business prospects depend in part on our ability to develop favorable consumer recognition of the McCormick & Schmick’s name. AlthoughMcCormick & Schmick’s, M&S Grill and other of our service marks are federally registered trademarks with the United States Patent and Trademark Office, ourtrademarks could be imitated in ways that we cannot prevent. In addition, we rely on trade secrets, proprietary know−how, concepts and recipes. Our methods ofprotecting this information may not be adequate, however, and others could independently develop similar know−how or obtain access to our trade secrets,know−how, concepts and recipes. Moreover, we may face claims of misappropriation or infringement of third parties’ rights that could interfere with our use ofour proprietary know−how, concepts, recipes or trade secrets. Defending these claims may be costly and, if unsuccessful, may prevent us from continuing to usethis proprietary information in the future, and may result in a judgment or monetary damages.
We do not maintain confidentiality and non−competition agreements with all of our executives, key personnel or suppliers. If competitors independentlydevelop or otherwise obtain access to our know−how, concepts, recipes or trade secrets, the appeal of our restaurants could be reduced and our business could beharmed.
Our current insurance policies may not provide adequate levels of coverage against all claims.
We believe we maintain insurance coverage that is customary for businesses of our size and type. However, there are types of losses we may incur thatcannot be insured against or that we believe are not commercially reasonable to insure. These losses, if they occur, could have a material and adverse effect onour business and results of operations.
Expanding our restaurant base by opening new restaurants in existing markets could reduce the business of our existing restaurants.
Our growth strategy includes opening restaurants in markets in which we already have existing restaurants. We may be unable to attract enough customersto the new restaurants for them to operate at a profit. Even if we are able to attract enough customers to the new restaurants to operate them at a profit, thosecustomers may be former customers of one of our existing restaurants in that market and the opening of new restaurants in the existing market could reduce therevenue of our existing restaurants in that market.
We may not be able to successfully integrate into our business the operations of restaurants that we acquire, which may adversely affect our business,financial condition and results of operations.
We may seek to selectively acquire existing restaurants and integrate them into our business operations. Achieving the expected benefits of any restaurantsthat we acquire will depend in large part on our ability to successfully integrate the operations of the acquired restaurants and personnel in a timely and efficientmanner. The risks involved in such restaurant acquisitions and integration include:
• challenges and costs associated with the acquisition and integration of restaurant operations located in markets where we have limited or noexperience;
• possible disruption to our business as a result of the diversion of management’s attention from its normal operational responsibilities and duties; and
15
Source: McCormick & Schmicks, 10−K, March 14, 2006

Table of Contents
• consolidation of the corporate, information technology, accounting and administrative infrastructure and resources of the acquired restaurants into ourbusiness.
Future acquisitions of existing restaurants, which may be accomplished through a cash purchase transaction or the issuance of our equity securities, or acombination of both, could result in dilutive issuances of our equity securities, the incurrence of debt and contingent liabilities and impairment charges related togoodwill and other intangible assets, any of which could harm our business and financial condition.
We may be unable to successfully integrate the operations, or realize the anticipated benefits, of any restaurant that we acquire. If we cannot overcome thechallenges and risks that we face in integrating the operations of newly acquired restaurants, our business, financial condition and results of operations could beadversely affected.
Negative publicity concerning food quality, health and other issues and costs or liabilities resulting from litigation may have a material adverse effect on ourresults of operations.
We are sometimes the subject of complaints or litigation from customers alleging illness, injury or other food quality, health or operational concerns.Litigation or adverse publicity resulting from these allegations may materially and adversely affect us or our restaurants, regardless of whether the allegations arevalid or whether we are liable. Further, these claims may divert our financial and management resources from revenue−generating activities and businessoperations.
Health concerns relating to the consumption of seafood or other foods could affect consumer preferences and could negatively impact our results ofoperations.
We may lose customers based on health concerns about the consumption of seafood or negative publicity concerning food quality, illness and injurygenerally, such as negative publicity concerning the accumulation of mercury or other carcinogens in seafood, e−coli, “mad cow” or “foot−and−mouth” disease,publication of government or industry findings about food products served by us or other health concerns or operating issues stemming from one of ourrestaurants. In addition, our operational controls and training may not be fully effective in preventing all food−borne illnesses. Some food−borne illness incidentscould be caused by food suppliers and transporters and would be outside of our control. Any negative publicity, health concerns or specific outbreaks offood−borne illnesses attributed to one or more of our restaurants, or the perception of an outbreak, could result in a decrease in guest traffic to our restaurants andcould have a material adverse effect on our business.
Changes in consumer preferences or discretionary consumer spending could negatively impact our results of operations.
The restaurant industry is characterized by the introduction of new concepts and is subject to rapidly changing consumer preferences, tastes and purchasinghabits. Our continued success depends in part upon the popularity of seafood and the style of dining we offer. Shifts in consumer preferences away from thiscuisine or dining style could materially and adversely affect our operating results. Our success will depend in part on our ability to anticipate and respond tochanging consumer preferences, tastes and purchasing habits, and to other factors affecting the restaurant industry, including new market entrants anddemographic changes. If we change our concept and menu to respond to changes in consumer tastes or dining patterns, we may lose customers who do not likethe new concept or menu, and may not be able to attract a sufficient new customer base to produce the revenue needed to make the restaurant profitable. Oursuccess also depends to a significant extent on numerous factors affecting discretionary consumer spending, including economic conditions, disposable consumerincome and consumer confidence. Adverse changes in these factors could reduce guest traffic or impose practical limits on pricing, either of which could harmour results of operations.
16
Source: McCormick & Schmicks, 10−K, March 14, 2006

Table of ContentsLabor shortages or increases in labor costs could slow our growth or harm our business.
Our success depends in part upon our ability to attract, motivate and retain a sufficient number of qualified employees, including regional operationalmanagers and regional chefs, restaurant general managers and executive chefs, necessary to continue our operations and keep pace with our growth. Qualifiedindividuals are in short supply and competition for these employees is intense. If we are unable to recruit and retain sufficient qualified individuals, our businessand our growth could be adversely affected. Additionally, competition for qualified employees could require us to pay higher wages, which could result in higherlabor costs. If our labor costs increase, our results of operations will be negatively affected.
We may incur costs or liabilities and lose revenue, and our growth strategy may be adversely impacted, as a result of government regulation.
Our restaurants are subject to various federal, state and local government regulations, including those relating to employees, the preparation and sale offood and the sale of alcoholic beverages. These regulations affect our restaurant operations and our ability to open new restaurants.
Each of our restaurants must obtain licenses from regulatory authorities to sell liquor, beer and wine, and each restaurant must obtain a food service licensefrom local health authorities. Each liquor license must be renewed annually and may be revoked at any time for cause, including violation by us or our employeesof any laws and regulations relating to the minimum drinking age, advertising, wholesale purchasing and inventory control. In California, where we operate 10restaurants, the number of alcoholic beverage licenses available is limited and licenses are traded at market prices.
The failure to maintain our food and liquor licenses and other required licenses, permits and approvals could adversely affect our operating results.Difficulties or failure in obtaining the required licenses and approvals could delay or result in our decision to cancel the opening of new restaurants.
We are subject to “dram shop” statutes in some states. These statutes generally allow a person injured by an intoxicated person to recover damages from anestablishment that wrongfully served alcoholic beverages to the intoxicated person. A judgment substantially in excess of our insurance coverage could harm ouroperating results and financial condition.
Various federal and state labor laws govern our relationship with our employees and affect operating costs. These laws include minimum wagerequirements, overtime pay, unemployment tax rates, workers’ compensation rates, and citizenship requirements. Additional government−imposed increases inminimum wages, overtime pay, paid leaves of absence and mandated health benefits, increased tax reporting and tax payment requirements for employees whoreceive gratuities, or a reduction in the number of states that allow tips to be credited toward minimum wage requirements could harm our operating results andfinancial condition.
The Federal Americans with Disabilities Act prohibits discrimination on the basis of disability in public accommodations and employment. Although ourrestaurants are designed to be accessible to the disabled, we could be required to make modifications to our restaurants to provide service to, or make reasonableaccommodations for, disabled persons.
Our operations and profitability are susceptible to the effects of violence, war and economic trends.
Terrorist attacks and other acts of violence or war and U.S. military reactions to such attacks may negatively affect our operations and an investment in ourshares of common stock. The terrorist attacks in New York and Washington, D.C. on September 11, 2001 led to a temporary interruption in deliveries from someof our suppliers and, we believe, contributed to the decline in average annual comparable restaurant sales in 2001 and 2002.
Future acts of violence or war could cause a decrease in travel and in consumer confidence, decrease consumer spending, result in increased volatility inthe United States and worldwide financial markets and
17
Source: McCormick & Schmicks, 10−K, March 14, 2006

Table of Contentseconomy, or result in an economic recession in the United States or abroad. They could also impact consumer leisure habits, for example, by increasing timespent watching television news programs at home, and may reduce the number of times consumers dine out, which could adversely impact our revenue. Any ofthese occurrences could harm our business, financial condition or results of operations, and may result in the volatility of the market price for our securities andon the future price of our securities.
Terrorist attacks could also directly impact our physical facilities or those of our suppliers, and attacks or armed conflicts may make travel and thetransportation of our supplies and products more difficult and more expensive and ultimately affect our revenues.
We may not be able to compete successfully with other restaurants, which could adversely affect our results of operations.
The restaurant industry is intensely competitive with respect to price, service, location, food quality, ambiance and the overall dining experience. Ourcompetitors include a large and diverse group of restaurant chains and individual restaurants that range from independent local operators to well capitalizednational restaurant companies. Some of our competitors have been in existence for a substantially longer period than we have and may be better established in themarkets where our restaurants are or may be located. Some of our competitors may have substantially greater financial, marketing and other resources than wedo. If our restaurants are unable to compete successfully with other restaurants in new and existing markets, our results of operations will be adversely affected.We also compete with other restaurants for experienced management personnel and hourly employees, and with other restaurants and retail establishments forquality restaurant sites.
ITEM 1B. UNRESOLVED STAFF COMMENTS
None.
ITEM 2. PROPERTIES
Our corporate headquarters are located in Portland, Oregon. We occupy this facility under a lease that terminates in December 2009. We lease all of ourrestaurant facilities, except for two that we operate under management agreements.
ITEM 3. LEGAL PROCEEDINGS
Occasionally, we are a defendant in litigation arising in the ordinary course of our business, including claims resulting from “slip and fall” accidents,employment related claims and claims from guests or employees alleging illness, injury or other food quality, health or operational concerns. None of these typesof litigation, most of which are covered by insurance, has had a material effect on our business, results of operations, financial position or cash flows.
ITEM 4. SUBMISSION OF MATTERS TO A VOTE OF SECURITY HOLDERS
No matters were submitted to a vote of stockholders during the fourth quarter of the fiscal year covered by this report.
ITEM 4A. EXECUTIVE OFFICERS AND OTHER KEY EMPLOYEES
Douglas L. Schmick (age 58) co−founded McCormick & Schmick’s in 1972 and has been our president since March 1997 and Chairman of the Board ofDirectors since 2004. From 1997 through 1999, he was also chief executive officer and served as secretary, treasurer, and chief executive officer from 1974through 1997. Mr. Schmick has served on the board of directors since August 22, 2001. Mr. Schmick received his Bachelor of Science degree from theUniversity of Idaho.
18
Source: McCormick & Schmicks, 10−K, March 14, 2006

Table of ContentsSaed Mohseni (age 43) has been our chief executive officer since January 2000 and became a director in June 2004. Mr. Mohseni joined McCormick &
Schmick’s in 1986 as a general manager. He has also held the positions of senior manager (1988−1993), vice president of operations−California (1993−1997),and senior vice president of operations (1997−1999).
Emanuel (Manny) N. Hilario (age 38) joined McCormick & Schmick’s in April 2004 as chief financial officer. For the four years before joining us,Mr. Hilario was with Angelo and Maxie’s, Inc. (formerly Chart House Enterprises, Inc.) most recently as vice president of finance and chief financial officer.From December 1997 until April 2000, Mr. Hilario was with ACCO North America, a wholly owned subsidiary of Fortune Brands, where he held variouspositions. Previously, he spent nine years with McDonald’s Corporation. Mr. Hilario received his Bachelor of Science and Commerce degree in accounting fromSanta Clara University and is a certified public accountant.
Jerry R. Kelso (age 52) has been the chief internal audit and compliance officer of the Company since April 2004. Mr. Kelso joined us in 1984 as ourcontroller and was vice president of finance and chief financial officer from 1988 to April 2004. He previously worked for nearly seven years with two regionaland local certified public accounting firms. Mr. Kelso received his Bachelor of Arts degree from Central Washington State College and became a certified publicaccountant in 1983.
Jeffrey H. Skeele (age 51) has been a vice president of operations of McCormick & Schmick’s since 1998. He also has held the positions of senior manager(1991−1996) and general manager (1986−1988). From 1988 to 1991, Mr. Skeele was a vice president at West Group Partners. Mr. Skeele graduated from theUniversity of Oregon.
David E. Jenkins (age 59) has been a vice president of operations since joining McCormick & Schmick’s in 1997. Before that, Mr. Jenkins was a regionalmanager of Island Restaurants (1992−1996), the owner and operator of Santa Fe East (1988−1991), a general manager of Landi Brothers (1982−1987), and thegeneral manager of Hamburger Hamlet (1978−1981). Mr. Jenkins received his Bachelor of Arts degree from the University of Tampa.
Michael B. Liedberg (age 43) joined McCormick & Schmick’s in January 2004 as a vice president of operations. Mr. Liedberg has over 20 years ofmanagement experience in the restaurant industry including service as the president and chief executive officer of Desert Moon Restaurants from December 2001to January 2004. Before 2001, Mr. Liedberg held various positions for thirteen years with Avado Brands, Inc. in various executive capacities. Mr. Liedberg’seducation includes a certificate from the Management Program at Georgia Institute of Technology and a Human Resources Certificate from the University ofGeorgia.
Raymond E. Bean, Jr. (age 48) has held the position of controller since joining McCormick & Schmick’s in 1991. Mr. Bean also became our chiefaccounting officer in 1997. Before joining us, Mr. Bean worked in the audit department of a regional certified public accounting firm for eleven years. Mr. Beanreceived his Bachelor of Science degree from Central Washington University and is a certified public accountant.
19
Source: McCormick & Schmicks, 10−K, March 14, 2006

Table of Contents PART II
ITEM 5. MARKET FOR THE REGISTRANT’S COMMON EQUITY AND RELATED STOCKHOLDER MATTERS
Market Information
Our common stock is listed on The Nasdaq Stock Market National Market under the symbol “MSSR”. The table below sets forth the high and low closingprice for our common stock in the first, second, third and fourth quarters of fiscal 2005 and the third and fourth quarter of fiscal 2004, as reported by The NasdaqStock Market. Our initial public offering occurred in July 2004. There was no established public trading market for our common stock prior to that date.
Sales PriceHigh Low
4th Quarter 2005 $25.86 $19.213rd Quarter 2005 19.80 15.022nd Quarter 2005 16.75 14.821st Quarter 2005 17.58 13.854th Quarter 2004 17.00 10.753rd Quarter 2004 13.20 9.80
Holders of Record
As of February 17, 2006 there were approximately 54 holders of record of our common stock.
Dividend Policy
We expect to retain all of our earnings to finance the expansion and development of our business and, except as described below, we have not paid andhave no plans to pay cash dividends to our stockholders for the foreseeable future. The payment of dividends is within the discretion of our board of directors andwill depend upon our earnings, capital requirements and operating and financial condition, among other factors. Our revolving credit agreement restricts ourability to pay dividends. See Part II—Item 7, “Management’s Discussion and Analysis of Financial Condition and Results of Operations—Liquidity and CapitalResources.”
From August 23, 2001 to July 23, 2004 we accrued dividends on the 13% senior exchangeable preferred stock of McCormick & Schmick AcquisitionCorp. II, our wholly owned subsidiary. In connection with our initial public offering and reorganization, on July 23, 2004 we paid $28.9 million, includingpayment for accrued dividends, to redeem all of the outstanding mandatorily redeemable 13% senior exchangeable preferred stock.
Securities Authorized for Issuance Under Equity Compensation Plans
The following table provides information about compensation plans (including individual compensation arrangements) under which our equity securitiesare authorized for issuance to employees or non−employees (such as directors and consultants), at December 31, 2005.
Plan Category
Number ofsecurities to be
issued uponexercise of
outstanding options
Weighted−average
exercise price ofoutstanding
options
Number of securitiesremaining available forfuture issuance underequity compensation
plans (excludingsecurities reflected in
column(a))(a) (b) (c)
Equity compensation plans approved by security holders:2004 Stock Incentive Plan 832,846 $ 12.00 650,298
Issuer Purchases of Equity Securities
We did not repurchase any of our equity securities during 2005.
Source: McCormick & Schmicks, 10−K, March 14, 2006

20
Source: McCormick & Schmicks, 10−K, March 14, 2006

Table of Contents ITEM 6. SELECTED FINANCIAL DATA
The selected consolidated financial and operating data below are derived from the following sources:
• The unaudited financial statements of the Company, while operated as a division of Avado Brands, Inc. (which we refer to as our “Predecessor”), forthe period from December 31, 2000 to August 22, 2001. The unaudited Predecessor financial statements, represent the financial position and results ofoperations of the McCormick & Schmick division, which have been “carved−out” from the consolidated financial statements of Avado Brands.
• Our unaudited consolidated financial statements for the period from August 23, 2001 to December 29, 2001 and our consolidated financial statementsfor the fiscal years 2002, 2003, 2004 and 2005, which have been audited by an independent registered public accounting firm.
The selected consolidated financial and operating data below represent portions of our financial statements which should be read together withPart II—Item 7 “Management’s Discussion and Analysis of Financial Condition and Results of Operations” and our consolidated financial statements and therelated notes included in Part II—Item 8. Historical results are not necessarily indicative of future performance.
Year Ended2001 2002 2003 2004 2005
Predecessor SuccessorDecember 31,
2000 −August 22,
2001
August 23,2001 −
December 29,2001
(in thousands, except per share data)Statement of Income Data:Revenues $ 113,875 $ 59,760 $ 180,104 $ 196,717 $ 238,757 $ 278,813Restaurant operating costs
Food and beverage 34,150 17,408 53,168 57,959 70,873 81,630Labor 36,263 18,213 56,147 61,644 75,081 86,823Operating 16,387 8,887 26,406 29,244 35,204 41,857Occupancy 9,727 5,114 15,349 16,890 21,401 24,790
Total restaurant operating costs 96,527 49,622 151,070 165,737 202,559 235,100
General and administrative expenses 4,732 2,555 7,576 9,769 12,062 15,105Restaurant pre−opening costs 671 319 1,006 1,219 2,393 2,496Depreciation and amortization 3,810 2,761 8,808 9,853 10,723 9,608Management fees and covenants not to compete — 778 2,550 2,550 4,241 — Impairment of assets — — — 1,513 — —
Total costs and expenses 105,740 56,035 171,010 190,641 231,978 262,309Operating income 8,135 3,725 9,094 6,076 6,779 16,504
Interest expense 5,711 1,626 3,720 3,069 2,680 550Accrued dividends and accretion on mandatorily redeemable preferred stock — — — 1,901 5,759 — Write off of deferred loan costs on early extinguishment of debt — — — 2,313 1,288 — Income (loss) before income taxes and accrued dividends and accretion on mandatorily redeemable
preferred stock 2,424 2,099 5,374 (1,207) (2,948) 15,954Income tax expense (benefit) 946 647 2,570 1,323 (3,651) 4,946Accrued dividends and accretion on mandatorily redeemable preferred stock — 1,111 3,347 1,832 — — Net income (loss) $ 1,478 $ 341 $ (543) $ (4,362) $ 703 $ 11,008Net income (loss) per share(1)
Basic $ 0.19 $ 0.04 $ (0.07) $ (0.56) $ 0.07 $ 0.80Diluted $ 0.19 $ 0.04 $ (0.07) $ (0.56) $ 0.07 $ 0.78
Shares used in computing net income (loss) per share(1)Basic 7,782 7,782 7,782 7,782 10,387 13,798Diluted 7,782 7,782 7,782 7,782 10,416 14,047
21
Source: McCormick & Schmicks, 10−K, March 14, 2006

Table of Contents
Year End2001 2002 2003 2004 2005
Predecessor SuccessorDecember 31,
2000 −August 22,
2001
August 23,2001 −
December 29,2001
(in thousands)Balance Sheet Data:Cash and cash equivalents $ 385 $ 2,028 $ 2,945 $ 2,453 $ 451 $ 4,705Total assets 126,317 158,581 157,953 161,792 179,060 204,160Long−term debt, revolving credit facility and obligations under capital leases,
including current portion — 54,000 46,983 40,056 13,140 706
Mandatorily redeemable preferred stock — 16,057 19,404 23,137 — — Total members’/stockholders’ equity 95,428 63,151 61,860 57,767 124,070 143,453
Year Ended2001 2002 2003 2004 2005
Predecessor SuccessorDecember 31,
2000 −August 22,
2001
August 23,2001 −
December 29,2001
(in thousands)Other Data:Restaurants open at end of period (including managed restaurants) 34 35 39 42 52 59Net cash provided by operating activities $ 5,838 $ 4,745 $ 14,582 $ 20,652 $ 21,452 $ 30,158Net cash used in investing activities (8,529) (134,473) (8,779) (14,956) (27,284) (21,416)Net cash provided by (used in) financing activities 2,852 131,756 (4,886) (6,188) 3,830 (4,488)EBITDA(2) 11,945 6,486 17,902 15,929 17,502 26,112
(1) For periods prior to initial our public offering, we have given retroactive effect to the completion of our corporate reorganization in calculating common shares outstanding. SeePart II—Item 8, Note 3, “Summary of Significant Accounting Policies”.
(2) EBITDA represents earnings before interest, taxes, depreciation and amortization, write off of deferred loan costs on early extinguishment of debt and accrued dividends and accretion onmandatorily redeemable preferred stock. We are presenting EBITDA because it provides an additional measure to view our operations which, when considered with both our GAAP resultsand the reconciliation to net income (loss), we believe provides a more complete understanding of our business than could be obtained absent this disclosure. EBITDA is not ameasurement determined in accordance with GAAP and should not be considered in isolation or as an alternative to net income (loss), net cash provided by operating, investing orfinancing activities or other financial statement data presented as indicators of financial performance or liquidity. EBITDA as presented may not be comparable to other similarly titledmeasures of other companies. A reconciliation of EBITDA to net income (loss) is provided below.
Year Ended2001 2002 2003 2004 2005
Predecessor SuccessorDecember 31,
2000 −August 22,
2001
August 23,2001 −
December 29,2001
(in thousands)Net income (loss) $ 1,478 $ 341 $ (543) $ (4,362) $ 703 $ 11,008Accrued dividends and accretion on mandatorily redeemable preferred stock — 1,111 3,347 3,733 5,759 — Income tax expense (benefit) 946 647 2,570 1,323 (3,651) 4,946Interest expense 5,711 1,626 3,720 3,069 2,680 550Depreciation and amortization 3,810 2,761 8,808 9,853 10,723 9,608Write off of deferred loan costs on early extinguishment of debt — — — 2,313 1,288 —
EBITDA $ 11,945 $ 6,486 $ 17,902 $ 15,929 $ 17,502 $ 26,112
22
Source: McCormick & Schmicks, 10−K, March 14, 2006

Table of Contents
ITEM 7. MANAGEMENT’S DISCUSSION AND ANALYSIS OF FINANCIAL CONDITION AND RESULTS OF OPERATIONS
Overview
Our company was founded in 1972 with William P. McCormick’s acquisition of Jake’s Famous Crawfish in Portland, Oregon. We grew our family ofrestaurants slowly through the next two decades and in 1994, when we owned 14 restaurants, a majority interest in our company was purchased by Castle HarlanPartners II, L.P., a private investment firm. Avado Brands purchased us in 1997. We operated as a division of Avado Brands and added 18 new restaurants in justunder four and a half years. In August 2001, Avado Brands sold our company to Castle Harlan Partners III, L.P. (“Castle Harlan”) and Bruckmann, Rosser,Sherrill & Co., II, L.P. (“BRS”), private equity investment firms that actively invest in restaurant companies. We have expanded our restaurant base to 59restaurants, at December 31, 2005, including two restaurants operated pursuant to management contracts.
We have grown our business by offering our customers a daily−printed menu with a broad selection of affordable, quality fresh seafood in an upscaleenvironment, serviced by knowledgeable and professional management and staff. Our revenues are generated by sales at our restaurants, including banquets. In2005, banquets accounted for approximately 10% of our revenues. In 2005, food and non−alcoholic beverage sales accounted for approximately 70% of revenuesand the remaining 30% of revenues was from the sale of alcoholic beverages.
We measure performance using key operating indicators such as comparable restaurant sales, food and beverage costs, and restaurant operating expenses,with a focus on labor as a percentage of revenues and total occupancy costs. We also track trends in average weekly revenues at both the restaurant level and on aconsolidated basis as an indicator of our performance. The key operating measure used by management in evaluating our operating results is operating income.Operating income is calculated by deducting restaurant operating costs, general and administrative expenses, restaurant pre−opening costs, depreciation andamortization and other corporate costs from revenues. We monitor general and administrative expenses as a percentage of revenues, which we monitor to bewithin our budgeted levels. Restaurant pre−opening costs are analyzed based on the number and timing of restaurant openings and by comparison to budgetedamounts, with an overall target of approximately $0.3 to $0.4 million per restaurant opening, which may include up to $0.1 million in non−cash rent expenseduring the construction period.
The most significant restaurant operating costs are food and beverage costs and labor and related employee benefits. We believe our national and regionalpresence allows us to achieve better quality and pricing on key products than most of our competitors. We closely monitor food and beverage costs and regularlyreview our selection of preferred vendors on the basis of several key metrics, including pricing. In addition, because we print our menu at least once daily in eachof the majority of our restaurants, we are able to adapt the seafood items we offer to changes in vendor pricing to optimize our revenue mix and mitigate theimpact of cost increases in any particular seafood item by substituting a lower−cost alternative on our menu or by adjusting the price. With respect to labor costs,we believe the combination of future growth in revenues and the resulting greater leverage of our vice presidents of operations and regional managers will allowus to better leverage payroll expenses over time. Our employee benefits include health insurance, the cost of which continues to increase faster than the generalrate of inflation. We continually monitor this cost and review strategies to effectively control increases but we are subject to the overall trend of increases inhealthcare costs.
General and administrative expenses are controlled in absolute amounts and monitored as a percentage of revenues. As we have continued our growth andbecame a public company, we have incurred substantial training costs and made significant investments in infrastructure, including our information systems. Aswe continue to grow and are able to leverage investments made in our people and systems, we expect these expenses to decrease as a percentage of revenues overtime.
23
Source: McCormick & Schmicks, 10−K, March 14, 2006
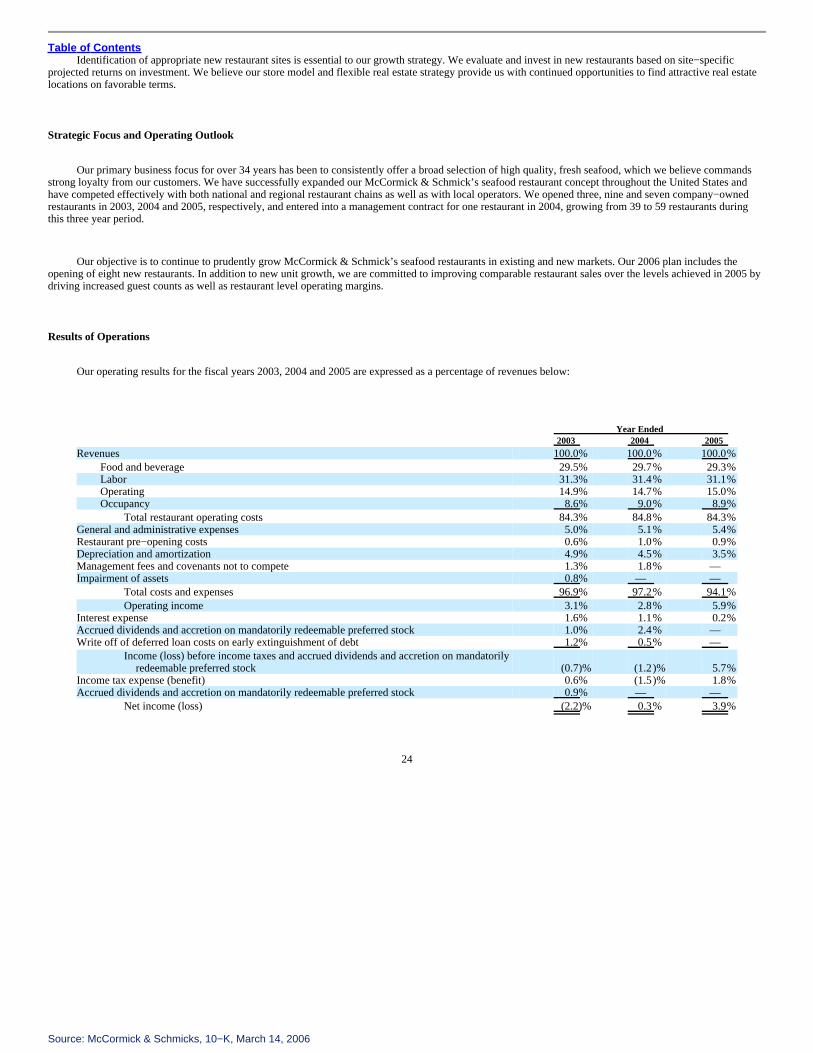
Table of ContentsIdentification of appropriate new restaurant sites is essential to our growth strategy. We evaluate and invest in new restaurants based on site−specific
projected returns on investment. We believe our store model and flexible real estate strategy provide us with continued opportunities to find attractive real estatelocations on favorable terms.
Strategic Focus and Operating Outlook
Our primary business focus for over 34 years has been to consistently offer a broad selection of high quality, fresh seafood, which we believe commandsstrong loyalty from our customers. We have successfully expanded our McCormick & Schmick’s seafood restaurant concept throughout the United States andhave competed effectively with both national and regional restaurant chains as well as with local operators. We opened three, nine and seven company−ownedrestaurants in 2003, 2004 and 2005, respectively, and entered into a management contract for one restaurant in 2004, growing from 39 to 59 restaurants duringthis three year period.
Our objective is to continue to prudently grow McCormick & Schmick’s seafood restaurants in existing and new markets. Our 2006 plan includes theopening of eight new restaurants. In addition to new unit growth, we are committed to improving comparable restaurant sales over the levels achieved in 2005 bydriving increased guest counts as well as restaurant level operating margins.
Results of Operations
Our operating results for the fiscal years 2003, 2004 and 2005 are expressed as a percentage of revenues below:
Year Ended2003 2004 2005
Revenues 100.0% 100.0% 100.0%Food and beverage 29.5% 29.7% 29.3%Labor 31.3% 31.4% 31.1%Operating 14.9% 14.7% 15.0%Occupancy 8.6% 9.0% 8.9%
Total restaurant operating costs 84.3% 84.8% 84.3%General and administrative expenses 5.0% 5.1% 5.4%Restaurant pre−opening costs 0.6% 1.0% 0.9%Depreciation and amortization 4.9% 4.5% 3.5%Management fees and covenants not to compete 1.3% 1.8% — Impairment of assets 0.8% — —
Total costs and expenses 96.9% 97.2% 94.1%Operating income 3.1% 2.8% 5.9%
Interest expense 1.6% 1.1% 0.2%Accrued dividends and accretion on mandatorily redeemable preferred stock 1.0% 2.4% — Write off of deferred loan costs on early extinguishment of debt 1.2% 0.5% —
Income (loss) before income taxes and accrued dividends and accretion on mandatorilyredeemable preferred stock (0.7)% (1.2)% 5.7%
Income tax expense (benefit) 0.6% (1.5)% 1.8%Accrued dividends and accretion on mandatorily redeemable preferred stock 0.9% — —
Net income (loss) (2.2)% 0.3% 3.9%
24
Source: McCormick & Schmicks, 10−K, March 14, 2006

Table of ContentsDescription of Terms
Revenues consist of revenues from comparable restaurants, new restaurants and management agreements. For purposes of comparable restaurant sales, arestaurant is included in the comparable restaurant base in the first full quarter following the eighteenth month of operations. New restaurant revenues includerevenues from restaurants we opened during the period under discussion.
Restaurant operating costs consist of:
• food and beverage costs;
• labor costs, consisting of restaurant management salaries, hourly staff payroll and other payroll−related items including taxes and fringe benefits;
• operating costs, consisting of advertising, maintenance, utilities, insurance, bank and credit card charges, and any other restaurant level expenses; and
• occupancy costs, consisting of both fixed and variable portions of rent, common area maintenance charges, property insurance premiums, and realproperty taxes.
General and administrative expenses consist of expenses associated with corporate administrative functions that support development and restaurantoperations and provide an infrastructure to support future growth, including management and staff salaries, employee benefits, travel, legal and professional fees,technology and market research.
Restaurant pre−opening costs, which are expensed as incurred, consist of costs incurred prior to opening a new restaurant and are comprised principally ofmanager salaries and relocation, employee payroll and related training costs for new employees, including practice and rehearsal of service activities. Restaurantpre−opening costs also include non−cash rent expense during the construction period.
Depreciation and amortization consists of depreciation of equipment and amortization of leasehold improvements and capitalized loan costs.
Financial Performance Overview
The following are highlights of our financial performance for 2005 compared to 2004:
• Revenues increased 16.8% to $278.8 million
• Comparable restaurant sales increased 3.0%
• Net income was $11.0 million compared to $0.7 million, which included a $3.7 million tax benefit in 2004
• Diluted earnings per share was $0.78 compared to $0.07, which included a $0.35 per share tax benefit in 2004
2005 (53 weeks) Compared to 2004 (52 weeks)
Our financial results in 2005 included 53 weeks of operation, compared to 52 weeks in 2004, and also included operations on New Year’s Eve Day in2004 and 2005. Our restaurants typically have large sales volumes on New Year’s Eve Day.
Source: McCormick & Schmicks, 10−K, March 14, 2006

25
Source: McCormick & Schmicks, 10−K, March 14, 2006

Table of ContentsRevenues and Restaurant Operating Costs
The following table sets forth revenues and restaurant operating costs, including food and beverage, labor, operating and occupancy costs from ourconsolidated statements of operations.
Year EndedChangeDecember 25,
2004
December 31,
2005
$ %
(in thousands)Revenues $238,757 $ 278,813 $40,056 16.8%Restaurant operating costsFood and beverage $ 70,873 $ 81,630 $10,757 15.2%Labor 75,081 86,823 11,742 15.6%Operating 35,204 41,857 6,653 18.9%Occupancy 21,401 24,790 3,389 15.8%Total restaurant operating costs $202,559 $ 235,100 $32,541 16.1%
Revenues. Revenues increased by $40.1 million, or 16.8%, to $278.8 million in 2005 from $238.8 million in 2004. This increase was attributable torevenues of $5.9 million in the 53rd week in 2005, $19.4 million generated by seven company−owned restaurants opened in 2005, an $8.8 million increase inrevenues in 2005 from restaurants opened in 2004, and a $6.0 million increase from restaurants opened prior to 2004. Comparable restaurant sales, based on a 52week to 52 week comparison were positive 3.0% in 2005, primarily as the result of improved guest counts coupled with higher menu pricing.
Food and Beverage Costs. Food and beverage costs increased by $10.8 million, or 15.2%, to $81.6 million in 2005 from $70.9 million in 2004. Thisincrease was primarily due to the additional revenues in 2005. Food and beverage costs as a percentage of revenues decreased to 29.3% in 2005 compared to29.7% in 2004 primarily related to menu price increases and improved food and beverage cost at the newer restaurants.
Labor Costs. Labor costs increased by $11.7 million, or 15.6%, to $86.8 million in 2005 from $75.1 million in 2004. This increase was primarily due tothe additional revenues in 2005. Labor costs as a percentage of revenues decreased to 31.1% in 2005 from 31.4% in 2004. Labor costs as a percentage ofrevenues decreased due to leverage resulting from the higher average sales volumes for 2005.
Operating Costs. Operating costs increased by $6.7 million, or 18.9%, to $41.9 million in 2005 from $35.2 million in 2004 primarily due to the additionalrevenues in 2005. Operating costs as a percentage of revenues increased from 14.7% in 2004 to 15.0% in 2005 primarily due to higher utility rates and highermarketing expenses.
Occupancy Costs. Occupancy costs increased by $3.4 million, or 15.8%, to $24.8 million in 2005 from $21.4 million in 2004 primarily due to theadditional revenues in 2005. Occupancy costs as a percentage of revenues decreased to 8.9% in 2005 from 9.0% in 2004 primarily due to leveraging results fromthe higher average sales volumes for 2005. Non−cash rents were $2.2 million, or 0.9% of revenues and $1.9 million, or 0.8% of revenues for 2005 and 2004,respectively.
26
Source: McCormick & Schmicks, 10−K, March 14, 2006

Table of ContentsGeneral and Administrative Expenses, Restaurant Pre−Opening Costs, Depreciation and Amortization and Management Fees and Covenants Not toCompete
The following table sets forth general and administrative, restaurant pre−opening, depreciation and amortization and management fees and covenants notto compete costs from our consolidated statements of operations.
Year EndedChangeDecember 25,
2004
December 31,
2005
$ %
(in thousands)General and administrative expenses $12,062 $ 15,105 $ 3,043 25.2%Restaurant pre−opening costs 2,393 2,496 103 4.3%Depreciation and amortization 10,723 9,608 (1,115) (10.4)%Management fees and covenants not to compete 4,241 — (4,241) (100.0)%
General and Administrative Expenses. General and administrative expenses increased by $3.0 million, or 25.2%, to $15.1 million in 2005 from$12.1 million in 2004. General and administrative expenses as a percentage of revenues were 5.4% in 2005 compared to 5.1% in 2004. The increase is primarilyattributable to the seven additional months of expenses for being a publicly traded company and due to one additional week of operations and performance basedcompensation expense.
Restaurant Pre−Opening Costs. There were seven and nine company−owned restaurants opened in 2005 and 2004, respectively. Restaurant pre−openingcosts increased by $0.1 million, or 4.3%, to $2.5 million in 2005 from $2.4 million in 2004. Our average pre−opening cost per 2005 opening was $358,000.
Depreciation and Amortization. Depreciation and amortization decreased by $1.1 million, or 10.4%, to $9.6 million in 2005 from $10.7 million in 2004.The decrease is primarily due to three year assets that were fully depreciated in 2004.
Management Fees and Covenants Not to Compete. Prior to our initial public offering, we paid annual management fees of $1.1 million to each of BRS andCastle Harlan. Affiliates of each of BRS and Castle Harlan had significant ownership interests in the Company at the time of the agreement terminations.Management fees recognized as expenses totaled $3.3 million for 2004. The amount of $3.3 million paid for in 2004 includes $1.1 million paid to each of BRSand Castle Harlan for the termination of the management agreements as of June 25, 2004. Pursuant to covenants not to compete agreements with certainstockholders, we expensed $0.9 million for 2004. The management fee agreements and all but one of the covenants not to compete agreements were terminatedin connection with our initial public offering in 2004. The remaining covenants not to compete agreement terminated in 2005.
Interest Expense, Accrued Dividends and Accretion on Mandatorily Redeemable Preferred Stock, Income Tax Expense (Benefit) and Net Income
The following table sets forth interest expense, accrued dividends and accretion on mandatorily redeemable preferred stock, income tax expense (benefit)and net income from our consolidated statements of operations.
Year EndedChangeDecember 25,
2004
December 31,
2005
$ %
(in thousands)Interest expense $ 2,680 $ 550 $(2,130) (79.5)%Accrued dividends and accretion on mandatorily redeemable preferred stock $ 5,759 $ — $(5,759) (100.0)%Write off of deferred loan costs on early extinguishment of debt 1,288 — (1,288) (100.0)%Income (loss) before income taxes $(2,948) $ 15,954 $18,902 641.2%Income tax expense (benefit) (3,651) 4,946 8,597 235.5%Net income $ 703 $ 11,008 $10,305 1,465.9%
27
Source: McCormick & Schmicks, 10−K, March 14, 2006
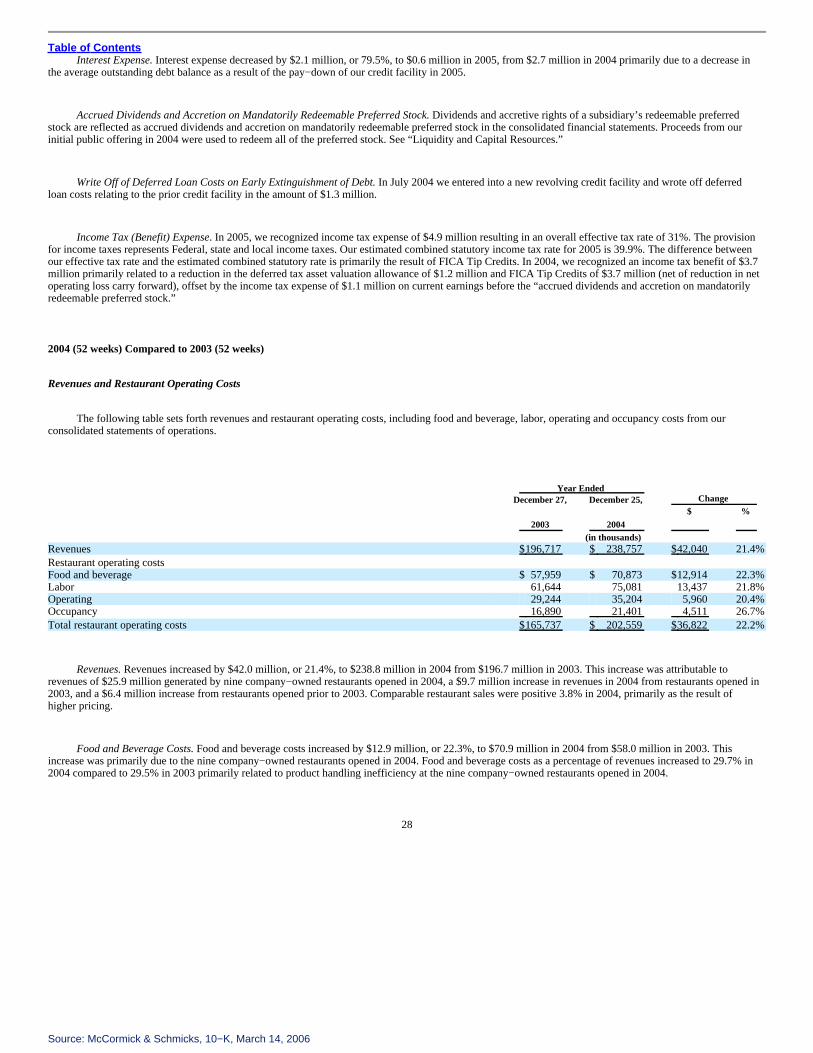
Table of ContentsInterest Expense. Interest expense decreased by $2.1 million, or 79.5%, to $0.6 million in 2005, from $2.7 million in 2004 primarily due to a decrease in
the average outstanding debt balance as a result of the pay−down of our credit facility in 2005.
Accrued Dividends and Accretion on Mandatorily Redeemable Preferred Stock. Dividends and accretive rights of a subsidiary’s redeemable preferredstock are reflected as accrued dividends and accretion on mandatorily redeemable preferred stock in the consolidated financial statements. Proceeds from ourinitial public offering in 2004 were used to redeem all of the preferred stock. See “Liquidity and Capital Resources.”
Write Off of Deferred Loan Costs on Early Extinguishment of Debt. In July 2004 we entered into a new revolving credit facility and wrote off deferredloan costs relating to the prior credit facility in the amount of $1.3 million.
Income Tax (Benefit) Expense. In 2005, we recognized income tax expense of $4.9 million resulting in an overall effective tax rate of 31%. The provisionfor income taxes represents Federal, state and local income taxes. Our estimated combined statutory income tax rate for 2005 is 39.9%. The difference betweenour effective tax rate and the estimated combined statutory rate is primarily the result of FICA Tip Credits. In 2004, we recognized an income tax benefit of $3.7million primarily related to a reduction in the deferred tax asset valuation allowance of $1.2 million and FICA Tip Credits of $3.7 million (net of reduction in netoperating loss carry forward), offset by the income tax expense of $1.1 million on current earnings before the “accrued dividends and accretion on mandatorilyredeemable preferred stock.”
2004 (52 weeks) Compared to 2003 (52 weeks)
Revenues and Restaurant Operating Costs
The following table sets forth revenues and restaurant operating costs, including food and beverage, labor, operating and occupancy costs from ourconsolidated statements of operations.
Year EndedChangeDecember 27,
2003
December 25,
2004
$ %
(in thousands)Revenues $196,717 $ 238,757 $42,040 21.4%Restaurant operating costsFood and beverage $ 57,959 $ 70,873 $12,914 22.3%Labor 61,644 75,081 13,437 21.8%Operating 29,244 35,204 5,960 20.4%Occupancy 16,890 21,401 4,511 26.7%Total restaurant operating costs $165,737 $ 202,559 $36,822 22.2%
Revenues. Revenues increased by $42.0 million, or 21.4%, to $238.8 million in 2004 from $196.7 million in 2003. This increase was attributable torevenues of $25.9 million generated by nine company−owned restaurants opened in 2004, a $9.7 million increase in revenues in 2004 from restaurants opened in2003, and a $6.4 million increase from restaurants opened prior to 2003. Comparable restaurant sales were positive 3.8% in 2004, primarily as the result ofhigher pricing.
Food and Beverage Costs. Food and beverage costs increased by $12.9 million, or 22.3%, to $70.9 million in 2004 from $58.0 million in 2003. Thisincrease was primarily due to the nine company−owned restaurants opened in 2004. Food and beverage costs as a percentage of revenues increased to 29.7% in2004 compared to 29.5% in 2003 primarily related to product handling inefficiency at the nine company−owned restaurants opened in 2004.
28
Source: McCormick & Schmicks, 10−K, March 14, 2006

Table of ContentsLabor Costs. Labor costs increased by $13.4 million, or 21.8%, to $75.1 million in 2004 from $61.6 million in 2003. This increase was primarily due to
the nine company−owned restaurants opened in 2004. Labor costs as a percentage of revenues increased to 31.4% in 2004 from 31.3% in 2003. Labor costs as apercentage of revenues decreased for the comparable restaurants primarily due to leverage resulting from the higher average volumes for 2004. This was offsetby the impact of the new restaurants that typically experience lower productivity and higher training costs during the first and second year of operations as thenew employees learn our operating model.
Operating Costs. Operating costs increased by $6.0 million, or 20.4%, to $35.2 million in 2004 from $29.2 million in 2003. This increase was primarilydue to the nine company−owned restaurants opened in 2004. We also experienced higher energy costs in 2004. Operating costs as a percentage of revenuesdecreased to 14.7% in 2004 from 14.9% in 2003. Several of the operating costs included in this cost category are either fixed or semi−variable. As a result,operating costs as a percentage of revenues decreased due to the 3.8% comparable restaurant sales increase in 2004.
Occupancy Costs. Occupancy costs increased by $4.5 million, or 26.7%, to $21.4 million in 2004 from $16.9 million in 2003 primarily due to theoccupancy costs of the restaurants opened in 2004. Occupancy costs as a percentage of revenues increased to 9.0% in 2004 from 8.6% in 2003 primarily due tooccupancy costs as a percentage of revenues for the restaurants opened in 2004 being higher than occupancy costs as a percentage of revenues for the comparablerestaurants. Non−cash rents were $1.9 million, or 0.8% of revenues and $1.7 million, or 0.9% of revenues for 2004 and 2003, respectively.
General and Administrative Expenses, Restaurant Pre−Opening Costs, Depreciation and Amortization, Management Fees and Covenants Not to Competeand Impairment of Assets
The following table sets forth general and administrative, restaurant pre−opening, depreciation and amortization, management fees and covenants not tocompete and impairment of assets costs from our consolidated statements of operations.
Year EndedChangeDecember 27,
2003
December 25,
2004
$ %
(in thousands)General and administrative expenses $9,769 $ 12,062 $ 2,293 23.5%Restaurant pre−opening costs 1,219 2,393 1,174 96.3%Depreciation and amortization 9,853 10,723 870 8.8%Management fees and covenants not to compete 2,550 4,241 1,691 66.3%Impairment of assets 1,513 — (1,513) (100.0)%
General and Administrative Expenses. General and administrative expenses increased by $2.3 million, or 23.5%, to $12.1 million in 2004 from$9.8 million in 2003. General and administrative expenses as a percentage of revenues were 5.1% in 2004 compared to 5.0% in 2003. Although general andadministrative expenses as a percentage of revenues remained relatively flat in 2004 as compared to 2003, the 2004 expenses reflect increases in salary andrelated expenses associated with the oversight and administrative support of additional restaurants coupled with costs of being a publicly traded company,partially offset by a decrease due to a $1.2 million expense in 2003 to settle a California labor dispute.
Restaurant Pre−Opening Costs. There were nine and three company−owned restaurants opened in 2004 and 2003, respectively. Restaurant pre−openingcosts increased by $1.2 million, or 96.3%, to $2.4 million in 2004 from $1.2 million in 2003, primarily due to the increased number of restaurants opened in 2004compared to 2003.
29
Source: McCormick & Schmicks, 10−K, March 14, 2006

Table of ContentsDepreciation and Amortization. Depreciation and amortization increased by $0.9 million, or 8.8%, to $10.7 million in 2004 from $9.9 million in 2003. The
increase was primarily due to the addition of nine company−owned restaurants in 2004.
Management Fees and Covenants Not to Compete. Prior to our initial public offering, we paid annual management fees of $1.1 million to each of BRS andCastle Harlan. Affiliates of each of BRS and Castle Harlan had significant ownership interests in the Company at the time of the agreement terminations.Management fees recognized as expenses totaled $3.3 million and $2.2 million for 2004 and 2003, respectively. The amount of $3.3 million paid for 2004includes $1.1 million paid to each of BRS and Castle Harlan for the termination of the management agreements as of June 25, 2004. Pursuant to covenants not tocompete agreements with certain stockholders, we expensed $0.9 million and $0.35 million for 2004 and 2003, respectively. The management fee agreementsand all but one of the covenants not to compete agreements were terminated in connection with our initial public offering.
Interest Expense, Accrued Dividends and Accretion on Mandatorily Redeemable Preferred Stock, Income Tax Expense (Benefit) and Net Income (Loss)
The following table sets forth interest expense, accrued dividends and accretion on mandatorily redeemable preferred stock, income tax expense (benefit)and net income (loss) from our consolidated statements of operations.
Year EndedChangeDecember 27,
2003
December 25,
2004
$ %
(in thousands)Interest expense $ 3,069 $ 2,680 $ (389) (12.7)%Accrued dividends and accretion on mandatorily redeemable preferred stock $ 1,901 $ 5,759 $ 3,858 202.9%Write off of deferred loan costs on early extinguishment of debt 2,313 1,288 (1,025) (44.3)%Loss before income taxes and accrued dividends and accretion on mandatorily redeemable
preferred stock $(1,207) $ (2,948) $(1,741) (144.2)%Income tax expense (benefit) 1,323 (3,651) (4,974) (376.0)%Accrued dividends and accretion on mandatorily redeemable preferred stock 1,823 — (1,832) (100.0)%Net income (loss) $(4,362) $ 703 $ 5,065 116.1%
Interest Expense. Interest expense decreased by $0.4 million, or 12.7%, to $2.7 million in 2004, from $3.1 million in 2003 primarily due to an $8.9 milliondecrease in the average outstanding debt balance as a result of the payoff of our prior credit facility in connection with our initial public offering.
Accrued Dividends and Accretion on Mandatorily Redeemable Preferred Stock. Dividends and accretive rights of a subsidiary’s redeemable preferredstock are reflected as accrued dividends and accretion on mandatorily redeemable preferred stock in the consolidated financial statements. Proceeds from ourinitial public offering were used to redeem all of the preferred stock. See “Liquidity and Capital Resources.”
Write Off of Deferred Loan Costs on Early Extinguishment of Debt. In connection with a new revolving credit facility, in July 2004 we wrote off deferredloan costs relating to the prior credit facility in the amount of $1.3 million. In connection with a then new revolving credit facility, in October 2003 we wrote offdeferred loan costs relating to the prior credit facility in the amount of $2.3 million.
30
Source: McCormick & Schmicks, 10−K, March 14, 2006

Table of ContentsIncome Tax (Benefit) Expense. In 2004, the we recognized an income tax benefit of $3.7 million primarily related to a reduction in the deferred tax asset
valuation allowance of $1.2 million and FICA Tip Credits of $3.7 million (net of reduction in net operating loss carry forward), offset by the income tax expenseof $1.1 million on current earnings before the “accrued dividends and accretion on mandatorily redeemable preferred stock.” In 2003, our income tax expensewas $1.3 million. Our effective tax rate in 2004 and 2003 was (123.8%) and 109.6%, respectively. The effective tax rate in 2004 and 2003 was significantlyimpacted by the change in the valuation allowance, the accrued dividends and accretion on mandatorily redeemable preferred stock which is not deductible forincome tax purposes, and in 2004 by the FICA Tip Credits.
Net Income (Loss). Net income was $0.7 million in 2004 compared to a net loss of ($4.4) million in 2003. The increase was primarily due to a $3.7 milliontax benefit primarily from the recognition of deferred tax assets and a 21.4% increase in revenues primarily due to the opening of nine company−ownedrestaurants in 2004.
Potential Fluctuations in Quarterly Results and Seasonality
Our quarterly operating results may fluctuate significantly as a result of a variety of factors. See “Factors That May Affect Our Business and the Price ofOur Stock.”
Our business is also subject to seasonal fluctuations. Historically, revenues in most of our restaurants have been higher during the spring months andwinter holiday season. For the reasons and factors discussed above our quarterly and annual operating results and comparable restaurant sales may fluctuatesignificantly. Accordingly, results for any one quarter are not necessarily indicative of results to be expected for any other quarter or for any year and comparablerestaurant sales for any particular future period may decrease. In the future, operating results may fall below the expectations of securities analysts and investors.If this occurs, the price of our common stock would likely decrease.
31
Source: McCormick & Schmicks, 10−K, March 14, 2006

Table of ContentsThe following table sets forth quarterly unaudited operating results in each of the 2004 and 2005 fiscal quarters:
2004 2005Q1 Q2 Q3 Q4 Q1 Q2 Q3 Q4
(in thousands, except per share data)Revenues $54,513 $59,723 $59,597 $64,924 $60,385 $68,386 $68,014 $82,028Restaurant operating costs
Food and beverage 16,286 17,931 17,776 18,880 17,760 19,927 20,013 23,930Labor 17,810 18,732 19,013 19,526 19,356 21,380 21,421 24,665Operating 7,874 8,744 8,947 9,639 9,017 9,998 10,447 12,396Occupancy 4,848 5,397 5,434 5,722 5,605 6,061 6,267 6,857
Total restaurant operating costs 46,818 50,804 51,170 53,767 51,738 57,366 58,148 67,848General and administrative expenses 2,549 2,616 3,340 3,557 3,342 3,561 3,541 4,660Restaurant pre−opening costs 994 1,120 112 167 529 759 760 449Depreciation and amortization 2,683 2,902 2,690 2,448 2,232 2,381 2,483 2,513Management fees and covenants not to compete 638 3,603 — — — — — —
Total costs and expenses 53,682 61,045 57,312 59,939 57,841 64,067 64,932 75,470Operating income (loss) 831 (1,322) 2,285 4,985 2,544 4,319 3,082 6,558
Interest expense 857 939 570 314 156 166 131 96Accrued dividends and accretion on mandatorily redeemable
preferred stock 1,012 1,054 3,693 — — — — — Write off of deferred loan costs on early extinguishment of debt — — 1,288 — — — — — Income (loss) before income taxes (1,038) (3,315) (3,266) 4,671 2,388 4,153 2,951 6,462Income tax expense (benefit) (15) (734) 71 (2,973) 741 1,287 915 2,003Net income (loss) $(1,023) $(2,581) $(3,337) $ 7,644 $ 1,647 $ 2,866 $ 2,036 $ 4,459Net income (loss) per share(1)
Basic $ (0.13) $ (0.33) $ (0.27) $ 0.55 $ 0.12 $ 0.21 $ 0.15 $ 0.32Diluted $ (0.13) $ (0.33) $ (0.27) $ 0.55 $ 0.12 $ 0.21 $ 0.15 $ 0.31
Shares used in computing net income (loss) per share(1)Basic 7,782 7,782 12,200 13,782 13,782 13,782 13,783 13,841Diluted 7,782 7,782 12,200 13,896 13,959 13,958 14,026 14,187
(1) For periods prior to our initial public offering, we give retroactive effect to the completion of our corporate reorganization in calculating common sharesoutstanding.
Liquidity and Capital Resources
Our primary cash needs have been for new restaurant construction, working capital and general corporate purposes, including payments under creditfacilities. Our main sources of cash have been issuance of common stock, net cash provided by operating activities and borrowings under credit facilities.
32
Source: McCormick & Schmicks, 10−K, March 14, 2006

Table of ContentsOn July 20, 2004, we completed our initial public offering. In connection with the initial public offering, we:
• Issued 7,179,358 shares of common stock in the merger to the holders of McCormick & Schmick Holdings LLC’s units, not including 602,992 sharesissuable upon the exercise of warrants at a nominal price to The Bell Atlantic Master Trust. See Note 14, “Members’ Equity,” to our FinancialStatements.
• Sold 6,000,000 shares of common stock at $12.00 per share, raising approximately $65.1 million after underwriting discounts and transaction costs.
• Repaid $51.5 million of indebtedness on our then existing credit facility with the proceeds raised in the initial public offering and from $18.1 millionin loans under a new revolving credit facility, which provides, among other things, for $50.0 million in revolving credit loans.
• Paid $28.9 million to The Bell Atlantic Master Trust to redeem all of the 13% senior exchangeable preferred stock of a wholly owned subsidiary.
• Paid $2.8 million in connection with the termination of the management agreements and covenants not to compete agreements.
On December 13, 2005, we completed a public offering in which we sold 380,000 shares of common stock, raising approximately $8.2 million afterunderwriting discounts and transaction costs, and selling stockholders sold 4,707,500 shares of common stock. We repaid $1.0 million on December 20, 2005 ofindebtedness on our credit facility with proceeds from the offering.
Year Ended2003 2004 2005
(in thousands)Net cash provided by operating activities $ 20,652 $ 21,452 $ 30,158Net cash used in investing activities (14,956) (27,284) (21,416)Net cash provided by (used in) financing activities (6,188) 3,830 (4,488)Net increase (decrease) in cash and cash equivalents $ (492) $ (2,002) $ 4,254
Net cash provided by operating activities was $30.2 million in 2005, compared to $21.5 million in 2004 and $20.7 million in 2003. The increase in netcash provided by operating activities in 2005 compared to 2004 was primarily due to an increase in operating income as a result of higher revenues in 2005. Theincrease in cash provided by operating activities in 2004 compared to 2003 was primarily because of improvements in working capital due to better managementof payables as well as incremental operating income due to the additional new restaurants.
Net cash used in investing activities was $21.4 million in 2005, $27.3 million in 2004 and $15.0 million in 2003. We use cash for tenant improvements andequipment to open new restaurants, and to upgrade and add capacity to existing restaurants. Net cash used in investing activities varied in the periods presentedbased on the number of new restaurants opened and/or existing restaurant capacity expanded during the period. Purchases of property and equipment also includepurchases of information technology systems and expenditures relating to our corporate headquarters.
Net cash used in financing activities was $4.5 million in 2005. Net cash provided by financing activities was $3.8 million in 2004 and net cash used infinancing activities was $6.2 million in 2003. Net cash used in financing activities in 2005 was primarily a result of payments, net of borrowings, of $12.0million on our revolving credit facility, partially off set by $8.2 million of proceeds from our public stock offering. Net cash provided by financing activities in2004 consisted primarily of net proceeds from issuance of common stock in connection with our initial public offering, offset by payments on redemption ofsenior preferred stock of $28.9 million and net proceeds and payments on our revolving credit facilities of $26.5 million. The net cash used in financing activitiesduring 2003 was primarily related to financing the property and equipment purchases for restaurant openings.
33
Source: McCormick & Schmicks, 10−K, March 14, 2006

Table of ContentsOn December 20, 2005 we paid down the remaining outstanding balance on our credit facility. As of December 31, 2005, there was no outstanding
balance on our revolving credit facility. The interest rate on the credit facility is based on the financial institution’s prime rate plus a margin of 0.25% to 0.75% orthe Eurodollar rate plus a margin of 1.75% to 2.25%, with margins determined by certain financial ratios. Under our revolving credit facility agreement, we aresubject to certain financial and non−financial covenants, including an adjusted leverage ratio, a consolidated cash flow ratio, and growth capital expenditureslimitations. We were in compliance with these covenants as of December 31, 2005.
Under our revolving credit facility agreement, loans are collateralized by a first priority security interest in all of our assets and are scheduled to mature onJuly 23, 2009. The revolving credit facility agreement also provides for bank guarantees under standby letter of credit arrangements in the normal course ofbusiness operations. Our commercial bank issues standby letters of credit to secure our obligations to pay or perform when required to do so pursuant to therequirements of an underlying agreement or the provision of goods and services. The standby letters of credit are cancelable only at the option of the beneficiarywho is authorized to draw drafts on the issuing bank up to the face amount of the standby letter of credit in accordance with its terms. As of December 31, 2005the maximum exposure under these standby letters of credit was $1.5 million. At December 31, 2005 the Company had $48.5 million available under itsrevolving credit facility.
On July 23, 2004, we repaid the outstanding balance on our prior amended and restated revolving credit facility in the amount of $51.5 million with netproceeds from our initial public offering and $18.1 million in loans under our current revolving credit facility agreement. For the year ended December 25, 2004,we recognized a $1.3 million expense related to the write−off of unamortized deferred loan costs related to the prior revolving credit facility.
Our prior revolving credit facility, entered into on October 28, 2003, provided for a $70.0 million revolving credit loan. Loans under this facility werecollateralized by a first priority security interest in all of our assets and were scheduled to mature April 2007 and bore interest based on the financial institution’sprime rate plus a margin of 1.75% to 2.25% or the Eurodollar rate plus a margin of 3.25% to 3.75%, with margins determined by certain financial ratios.
Before October 28, 2003, we had term loans and a $15.0 million revolving credit facility payable to financial institutions. The term loans had quarterlyprincipal payments due in amounts ranging from $0.3 million to $2.1 million and were scheduled to mature between June 2006 and June 2008. The interest rateson these term loans were based on the financial institution’s prime rate plus a margin of 1.5% to 3.0% or the Eurodollar rate plus a margin of 3.0% to 4.25%determined by certain financial ratios.
We believe the net cash provided by operating activities and funds available from our revolving credit facility will be sufficient to satisfy our workingcapital and capital expenditure requirements, including restaurant construction, pre−opening costs and potential initial operating losses related to new restaurantopenings for at least the next 12 months.
Off−Balance Sheet Arrangements
As of December 31, 2005 we had no off−balance sheet arrangements, as defined in Item 303(a)(4) of the Securities and Exchange Commission (“SEC”)Regulation S−K.
34
Source: McCormick & Schmicks, 10−K, March 14, 2006

Table of ContentsContractual Obligations
Our contractual obligations consist of long−term debt, operating leases (primarily restaurant leases) and capital leases. We lease all of our restaurants andour corporate offices under non−cancelable operating leases. Most of our restaurants have an initial operating lease term of 10 to 20 years and options to renewfor between 5 and 15 additional years. Contractual obligations as of December 31, 2005 were as follows:
Payments Due by PeriodTotal Less than 1 year 1−3 years 4−5 years More than 5 years
(in thousands)Long−term debt(1) $ — $ — $ — $ — $ — Operating leases 196,617 18,039 36,900 34,825 106,853Capital leases, including interest 750 402 348 — — Purchase obligations(2) 4,585 3,636 949 — —
Total $201,952 $ 22,077 $38,197 $34,825 $ 106,853
(1) Revolving credit facility balance as of December 31, 2005 due July 23, 2009. The interest rate on the revolving credit facility is based on the financialinstitution’s prime rate plus a margin of 0.25% to 0.75% or the Eurodollar rate plus a margin of 1.75% to 2.25%, with margins determined by certainfinancial ratios.
(2) Purchase obligations include commitments related to the construction of new restaurants.
Critical Accounting Policies and Use of Estimates
Our significant accounting policies are those that we believe are both important to the portrayal of our financial condition and results and require our mostdifficult, subjective or complex judgments, often as a result of the need to make estimates about the effect of matters that are inherently uncertain. We believe ourcritical accounting policies and estimates used in the preparation of our consolidated financial statements are the following:
Equipment and Leasehold Improvements
Equipment and leasehold improvements are stated at cost less accumulated depreciation and amortization. Equipment consists primarily of restaurantequipment, furniture, fixtures and smallwares. Depreciation is calculated using the straight−line method over the estimated useful lives of the related assets.Leasehold improvements are amortized using the straight−line method over the shorter of the lease term as defined in Statement of Financial AccountingStandards (“SFAS”) No. 13, “Accounting for Leases” (“SFAS 13”), as amended, or the estimated useful life of the asset. As discussed in SFAS 13, the lease termincludes any period covered by a renewal option where the renewal is reasonably assured because failure to renew the lease would impose an economic penaltyto the lessee. Repairs and maintenance are expensed as incurred; renewals and betterments are capitalized. Estimated useful lives are generally as follows:equipment—3 to 10 years; furniture and fixtures—5 to 10 years and leasehold improvements—7 to 30 years. Judgments and estimates made by us related to theexpected useful lives of these assets are affected by factors such as changes in economic conditions and changes in operating performance. If these assumptionschange in the future, we may be required to record impairment charges for these assets.
Impairment of Long−Lived Assets
We review property and equipment (which includes leasehold improvements) for impairment when events or circumstances indicate these assets might beimpaired. We test impairment using historical cash flow and other relevant facts and circumstances as the primary basis for our estimates of future cash flows.The analysis is performed at the restaurant level for indicators of permanent impairment. In determining future cash flows, significant estimates are made by uswith respect to future operating results of each restaurant over its remaining lease term. If assets are determined to be impaired, the impairment charge ismeasured by calculating the amount
35
Source: McCormick & Schmicks, 10−K, March 14, 2006

Table of Contentsby which the asset−carrying amount exceeds its fair value. The determination of asset fair value is also subject to significant judgment. This process requires theuse of estimates and assumptions, which are subject to a high degree of judgment. If these assumptions change in the future, we may be required to recordimpairment charges for these assets. In our most recent impairment evaluation for long−lived assets, no additional impairment charge would have resulted even ifthere were a permanent 5% reduction in revenues in our restaurants.
During 2003, we recorded a loss on impairment of long−lived assets in the amount of $1.5 million. The charge was related to the partial impairment offixtures and equipment and leasehold improvements at one restaurant. This restaurant had experienced a decline in cash flows due to the location of therestaurant. There were no impairments during 2004 or 2005.
Goodwill and Other Indefinite Lived Assets
Goodwill and other indefinite lived assets resulted from our acquisition in 2001 by Castle Harlan Partners III, L.P. and Bruckmann, Rosser, Sherrill & Co.II, L.P. Goodwill and other intangible assets with indefinite lives are not subject to amortization. However, such assets must be tested for impairment wheneverevents or changes in circumstances indicate that the carrying amount may not be recoverable and at least annually. We completed our most recent impairmenttest on balances as of December 31, 2005, and determined that there were no impairment losses related to goodwill and other indefinite lived assets. There wereno impairments of goodwill or assets with indefinite lives in 2003 or 2004. In assessing the recoverability of goodwill and other indefinite lived assets, marketvalues and projections regarding estimated future cash flows and other factors are used to determine the fair value of the respective assets. The estimated futurecash flows were projected using significant assumptions, including future revenues and expenses. If these estimates or related projections change in the future,we may be required to record impairment charges for these assets.
Insurance Liability
We maintain various insurance policies for workers’ compensation, employee health, general liability, and property damage. Pursuant to those policies, weare responsible for losses up to certain limits and are required to estimate a liability that represents our ultimate exposure for aggregate losses below those limits.This liability is based on management’s estimates of the ultimate costs to be incurred to settle known claims and claims not reported as of the balance sheet date.Our estimated liability is not discounted and is based on a number of assumptions and factors, including historical trends, actuarial assumptions, and economicconditions. If actual trends differ from our estimates, our financial results could be impacted.
Income Taxes
We have accounted for, and currently account for, income taxes in accordance with SFAS No. 109, “Accounting for Income Taxes”. This Statementestablishes financial accounting and reporting standards for the effects of income taxes that result from an enterprise’s activities during the current and precedingyears. It requires an asset and liability approach for financial accounting and reporting of income taxes. We recognize deferred tax liabilities and assets for thefuture consequences of events that have been recognized in our consolidated financial statements or tax returns. In the event the future consequences ofdifferences between financial reporting bases and tax bases of our assets and liabilities result in a net deferred tax asset, an evaluation is made of the probabilityof being able to realize the future benefits indicated by such asset. A valuation allowance related to a deferred tax asset is recorded when it is more likely than notthat some portion of or all deferred tax asset will not be realized. The realization of such net deferred tax asset will generally depend on whether we will havesufficient taxable income of an appropriate character within the carry forward period permitted by the tax law. Without sufficient taxable income to offset thedeductible amounts and carry forwards, the related tax benefits will expire unused. We have evaluated both positive and negative evidence in making a
36
Source: McCormick & Schmicks, 10−K, March 14, 2006

Table of Contentsdetermination as to whether it is more likely than not that all or some portion of the deferred tax asset will not be realized. Measurement of deferred items isbased on enacted tax laws. No deferred tax asset valuation allowance has been recorded as of December 31, 2005.
Operating Leases
Rent expense for our operating leases, which generally have escalating rentals over the term of the lease, is recorded on the straight−line basis over thelease term as defined in SFAS 13. The lease term commences on the date which is normally when the property is ready for normal tenant improvements(build−out period), when no rent payments are typically due under the terms of the lease. The difference between rent expense and rent paid is recorded as adeferred rent liability and is included in the consolidated balance sheets.
Recent Accounting Pronouncements
In October 2005, the Financial Accounting Standards Board (“FASB”) issued FASB Staff Position No. FAS 13−1, “Accounting for Rental Costs Incurredduring a Construction Period” (“FSP 13−1”). FSP 13−1 requires rental costs associated with ground or building operating leases incurred during a constructionperiod to be recognized as rental expense. FSP 13−1 is effective for reporting periods beginning after December 15, 2005. Retroactive application is permitted,but not required. We do not expect the adoption of this standard to have a material effect on our financial position or results of operations.
In May 2005, the FASB issued SFAS No. 154, “Accounting Changes and Error Corrections—a Replacement of APB Opinion No. 20 and FASB StatementNo. 3” (“SFAS 154”), which requires retrospective application to prior periods’ financial statements of every voluntary change in accounting principal unless it isimpracticable to do so. SFAS 154 is effective for accounting changes and corrections of errors beginning in fiscal 2007. We do not expect the adoption of thisstandard to have any effect on our financial position or results of operations.
In March 2005, the SEC released SEC Staff Accounting Bulletin No. 107 (“SAB 107”). SAB 107 provides the SEC staff position regarding the applicationof SFAS No. 123, (“Share Based Payment (revised 2004)”) (“SFAS 123R”). SAB 107 contains interpretive guidance relating to the interaction betweenSFAS 123R and certain SEC rules and regulations, as well as the staff’s views regarding the valuation of share−based payment arrangements for publiccompanies. SAB 107 also highlights the importance of disclosures made related to the accounting for share−based payment transactions. We will beincorporating SAB 107 as part of our adoption of SFAS 123R in the first quarter of 2006.
In December 2004, the FASB issued SFAS 123R. SFAS 123R revises SFAS 123 and requires companies to expense the fair value of employee stockoptions and other forms of stock−based compensation. In addition to revising SFAS 123, SFAS 123R supersedes Accounting Principles Board Opinion No. 25,“Accounting for Stock Issued to Employees” and amends FASB Statement No. 95, “Statement of Cash Flows.” In April 2005, The SEC announced theamendment of the adoption compliance date of SFAS 123R from the first interim period to the first annual period after June 15, 2005. We have adopted and haveapplied the expense recognition provisions of SFAS 123R beginning in the first quarter of 2006. The estimated impact of the adoption of SFAS 123R and SAB107 for 2006, relating to prior year grants only, will be approximately $750,000 to $850,000, net of tax.
Effect of Inflation
We do not believe inflation has had a significant effect on our operations during the past several years. We generally have been able to substantially offsetincreases in our restaurant and operating costs resulting from inflation by altering our menu, increasing menu prices or making other adjustments.
37
Source: McCormick & Schmicks, 10−K, March 14, 2006

Table of Contents ITEM 7A. QUANTITATIVE AND QUALITATIVE DISCLOSURES ABOUT MARKET RISK
Our market risk exposures are related to our cash and cash equivalents. We invest any excess cash in highly liquid short−term investments with maturitiesof less than one year. These investments are not held for trading or other speculative purposes. Changes in interest rates affect the investment income we earn onour investments and, therefore, impact our cash flows and results of operations.
Under our revolving credit facility, we are exposed to market risk from changes in interest rates on borrowings, which bear interest at the financialinstitution’s prime rate plus a margin of 0.25% to 0.75% or the Eurodollar rate plus a margin of 1.75% to 2.25%, with margins determined by certain financialratios. At our option, we may convert loans under our revolving credit facility from one type of rate to the other. At the end of 2005, there was no outstandingbalance under our revolving credit facility.
38
Source: McCormick & Schmicks, 10−K, March 14, 2006

Table of Contents ITEM 8. FINANCIAL STATEMENTS AND SUPPLEMENTARY DATA
McCormick & Schmick’s Seafood Restaurants, Inc. and Subsidiaries
Index to Financial Statements
Page
Report of Independent Registered Public Accounting Firm 40
Consolidated Financial Statements:
Consolidated Balance Sheets 42
Consolidated Statements of Operations 43
Consolidated Statements of Members’ and Stockholders’ Equity and Comprehensive Income (Loss) 44
Consolidated Statements of Cash Flows 45
Notes to Consolidated Financial Statements 46
39
Source: McCormick & Schmicks, 10−K, March 14, 2006

Table of ContentsReport of Independent Registered Public Accounting Firm
To the Board of Directors and Stockholders
McCormick and Schmick’s Seafood Restaurants, Inc.
We have completed an integrated audit of McCormick and Schmick’s Seafood Restaurants, Inc.’s December 31, 2005 consolidated financial statementsand of its internal control over financial reporting as of December 31, 2005 and audits of its December 25, 2004 and December 27, 2003 consolidated financialstatements in accordance with the standards of the Public Company Accounting Oversight Board (United States). Our opinions, based on our audits, arepresented below.
Consolidated financial statements
In our opinion, the consolidated financial statements listed in the accompanying index present fairly, in all material respects, the financial position ofMcCormick and Schmick’s Seafood Restaurants, Inc. and its subsidiaries at December 31, 2005 and December 25, 2004, and the results of their operations andtheir cash flows for each of the three years in the period ended December 31, 2005 in conformity with accounting principles generally accepted in the UnitedStates of America. These financial statements are the responsibility of the Company’s management. Our responsibility is to express an opinion on these financialstatements based on our audits. We conducted our audits of these statements in accordance with the standards of the Public Company Accounting OversightBoard (United States). Those standards require that we plan and perform the audit to obtain reasonable assurance about whether the financial statements are freeof material misstatement. An audit of financial statements includes examining, on a test basis, evidence supporting the amounts and disclosures in the financialstatements, assessing the accounting principles used and significant estimates made by management, and evaluating the overall financial statement presentation.We believe that our audits provide a reasonable basis for our opinion.
Internal control over financial reporting
Also, in our opinion, management’s assessment, included in Report of Management on Internal Control Over Financial Reporting appearing under item9A, that the Company maintained effective internal control over financial reporting as of December 31, 2005 based on criteria established in InternalControl—Integrated Framework issued by the Committee of Sponsoring Organizations of the Treadway Commission (COSO), is fairly stated, in all materialrespects, based on those criteria. Furthermore, in our opinion, the Company maintained, in all material respects, effective internal control over financial reportingas of December 31, 2005, based on criteria established in Internal Control—Integrated Framework issued by the COSO. The Company’s management isresponsible for maintaining effective internal control over financial reporting and for its assessment of the effectiveness of internal control over financialreporting. Our responsibility is to express opinions on management’s assessment and on the effectiveness of the Company’s internal control over financialreporting based on our audit. We conducted our audit of internal control over financial reporting in accordance with the standards of the Public CompanyAccounting Oversight Board (United States). Those standards require that we plan and perform the audit to obtain reasonable assurance about whether effectiveinternal control over financial reporting was maintained in all material respects. An audit of internal control over financial reporting includes obtaining anunderstanding of internal control over financial reporting, evaluating management’s assessment, testing and evaluating the design and operating effectiveness ofinternal control, and performing such other procedures as we consider necessary in the circumstances. We believe that our audit provides a reasonable basis forour opinions.
A company’s internal control over financial reporting is a process designed to provide reasonable assurance regarding the reliability of financial reportingand the preparation of financial statements for external purposes in accordance with generally accepted accounting principles. A company’s internal control overfinancial reporting includes those policies and procedures that (i) pertain to the maintenance of records that, in reasonable detail, accurately and fairly reflect thetransactions and dispositions of the assets of the company; (ii) provide reasonable
40
Source: McCormick & Schmicks, 10−K, March 14, 2006

Table of Contentsassurance that transactions are recorded as necessary to permit preparation of financial statements in accordance with generally accepted accounting principles,and that receipts and expenditures of the company are being made only in accordance with authorizations of management and directors of the company; and(iii) provide reasonable assurance regarding prevention or timely detection of unauthorized acquisition, use, or disposition of the company’s assets that couldhave a material effect on the financial statements.
Because of its inherent limitations, internal control over financial reporting may not prevent or detect misstatements. Also, projections of any evaluation ofeffectiveness to future periods are subject to the risk that controls may become inadequate because of changes in conditions, or that the degree of compliancewith the policies or procedures may deteriorate.
PricewaterhouseCoopers LLP
Portland, Oregon
March 10, 2006
41
Source: McCormick & Schmicks, 10−K, March 14, 2006

Table of ContentsMcCormick & Schmick’s Seafood Restaurants, Inc. and Subsidiaries
Consolidated Balance Sheets
(in thousands, except per share data)
December 25,2004
December 31,2005
AssetsCurrent assets
Cash and cash equivalents $ 451 $ 4,705Trade accounts receivable, net 4,641 5,081Tenant improvement allowance receivables 347 1,780Inventories 3,384 4,517Prepaid expenses and other current assets 2,846 3,020Deferred income taxes 830 6,688
Total current assets 12,499 25,791Equipment and leasehold improvements, net 92,744 104,727Other assets 53,821 53,646Goodwill 19,996 19,996
Total assets $ 179,060 $ 204,160Liabilities and Stockholders’ EquityCurrent liabilities
Book overdraft $ 429 $ — Accounts payable 12,875 13,431Accrued expenses 15,197 18,970Capital lease obligations, current portion 433 368
Total current liabilities 28,934 32,769Revolving credit facility 12,000 — Other long−term liabilities 11,791 15,618Capital lease obligations, noncurrent portion 707 338Deferred income taxes 1,558 11,982
Total liabilities 54,990 60,707
Commitments and Contingencies (Note 12)
Stockholders’ equityCommon stock, $0.001 par value, 120,000 shares authorized, 13,782 shares issued and outstanding in 2004 and 14,179
shares issued and outstanding in 2005 14 14Additional paid in capital 127,917 136,292Retained earnings (accumulated deficit) (3,861) 7,147
Total stockholders’ equity 124,070 143,453Total liabilities and stockholders’ equity $ 179,060 $ 204,160
The accompanying notes are an integral part of these consolidated financial statements.
42
Source: McCormick & Schmicks, 10−K, March 14, 2006

Table of ContentsMcCormick & Schmick’s Seafood Restaurants, Inc. and Subsidiaries
Consolidated Statements of Operations
(In thousands, except per share data)
Year EndedDecember 27,
2003December 25,
2004December 31,
2005
Revenues $196,717 $ 238,757 $ 278,813Restaurant operating costs
Food and beverage 57,959 70,873 81,630Labor 61,644 75,081 86,823Operating 29,244 35,204 41,857Occupancy 16,890 21,401 24,790
Total restaurant operating costs 165,737 202,559 235,100General and administrative expenses 9,769 12,062 15,105Restaurant pre−opening costs 1,219 2,393 2,496Depreciation and amortization 9,853 10,723 9,608Management fees and covenants not to compete 2,550 4,241 — Impairment of assets 1,513 — —
Total costs and expenses 190,641 231,978 262,309Operating income 6,076 6,779 16,504
Interest expense 3,069 2,680 550Accrued dividends and accretion on mandatorily redeemable preferred stock 1,901 5,759 — Write off of deferred loan costs on early extinguishment of debt 2,313 1,288 —
Income (loss) before income taxes and accrued dividends and accretion on mandatorilyredeemable preferred stock (1,207) (2,948) 15,954
Income tax expense (benefit) 1,323 (3,651) 4,946Accrued dividends and accretion on mandatorily redeemable preferred stock 1,832 — —
Net income (loss) $ (4,362) $ 703 $ 11,008Net income (loss) per common share (Note 2)
Basic $ (0.56) $ 0.07 $ 0.80Diluted $ (0.56) $ 0.07 $ 0.78
Shares used in computing net income (loss) per share (Note 2)Basic 7,782 10,387 13,798Diluted 7,782 10,416 14,047
The accompanying notes are an integral part of these consolidated financial statements.
43
Source: McCormick & Schmicks, 10−K, March 14, 2006

Table of ContentsMcCormick & Schmick’s Seafood Restaurants, Inc. and Subsidiaries
Consolidated Statements of Members’ and Stockholders’ Equity and Comprehensive Income (Loss)
Preferred UnitsPreferred Unit
Warrant Class A UnitsClass A−2 Unit
Warrant Class B Units Class C Units Common StockAdditionalPaid−in
Amount
Unearned
Compensation
RetainedEarnings
(Accumulated
Deficit)
AccumulatedOther
Comprehensive
Income (Loss)Total
Units Amount Units Amount Units Amount Units Amount Units AmountUnitsAmount Shares Amount
($ in thousands)Balances at
December 28,2002 57,000 $ 57,000 4,956 $ 4,951 1,000,000 $ 756 103,896 $ 103 — $— — $— — $— $ — $ — $ (202) $ (748) $ 61,860
Issuance ofClass B andClass C units — — — — — — — — 171,429 37 13 14 — — — (51) — — —
Amortization ofunearnedcompensation — — — — — — — — — — — — — — — 9 — — 9
Net loss — — — — — — — — — — — — — — — — (4,362) — (4,362)Realized gain on
interest rateswap, net ofincome taxexpense of$168 — — — — — — — — — — — — — — — — — 260 260
Totalcomprehensiveloss (4,102)
Balances atDecember 27,2003 57,000 57,000 4,956 4,951 1,000,000 756 103,896 103 171,429 37 13 14 — — — (42) (4,564) (488) 57,767
Net income — — — — — — — — — — — — — — — — 703 — 703Realized gain on
interest rateswap, net ofincome taxexpense of$317 488 488
Totalcomprehensiveincome 1,191
Amortization ofunearnedcompensation — — — — — — — — — — — — — — — 42 — — 42
Purchase ofClass B units — — — — — — — — — (6) — — — — — — — — (6)
Reorganization (57,000) (57,000) — — (1,000,000) (756) — — (171,429) (31) (13) (14) 7,179,358 7 57,794 — — — — Exercise of
warrants — — (4,956) (4,951) — — (103,896) (103) — — — — 602,992 1 5,059 — — — 6Issuance of
common stockin initialpublicoffering, netof offeringcosts — — — — — — — — — — — — 6,000,000 6 65,064 — — — 65,070
Balances atDecember 25,2004 — — — — — — — — — — — — 13,782,350 14 127,917 — (3,861) — 124,070
Exercise of stockoptions — — — — — — — — — — — — 16,856 — 202 — — — 202
Issuance ofcommon stockin publicoffering, netof offeringcosts — — — — — — — — — — — — 380,000 — 8,173 — — — 8,173
Net income — — — — — — — — — — — — — — — — 11,008 — 11,008Balances at
December 31,2005 — $ — — $ — — $ — — $ — — $— — $— 14,179,206$ 14 $136,292$ — $ 7,147 $ — $143,453
The accompanying notes are an integral part of these consolidated financial statements.
44
Source: McCormick & Schmicks, 10−K, March 14, 2006

Table of ContentsMcCormick & Schmick’s Seafood Restaurants, Inc. and Subsidiaries
Consolidated Statements of Cash Flows
(in thousands)
Year EndedDecember 27,
2003December 25,
2004December 31,
2005
Operating activitiesNet income (loss) $ (4,362) $ 703 $ 11,008Adjustments to reconcile net income (loss) to net cash provided by operating activities
Depreciation and amortization 9,853 10,723 9,608Amortization of unearned compensation 9 42 — Provision for doubtful accounts 48 31 69Deferred income taxes 1,323 (3,805) 4,566Write off of deferred loan costs on early extinguishment of debt 2,313 1,288 — Impairment of assets 1,513 — — Accrued dividends and accretion on mandatorily redeemable preferred stock 3,733 5,759 — Changes in operating assets and liabilities
Trade accounts receivables (446) (1,754) (509)Tenant improvement allowance receivable — 424 (1,433)Inventories (387) (680) (1,133)Prepaid expenses and other current assets (495) (479) (174)Accounts payable 2,978 1,659 556Accrued expenses 2,310 2,499 3,773Other long−term liabilities 2,262 5,042 3,827
Net cash provided by operating activities 20,652 21,452 30,158Investing activitiesAcquisition of equipment and leasehold improvements (14,889) (27,017) (21,347)Other assets (67) (267) (69)
Net cash used in investing activities (14,956) (27,284) (21,416)Financing activitiesIncrease (decrease) in book overdraft 2,130 (4,623) (429)Loan costs (1,398) (805) — Payments on long−term debt (45,056) — — Borrowings made on revolving credit facility 103,000 65,500 16,500Payments made on revolving credit facility (64,500) (92,000) (28,500)Proceeds from stock options exercised — — 202Proceeds from issuance of common stock, net of offering costs — 65,076 8,173Redemption of senior preferred stock — (28,896) — Proceeds from notes receivable 26 — — Payments on capital lease obligations (390) (416) (434)Purchase of Class B units — (6) —
Net cash provided by (used in) financing activities (6,188) 3,830 (4,488)Net increase (decrease) in cash and cash equivalents (492) (2,002) 4,254
Cash and cash equivalents, beginning of year 2,945 2,453 451Cash and cash equivalents, end of year $ 2,453 $ 451 $ 4,705Supplemental disclosure of cash flow informationCash paid during the year
Interest $ 3,457 $ 3,097 $ 949Income taxes 96 57 343
Non−cash investing and financing activities
In 2003, accounts receivable totaling $226 were converted to a note receivable, which is included in other assets. A liquor license was purchased for $306using a note payable. In 2004, accounts receivable totaling $160 were converted to a note receivable.
The accompanying notes are an integral part of these consolidated financial statements.
45
Source: McCormick & Schmicks, 10−K, March 14, 2006

Table of ContentsMcCormick & Schmick’s Seafood Restaurants, Inc. and Subsidiaries
Notes to Consolidated Financial Statements
1. The Business and Organization
McCormick and Schmick’s Seafood Restaurants, Inc. is a leading national seafood restaurant operator in the affordable upscale dining segment.McCormick & Schmick’s Seafood Restaurants, Inc. is the survivor of a merger with McCormick & Schmick Holdings LLC (the “LLC”) that occurred onJuly 20, 2004, prior to the Company’s initial public offering.
The financial statements for the period covered by this report are those of McCormick & Schmick’s Seafood Restaurants, Inc. for periods beginning afterJuly 19, 2004 and those of the LLC for periods ended on or before July 19, 2004. Except with respect to information regarding the membership units in the LLCand the common stock issued upon the reorganization, there was no impact to the financial statements as a result of converting from a limited liability companyto a corporation. Before July 20, 2004, the Company’s operations were conducted in McCormick & Schmick Acquisition Corp. and its subsidiaries, which aretaxable corporations. Accordingly, the financial statements of the Company have historically included a provision for income taxes and related deferred incometaxes. Throughout this report, McCormick & Schmick’s Seafood Restaurants, Inc. and the LLC are referred to collectively as “the Company.”
In connection with the reorganization and initial public offering, the Company:
• Issued 7,179,358 shares of common stock in the merger to the holders of the LLC’s units, not including 602,992 shares issuable upon the exercise ofwarrants at a nominal price to The Bell Atlantic Master Trust. See Note 14, “Members’ Equity.”
• Issued 6,000,000 shares of common stock at $12.00 per share, raising approximately $65.1 million after underwriting discounts and transaction costs.
• Repaid $51.5 million of indebtedness on its then existing credit facility with the proceeds raised in the initial public offering and from $18.1 million inloans under a new revolving credit facility. See Note 6, “Long Term Debt.”
• Paid $28.9 million to The Bell Atlantic Master Trust to redeem all of the 13% senior exchangeable preferred stock of a Company subsidiary. See Note13, “Mandatorily Redeemable Preferred Stock.”
• Paid $2.8 million in connection with the termination of the management agreements and covenants not to compete agreements.
The Company owns and operates 59 restaurants in 24 states throughout the United States of America including two pursuant to management agreements.The Company has aggregated its operations to one reportable segment.
2. Summary of Selected Accounting Policies
Principles of Consolidation
The consolidated financial statements include the assets, liabilities and results of operations of McCormick & Schmick’s Seafood Restaurants, Inc. and itssubsidiaries. All intercompany balances and transactions have been eliminated upon consolidation.
46
Source: McCormick & Schmicks, 10−K, March 14, 2006
Table of ContentsMcCormick & Schmick’s Seafood Restaurants, Inc. and Subsidiaries
Notes to Consolidated Financial Statements—(Continued)
Fiscal Year
The Company utilizes a 52 or 53 week accounting period that ends on the Saturday closest to December 31. The fiscal years ended December 27, 2003 andDecember 25, 2004 were each comprised of 52 weeks and the fiscal year ended December 31, 2005 was comprised of 53 weeks. Approximately every six years a53−week fiscal year occurs.
Management Estimates
The preparation of financial statements in conformity with accounting principles generally accepted in the United States of America requires managementto make estimates and assumptions that affect the reported amounts of assets and liabilities and disclosure of contingent assets and liabilities at the date of thefinancial statements and the reported amounts of revenue and expenses during the reporting period. The Company bases its estimates on historical experience andon various assumptions that are believed to be reasonable under the circumstances at the time. Actual results could differ from those estimates under differentassumptions or conditions.
Cash and Cash Equivalents
The Company considers all highly liquid investment instruments purchased with an initial maturity of three months or less to be cash equivalents. Cashconsists of deposits held at major banks that may at times exceed FDIC−insured limits, and cash on hand in restaurant locations.
Trade Accounts Receivable
Trade accounts receivable consists of balances receivable from credit card companies and other third parties. The allowance for doubtful accounts is theCompany’s best estimate of the amount of probable losses in its existing accounts receivable. We review our allowances by assessing individual accountsreceivable over a specific aging and amount. The Company has established an allowance for doubtful accounts as follows:
Balance atBeginning
of Year
Charged toCosts andExpenses Deductions
Balance atEnd ofYear
(in thousands)December 27, 2003 $117 $ 48 $ 40 $ 125December 25, 2004 125 31 49 107December 31, 2005 107 69 69 107
Inventories
Inventories, which consist principally of restaurant food, beverages and supplies, are stated at the lower of cost or market using the first−in, first−outmethod.
Equipment and Leasehold Improvements
Equipment and leasehold improvements are stated at cost less accumulated depreciation and amortization. Equipment consists primarily of restaurantequipment, furniture, fixtures and smallwares. Depreciation is calculated using the straight−line method over the estimated useful lives of the related assets.Leasehold improvements are amortized using the straight−line method over the shorter of the lease term, including option
47
Source: McCormick & Schmicks, 10−K, March 14, 2006

Table of ContentsMcCormick & Schmick’s Seafood Restaurants, Inc. and Subsidiaries
Notes to Consolidated Financial Statements—(Continued)
periods which are reasonably assured of renewal or the estimated useful life of the asset. Repairs and maintenance are expensed as incurred; renewals andbetterments are capitalized. Upon disposal of equipment and leasehold improvements, the accounts are relieved of the costs and related accumulated depreciationor amortization, and resulting gains or losses are reflected in operations.
Estimated useful lives are generally as follows:
Equipment 3−10 yearsFurniture and fixtures 5−10 yearsLeasehold improvements 7−30 years
Other Assets and Goodwill
Other assets include trademarks, loan costs and liquor licenses, which are stated at cost, less amortization, if any. The tradenames and trademarks are usedin the advertising and marketing of the restaurants and are widely recognized and accepted by consumers in each respective market as an indication of andrecognition of service, value and quality. Goodwill represents the excess of purchase price over the fair value of the net assets of the business acquired. Otherintangible assets deemed to have definite lives are amortized over their estimated useful live. Goodwill and intangible assets not subject to amortization are testedannually for impairment, and are tested for impairment more frequently if events and circumstances indicate that the asset might be impaired. An impairment lossis recognized to the extent that the carrying amount exceeds the asset’s fair value. The Company tested the tradename, trademarks and goodwill for impairmentin accordance with Statement of Financial Accounting Standards (“SFAS”) No. 142 “Goodwill and Other Intangible Assets”. Based on its evaluation, there wereno impairments in 2003, 2004 and 2005 for tradenames, trademarks, or goodwill.
Impairment of Long−Lived Assets
In accordance with SFAS No. 144, “Accounting for the Impairment or Disposal of Long−Lived Assets”, long−lived assets, such as equipment andleasehold improvements, and purchased intangibles subject to amortization, are reviewed for impairment whenever events or changes in circumstances indicatethat the carrying amount of an asset may not be recoverable. The Company’s assessment of recoverability of property and equipment is performed on arestaurant−by−restaurant basis. Recoverability of assets to be held and used is measured by a comparison of the carrying amount of an asset to estimatedundiscounted future cash flows expected to be generated by the asset. If the carrying amount of an asset exceeds its estimated future cash flows, an impairmentcharge is recognized by the amount by which the carrying amount of the asset exceeds the fair value of the asset. Assets to be disposed of would be separatelypresented in the consolidated balance sheet and reported at the lower of the carrying amount or fair value less costs to sell, and are no longer depreciated. Theassets and liabilities of a disposed group classified as held for sale would be presented separately in the appropriate asset and liability sections of the consolidatedbalance sheet.
During 2003, the Company recorded a loss on impairment of long−lived assets in the amount of $1.5 million. The charge was related to partial impairmentof fixtures and equipment and leasehold improvements at one restaurant. This restaurant is located on a site that was hidden from view from the street by abuilding constructed subsequent to the opening of this restaurant and in an area where several competing restaurants have been built. These factors, along withthe seasonality of business experienced at this location, led to a decline in the cash flows from this restaurant location. Because this restaurant has reduced itscosts and because several nearby restaurants have closed or relocated, the cash flow from this location has stabilized at approximately a break−even level, whichis projected to continue for the foreseeable future. There are no plans to sell or abandon this restaurant location and no reserves have been established for futurelease payments or other costs.
48
Source: McCormick & Schmicks, 10−K, March 14, 2006

Table of ContentsMcCormick & Schmick’s Seafood Restaurants, Inc. and Subsidiaries
Notes to Consolidated Financial Statements—(Continued)
Management measured the impairment charge with the assistance of an independent appraisal of the related assets. There were no impairments of equipment andleasehold improvements in 2004 or 2005.
Fair Value of Financial Instruments
The carrying amount of cash and cash equivalents, receivables, accounts payable, and accrued expenses approximate fair value because of the immediateor short−term maturity of these financial instruments. The fair value of long−term debt is determined using current applicable rates for similar instruments andcollateral as of the balance sheet date and approximates the carrying value of such debt.
Book Overdraft
Book overdraft represents the amount of checks outstanding in excess of cash in banks and deposits in transit.
Income Taxes
Income taxes are provided for the tax effects of transactions reported in the financial statements and consist of taxes currently due plus deferred taxes.Deferred taxes are recognized for differences between the basis of assets and liabilities for financial statement and income tax purposes. The deferred tax assetsand liabilities represent the future tax return consequences of these differences, which will either be taxable or deductible when the assets and liabilities arerecovered or settled. Recognition of deferred tax assets is limited to amounts considered to be more likely than not of realization in future periods.
Revenue Recognition
Revenues are recognized at the point of delivery of products and services. A deferred liability is recognized for gift certificates that have been sold but notyet redeemed. The Company recognizes revenue and reduces the related deferred liability when the gift certificates are redeemed.
Equity−Based Compensation Plan
The Company accounts for its equity−based compensation plan using the intrinsic−value method prescribed by Accounting Principles Board (“APB”)Opinion No. 25 “Accounting for Stock Issued to Employees” (“APB 25”). Accordingly, the Company computed compensation cost for employee equity unitsgranted as the amount by which the estimated fair value of the Company’s equity units on the date of grant exceeds the amount the employee must pay to acquirethe related equity units. The amount of compensation cost is charged to income over the vesting period.
Under SFAS No. 123 “Share Based Payment” (“SFAS 123”), as amended by SFAS No. 148 “Accounting for Stock−Based Compensation—Transition andDisclosure”, companies who choose to account for equity−based compensation plans using the intrinsic−value method are required to determine the fair value ofemployee equity grants using the fair value method and to disclose the impact of fair value accounting in a note to the financial statements. Prior to the initialpublic offering, there was no difference between the accounting for the equity−based compensation plan described in Note 11 under APB 25 and SFAS 123.Accordingly, prior to the initial public offering, there was no difference between reported net income and pro forma net income determined under SFAS 123.
In December 2004, the Financial Accounting Standards Board (“FASB”) issued SFAS No. 123, “Share Based Payment (revised 2004)” (“SFAS 123R”).SFAS 123R revises SFAS 123 and requires companies to expense the fair value of employee stock options and other forms of stock−based compensation. As ofJanuary 1, 2006 the Company adopted SFAS 123R. See Note 11 for further discussion of SFAS 123R.
49
Source: McCormick & Schmicks, 10−K, March 14, 2006
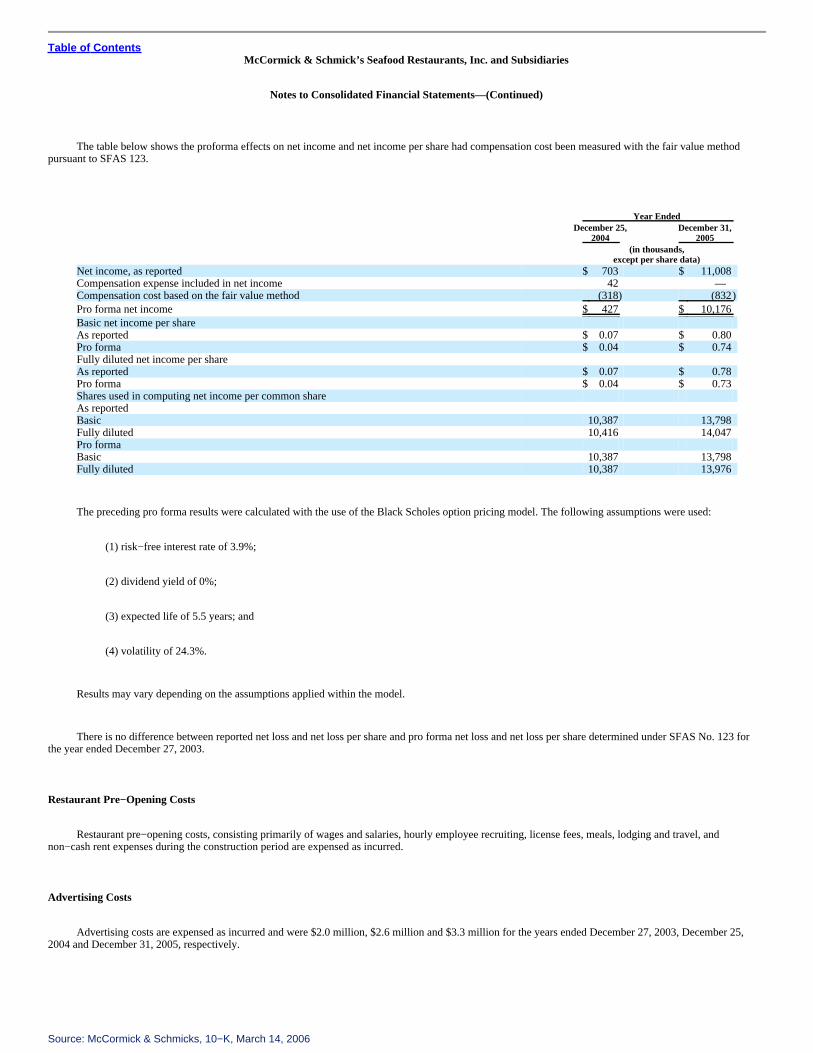
Table of ContentsMcCormick & Schmick’s Seafood Restaurants, Inc. and Subsidiaries
Notes to Consolidated Financial Statements—(Continued)
The table below shows the proforma effects on net income and net income per share had compensation cost been measured with the fair value methodpursuant to SFAS 123.
Year EndedDecember 25,
2004December 31,
2005(in thousands,
except per share data)Net income, as reported $ 703 $ 11,008Compensation expense included in net income 42 — Compensation cost based on the fair value method (318) (832)Pro forma net income $ 427 $ 10,176Basic net income per shareAs reported $ 0.07 $ 0.80Pro forma $ 0.04 $ 0.74Fully diluted net income per shareAs reported $ 0.07 $ 0.78Pro forma $ 0.04 $ 0.73Shares used in computing net income per common shareAs reportedBasic 10,387 13,798Fully diluted 10,416 14,047Pro formaBasic 10,387 13,798Fully diluted 10,387 13,976
The preceding pro forma results were calculated with the use of the Black Scholes option pricing model. The following assumptions were used:
(1) risk−free interest rate of 3.9%;
(2) dividend yield of 0%;
(3) expected life of 5.5 years; and
(4) volatility of 24.3%.
Results may vary depending on the assumptions applied within the model.
There is no difference between reported net loss and net loss per share and pro forma net loss and net loss per share determined under SFAS No. 123 forthe year ended December 27, 2003.
Restaurant Pre−Opening Costs
Restaurant pre−opening costs, consisting primarily of wages and salaries, hourly employee recruiting, license fees, meals, lodging and travel, andnon−cash rent expenses during the construction period are expensed as incurred.
Advertising Costs
Advertising costs are expensed as incurred and were $2.0 million, $2.6 million and $3.3 million for the years ended December 27, 2003, December 25,2004 and December 31, 2005, respectively.
Source: McCormick & Schmicks, 10−K, March 14, 2006

Insurance Liability
The Company maintains various policies for workers’ compensation, employee health, general liability, and property damage. Pursuant to those policies,the Company is responsible for losses up to certain limits. The Company records a liability for the estimated exposure for aggregate losses below those limits.This liability is
50
Source: McCormick & Schmicks, 10−K, March 14, 2006

Table of ContentsMcCormick & Schmick’s Seafood Restaurants, Inc. and Subsidiaries
Notes to Consolidated Financial Statements—(Continued)
based on estimates of the ultimate costs to be incurred to settle known claims and claims not reported as of the balance sheet date. The estimated liability is notdiscounted and is based on a number of assumptions and factors, including historical trends, actuarial assumptions, and economic conditions.
Comprehensive Income (Loss)
The Company accounts for comprehensive income (loss) under SFAS No. 130, “Reporting Comprehensive Income” (“SFAS 130”). SFAS 130 establishesstandards for the reporting and display of elements of comprehensive income (loss), including unrealized gains and losses on certain investments in debt andequity securities and deferred gains and losses on unrealized derivative hedge transactions. The Company’s other comprehensive income (loss) relates toderivative hedge transactions.
Basic and Diluted Net Income (Loss) per Share
Basic income (loss) per share is computed based on the weighted−average number of common shares outstanding during the period since the initial publicoffering. For periods prior to the initial public offering, the 7,179,358 shares of common stock of the Company issued to the former unit holders ofMcCormick & Schmick Holdings LLC and the 602,992 shares issuable upon the exercise of certain warrants (because the warrants had a nominal exercise price)are assumed to be outstanding for all periods presented. Diluted earnings per share are computed using the weighted average number of shares of common stockand potentially dilutive securities assumed to be outstanding during the year. Shares from stock options and other common stock equivalents are excluded fromthe computation when their effect is antidilutive.
Options to purchase 870,500 and 832,846 shares of common stock were outstanding at December 25, 2004 and December 31, 2005, respectively. Thediluted weighted−average shares include 29,020 and 248,532 shares subject to stock options for the years ended December 25, 2004 and December 31, 2005,respectively. There were no stock options prior to the initial public offering.
Operating Leases
The Company generally operates its restaurants in leased premises. The Company records the minimum base rents for its operating leases on astraight−line basis over the life of the lease term, including option periods which are reasonably assured of renewal due to the presence of certain economicpenalties. For purposes of calculating straight line rents, the lease term commences on the date the lessee obtains control of the property, which is normally whenthe property is ready for normal tenant improvements (build−out−period). For certain leases the Company only has the right to exercise its option for renewal ifcertain sales targets are achieved at or near the renewal date. These renewal option periods have been included in the lease term when the Company determines atlease inception or at the acquisition date of the restaurant, if later, that the sales targets are nonsubstantive and achievement of such sales targets is virtuallycertain. The difference between rent expense calculated on a straight line basis and rent paid is recorded as deferred rent liability. The Company receives certaintenant improvement allowances which are considered lease incentives and are amortized as reduction of rent expense over the lease term. Accordingly, theCompany has recorded a deferred rent liability for the straightlining of rents and lease incentives, which is included in other long−term liabilities of $10.8 millionand $14.5 million as of December 25, 2004 and December 31, 2005, respectively.
Derivative Instruments and Hedging Activities
The Company accounts for all derivative instruments on the balance sheet at fair value. Changes in the fair value (i.e., gains or losses) of the derivativesare recorded each period in the consolidated statement of operations or accumulated other comprehensive income (loss). For a derivative designated as a cashflow hedge, the gain or loss on the derivative is initially reported as a component of other comprehensive income (loss) and subsequently
51
Source: McCormick & Schmicks, 10−K, March 14, 2006

Table of ContentsMcCormick & Schmick’s Seafood Restaurants, Inc. and Subsidiaries
Notes to Consolidated Financial Statements—(Continued)
reclassified into the statement of operations when the hedged transaction affects earnings. For derivatives recognized as a fair value hedge, the gain or loss on thederivative in the period of change and the offsetting loss or gain of the hedged item attributed to the hedged risk are recognized in the consolidated statement ofoperations. For derivatives not recognized as hedges, the gain or loss on the derivative in the period of change is recognized as other income.
If the Company were to terminate an interest rate swap, any gain or loss realized upon termination would be deferred and amortized to interest expenseover the remaining term of the underlying debt instrument it was intended to modify or would be recognized immediately if the underlying debt instrument weresettled prior to maturity. As of December 31, 2005, the Company did not hold a position in a derivative instrument and did not have any hedges outstanding.
3. Equipment and Leasehold Improvements
Equipment and leasehold improvements consist of the following:
December 25,2004
December 31,2005
(in thousands)Fixtures and equipment $ 36,808 $ 46,324Leasehold improvements 77,331 90,746Construction in progress 5,699 3,937Equipment under capital leases 1,992 1,723
121,830 142,730Less: Accumulated depreciation and amortization (29,086) (38,003)Equipment and leasehold improvements, net $ 92,744 $ 104,727
For the years ended December 25, 2004 and December 31, 2005, the Company capitalized interest in the amount of $88,000 and $227,400, respectively.Depreciation and amortization expense related to equipment and leasehold improvements for the years ended December 27, 2003, December 25, 2004 andDecember 31, 2005 was $9,285,000, $10,290,000 and 9,364,000, respectively.
4. Other Assets
Other assets consist of the following:
December 25,2004
December 31,2005
(in thousands)Tradename and trademarks $50,600 $ 50,600Loan costs 805 813Liquor licenses 1,103 1,216Notes receivable 716 686Other 1,036 649
54,260 53,964Less accumulated amortization of loan costs ($68,000 and $233,000) and other ($371,000 and $85,000)
at December 25, 2004 and December 31, 2005, respectively (439) (318)$53,821 $ 53,646
52
Source: McCormick & Schmicks, 10−K, March 14, 2006
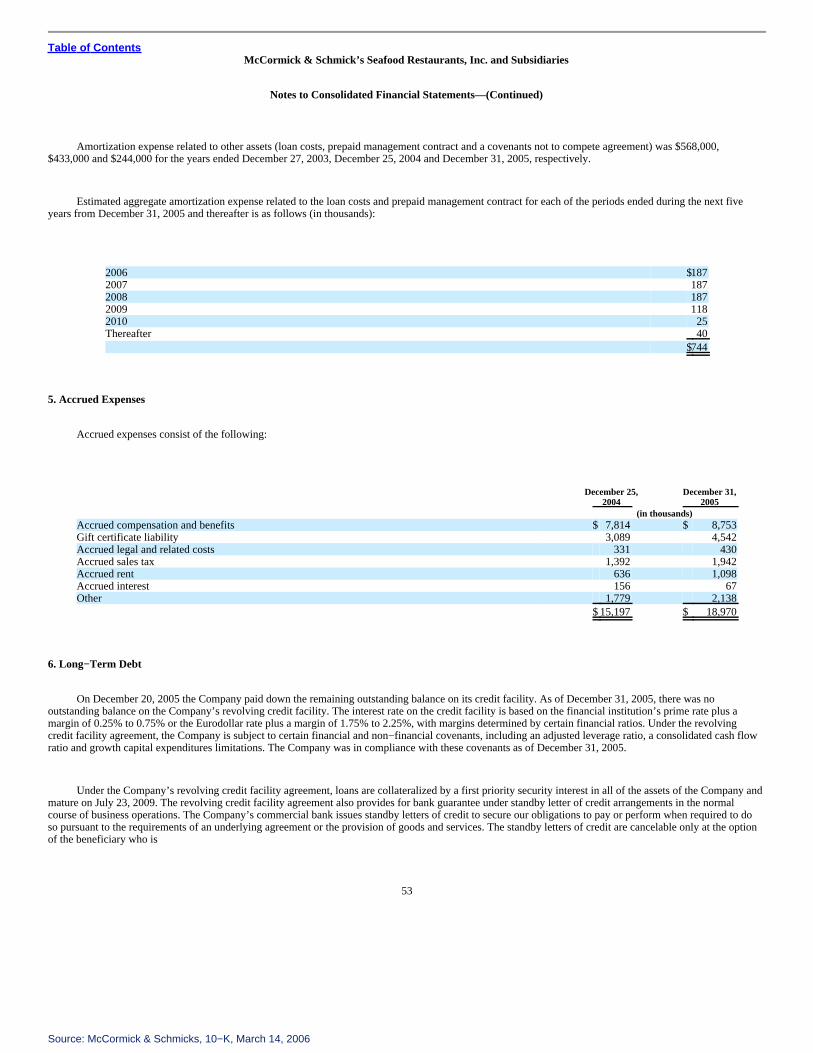
Table of ContentsMcCormick & Schmick’s Seafood Restaurants, Inc. and Subsidiaries
Notes to Consolidated Financial Statements—(Continued)
Amortization expense related to other assets (loan costs, prepaid management contract and a covenants not to compete agreement) was $568,000,$433,000 and $244,000 for the years ended December 27, 2003, December 25, 2004 and December 31, 2005, respectively.
Estimated aggregate amortization expense related to the loan costs and prepaid management contract for each of the periods ended during the next fiveyears from December 31, 2005 and thereafter is as follows (in thousands):
2006 $1872007 1872008 1872009 1182010 25Thereafter 40
$744
5. Accrued Expenses
Accrued expenses consist of the following:
December 25,2004
December 31,2005
(in thousands)Accrued compensation and benefits $ 7,814 $ 8,753Gift certificate liability 3,089 4,542Accrued legal and related costs 331 430Accrued sales tax 1,392 1,942Accrued rent 636 1,098Accrued interest 156 67Other 1,779 2,138
$15,197 $ 18,970
6. Long−Term Debt
On December 20, 2005 the Company paid down the remaining outstanding balance on its credit facility. As of December 31, 2005, there was nooutstanding balance on the Company’s revolving credit facility. The interest rate on the credit facility is based on the financial institution’s prime rate plus amargin of 0.25% to 0.75% or the Eurodollar rate plus a margin of 1.75% to 2.25%, with margins determined by certain financial ratios. Under the revolvingcredit facility agreement, the Company is subject to certain financial and non−financial covenants, including an adjusted leverage ratio, a consolidated cash flowratio and growth capital expenditures limitations. The Company was in compliance with these covenants as of December 31, 2005.
Under the Company’s revolving credit facility agreement, loans are collateralized by a first priority security interest in all of the assets of the Company andmature on July 23, 2009. The revolving credit facility agreement also provides for bank guarantee under standby letter of credit arrangements in the normalcourse of business operations. The Company’s commercial bank issues standby letters of credit to secure our obligations to pay or perform when required to doso pursuant to the requirements of an underlying agreement or the provision of goods and services. The standby letters of credit are cancelable only at the optionof the beneficiary who is
53
Source: McCormick & Schmicks, 10−K, March 14, 2006

Table of ContentsMcCormick & Schmick’s Seafood Restaurants, Inc. and Subsidiaries
Notes to Consolidated Financial Statements—(Continued)
authorized to draw drafts on the issuing bank up to the face amount of the standby letter of credit in accordance with its terms. As of December 31, 2005 themaximum exposure under these standby letters of credit was $1.5 million. At December 31, 2005 the Company had $48.5 million available under its revolvingcredit facility.
On July 23, 2004, the Company repaid the outstanding balance on its prior amended and restated revolving credit facility in the amount of $51.5 millionwith net proceeds from the Company’s initial public offering and $18.1 million in loans under the Company’s current revolving credit facility agreement. For theyear ended December 25, 2004, the Company recognized a $1.3 million expense related to the write off of unamortized deferred loan costs related to the priorrevolving credit facility.
The Company’s prior revolving credit facility, entered into on October 28, 2003, provided for a $70.0 million revolving credit loan. Loans under thisfacility were collateralized by a first priority security interest in all of the assets of the Company, were scheduled to mature April 2007 and bore interest based onthe financial institution’s prime rate plus a margin of 1.75% to 2.25% or the Eurodollar rate plus a margin of 3.25% to 3.75%, with margins determined bycertain financial ratios.
Before October 28, 2003, the Company had term loans and a $15.0 million revolving credit facility payable to financial institutions. The term loans hadquarterly principal payments due in amounts ranging from $0.3 million to $2.1 million and were scheduled to mature between June 2006 and June 2008. Theinterest rates on these term loans were based on the financial institution’s prime rate plus a margin of 1.5% to 3.0% or the Eurodollar rate plus a margin of 3.0%to 4.25% determined by certain financial ratios.
7. Other Long−Term Liabilities
Other long−term liabilities consist of the following:
December 25,2004
December 31,2005
(in thousands)Deferred Rent $ 6,481 $ 9,033Unamortized Tenant Improvement Allowances 4,310 5,512Other 1,000 1,073
$11,791 $ 15,618
8. Capital Leases
The Company is the lessee of equipment under capital leases expiring in years through 2007. The assets and related liabilities under capital leases arerecorded at the fair value of the assets at the inception of the lease. The assets are depreciated over their estimated useful lives. Depreciation of assets undercapital leases is included in depreciation expense.
The gross amount of equipment and related accumulated amortization recorded under capital leases are as follows:
December 25,2004
December 31,2005
(in thousands)Equipment $1,992 $ 1,723Less: Accumulated amortization (616) (701)
$1,376 $ 1,022
54
Source: McCormick & Schmicks, 10−K, March 14, 2006

Table of ContentsMcCormick & Schmick’s Seafood Restaurants, Inc. and Subsidiaries
Notes to Consolidated Financial Statements—(Continued)
Minimum future lease payments under capital leases as of December 31, 2005 are as follows (in thousands):
2006 $ 4022007 348
Total minimum lease payments 750Less: Amount representing interest (44)
Present value of net minimum lease payments 706Less: Current portion (368)
Long−term portion $ 338
9. Income Taxes
The provision (benefit) for income taxes consists of:
Year EndedDecember 27,
2003December 25,
2004December 31,
2005(in thousands)
Current tax expenseFederal $ — $ — $ 168State and local — 154 212
— 154 380Deferred tax expenseFederal 1,268 (3,797) 3,983State and local 55 (8) 583
1,323 (3,805) 4,566$1,323 $ (3,651) $ 4,946
The effective income tax rate differs from the federal statutory rate as follows:
Year EndedDecember 27,
2003December 25,
2004December 31,
2005
Federal statutory rate (35.0)% (35.0)% 35.0%State and local taxes (4.8)% (4.4)% 4.9%Valuation allowance 98.0% (40.1)% — Nondeductible expenses and other−primarily nondeductible
accrued dividends and accretion of mandatorily redeemablepreferred stock 51.4% 82.4% 0.8%
FICA Tip Credits — (126.7)% (10.1)%Other — — 0.4%
109.6% (123.8)% 31.0%
The Company adopted the provisions of SFAS No. 150, “Accounting for Certain Financial Instruments with Characteristics of Both Liabilities andEquity” (“SFAS 150”) effective June 29, 2003. Effective with the adoption of SFAS 150, dividends and accretion of mandatorily redeemable preferred stock areincluded in the
55
Source: McCormick & Schmicks, 10−K, March 14, 2006

Table of ContentsMcCormick & Schmick’s Seafood Restaurants, Inc. and Subsidiaries
Notes to Consolidated Financial Statements—(Continued)
computation of income before income taxes and, accordingly, impacts the effective income tax rates. Prior to the adoption of SFAS 150 in July 2003, suchamounts were reported after income taxes and did not impact the effective income tax rates. In accordance with SFAS 150, the restatement of financialstatements for earlier years is not permitted.
The tax effects of temporary differences that give rise to deferred tax assets and liabilities are:
December 25,2004
December 31,2005
(in thousands)Deferred tax (liabilities) assets—currentLessor reimbursement $ 240 $ — Liability insurance (332) (210)Accrued vacation pay 693 829Federal & state credits — 499FICA Tip Credit — 4,500Net operating loss carryforwards — 1,022Other 229 48
Current deferred tax asset 830 6,688Deferred tax (liabilities) assets—noncurrentDepreciation and amortization on property and equipment (9,546) (12,397)Amortization of intangible assets (6,247) (8,242)Deferred rent 2,475 5,796Smallwares and supplies (869) (1,106)FICA Tip Credits 5,746 3,717Net operating loss carryforwards 6,866 — Other 17 250
Non−current deferred tax liability (1,558) (11,982)Net deferred tax liability $ (728) $ (5,294)
In assessing whether deferred tax assets can be realized, management considers whether it is more likely than not that some portion or all of the deferredtax assets will be realized. As of December 27, 2003, there was a net deferred tax asset arising from net operating losses and other temporary differences (otherthan those relating to amortization of indefinite lived assets) for which utilization was uncertain due to projected future taxable income at that date. Accordingly,a valuation allowance was established as of December 27, 2003.
As discussed in Note 1, during 2004 the Company completed an initial public offering, a portion of the proceeds of which was used to repay indebtedness.In connection with its initial public offering the Company redeemed the mandatorily redeemable preferred stock and terminated certain agreements. As a result ofthese changes and continued improved operating results for the years ended December 25, 2004 and December 31, 2005, management believes it is more likelythan not that the Company will realize the benefits of the deferred tax assets and, accordingly, no deferred tax asset valuation allowance was recorded as ofDecember 25, 2004 or December 31, 2005.
At December 31, 2005, the Company has federal business credits of $8.6 million that will begin to expire in 2021 and state business credits of $200,000that carryforward indefinitely. The Company also has federal net operating loss carryforwards of $2.4 million that will expire in 2024 and state and local netoperating loss carryforwards of $7.1 million that will expire between 2007 and 2024, if not used.
56
Source: McCormick & Schmicks, 10−K, March 14, 2006

Table of ContentsMcCormick & Schmick’s Seafood Restaurants, Inc. and Subsidiaries
Notes to Consolidated Financial Statements—(Continued)
10. Related Party Transactions
Prior to the initial public offering, the Company paid annual management fees of $1.1 million to each of BRS and Castle Harlan. Affiliates of each of BRSand Castle Harlan had significant ownership interests in the LLC at the time of the agreement terminations. Management fees recognized as expenses totaled$2.2 million and $3.3 million for the years ended December 27, 2003 and December 25, 2004, respectively. The amount of $3.3 million paid for the year endedDecember 25, 2004 includes $1.1 million paid to each of BRS and Castle Harlan for the termination of the management agreements as of June 25, 2004.
Pursuant to covenants not to compete agreements with certain stockholders, the Company expensed $0.35 million and $0.9 million for the years endedDecember 27, 2003 and December 25, 2004, respectively. The management fee agreements and all but one of the covenants not to compete agreements wereterminated in connection with the Company’s initial public offering. The remaining covenants not to compete agreement terminated in 2005.
The Company leases properties from landlords controlled by certain stockholders of the Company. Total rent paid to these landlords was $0.5 million,$0.8 million and $0.9 million for the years ended December 27, 2003, December 25, 2004 and December 31, 2005, respectively.
11. Equity Based Compensation
In March 2005, the Securities and Exchange Commission (“SEC”) released SEC Staff Accounting Bulletin No. 107 (“SAB 107”). SAB 107 provides theSEC staff position regarding the application of SFAS 123R. SAB 107 contains interpretive guidance relating to the interaction between SFAS 123R and certainSEC rules and regulations, as well as the staff’s views regarding the valuation of share−based payment arrangements for public companies. SAB 107 alsohighlights the importance of disclosures made related to the accounting for share−based payment transactions. As of January 1, 2006 the Company adopted SAB107 as part of its adoption of SFAS 123R.
In December 2004, the FASB issued SFAS 123R. SFAS 123R revises SFAS 123 and requires companies to expense the fair value of employee stockoptions and other forms of stock−based compensation. In addition to revising SFAS 123, SFAS 123R supersedes APB 25, and amends SFAS No. 95, “Statementof Cash Flows” (“SFAS 95”). In April 2005, The SEC announced the amendment of the adoption compliance date of SFAS 123R from the first interim period tothe first annual period after June 15, 2005. As of January 1, 2006 the Company adopted SFAS 123R. The estimated impact of the adoption of SFAS 123R for2006, relating to prior year grants only, will be approximately $750,000 to $850,000, net of tax.
Prior to the initial public offering, the Company had an equity−based compensation plan under which it could grant the right to purchase a fixed number ofits equity units. The Company accounted for its equity−based compensation plan using the intrinsic−value method prescribed by APB 25. Accordingly, theCompany computed compensation cost for employee equity units granted at the amount by which the estimated fair value of its equity units on the date of grantexceeded the amount the employee would have had to pay to acquire the related equity units. The amount of compensation cost was charged to income over thevesting period.
Under SFAS 123, as amended by SFAS 148, companies that choose to account for equity−based compensation plans using the intrinsic−value method arerequired to determine the fair value of employee equity grants using the fair value method and to disclose the impact of fair value accounting in a note to thefinancial statements. There was no difference between the accounting for the equity−based compensation plan described above under APB 25 and SFAS 123.Accordingly, there was no difference between reported net loss and pro forma net loss determined under SFAS 123 for the year ended December 27, 2003.
57
Source: McCormick & Schmicks, 10−K, March 14, 2006
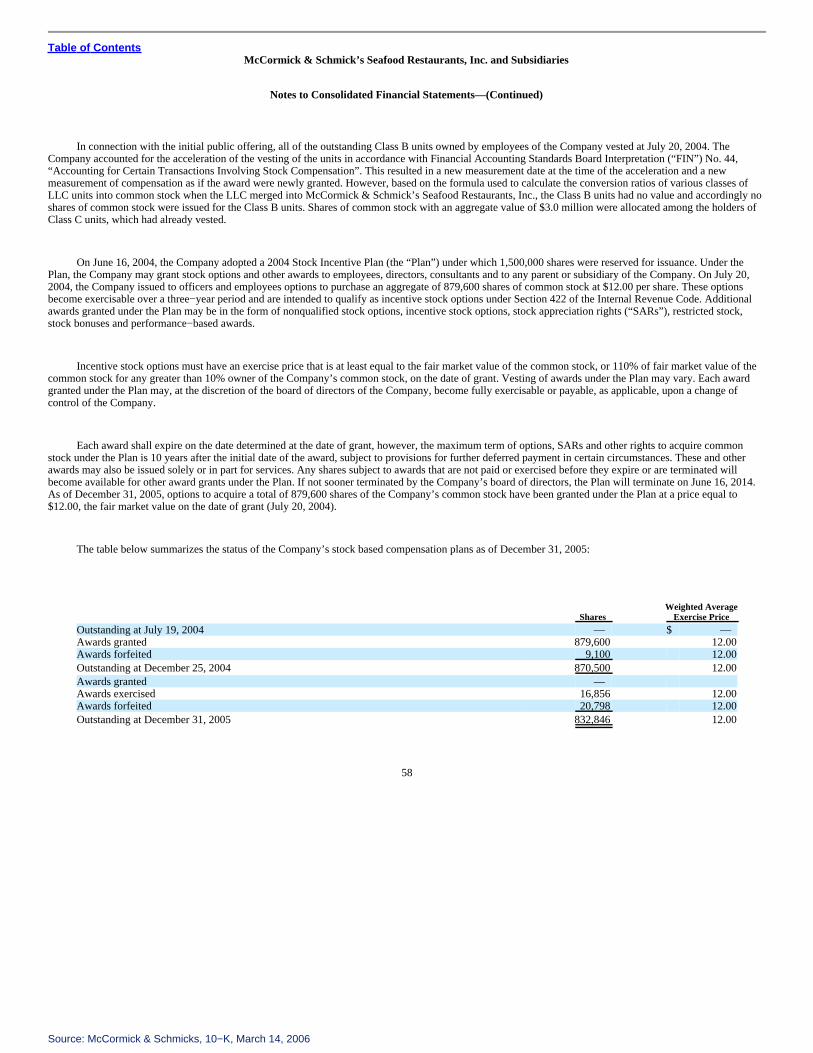
Table of ContentsMcCormick & Schmick’s Seafood Restaurants, Inc. and Subsidiaries
Notes to Consolidated Financial Statements—(Continued)
In connection with the initial public offering, all of the outstanding Class B units owned by employees of the Company vested at July 20, 2004. TheCompany accounted for the acceleration of the vesting of the units in accordance with Financial Accounting Standards Board Interpretation (“FIN”) No. 44,“Accounting for Certain Transactions Involving Stock Compensation”. This resulted in a new measurement date at the time of the acceleration and a newmeasurement of compensation as if the award were newly granted. However, based on the formula used to calculate the conversion ratios of various classes ofLLC units into common stock when the LLC merged into McCormick & Schmick’s Seafood Restaurants, Inc., the Class B units had no value and accordingly noshares of common stock were issued for the Class B units. Shares of common stock with an aggregate value of $3.0 million were allocated among the holders ofClass C units, which had already vested.
On June 16, 2004, the Company adopted a 2004 Stock Incentive Plan (the “Plan”) under which 1,500,000 shares were reserved for issuance. Under thePlan, the Company may grant stock options and other awards to employees, directors, consultants and to any parent or subsidiary of the Company. On July 20,2004, the Company issued to officers and employees options to purchase an aggregate of 879,600 shares of common stock at $12.00 per share. These optionsbecome exercisable over a three−year period and are intended to qualify as incentive stock options under Section 422 of the Internal Revenue Code. Additionalawards granted under the Plan may be in the form of nonqualified stock options, incentive stock options, stock appreciation rights (“SARs”), restricted stock,stock bonuses and performance−based awards.
Incentive stock options must have an exercise price that is at least equal to the fair market value of the common stock, or 110% of fair market value of thecommon stock for any greater than 10% owner of the Company’s common stock, on the date of grant. Vesting of awards under the Plan may vary. Each awardgranted under the Plan may, at the discretion of the board of directors of the Company, become fully exercisable or payable, as applicable, upon a change ofcontrol of the Company.
Each award shall expire on the date determined at the date of grant, however, the maximum term of options, SARs and other rights to acquire commonstock under the Plan is 10 years after the initial date of the award, subject to provisions for further deferred payment in certain circumstances. These and otherawards may also be issued solely or in part for services. Any shares subject to awards that are not paid or exercised before they expire or are terminated willbecome available for other award grants under the Plan. If not sooner terminated by the Company’s board of directors, the Plan will terminate on June 16, 2014.As of December 31, 2005, options to acquire a total of 879,600 shares of the Company’s common stock have been granted under the Plan at a price equal to$12.00, the fair market value on the date of grant (July 20, 2004).
The table below summarizes the status of the Company’s stock based compensation plans as of December 31, 2005:
SharesWeighted Average
Exercise Price
Outstanding at July 19, 2004 — $ — Awards granted 879,600 12.00Awards forfeited 9,100 12.00Outstanding at December 25, 2004 870,500 12.00Awards granted — Awards exercised 16,856 12.00Awards forfeited 20,798 12.00Outstanding at December 31, 2005 832,846 12.00
58
Source: McCormick & Schmicks, 10−K, March 14, 2006

Table of ContentsMcCormick & Schmick’s Seafood Restaurants, Inc. and Subsidiaries
Notes to Consolidated Financial Statements—(Continued)
The table below summarizes information about stock options outstanding at December 31, 2005:
Outstanding Exercisable
Range ofExercisePrices
Number ofOptions
Weighted AverageRemaining Years
of ContractualLife
Weighted AverageExercise price
Number ofOptions
Weighted AverageExercise price
$12.00 832,846 8.6 $ 12.00 267,309 $ 12.00
12. Commitments and Contingencies
During 2003, the Company was a defendant in a labor code class action lawsuit filed in the Superior Court of California, Orange County. In January 2004,the Company resolved this matter in principal by agreeing to pay $1.2 million, which was accrued as of December 27, 2003 and paid in November 2004. TheCompany believes that its restaurants in California, and in states with similar laws, are now complying with meal and rest period requirements.
The Company is subject to various other claims, possible legal actions, and other matters arising out of the normal course of business. While it is notpossible to predict the outcome of these issues, management is of the opinion that adequate provision for potential losses has been made in the accompanyingconsolidated financial statements and that the ultimate resolution of these matters will not have a material adverse effect on the Company’s financial position,results of operations or cash flow.
13. Mandatorily Redeemable Preferred Stock
McCormick & Schmick Acquisition Corp II (“Acquisition Corp II”) is a subsidiary of the Company. Acquisition Corp II’s mandatorily redeemable 13%senior exchangeable preferred stock is reflected as mandatorily redeemable preferred stock in the December 27, 2003 balance sheet. In connection with thereorganization and initial public offering, on July 23, 2004 the Company paid $28.9 million to redeem all of the outstanding mandatorily redeemable 13% seniorexchangeable preferred stock. See Note 1, “The Business and Organization.” Following is the summary of mandatorily redeemable preferred stock:
Number ofShares
MandatoryRedemption
Value
UnamortizedIssuanceDiscount
Net BookValue
(in thousands)Balances at December 27, 2003 20,000 $ 27,002 $ (3,865) $ 23,137Accrual of dividends and accretion of issuance discount 5,467 292 5,759Redemption of senior exchangeable preferred stock (20,000) (32,469) 3,573 (28,896)Balances at December 25, 2004 — $ — $ — $ —
59
Source: McCormick & Schmicks, 10−K, March 14, 2006

Table of ContentsMcCormick & Schmick’s Seafood Restaurants, Inc. and Subsidiaries
Notes to Consolidated Financial Statements—(Continued)
14. Members’ Equity
Prior to its initial public offering, the Company had outstanding the following equity units: preferred units, Class A−1 units, Class A−2 units, Class B unitsand Class C units. All of the units were converted into common stock as the result of the initial public offering. The holders of the Class A−1 units had votingrights; the Class A−2 units, Class B units, Class C units and preferred units did not have voting rights. At December 27, 2003 members’ equity consisted of thefollowing ($ in thousands):
Preferred units, 57,000 units issued and outstanding (liquidation preference of $77,385) $57,000Warrant to acquire 4,956.52 Preferred units, entitled to liquidation preference of $6,772 4,951Class A units, 1,000,000 units issued and outstanding 756Warrant to acquire 103,896.1 Class A−2 units 103Class B units, 171,428.57 units issued and outstanding 37Class C units, 13.20 units issued and outstanding 14Unearned compensation (42)
$62,819
In connection with the issuance of the senior exchangeable preferred stock of McCormick & Schmick Acquisition Corp II discussed in Note 13,“Mandatorily Redeemable Preferred Stock, the Company also sold for $102,857 a warrant to purchase 103,896.10 Class A−2 units and sold for $5.0 million awarrant to purchase 4,956.52 preferred units. In connection with the corporate reorganization, the warrants became exercisable for 602,992 shares of commonstock for an aggregate exercise price of $5,995. On October 20, 2004, The Bell Atlantic Master Trust exercised its warrants to purchase 602,992 shares ofcommon stock for $5,995.
15. Employee Benefit Plans
The Company has a 401(k) contributory benefit plan for eligible employees, which currently matches up to a maximum of 3% of the participant’s eligiblecompensation. For the years ended December 27, 2003, December 25, 2004 and December 31, 2005, Company matching contributions totaled approximately$234,000, $245,000 and $304,000, respectively.
16. Operating Leases
The Company generally operates its restaurants in leased premises. The typical restaurant premises lease is for an initial term between 15 and 25 yearswith renewal options ranging from 5 to 10 years. The leases generally provide for the payment of property taxes, utilities, and various other use and occupancycosts by the Company.
Minimum payments under lease commitments as of December 31, 2005 are summarized below for operating leases.
(in thousands)
2006 $ 18,0392007 18,8642008 18,0362009 17,8922010 16,933Thereafter 106,853
$ 196,617
60
Source: McCormick & Schmicks, 10−K, March 14, 2006

Table of ContentsMcCormick & Schmick’s Seafood Restaurants, Inc. and Subsidiaries
Notes to Consolidated Financial Statements—(Continued)
Rent expense charged to operations under all operating leases is as follows:
Year EndedDecember 27,
2003December 25,
2004December 31,
2005(in thousands)
Fixed rent $ 11,032 $ 14,252 $ 15,860Contingent rent, based on revenues 2,114 2,184 2,765Non−cash rent 1,687 1,865 2,153
$ 14,833 $ 18,301 $ 20,778
17. Recent Accounting Pronouncements
In October 2005, the FASB issued FASB Staff Position No. FAS 13−1, “Accounting for Rental Costs Incurred during a Construction Period” (“FSP13−1”). FSP 13−1 requires rental costs associated with ground or building operating leases incurred during a construction period to be recognized as rentalexpense. FSP 13−1 is effective for reporting periods beginning after December 15, 2005. Retroactive application is permitted, but not required. The Companydoes not expect the adoption of this standard to have a material effect on its financial position or results of operations.
In May 2005, the FASB issued SFAS No. 154, “Accounting Changes and Error Corrections—a Replacement of APB Opinion No. 20 and FASB StatementNo. 3” (“SFAS 154”), which requires retrospective application to prior periods’ financial statements of every voluntary change in accounting principal unless it isimpracticable to do so. SFAS 154 is effective for accounting changes and corrections of errors beginning in fiscal 2007. The Company does not expect theadoption of this standard to have any effect on its financial position or results of operations.
In March 2005, the SEC released SAB 107. SAB 107 provides the SEC staff position regarding the application of SFAS 123R. SAB 107 containsinterpretive guidance relating to the interaction between SFAS 123R and certain SEC rules and regulations, as well as the staff’s views regarding the valuation ofshare−based payment arrangements for public companies. SAB 107 also highlights the importance of disclosures made related to the accounting for share−basedpayment transactions. As of January 1, 2006 the Company adopted SAB 107 as part of its adoption of SFAS 123R.
In December 2004, the FASB issued SFAS 123R. SFAS 123R revises SFAS 123 and requires companies to expense the fair value of employee stockoptions and other forms of stock−based compensation. In addition to revising SFAS 123, SFAS 123R supersedes APB 25, and amends SFAS 95. In April 2005,The SEC announced the amendment of the adoption compliance date of SFAS 123R from the first interim period to the first annual period after June 15, 2005.As of January 1, 2006 the Company adopted SFAS 123R. The estimated impact of the adoption of SFAS 123R and SAB 107 for 2006, relating to prior yeargrants only, will be approximately $750,000 to $850,000, net of tax. Subsequent to the initial public offering the Company issued options to employees as furtherdiscussed in Note 11, “Equity Based Compensation.”
61
Source: McCormick & Schmicks, 10−K, March 14, 2006

Table of Contents ITEM 9. CHANGES IN AND DISAGREEMENTS WITH ACCOUNTANTS ON ACCOUNTING AND FINANCIAL DISCLOSURE
None.
ITEM 9A. CONTROLS AND PROCEDURES
Evaluation of Disclosure Controls and Procedures
Our management has evaluated, under the supervision and with the participation of our chief executive officer and chief financial officer, the effectivenessof our disclosure controls and procedures as of the end of the period covered by this report pursuant to Rule 13a−15(b) under the Securities Exchange Act of1934 (the “Exchange Act”). Based on that evaluation, our chief executive officer and chief financial officer have concluded that, as of the end of the periodcovered by this report, our disclosure controls and procedures are effective in ensuring that information required to be disclosed in our Exchange Act reports is(1) recorded, processed, summarized and reported within the time periods specified in the Securities and Exchange Commission’s rules and forms, and(2) accumulated and communicated to our management, including our chief executive officer and chief financial officer, as appropriate to allow timely decisionsregarding required disclosure.
Report of Management on Internal Control Over Financial Reporting
Our management is responsible for establishing and maintaining adequate internal control over financial reporting, as defined in Rule 13a−15(f) under theExchange Act.
Under the supervision and with the participation of our management, we assessed the effectiveness of our internal control over financial reporting as ofDecember 31, 2005. In making this assessment, we used the criteria set forth by the Committee of Sponsoring Organizations of the Treadway Commission inInternal Control—Integrated Framework. Based on our assessment we determined that, as of December 31, 2005, our internal control over financial reporting iseffective based on those criteria.
PricewaterhouseCoopers LLP, our independent registered public accounting firm, has issued an audit report on our management’s assessment of theeffectiveness of our internal control over financial reporting as of December 31, 2005 which is included in the Report of Independent Registered PublicAccounting Firm contained in Item 8.
Changes in Internal Control Over Financial Reporting
There has been no change in our internal control over financial reporting that occurred in our fiscal quarter ended December 31, 2005 that has materiallyaffected, or is reasonably likely to materially affect, our internal control over financial reporting.
ITEM 9B. OTHER INFORMATION
On January 31, 2006 the Compensation Committee of the board of directors determined the compensation to be paid to independent directors for 2006.The Compensation Committee of the board of directors has determined the 2006 compensation for the Chief Executive Officer and for other “named executiveofficers,” as defined in SEC Regulation S−K, Item 402. A summary of the compensation for the directors and specified executive officers is filed as Exhibit 10.9to this Annual Report on Form 10−K.
62
Source: McCormick & Schmicks, 10−K, March 14, 2006

Table of Contents PART III
ITEM 10. DIRECTORS AND EXECUTIVE OFFICERS OF THE REGISTRANT
Information about our directors is incorporated by reference to our definitive proxy statement, under the caption “Proposal 1: Election of Directors,” forour 2006 annual meeting of stockholders (the “2006 Proxy Statement”) to be filed pursuant to Regulation 14A under the Securities Exchange Act of 1934, whichproxy statement we expect to file no later than 120 days after the end of our fiscal year ended December 31, 2005. Information with respect to our executiveofficers is included under Item 4A of Part I of this report.
Information regarding our audit committee and our audit committee financial expert, under the captions “Corporate Governance—Board Committees” and“Report of the Audit Committee,” is incorporated by reference to the 2006 Proxy Statement.
Information regarding disclosure of compliance with Section 16(a) of the Securities Exchange Act of 1934 is incorporated by reference to the 2006 ProxyStatement.
We have adopted a Business and Ethics Code of Conduct for the guidance of our directors, officers, and employees, including our principal executive,financial and accounting officers and our controller. Our code of conduct, along with other corporate governance documents, is posted on our website atwww.McCormickandSchmicks.com, Investors, Corporate Governance.
ITEM 11. EXECUTIVE COMPENSATION
Information regarding executive compensation is hereby incorporated by reference to the 2006 Proxy Statement.
ITEM 12. SECURITY OWNERSHIP OF CERTAIN BENEFICIAL OWNERS AND MANAGEMENT AND RELATEDSTOCKHOLDER MATTERS
Information setting forth the security ownership of certain beneficial owners and management is hereby incorporated by reference to our 2006 ProxyStatement.
Information regarding our equity compensation plan is included in Item 5 of this Annual Report on Form 10−K.
ITEM 13. CERTAIN RELATIONSHIPS AND RELATED TRANSACTIONS
Information regarding certain relationships and related transactions is hereby incorporated by reference to our 2006 Proxy Statement.
ITEM 14. PRINCIPAL ACCOUNTANT FEES AND SERVICES
Information regarding principal accountant fees and services, appearing under the caption “Report of the Audit Committee—Fees Paid to IndependentRegistered Public Accounting Firm,” is hereby incorporated by reference to our 2006 Proxy Statement.
63
Source: McCormick & Schmicks, 10−K, March 14, 2006

Table of Contents PART IV
ITEM 15. EXHIBITS AND FINANCIAL STATEMENT SCHEDULES
(a)(1) and (a)(2) Financial Statements. The Financial Statements of the Company are filed in Part II—Item 8 of this Annual Report on Form 10−K. TheFinancial Statement schedules have been omitted because they are not required or because the information required to be set forth therein is included in theConsolidated Financial Statements or Notes thereto.
(a)(3) Exhibits. See Exhibit Index beginning on page 66 or a description of the documents that are filed as Exhibits to this Annual Report on Form 10−K orincorporated herein by reference.
64
Source: McCormick & Schmicks, 10−K, March 14, 2006
Table of Contents SIGNATURES
Pursuant to the requirements of Section 13 or 15(d) of the Securities Exchange Act of 1934, the registrant has duly caused this report to be signed on itsbehalf by the undersigned, thereunto duly authorized, as of March 13, 2006.
MCCORMICK & SCHMICK’S SEAFOOD RESTAURANT, INC.
By: /s/ EMANUEL N. HILARIO
Emanuel N. Hilario
Chief Financial Officer
POWER OF ATTORNEY
KNOW ALL THESE PERSONS BY THESE PRESENTS, that each person whose signature appears below constitutes and appoints, jointly and severally,Saed Mohseni and Emanuel N. Hilario, and each of them, attorneys−in−fact for the undersigned, each with the power of substitution, for the undersigned in anyand all capacities to sign any and all amendments to this Annual Report on Form 10−K for the year ended December 31, 2005, and to file the same, with exhibitsthereto and other documents in connection therewith, with the Securities and Exchange Commission, hereby ratifying and confirming all that each of saidattorneys−in−fact, or his substitute or substitutes, may do or cause to be done by virtue hereof.
Pursuant to the requirements of the Securities Exchange Act of 1934, this report has been signed by the following persons on behalf of the registrant and inthe capacities indicated as of March 13, 2006.
Signatures Title
/s/ SAED MOHSENI
Saed Mohseni
Chief Executive Officer and Director (Principal Executive Officer)
/s/ EMANUEL N. HILARIO
Emanuel N. Hilario
Vice President and Chief Financial Officer (Principal Financial andAccounting Officer)
/s/ DOUGLAS L. SCHMICK
Douglas L. Schmick
President and Director
/s/ LEE M. COHN
Lee M. Cohn
Director
/s/ ELLIOTT H. JURGENSEN, JR.
Elliott H. Jurgensen, Jr.
Director
/s/ J. RICE EDMONDS
J. Rice Edmonds
Director
/s/ DAVID B. PITTAWAY
David B. Pittaway
Director
/s/ HAROLD O. ROSSER
Harold O. Rosser
Director
/s/ FORTUNATO N. VALENTI Director
Source: McCormick & Schmicks, 10−K, March 14, 2006

Fortunato N. Valenti
Justin B. Wender Director
65
Source: McCormick & Schmicks, 10−K, March 14, 2006

Table of ContentsEXHIBITS.
Items identified with an asterisk (*) are management contracts or compensatory plans or arrangements.
3.1 Certificate of Incorporation of the Company, as amended. Incorporated by reference to Exhibit 3.1 to the Company’s Registration Statement onForm S−1, File No. 333−114977.
3.2 Bylaws of the Company, as amended (incorporated by reference to Exhibits 3.2 and 3.2a to our Registration Statement on Form S−1, FileNo. 333−114977)
4.1 Registration Rights Agreement, dated as of August 22, 2001, by and among McCormick & Schmick Holdings LLC, Bruckmann, Rosser, Sherrill &Co. II, L.P., Castle Harlan Partners III, L.P. and certain other parties thereto (incorporated by reference to Exhibit 4.2 to our registration statementon Form S−1, file No. 333−114977)
10.1 Revolving Credit Agreement, dated as of July 23, 2004, by and among McCormick & Schmick Acquisition Corp. and certain of its subsidiaries,Fleet National Bank, as Administrative Agent, Banc of America Securities LLC, as Arrangers, and specified other lenders; Amendment toPost−Closing Delivery Requirements dated October 12, 2004 by and among McCormick & Schmick Acquisition Corp. and certain of itssubsidiaries and Fleet National Bank as Administrative Agent and Lender (incorporated by reference to Exhibit 10.1 to our quarterly report onForm 10−Q for the period ended September 25, 2004)
10.2 Lease, dated as of October 13, 1994, between Boin Properties, LLC, as successor in interest to William P. McCormick, and McCormick &Schmick Restaurant Corp., as successor in interest to Jake’s Restaurant, Inc. (incorporated by reference to Exhibit 10.9 to our registration statementon Form S−1, file No. 333−114977) and First Amendment to Lease dated November 23, 2005, between BOIN Properties, LLC and the Company(incorporated by reference to Exhibit 10.1 to our current report on Form 8−K dated November 23, 2005).
10.3 Retail Lease Agreement, dated as of February 14, 1985, between Harborside Partners, LLC, as successor in interest to Cornerstone DevelopmentCompany, and McCormick & Schmick Restaurant Corp., as successor in interest to the Cornerstone−McCormick Joint Venture dba HarborsideRestaurant, and Amendments 4 and 5 thereto (incorporated by reference to Exhibit 10.10 to our registration statement on Form S−1, fileNo. 333−114977)
10.4 Lease, dated June 18, 2004, between DLS Investments, LLC and McCormick & Schmick Restaurant Corp. (incorporated by reference toExhibit 10.11 to our registration statement on Form S−1, file No. 333−114977) and Amendment to Lease dated November 23, 2005, between DLSInvestments, LLC and the Company (incorporated by reference to Exhibit 10.2 to our current report on Form 8−K dated November 23, 2005)
10.5* Form of Executive Severance Agreement entered into by William P. McCormick, Douglas L. Schmick and Saed Mohseni and McCormick &Schmick’s Seafood Restaurants, Inc. (incorporated by reference to Exhibit 10.12 to our registration statement on Form S−1, file No. 333−114977)
10.7* McCormick & Schmick’s Seafood Restaurants, Inc. 2004 Stock Incentive Plan (incorporated by reference to Exhibit 10.16 to our registrationstatement on Form S−1, file No. 333−114977)
10.8* Form of McCormick & Schmick’s Seafood Restaurants, Inc. Incentive Stock Option Agreement; form of McCormick & Schmick’s SeafoodRestaurants, Inc. Non−Statutory Stock Option Agreement (incorporated by reference to Exhibit 10.17 to our registration statement on Form S−1,file No. 333−114977)
10.9* Summary of Director and Executive Officer Compensation for Fiscal 2006
21.1 Subsidiaries of McCormick & Schmick’s Seafood Restaurants, Inc.
24.1 Power of Attorney (included on signature page)
66
Source: McCormick & Schmicks, 10−K, March 14, 2006

Table of Contents
31.1 Certification of the Chief Executive Officer pursuant to Rule 13a−14(a) of the Securities Exchange Act of 1934, as adopted pursuant to Section 302of the Sarbanes−Oxley Act of 2002.
31.2 Certification of the Chief Financial Officer pursuant to Rule 13a−14(a) of the Securities Exchange Act of 1934, as adopted pursuant to Section 302of the Sarbanes−Oxley Act of 2002.
32.1 Certification of the Chief Executive Officer pursuant to 18 U.S.C. Section 1350, as adopted pursuant to Section 906 of the Sarbanes−Oxley Act of2002.
32.2 Certification of the Chief Financial Officer pursuant to 18 U.S.C. Section 1350, as adopted pursuant to Section 906 of the Sarbanes−Oxley Act of2002.
67
Source: McCormick & Schmicks, 10−K, March 14, 2006

Exhibit 10.9
Summary of Compensatory Arrangements with Directors and Named Executive Officers
Director Compensation. Each director who is not an employee of the Company or is not an affiliate of a shareholder owning five percent or more of thecommon stock of the Company will receive the following compensation for his service as director or committee member in 2006:
• annual compensation of $10,000;
• $1,250 per Board meeting attended;
• annual compensation of $5,000 for service as a member of the Audit Committee;
• annual compensation of $5,000 for service as a member of the Compensation Committee;
• annual compensation of $5,000 for service as a member of the Nominating and Governance Committee;
• annual compensation of $30,000 for service as chairman of the Audit Committee;
• a reasonable dining allowance at the restaurants; and
• reasonable out−of−pocket expenses incurred in attending meetings.
Each director who is an employee of the Company or an affiliate of a shareholder owning five percent or more of the common stock of the Company will receivethe following compensation for his service as director or committee member in 2006:
• a reasonable dining allowance at the restaurants; and
• reasonable out−of−pocket expenses incurred in attending meetings.
Named Executive Officer Compensation. The Company’s executive compensation program has several elements, all determined by individual performanceand Company profitability, except for stock option grants that are intended to correlate compensation to stock price performance.
Base Salary Compensation
Base salaries for the Chief Executive Officer and the other named executive officers in 2006 have been established by reviewing a number of factors, includingresponsibilities, experience, demonstrated performance, potential for future contributions and the level of salaries associated with similar positions at businessesthat compete with the Company and other competitive factors. Base salary levels for named executive officers in 2006 have been determined as follows:
Saed Mohseni $ 350,000Emanuel “Manny” N. Hilario $245,000Douglas L. Schmick $275,000
Source: McCormick & Schmicks, 10−K, March 14, 2006

Other Compensation
In addition to his or her base salary, each of the named executive officers is eligible to participate in the following:
• The Executive Incentive Compensation Plan, under which executive officers may earn cash bonuses based on the Company achieving pre−determinedfinancial goals (80% of bonus), with a focus on earnings per share targets and revenues targets, and non−financial goals (20% of bonus), includingcustomer service and retention goals. The board of directors has determined based on 100% achievement of the bonus goals amounts for the namedexecutive officers for 2006 as follows:
Saed Mohseni $ 262,500Emanuel “Manny” N. Hilario $ 61,250Douglas L. Schmick $137,500
• Based on achievements greater or less than 100%, the Board of Directors has discretion to increase or decrease compensation payout;
• The 2004 Stock Incentive Plan, under which stock options or other equity compensation may be granted based on factors such as the level of base payand individual performance;
• Executive Car Program;
• The Company’s health and benefit plans generally available to Company employees.
Source: McCormick & Schmicks, 10−K, March 14, 2006

Exhibit 21.1
Subsidiaries
Name Jurisdiction of Incorporation
McCormick & Schmick Acquisition Corp. II Delaware
McCormick & Schmick Acquisition Corp. Delaware
McCormick & Schmick Restaurant Corp. Delaware
McCormick & Schmick Maryland Liquor, Inc. Maryland
McCormick & Schmick Acquisition I Texas, Inc. Texas
McCormick & Schmick Acquisition II Texas, Inc. Delaware
McCormick & Schmick Acquisition Texas, LP Texas
McCormick & Schmick Acquisition III Texas, Inc. Texas
McCormick & Schmick’s Hackensack, LLC Delaware
McCormick & Schmick’s Atlanta II, LLC Delaware
McCormick & Schmick Orlando, LLC Delaware
McCormick & Schmick Dallas, LP Texas
McCormick & Schmick Dallas Liquor, Inc. Texas
McCormick & Schmick Austin, LP Texas
McCormick & Schmick Austin Liquor, Inc. Texas
Source: McCormick & Schmicks, 10−K, March 14, 2006

Exhibit 31.1
CERTIFICATION
I, Saed Mohseni, certify that:
1. I have reviewed this Annual Report on Form 10−K of McCormick & Schmick’s Seafood Restaurants, Inc.;
2. Based on my knowledge, this report does not contain any untrue statement of a material fact or omit to state a material fact necessary to make thestatements made, in light of the circumstances under which such statements were made, not misleading with respect to the period covered by thisreport;
3. Based on my knowledge, the financial statements, and other financial information included in this report, fairly present in all material respects thefinancial condition, results of operations and cash flows of the registrant as of, and for, the periods presented in this report;
4. The registrant’s other certifying officer and I are responsible for establishing and maintaining disclosure controls and procedures (as defined inExchange Act Rules 13a−15(e) and 15d−15(e)) and internal control over financial reporting (as defined in Exchange Act Rules 13a−15(f) and15d−15(f)) for the registrant and have:
(a) Designed such disclosure controls and procedures, or caused such disclosure controls and procedures to be designed under oursupervision, to ensure that material information relating to the registrant, including its consolidated subsidiaries, is made known to us byothers within those entities, particularly during the period in which this report is being prepared;
(b) Designed such internal control over financial reporting, or caused such internal control over financial reporting to be designed under oursupervision, to provide reasonable assurance regarding the reliability of financial reporting and the preparation of financial statements forexternal purposes in accordance with generally accepted accounting principles;
(c) Evaluated the effectiveness of the registrant’s disclosure controls and procedures and presented in this report our conclusions about theeffectiveness of the disclosure controls and procedures, as of the end of the period covered by this report based on such evaluation; and
(d) Disclosed in this report any change in the registrant’s internal control over financial reporting that occurred during the registrant’s mostrecent fiscal quarter (the registrant’s fourth fiscal quarter in the case of an annual report) that has materially affected, or is reasonably likelyto materially affect, the registrant’s internal control over financial reporting; and
5. The registrant’s other certifying officer and I have disclosed, based on our most recent evaluation of internal control over financial reporting, to theregistrant’s auditors and the audit committee of the registrant’s board of directors (or persons performing the equivalent functions):
(a) All significant deficiencies and material weaknesses in the design or operation of internal control over financial reporting which arereasonably likely to adversely affect the registrant’s ability to record, process, summarize and report financial information; and
(b) Any fraud, whether or not material, that involves management or other employees who have a significant role in the registrant’s internalcontrol over financial reporting.
Date: March 13, 2006
/s/ SAED MOHSENI
Saed Mohseni
Chief Executive Officer
Source: McCormick & Schmicks, 10−K, March 14, 2006

Exhibit 31.2
CERTIFICATION
I, Emanuel N. Hilario, certify that:
1. I have reviewed this Annual Report on Form 10−K of McCormick & Schmick’s Seafood Restaurants, Inc.;
2. Based on my knowledge, this report does not contain any untrue statement of a material fact or omit to state a material fact necessary to make thestatements made, in light of the circumstances under which such statements were made, not misleading with respect to the period covered by thisreport;
3. Based on my knowledge, the financial statements, and other financial information included in this report, fairly present in all material respects thefinancial condition, results of operations and cash flows of the registrant as of, and for, the periods presented in this report;
4. The registrant’s other certifying officer and I are responsible for establishing and maintaining disclosure controls and procedures (as defined inExchange Act Rules 13a−15(e) and 15d−15(e)) and internal control over financial reporting (as defined in Exchange Act Rules 13a−15(f) and15d−15(f)) for the registrant and have:
(a) Designed such disclosure controls and procedures, or caused such disclosure controls and procedures to be designed under oursupervision, to ensure that material information relating to the registrant, including its consolidated subsidiaries, is made known to us byothers within those entities, particularly during the period in which this report is being prepared;
(b) Designed such internal control over financial reporting, or caused such internal control over financial reporting to be designed under oursupervision, to provide reasonable assurance regarding the reliability of financial reporting and the preparation of financial statements forexternal purposes in accordance with generally accepted accounting principles;
(c) Evaluated the effectiveness of the registrant’s disclosure controls and procedures and presented in this report our conclusions about theeffectiveness of the disclosure controls and procedures, as of the end of the period covered by this report based on such evaluation; and
(d) Disclosed in this report any change in the registrant’s internal control over financial reporting that occurred during the registrant’s mostrecent fiscal quarter (the registrant’s fourth fiscal quarter in the case of an annual report) that has materially affected, or is reasonably likelyto materially affect, the registrant’s internal control over financial reporting; and
5. The registrant’s other certifying officer and I have disclosed, based on our most recent evaluation of internal control over financial reporting, to theregistrant’s auditors and the audit committee of the registrant’s board of directors (or persons performing the equivalent functions):
(a) All significant deficiencies and material weaknesses in the design or operation of internal control over financial reporting which arereasonably likely to adversely affect the registrant’s ability to record, process, summarize and report financial information; and
(b) Any fraud, whether or not material, that involves management or other employees who have a significant role in the registrant’s internalcontrol over financial reporting.
Date: March 13, 2006
/s/ EMANUEL N. HILARIO
Emanuel N. Hilario
Chief Financial Officer
Source: McCormick & Schmicks, 10−K, March 14, 2006

Exhibit 32.1
CERTIFICATION OF CHIEF EXECUTIVE OFFICER
I, Saed Mohseni, Chief Executive Officer, in connection with the Annual Report on Form 10−K of McCormick & Schmick’s Seafood Restaurants, Inc. for theannual period ended December 31, 2005 (the “Report”), hereby certify in accordance with 18 U.S.C. Section 1350, as adopted pursuant to Section 906 of theSarbanes−Oxley Act of 2002, that:
(1) The Report fully complies with the requirements of Section 13(a) or 15(d) of the Securities Exchange Act of 1934; and
(2) The information contained in the Report fairly presents, in all material respects, the financial condition and results of operations of McCormick & Schmick’sSeafood Restaurants, Inc.
/s/ SAED MOHSENISaed MohseniChief Executive OfficerDated: March 13, 2006
Source: McCormick & Schmicks, 10−K, March 14, 2006

Exhibit 32.2
CERTIFICATION OF CHIEF FINANCIAL OFFICER
I, Emanuel N. Hilario, Chief Financial Officer, in connection with the Annual Report on Form 10−K of McCormick & Schmick’s Seafood Restaurants, Inc. forthe annual period ended December 31, 2005 (the “Report”), hereby certify in accordance with 18 U.S.C. Section 1350, as adopted pursuant to Section 906 of theSarbanes−Oxley Act of 2002, that:
(1) The Report fully complies with the requirements of Section 13(a) or 15(d) of the Securities Exchange Act of 1934; and
(2) The information contained in the Report fairly presents, in all material respects, the financial condition and results of operations of McCormick & Schmick’sSeafood Restaurants, Inc.
/s/ EMANUEL N. HILARIOEmanuel N. HilarioChief Financial OfficerDated: March 13, 2006
Source: McCormick & Schmicks, 10−K, March 14, 2006