mccombs 2007 valuation presentation 103007
TRANSCRIPT

8/12/2019 McCombs 2007 Valuation Presentation 103007
http://slidepdf.com/reader/full/mccombs-2007-valuation-presentation-103007 1/71
O C T O B E R 3 0 , 2 0 0 7
M & A V A L U A T I O N O V E R V I E W
S T R I C
T L Y
P R I V A T E
A
N D
C O
N F I D E N T I
A L

8/12/2019 McCombs 2007 Valuation Presentation 103007
http://slidepdf.com/reader/full/mccombs-2007-valuation-presentation-103007 2/71
Agenda
LBO analysis
Discounted cash flow analysis
Transaction comparables
Trading comparables
Introduction
1
1
6
20
31
59
M
&
A
V
A L U A T I O
N
O
V E R
V I E W

8/12/2019 McCombs 2007 Valuation Presentation 103007
http://slidepdf.com/reader/full/mccombs-2007-valuation-presentation-103007 3/71
Why valuation is important
Acquisitions
How much should wepay to buy the
company?
Divestitures
How much should wesell our
company/division for?
Fairness opinions
Is the price offeredfor our
company/division fair(from a financialpoint of view)?
Public equityofferings
For how much shouldwe sell our
company/division inthe public market?
Debt offerings
What is the underlyingvalue of the
business/assets againstwhich debt is being
issued?
New businesspresentations
Various applications
Research
Should our clients buy,sell or hold positions in
a given security?
Hostile defense
Is our companyundervalued/vulnerable
to a raider
Valuation
2 I N T R O
D U C T I O
N

8/12/2019 McCombs 2007 Valuation Presentation 103007
http://slidepdf.com/reader/full/mccombs-2007-valuation-presentation-103007 4/71
Valuation methodologies
Publicly tradedcomparable
companies analysis
Comparabletransactions
analysis
Valuationmethodologies
Discountedcash flowanalysis
Leveragedbuyout/recap
analysisOther
“Public Market
Valuation”
Value based on
market trading
multiples of
comparable
companies
Applied using
historical and
prospectivemultiples
Does not include a
control premium
“Private Market
Valuation”
Value based on
multiples paid for
comparable
companies in sale
transactions
Includes control
premium
“Intrinsic” value
of business
Present value of
projected free
cash flows
Incorporates both
short-term and
long-term
expected
performance Risk in cash flows
and capital
structure captured
in discount rate
Value to a
financial/LBO
buyer
Value based on
debt repayment
and return on
equity investment
Liquidation
analysis
Break-up analysis
Historical trading
performance
Expected IPO
valuation
EPS impact
Dividend discount
model
3 I N T R O
D U C T I O
N

8/12/2019 McCombs 2007 Valuation Presentation 103007
http://slidepdf.com/reader/full/mccombs-2007-valuation-presentation-103007 5/71
The valuation process
Leveraged Buy Out:
Used to determine
range of potentialvalue for a company
based on maximum
leverage capacity.
Comparable
Acquisition
Transactions:Utilizes data from
M&A transactions
involving similar
companies.
Publicly Traded
ComparableCompanies: Utilizes
market trading
multiples from
publicly traded
companies to derive
value.
Discounted Cash
Flow: Analyzesthe present
value of a
company's free
cash flow.
Determining a final valuation recommendation is a process of triangulation using insight from each of the relevant valuationmethodologies
Determining a final valuation recommendation is a process of triangulation using insight from each of the relevant valuationmethodologies
4 I N T R O
D U C T I O
N

8/12/2019 McCombs 2007 Valuation Presentation 103007
http://slidepdf.com/reader/full/mccombs-2007-valuation-presentation-103007 6/71
1,350
2,850
1,400
1,8001,400
1,5001,100
1,100
1,6501,350
1,3001,100
3,000
1,850
1,100
500 1,000 1,500 2,000 2,500 3,000 3,500
Va lua t i on met r i cs
Comparable publiccompanies analysis
FV/2005 EBITDA(7.5x – 9.0x) – bank andmanagement cases
FV/2006P EBITDA(7.0x – 8.5x) – bank case
FV/2006P EBITDA(7.0x – 8.5x) – management case
Precedent transactions
analysis
FV/2005 EBITDA(7.5x – 9.5x) – bank andmanagement cases
Discounted cash flowanalysis
Bank case
Management case
Leveraged buyoutanalysis
Bank case
Management case
Implied FV/2005
EBITDA Multiple
9.5x –12.3x
20.5x –27.4x
7.5 – 9.0x
7.5x –9.2x
7.5x – 9.5x
7.5x –10.3x
12.7x –19.5x
9.2 – 11.3x
4,000
The science is performing each valuation method correctly, the art is using each method to develop a valuation recommendationThe science is performing each valuation method correctly, the art is using each method to develop a valuation recommendation
Firm value ($ in millions)
The valuation summary is the most important slide in a
valuation presentation
5 I N T R O
D U C T I O
N

8/12/2019 McCombs 2007 Valuation Presentation 103007
http://slidepdf.com/reader/full/mccombs-2007-valuation-presentation-103007 7/71
Agenda
LBO analysis
Discounted cash flow analysis
Transaction comparables
Trading comparables
Introduction
6
1
6
20
31
59
M
&
A
V
A L U A T I O
N
O
V E R V I E W

8/12/2019 McCombs 2007 Valuation Presentation 103007
http://slidepdf.com/reader/full/mccombs-2007-valuation-presentation-103007 8/71
Trading comparables analysis as a valuation methodology
Publicly tradedcomparable
companies analysis
Comparabletransactions
analysis
Valuationmethodologies
Discountedcash flowanalysis
Leveragedbuyout/recap
analysisOther
“Public Market
Valuation”
Value based on
market tradingmultiples of
comparable
companies
Applied using
historical and
prospective
multiples
Does not include a
control premium
“Private Market
Valuation”
Value based on
multiples paid forcomparable
companies in sale
transactions
Includes control
premium
“Intrinsic” value
of business
Present value of
projected freecash flows
Incorporates both
short-term and
long-term
expected
performance
Risk in cash flows
and capital
structure captured
in discount rate
Value to a
financial/LBO
buyer
Value based ondebt repayment
and return on
equity investment
Liquidation
analysis
Break-up analysis
Historical trading
performance
Expected IPO
valuation
EPS impact
Dividend discount
model
Publicly tradedcomparablecompanies
analysis
7 T R A D I
N G
C O
M
P A R A B L E S

8/12/2019 McCombs 2007 Valuation Presentation 103007
http://slidepdf.com/reader/full/mccombs-2007-valuation-presentation-103007 9/71
ProsPros ConsCons
Trading multiples analysis is a key technique based on the
assumption that the market is efficient / correct
Market values incorporate perception of all
investors reflecting firm prospects, industry
trends, business risk, market growth, etc.
Basic tool for estimating market value
Provides check for DCF
Values obtained are reliable indicator of the
value of firm for minority investment
Difficult to identify 100% comparable
companies
Must make the difficult decision whether the
company being analyzed is valued higher,
lower or the same as the average of the
sample
May be short term divergences from
fundamental value
Stock market may reflect "sentiment” and
not the "true picture”
Thinly traded, small capitalization and
poorly followed stocks may not reflect
fundamental value Different accounting standards
Publicly tradedcomparablecompanies
analysis
8 T R A D I
N G
C O
M
P A R A B L
E S
8/12/2019 McCombs 2007 Valuation Presentation 103007
http://slidepdf.com/reader/full/mccombs-2007-valuation-presentation-103007 10/71
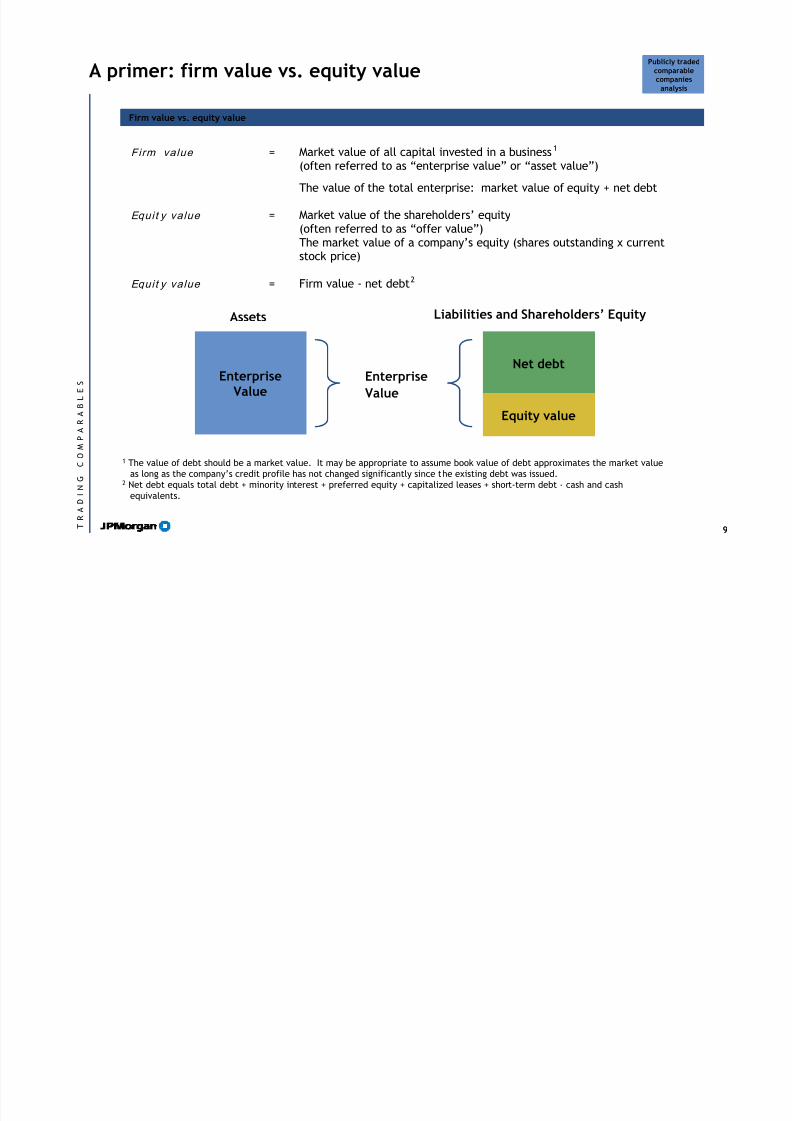
A primer: firm value vs. equity value
Firm value = Market value of all capital invested in a business1 (often referred to as “enterprise value” or “asset value”)
The value of the total enterprise: market value of equity + net debt
Equit y value = Market value of the shareholders’ equity(often referred to as “offer value”)The market value of a company’s equity (shares outstanding x currentstock price)
Equit y value = Firm value - net debt2
Liabilities and Shareholders’ EquityAssets
Enterprise
Value
Net debt
Equity value
Enterprise
Value
1 The value of debt should be a market value. It may be appropriate to assume book value of debt approximates the market valueas long as the company’s credit profile has not changed significantly since the existing debt was issued.
2 Net debt equals total debt + minority interest + preferred equity + capitalized leases + short-term debt - cash and cash
equivalents.
Firm value vs. equity valueFirm value vs. equity value
Publicly tradedcomparablecompanies
analysis
9 T R A D I
N G
C O
M
P A R A B L
E S

8/12/2019 McCombs 2007 Valuation Presentation 103007
http://slidepdf.com/reader/full/mccombs-2007-valuation-presentation-103007 11/71
Different multiples apply to equity value and firm value
Equity valueEquity value Firm valueFirm value
Value for owners of business (after interest
expense)
Multiples of:
Net income After tax cash flow
Book value
Value available to all providers of capital
(before interest expense)
Multiples of:
Sales EBITDA
EBIT
CommentsComments
The defining difference lies in the treatment of debt and its associated cost (interest expense)
A multiple that has debt in the numerator must have a statistic before interest expense in the
denominator
Publicly tradedcomparablecompanies
analysis
10 T R A D I
N G
C O
M
P A R A B L
E S

8/12/2019 McCombs 2007 Valuation Presentation 103007
http://slidepdf.com/reader/full/mccombs-2007-valuation-presentation-103007 12/71
Key comparables must be in same business as target
OperationalOperational FinancialFinancial
Industry
Product
Markets
Distribution channels
Customers
Seasonality
Cyclicality
Growth prospects
Size
Margins
Leverage
Shareholder base (influence of a largeshareholder)
CommentsComments
Consider the perspective of equity investors (can use equity research as a proxy) – to what
would they compare target?
You want to identify companies that closely resemble the composition and function of the
company you are evaluating
Publicly tradedcomparablecompanies
analysis
11 T R A D I
N G
C O
M
P A R A B L
E S

8/12/2019 McCombs 2007 Valuation Presentation 103007
http://slidepdf.com/reader/full/mccombs-2007-valuation-presentation-103007 13/71
Choosing the right multiples
It is important to understand what metric the companies in a peer group trade off of (revenue, EBITDA, EPS, etc.)It is important to understand what metric the companies in a peer group trade off of (revenue, EBITDA, EPS, etc.)
Typical valuation measures include
Firm value multiples
— Firm value/sales
— Firm value/EBITDA— Firm value/EBIT
Equity value multiples
— (Equity value/net income) or (price/EPS (P/E))
— Equity value/after-tax cash flow
— Equity value/book equity
Valuation multiple can be calculated on both a latest twelve months (“LTM”) and a forecasted
basis
Companies trade most typically off expected future performance (analysts’ estimates)
EPS estimates are available from I/B/E/S on Bloomberg
Other income statement projections are found in equity research reports
Publicly tradedcomparablecompanies
analysis
12 T R A D I
N G
C O
M
P A R A B L
E S

8/12/2019 McCombs 2007 Valuation Presentation 103007
http://slidepdf.com/reader/full/mccombs-2007-valuation-presentation-103007 14/71
Performance measures
Growth ratesGrowth rates Margins / ProfitabilityMargins / Profitability
Sales
Operating income
Net income
Gross margin
EBITDA margin
EBIT margin
Net income margin
Operating margin
Return on total invested
capital (industrialcompanies)
Return on equity (financial
institutions companies)
CommentsComments
Comparing various statistics and performance measures among the companies in your
comparable universe can help shed light on why companies may trade the way they do
Capitalization / CreditCapitalization / Credit
Leverage and liquidity
ratios
Coverage ratios
Off-balance sheet
debt/operating leases
Publicly tradedcomparablecompanies
analysis
13 T R A D I
N G
C O
M
P A R A B L
E S

8/12/2019 McCombs 2007 Valuation Presentation 103007
http://slidepdf.com/reader/full/mccombs-2007-valuation-presentation-103007 15/71
ExampleExample Issues / PitfallsIssues / Pitfalls
JPMorgan uses the treasury method to calculate diluted
shares outstanding
Break out each tranche of outstanding
options and warrants separately
Avoid double counting of options - do not
include “Total” line in calculation
Equity value should be calculated using all
options and warrants outstanding (not just
exercisable)
Stock splits
Pro forma adjustments
Note accounting convention for diluted EPS
in financial statements uses average stock
price over the prior year - not correct for
calculating current shares outstanding
The treasury method assumes all in-the-money options are exercised and the proceeds used to buy-back sharesThe treasury method assumes all in-the-money options are exercised and the proceeds used to buy-back shares
ExampleCo Inc.
Total basic shares outstanding (latest 10K/10Q) 1,772,199,483.0
Current ExampleCo share price $40.0
OutstandingExerciseprice
In themoney?
Sharesissueduponexercise
Proceeds fromexercise
Treasurysharespurchasedwith proceeds
Tranche 1 2,975.0 $8.56 Yes 2,975.0 $25,466.0 636.7
Tranche 2 77,165.0 $24.99 Yes 77,165.0 $1,928,353.4 48,208.8
Tranche 3 96,782.0 $39.13 Yes 96,782.0 $3,787,079.7 94,677.0
Tranche 4 110,975.0 $57.00 No 0.0 $0.0 0.0
Total 287,897.0 176,922.0 5,740,899.0 143,522.5
Total shares issued upon exercise of options 176,922.0
Treasury shares purchased with proceeds (143,522.5)
Incremental shares outstanding 33,399.5
Diluted shares outstanding 1,772,232,882.5
Publicly tradedcomparablecompanies
analysis
14 T R A D I
N G
C O
M
P A R A B L
E S
8/12/2019 McCombs 2007 Valuation Presentation 103007
http://slidepdf.com/reader/full/mccombs-2007-valuation-presentation-103007 16/71
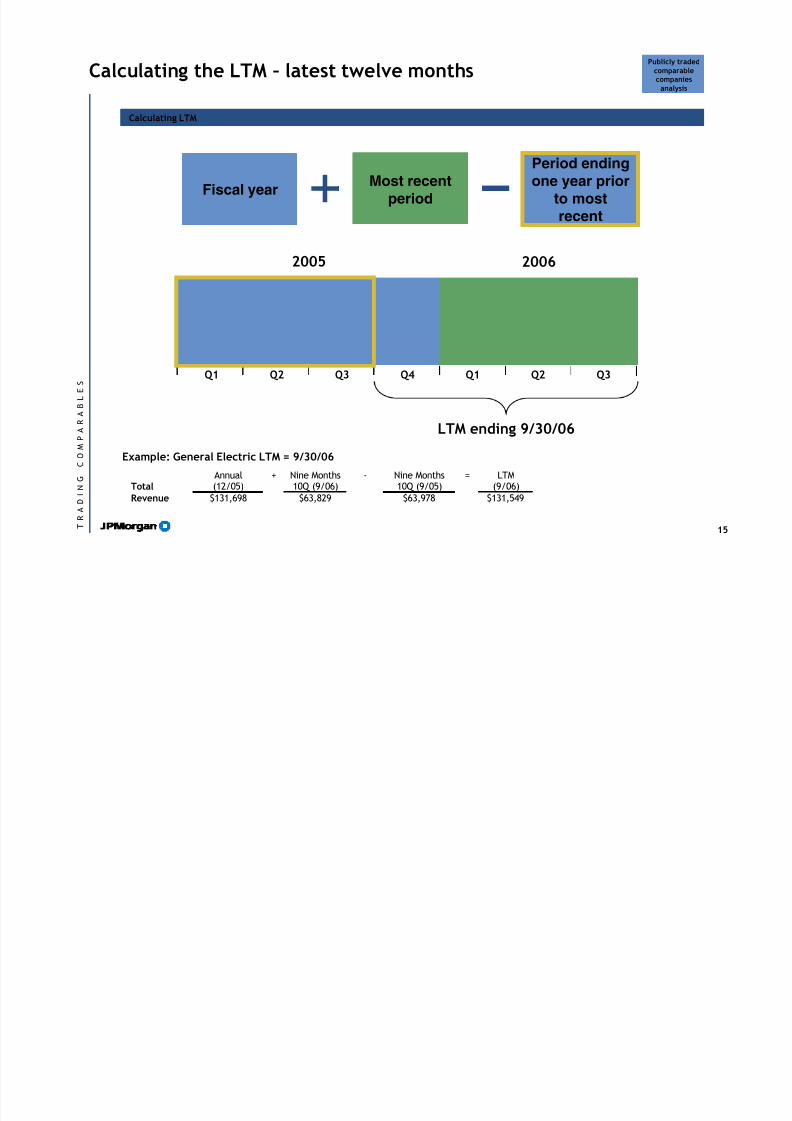
Calculating the LTM – latest twelve months
Calculating LTMCalculating LTM
Total
Annual(12/05)
+ Nine Months10Q (9/06)
- Nine Months10Q (9/05)
= LTM(9/06)
Revenue $131,698 $63,829 $63,978 $131,549
Example: General Electric LTM = 9/30/06
Publicly tradedcomparablecompanies
analysis
Fiscal yearMost recent
period
Period endingone year prior
to mostrecent
2005 2006
Q1 Q2 Q3 Q4 Q1 Q2
LTM ending 9/30/06
Q3
15 T R A D I
N G
C O
M
P A R A B L
E S

8/12/2019 McCombs 2007 Valuation Presentation 103007
http://slidepdf.com/reader/full/mccombs-2007-valuation-presentation-103007 17/71
Calendarizing financial data
Calendarization methodologyCalendarization methodology
When companies in the comparable universe have fiscal years ending at a date other than that
of the client or focus company, it is common to employ the technique of calendarization
Calendarization adjusts the financial data of one company to reflect results representative of
the period in time corresponding to the latest fiscal year of the client or focus company
This insures that the financial data of both companies is truly comparable by eliminating
seasonal or cyclical differences that may arise as a result of dissimilar fiscal year ends
Example: Client has fiscal year end (“FYE”) 12/31 while Comp has FYE 10/31
Comp FYE 2006 Net Income = $120, Target FYE 2007E Net Income = $150 Calendarize Comp from 10/31/06 FYE to Client 12/31/06 FYE
Target CY2006E Net Income =
Ideally could use quarterly estimates
However, availability and consistency are an issue
Publicly tradedcomparablecompanies
analysis
10 x $120 2 x $15012
+12
= $100 + $25 = $125
16 T R A D I
N G
C O
M
P A R A B L
E S

8/12/2019 McCombs 2007 Valuation Presentation 103007
http://slidepdf.com/reader/full/mccombs-2007-valuation-presentation-103007 18/71
Other standards when spreading comps
Other standardsOther standards
Use income from continuing operations (i.e. income before discontinued operations,
extraordinary charges/income and effect of change in accounting principles)
Eliminate non-recurring items
Restructuring charges
Gains/losses on sale of assets
One-time write-offs
Read all footnotes and Management Discussion and Analysis (“MD&A”) sections
Tax effect all adjustments, if they relate to an after-tax financial statistic and aretax-deductible
Check MD&A and footnotes for actual tax impact if available
Use marginal rate if tax impact not available
Double-check your calculations
“Reality” check on multiples, margins, etc. (ruler check, brokerage report check) Don’t assume model is always right
Publicly tradedcomparablecompanies
analysis
17 T R A D I
N G
C O
M
P A R A B L
E S
8/12/2019 McCombs 2007 Valuation Presentation 103007
http://slidepdf.com/reader/full/mccombs-2007-valuation-presentation-103007 19/71
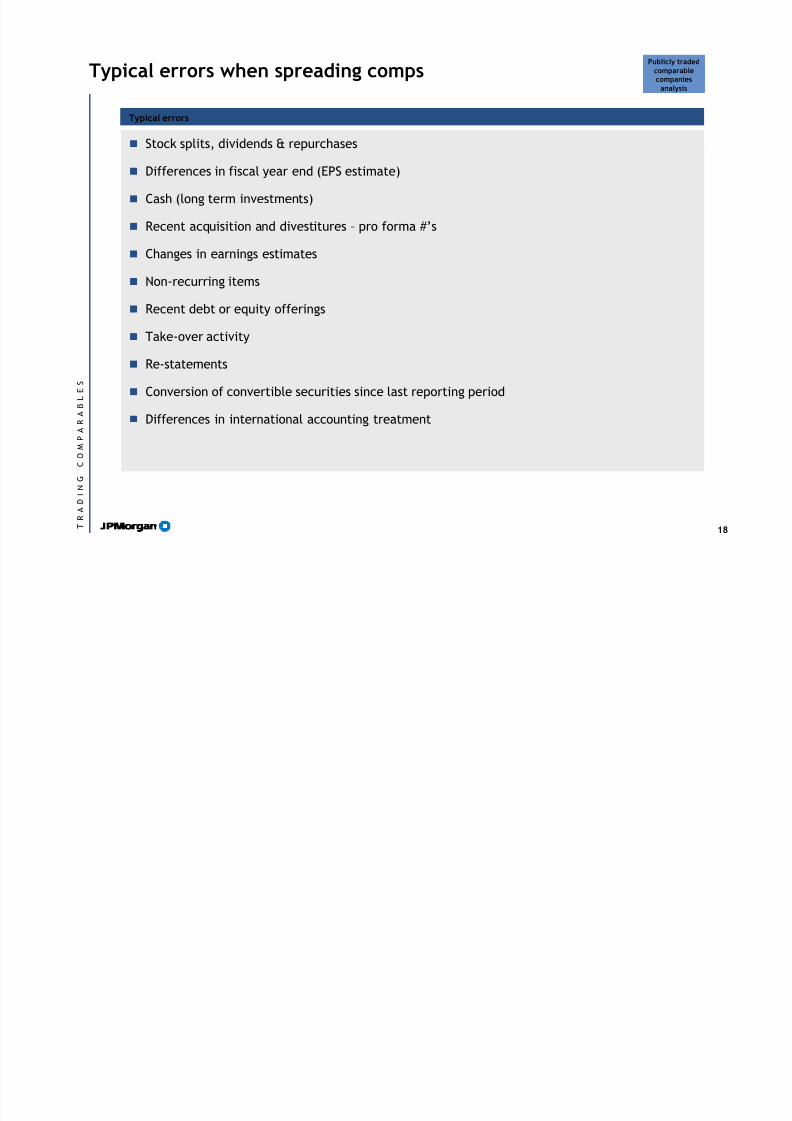
Typical errors when spreading comps
Typical errorsTypical errors
Stock splits, dividends & repurchases
Differences in fiscal year end (EPS estimate)
Cash (long term investments)
Recent acquisition and divestitures – pro forma #’s
Changes in earnings estimates
Non-recurring items
Recent debt or equity offerings
Take-over activity
Re-statements
Conversion of convertible securities since last reporting period Differences in international accounting treatment
Publicly tradedcomparablecompanies
analysis
18 T R A D I
N G
C O
M
P A R A B L
E S

8/12/2019 McCombs 2007 Valuation Presentation 103007
http://slidepdf.com/reader/full/mccombs-2007-valuation-presentation-103007 20/71
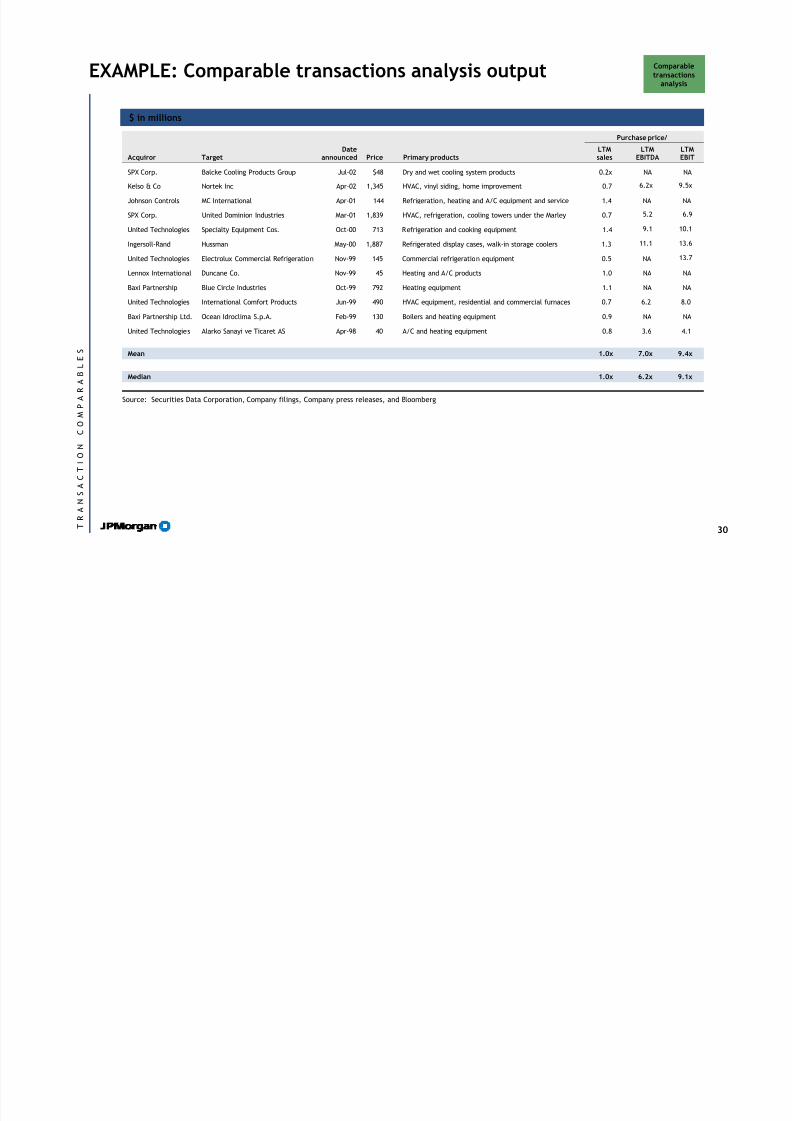
EXAMPLE: Trading comparables output
Firm valueStock
price at10/25/06
52-weekhigh
52-weeklow
Mkt.cap
Firmvalue
LTMsales
2006Esales
2007Esales
LTMEBITDA
2006EEBITDA
2007EEBITDA
LTMEBIT
2006EEBIT
2007EEBIT
2006EP/E
2007EP/E LTGR
2006EPEG
Company A $11.81 $12.30 $4.47 $102 $290 1.78x 1.06x 0.76x 15.7x 9.3x 6.7x 18.3x 11.4x 8.3x 15.8x 13.2x 16.5% 1.0x
Company B 15.51 25.75 13.48 262 238 0.43 0.45 0.43 5.1 6.0 5.3 6.2 7.6 6.7 13.9 11.4 15.3% 0.9
Company C 6.65 6.85 2.35 162 350 0.37 0.36 0.35 8.1 5.9 5.6 11.3 7.3 7.0 11.6 10.5 10.0% 1.2
Company D 48.44 57.50 32.05 2,683 3,504 1.02 0.96 0.87 7.1 6.7 6.2 9.8 9.2 8.3 15.1 13.1 17.2% 0.9
High 1.78x 1.06x 0.87x 15.7x 9.3x 6.7x 18.3x 11.4x 8.3x 15.8x 13.2x 17.2% 1.2x
Mean 0.72x 0.70x 0.59x 7.6x 6.3x 5.9x 10.6x 8.4x 7.6x 14.5x 12.2x 15.9% 0.9x
Median 0.90x 0.71x 0.60x 9.0x 7.0x 5.9x 11.4x 8.8x 7.6x 14.1x 12.1x 14.8% 1.0x
Low 0.37x 0.36x 0.35x 5.1x 5.9x 5.3x 6.2x 7.3x 6.7x 11.6x 10.5x 10.0% 0.9x
Target Company$18.44 $19.25 $10.00 $107 $116 0.70x 0.68x 0.62x 6.3x 6.2x 5.5x 7.3x 7.2x 6.2x 10.5x 9.3x 20.0% 0.5x
LTM margin analysis LTM leverage analysis
LTMsales
LTMEBITDA
Grossprofit
EBITDAmargin EBIT margin
Netincome
Debt/cap.
Debt/EBITDA
LTM EBITDA/interest
LTM CAPEX/sales
Returnon equity
Returnon assets
Company A $162.64 $18.53 33.3% 11.4% 9.7% 4.2% 74.6% 9.4x 2.7x 1.4% 20.3% 2.4%
Company B 558.39 46.86 25.9% 8.4% 6.8% 4.1% NM 0.0 85.5 0.8% 11.6% 9.3%
Company C 943.78 43.25 8.3% 4.6% 3.3% 0.3% 58.5% 6.0 1.8 1.7% 1.7% 0.6%Company D 3,446.34 491.98 46.9% 14.3% 10.4% 5.5% 38.5% 1.4 13.4 5.9% 19.4% 7.8%
High 46.9% 14.3% 10.4% 5.5% 74.6% 9.4x 85.5x 5.9% 20.3% 9.3%
Mean 29.6% 9.9% 8.3% 4.2% 58.5% 3.7x 8.0x 1.5% 15.5% 5.1%
Median 28.6% 9.7% 7.6% 3.5% 57.2% 4.2x 25.8x 2.4% 13.2% 5.0%
Low 8.3% 4.6% 3.3% 0.3% 38.5% 0.0x 1.8x 0.8% 1.7% 0.6%
Target Company $164.83 $18.42 21.0% 11.2% 9.6% 5.8% 14.4% 0.6x 67.2x 0.3% 15.3% 10.1%
Operating statistics (do l lars in mi l l ions) Operating statistics (do l lars in mi l l ions)
Source: Company filings, Analyst reports, Bloomberg
Trading statistics (do l lars in mi l l i ons except per share dat a) Trading statistics (do l lars in mi l l i ons except per share dat a)
Publicly tradedcomparablecompanies
analysis
19 T R A D I N G
C O
M
P A R A B L
E S
8/12/2019 McCombs 2007 Valuation Presentation 103007
http://slidepdf.com/reader/full/mccombs-2007-valuation-presentation-103007 21/71
Agenda
LBO analysis
Discounted cash flow analysis
Transaction comparables
Trading comparables
Introduction
20
1
6
20
31
59
M
&
A V
A L U A T I O
N
O
V E
R V I E W

8/12/2019 McCombs 2007 Valuation Presentation 103007
http://slidepdf.com/reader/full/mccombs-2007-valuation-presentation-103007 22/71
Transaction comparables analysis as a valuation methodology
Publicly tradedcomparable
companies analysis
Comparabletransactions
analysis
Valuationmethodologies
Discountedcash flowanalysis
Leveragedbuyout/recap
analysisOther
“Public Market
Valuation”
Value based on
market tradingmultiples of
comparable
companies
Applied using
historical and
prospective
multiples
Does not include a
control premium
“Private Market
Valuation”
Value based on
multiples paid forcomparable
companies in sale
transactions
Includes control
premium
“Intrinsic” value
of business
Present value of
projected freecash flows
Incorporates both
short-term and
long-term
expected
performance
Risk in cash flows
and capital
structure captured
in discount rate
Value to a
financial/LBO
buyer
Value based ondebt repayment
and return on
equity investment
Liquidation
analysis
Break-up analysis
Historical trading
performance
Expected IPO
valuation
EPS impact
Dividend discountmodel
21 T R A N S A C T I O
N
C O
M
P A
R A B L E S
8/12/2019 McCombs 2007 Valuation Presentation 103007
http://slidepdf.com/reader/full/mccombs-2007-valuation-presentation-103007 23/71
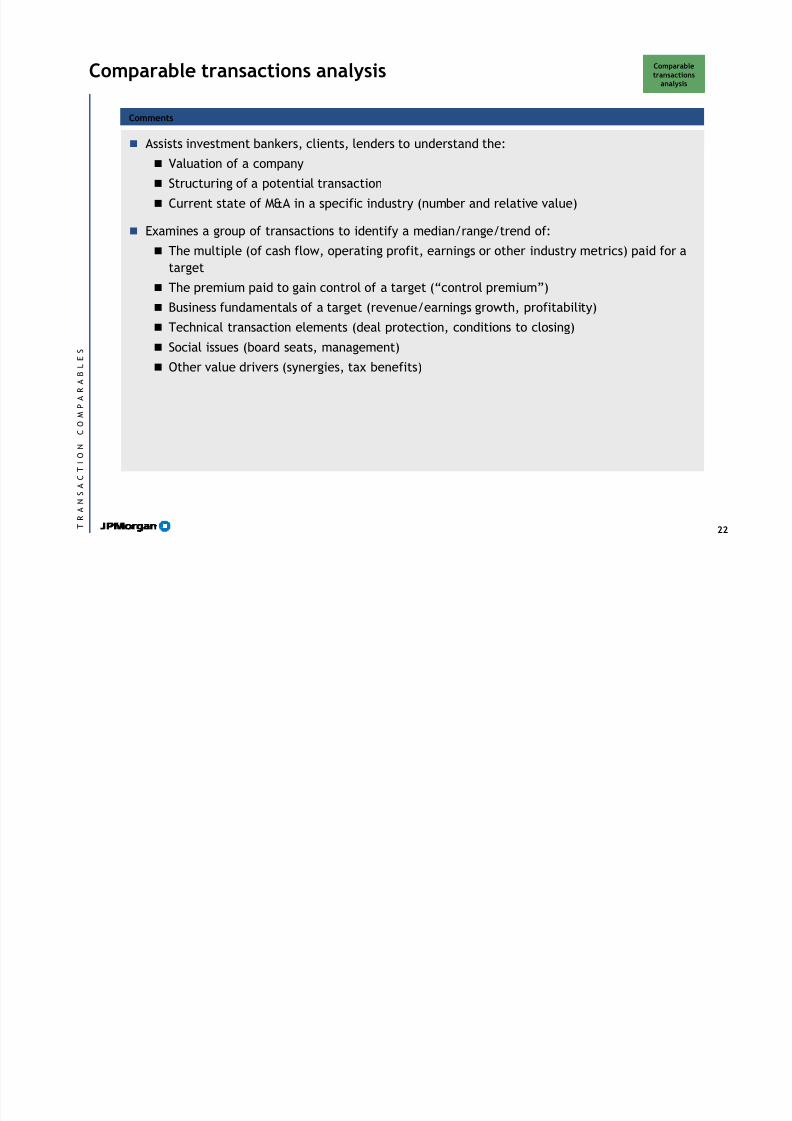
Comparable transactions analysis
CommentsComments
Assists investment bankers, clients, lenders to understand the:
Valuation of a company
Structuring of a potential transaction
Current state of M&A in a specific industry (number and relative value)
Examines a group of transactions to identify a median/range/trend of:
The multiple (of cash flow, operating profit, earnings or other industry metrics) paid for a
target
The premium paid to gain control of a target (“control premium”)
Business fundamentals of a target (revenue/earnings growth, profitability)
Technical transaction elements (deal protection, conditions to closing)
Social issues (board seats, management)
Other value drivers (synergies, tax benefits)
Comparabletransactions
analysis
22 T R A N S A C T I O
N
C O
M
P A
R A B L E S

8/12/2019 McCombs 2007 Valuation Presentation 103007
http://slidepdf.com/reader/full/mccombs-2007-valuation-presentation-103007 24/71
Sources used to locate comparable transactions
Reference sourcesReference sources
Thompson Financial database
Locates targets based on SIC code, business description, industry
Identifies transactions based on hostile vs. friendly, transaction size, announcement date,
and several other deal elements The “Comprehensive Summary Report” is very helpful in hand-picking transactions since it
includes a synopsis of the deal in addition to general information regarding both parties andthe transaction
Senior bankers who work in the industry
Will be able to point you toward previously used presentations or valuations Ensures you do not exclude any landmark deals or other deals they would specifically like to
include
Merger proxies for similar transactions
Fairness opinions of financial advisors disclose the comparable transactions used in their
valuation of the target Other sources include:
Proprietary transaction comps databases
News runs
Equity research reports
Comparabletransactions
analysis
23 T R A N S A C T I O
N
C O
M
P A
R A B L E S

8/12/2019 McCombs 2007 Valuation Presentation 103007
http://slidepdf.com/reader/full/mccombs-2007-valuation-presentation-103007 25/71
Selecting comparable transactions
Selecting transactionsSelecting transactions
When valuing a company, key objective is to find the most comparable businesses
Similar industries with similar products or services
Size, margins, relative market position, major potential liabilities
When seeking guidance regarding structure, the situation surrounding the acquisition is crucial
Scenarios could include: LBO’s, bankruptcy-related acquisitions, hostile transactions,
reverse mergers, divestitures, asset vs. stock acquisitions, form of consideration, Morris
Trust transactions, and many others
If possible, try to locate transactions in a similar industry as well
Some types of transactions should, generally, not be considered as a comparable transaction
Acquisitions of a minority interest (not a change of control transaction)
Rumored or withdrawn transactions
Recent deals are typically a more accurate reflection of the values buyers are willing to pay
Remember that some transactions are more relevant than others when selecting a range of
multiples for valuation
Comparabletransactions
analysis
24 T R A N S A C T I O
N
C O
M
P A
R A B L E S

8/12/2019 McCombs 2007 Valuation Presentation 103007
http://slidepdf.com/reader/full/mccombs-2007-valuation-presentation-103007 26/71
Definitions of equity value and firm value similar to trading comparables:
Equity value Value received by the target / target shareholders (100%)
+
Net debt Debt assumed by acquirer minus cash received
Firm value Total value of business acquired (100%)
BE CAREFUL: Transaction value for a change of control transaction will differ from equity and/or firm valuewhen >50% but <100% is acquired
Equity value:
Cash consideration: (fully-diluted target shares @ offer price) x (cash consideration per share)
Stock consideration: (fully-diluted target shares @ offer price) x (exchange ratio) x (price per acquirershare @ the closing price prior to announcement)
Cash and stock consideration: (fully-diluted target shares @ offer price) x (cash consideration per share)plus (fully-diluted target shares @ offer price) x (exchange ratio) x (price per acquirer share @ the closingprice prior announcement)
Firm value:
In all cases: Add the indebtedness and subtract the cash items that are to be transferred to the acquirerthrough the transaction to the target equity value
Be careful not to add any convertible debt or preferred securities which were converted into commonshares (and already included in the fully-diluted share count)
May be appropriate to include certain other unfunded liabilities in the calculation of firm value for a
transaction
Calculating equity and firm value
Calculating equity and firm valueCalculating equity and firm value
Comparabletransactions
analysis
25 T R A N S A C T I O
N
C O
M
P A
R A B L E S

8/12/2019 McCombs 2007 Valuation Presentation 103007
http://slidepdf.com/reader/full/mccombs-2007-valuation-presentation-103007 27/71
Other equity and firm value issues
Other issuesOther issues
Timing (announcement vs. closing)
Typically want to assess what buyer was willing to pay for business, so most interested in valuation based
on stock prices as of announcement date
Information regarding shares outstanding, options, debt, cash as of most recent publicly disclosed source as
of announcement date (i.e. 10-K, 10-Q, or Proxy, 8-K)
However, if terms of the transaction change (exchange ratio, amount of cash consideration), should look to
valuation on date of announcement of revised terms
Valuing a deal with stock consideration as of the closing date will give a sense for how market reacted to
value of two companies together
Transaction fees
Typically M&A fees/financing fees are not included in firm value of business acquired as they are not
consideration received by seller
However, in extreme cases (i.e., LBO/recap) it may be instructive to know amount of fees and indicate
how they may have impacted business valuation
Asset purchases
Note that debt can be transferred with businesses/assets being sold and must be added to theconsideration paid by the acquirer
Other liabilities
In some instances it may be appropriate to include the assumption of a non-debt other unfunded liability in
firm value (such as an existing restructuring reserve) but never NWI / working capital items
Earn-outs/purchase price adjustments
Comparabletransactions
analysis
26 T R A N
S A C T I O
N
C O
M
P A
R A B L E S

8/12/2019 McCombs 2007 Valuation Presentation 103007
http://slidepdf.com/reader/full/mccombs-2007-valuation-presentation-103007 28/71
LTM financial information issues
LTM issuesLTM issues
Time horizon
LTM financial information should reflect what buyer bought the business “off-of” and is generally
backward-looking (typically last twelve months of financial information available prior the announcement
date)
In certain industry-specific circumstances (i.e. technology, biotech) it is more useful to look at projectedfinancial information as well (typically IBES consensus estimates / median of several analyst reports)
However, the outlook of equity analysts may be quite different than the outlook of the buyer at the
time of acquisition
Adjustments
Exclude impact of extraordinary items on a tax-affected basis
Pro forma adjustments (i.e. acquisitions and divestitures) must be considered
Currencies
If target is foreign, most-commonly taught method is to apply average exchange rates over LTM period
because it is the accounting convention
Is this always appropriate for valuation purposes? Not necessarily
Need to consider carefully / discuss with team-members in extreme cases (i.e. when currency has de-valued / re-valued substantially vs. US Dollar)
Comparabletransactions
analysis
27 T R A N
S A C T I O
N
C O
M
P A
R A B L E S

8/12/2019 McCombs 2007 Valuation Presentation 103007
http://slidepdf.com/reader/full/mccombs-2007-valuation-presentation-103007 29/71
Other general considerations
Other considerationsOther considerations
Synergies
Synergies are not generally incorporated into the financial information but it may be useful to consider
their value when comparing transactions to each other
Sometimes will indicate announced synergies as a % of sales, SG&A, SG&A + COGS, transaction value
Tax benefits
In certain cases a buyer will receive substantial benefits from depreciating / amortizing a write-up and
receiving incremental tax deductions
An acquirer can often justify a higher purchase price and multiples may be higher in such circumstances
Can attempt to estimate the value of tax benefits received by acquirer but depends on a lot of unknown
variables (discount rate, amortization period, tax basis)
However, should know which transactions are tax-advantaged and which aren’t
Comparabletransactions
analysis
28 T R A N
S A C T I O
N
C O
M
P A
R A B L E S

8/12/2019 McCombs 2007 Valuation Presentation 103007
http://slidepdf.com/reader/full/mccombs-2007-valuation-presentation-103007 30/71
Most common errors
Common errorsCommon errors
Unaffected stock prices (for premium analyses)
Stock splits
Proper interpretation of exchange ratio
Target share price / acquirer share price
Using the correct acquirer share price
Most recent common shares outstanding (use the merger agreement if available)
Use all outstanding, not exercisable, options and warrants and assume that all in-the-money securities are
exercised in this analysis
Check for warrants
Repriced options
New issuances of debt or equity since most recent 10Q or 10K
Forgetting debt in an asset transaction
Acquisitions or divestitures completed by the target over LTM period
Exclude all extraordinary items - only tax affect those items that are tax deductible
Publicly-available information only
Comparabletransactions
analysis
29 T R A N
S A C T I O
N
C O
M
P A
R A B L E S
8/12/2019 McCombs 2007 Valuation Presentation 103007
http://slidepdf.com/reader/full/mccombs-2007-valuation-presentation-103007 31/71

8/12/2019 McCombs 2007 Valuation Presentation 103007
http://slidepdf.com/reader/full/mccombs-2007-valuation-presentation-103007 32/71
Agenda
LBO analysis
Discounted cash flow analysis
Transaction comparables
Trading comparables
Introduction
31
1
6
20
31
59
M
&
A
V A L U A T I O
N
O
V E
R V I E W

8/12/2019 McCombs 2007 Valuation Presentation 103007
http://slidepdf.com/reader/full/mccombs-2007-valuation-presentation-103007 33/71
Valuation methodologies
Publicly tradedcomparablecompanies analysis
Comparabletransactionsanalysis
Valuationmethodologies
Discountedcash flowanalysis
Leveragedbuyout/recapanalysis
Other
“Public Market
Valuation”
Value based on
market tradingmultiples of
comparable
companies
Applied using
historical and
prospective
multiples
Does not include a
control premium
“Private Market
Valuation”
Value based on
multiples paid forcomparable
companies in sale
transactions
Includes control
premium
“Intrinsic” value
of business
Present value of
projected freecash flows
Incorporates both
short-term and
long-term
expected
performance
Risk in cash flows
and capital
structure captured
in discount rate
Value to a
financial/LBO
buyer
Value based ondebt repayment
and return on
equity investment
Liquidation
analysis
Break-up analysis
Historical trading
performance
Expected IPO
valuation
EPS impact
Dividend discountmodel
32 D I S C O
U N T E D
C A S H
F
L O
W
A N A L Y S I S

8/12/2019 McCombs 2007 Valuation Presentation 103007
http://slidepdf.com/reader/full/mccombs-2007-valuation-presentation-103007 34/71
Overview of DCF analysis
CommentsComments
Discounted cash flow analysis is based upon the theory that the value of a business is the sum of
its expected future free cash flows, discounted at an appropriate rate
DCF analysis is one of the most fundamental and commonly-used valuation techniques
Widely accepted by bankers, corporations and academics
– Corporate clients often use DCF analysis internally
One of several techniques used in M&A transactions; others include:
– Comparable companies analysis
– Comparable transaction analysis
– Leveraged buyout analysis
– Recapitalization analysis, liquidation analysis, etc.
DCF analysis may be the only valuation method utilized, particularly if no comparable
publicly-traded companies or precedent transactions are available
Discountedcash flowanalysis
33 D I S C O
U N T E D
C A S H
F
L O
W
A N A L Y S I S

8/12/2019 McCombs 2007 Valuation Presentation 103007
http://slidepdf.com/reader/full/mccombs-2007-valuation-presentation-103007 35/71
Overview of DCF analysis (cont’d)
CommentsComments
DCF analysis is a forward-looking valuation approach, based on several key projections and
assumptions
Free cash flows
– What is the projected operating and financial performance of the business?
Terminal value
– What will be the value of the business at the end of the projection period?
Discount rate
– What is the cost of capital (equity and debt) for the business?
Depending on practical requirements and availability of data, DCF analysis can be simple or
extremely elaborate
There is no single “correct” method of performing DCF analysis, but certain rules of thumb
always apply
Do not simply plug numbers into equations
You must apply judgment in determining each assumption
Discountedcash flowanalysis
34 D I S C O
U N T E D
C A S H
F
L O
W
A N A L Y S I S

8/12/2019 McCombs 2007 Valuation Presentation 103007
http://slidepdf.com/reader/full/mccombs-2007-valuation-presentation-103007 36/71
The process of DCF analysis
Project the operating results and free cash flows of the business overthe forecast period (typically 10 years, but can be 5–20 yearsdepending on the profitability horizon)
Estimate the exit multiple and/or growth rate in perpetuity of thebusiness at the end of the forecast period
Estimate the company’s weighted-average cost of capital to determinethe appropriate discount rate range
Determine a range of values for the enterprise by discounting theprojected free cash flows and terminal value to the present
Adjust the resulting valuation for all assets and liabilities not accountedfor in cash flow projections
Projections/FCF
Terminal value
Discount rate
Present value
Adjustments
Discountedcash flowanalysis
Process overviewProcess overview
35 D I S C O
U N T E D
C A S H
F
L O
W
A N A L Y S I S

8/12/2019 McCombs 2007 Valuation Presentation 103007
http://slidepdf.com/reader/full/mccombs-2007-valuation-presentation-103007 37/71
Projecting financial statements
Ideally projections should go out as far into the future as can reasonably be estimated to reduce
dependence on the terminal value
Most important assumptions:
Sales growth: Use divisional, product-line or location-by-location build-up or simple growth
assumptions
Operating margins: Evaluate improvement over time, competitive factors, SG&A costs
Synergies: Estimate dollars in Year 1 and evaluate margin impact over time
Depreciation: Should conform with historic and projected capex Capital expenditures: Consider both maintenance and expansion capex
Changes in net working capital: Should correspond to historical patterns and grow as the
business grows
Should show historical financial performance and sanity check projections against past results.
Be prepared to articulate why projections may or may not be similar to past results (e.g.
reasons behind margin improvements, increased sales growth, etc.)
Analyze projections for consistency
Sales increases usually require working capital increases
Capex and depreciation should converge over time
CommentsComments
Discountedcash flowanalysis
36 D I S C O
U N T E D
C A S H
F
L O
W
A N A L Y S I S
Free cash flow is the cash that remains for creditors and
8/12/2019 McCombs 2007 Valuation Presentation 103007
http://slidepdf.com/reader/full/mccombs-2007-valuation-presentation-103007 38/71
Unlevered free cash flows can be forecast from a firm’s financial projections, even if those
projections include the effects of debt
To do this, simply start your calculation with EBIT (earnings before interest and taxes):
CommentsComments
Free cash flow is the cash that remains for creditors and
owners after taxes and reinvestment
EBIT (from the income statement)
Plus: non-tax-deductible goodwill amortization
Less: taxes (at the marginal tax rate)
Equals: tax-effected EBITA
Plus: deferred taxes1
Plus: depreciation and any tax-deductible amortization
Less: capital expenditures
Plus/(less): decrease/(increase) in net working investment
Equals: unlevered free cash flow
1 Although beyond the scope of our current discussions, you should only include actual cash taxes paid in the DCF. Depending on the firm and industry, you may want to adjustfor the non-cash (or deferred) portion of a firm’s tax provision. The tax footnote in the financial statements will give you a good idea of whether this is a meaningful issue foryour analysis
Discountedcash flowanalysis
37 D I S C O
U N T E D
C A S H
F
L O
W
A N A L Y S I S

8/12/2019 McCombs 2007 Valuation Presentation 103007
http://slidepdf.com/reader/full/mccombs-2007-valuation-presentation-103007 39/71
2003 2004 2005 2006E 2007E 2008E 2009E 2010E
Net sales $400.0 $440.0 $484.0 $532.4 $585.6 $644.2 $708.6 $779.5
EBITDA 80.0 88.0 96.8 106.5 117.1 128.8 141.7 155.9
Less: depreciation 12.0 13.2 14.5 16.0 17.6 19.3 21.3 23.4
EBITA 68.0 74.8 82.3 90.5 99.6 109.5 120.5 132.5Less: taxes at marginal rate 27.2 29.9 32.9 36.2 39.8 43.8 48.2 53.0
Tax-effected EBITA $40.8 $44.9 $49.4 $54.3 $59.7 $65.7 $72.3 $79.5
Plus: depreciation 16.0 17.6 19.3 21.3 23.4
Plus: deferred taxes – – – – –
Less: capital expenditures 20.0 22.0 24.2 26.6 29.3
Less: incr./(decr.) in working capital 10.0 8.5 7.0 5.5 4.0Unlevered free cash flow 40.3 46.8 53.8 61.4 69.6
Adjustment for deal date (40.3) – – – –
Unlevered FCF to acquirer $0.0 $46.8 $53.8 $61.4 $69.6
Stand-alone DCF analysis of Company X ($ millions)Stand-alone DCF analysis of Company X ($ millions)
Example: Calculating unlevered free cash flows
Key assumptions:Deal/valuation date = 12/31/06Marginal tax rate = 40%
Discountedcash flowanalysis
38 D I S C O
U N T E D
C A S H
F
L O
W
A N A L Y S I S
Once unlevered free cash flows are calculated, they must

8/12/2019 McCombs 2007 Valuation Presentation 103007
http://slidepdf.com/reader/full/mccombs-2007-valuation-presentation-103007 40/71
The standard present value calculation takes into account the cost of capital by attributing
greater value to cash flows generated earlier in the projection period than later cash flows
Since most businesses do not generate all of their free cash flows on the last day of the year,
but rather more-or-less continuously during the year, DCF analyses often use the so-called
“mid-year convention,” which takes into account the fact that free cash flows occur during theyear
This approach moves each cash flow from the end of the applicable period to the middle of the
same period (i.e., cash flows are moved closer to the present)
CommentsComments
FCF1 FCF2 FCF3 FCFn
Present value = (1+r)1 + (1+r)2 + (1+r)3 + . . . + (1+r)n
FCF1 FCF2 FCF3 FCFn Present value =
(1+r)0.5 +
(1+r)1.5 +
(1+r)2.5 +
. . .+
(1+r)n-0.5
, y
be discounted to the present
JPMorganstandard
Discountedcash flowanalysis
39 D I S C O
U N T E D
C A S H
F
L O
W
A N A L Y S I S
It is important to differentiate between the transaction

8/12/2019 McCombs 2007 Valuation Presentation 103007
http://slidepdf.com/reader/full/mccombs-2007-valuation-presentation-103007 41/71
p
date and the mid-year convention
Transaction date: 01/01
Year 0 1 2 30.5 1.5 2.5 3.5
First cash flow,mid-year 1
Second cash flow,mid-year 2
Third cash flow,mid-year 3
Discounting =CF1
(1+r)0.5+
CF2
(1+r)1.5+
CF3
(1+r)2.5+ ….
Example 1Example 1
Transaction date: 06/30
Year 0 1 2 30.5 1.5 2.5 3.5
First cash flow,mid-period 1
Second cash flow,mid-year 2
Third cash flow,mid-year 3
Discounting =CF1
(1+r)(0.75-0.5)+
CF2
(1+r)(1.5-0.5)+
CF3
(1+r)(2.5-0.5)+ ….
Example 2Example 2
0.75
Discountedcash flowanalysis
40 D I S C
O
U N T E D
C A S H
F
L O
W
A N A L Y S I S

8/12/2019 McCombs 2007 Valuation Presentation 103007
http://slidepdf.com/reader/full/mccombs-2007-valuation-presentation-103007 42/71
Discounting free cash flows
Key assumptions:Deal/valuation date = 12/31/06Marginal tax rate = 40%
Discount rate = 10%
$189.6 =$46.8
(1+.10)0.5
$53.8
(1+.10)1.5
$61.4
(1+.10)2.5
$69.6
(1+.10)3.5+ + +Formula
2003 2004 2005 2006E 2007E 2008E 2009E 2010E
Net sales $400.0 $440.0 $484.0 $532.4 $585.6 $644.2 $708.6 $779.5
EBITDA 80.0 88.0 96.8 106.5 117.1 128.8 141.7 155.9
Less: Depreciation 12.0 13.2 14.5 16.0 17.6 19.3 21.3 23.4
EBITA 68.0 74.8 82.3 90.5 99.6 109.5 120.5 132.5
Less: Taxes at marginal rate 27.2 29.9 32.9 36.2 39.8 43.8 48.2 53.0
Tax-effected EBITA $40.8 $44.9 $49.4 $54.3 $59.7 $65.7 $72.3 $79.5
Plus: Depreciation 16.0 17.6 19.3 21.3 23.4
Plus: Deferred taxes – – – – –
Less: Capital expenditures 20.0 22.0 24.2 26.6 29.3
Less: Incr./(decr.) in working capital 10.0 8.5 7.0 5.5 4.0
Unlevered free cash flow 40.3 46.8 53.8 61.4 69.6Adjustment for deal date (40.3) – – – –
Unlevered FCF to acquirer $0.0 $46.8 $53.8 $61.4 $69.6
Memo: discounting factor 0.0 0.5 1.5 2.5 3.5
Discounted value of unlevered FCF $0.0 $44.6 $46.7 $48.4 $49.9
Discounted value of FCF 2007E–2010E 189.6
Stand-alone DCF analysis of Company X ($ millions)Stand-alone DCF analysis of Company X ($ millions)
Discountedcash flowanalysis
41 D I S C
O
U N T E D
C A S H
F
L O
W
A N A L Y S I S
Terminal value can account for a significant portion of

8/12/2019 McCombs 2007 Valuation Presentation 103007
http://slidepdf.com/reader/full/mccombs-2007-valuation-presentation-103007 43/71
value in a DCF analysis
Terminal value represents the business’s value at the end of the projection period; i.e., theportion of the company’s total value attributable to cash flows expected after the projectionperiod
Terminal value is typically based on some measure of the performance of the business in theterminal year of the projection (which should depict the business operating in a steady-state/normalized manner)
Terminal (or “Exit”) multiple method
– Assumes that the business is valued/sold at the end of the terminal year at a multipleof some financial metric (typically EBITDA)
Growth in perpetuity method
– Assumes that the business is held in perpetuity and that free cash flows continue togrow at an assumed rate
A terminal multiple will have an implied growth rate and vice versa. It is essential toreview the implied multiple/growth rate for sanity check purposes
Once calculated, the terminal value is discounted back to the appropriate date using therelevant rate
Attempt to reduce dependence on the terminal value What is appropriate projection time frame? What percentage of total value comes from the terminal value?
CommentsComments
Discountedcash flowanalysis
42 D I S C
O
U N T E D
C A S H
F
L O
W
A N A L Y S I S

8/12/2019 McCombs 2007 Valuation Presentation 103007
http://slidepdf.com/reader/full/mccombs-2007-valuation-presentation-103007 44/71
Terminal multiple method
This method assumes that the business will be valued at the end of the last year of theprojected period
The terminal value is generally determined as a multiple of EBIT, EBITDA, or EBITDAR; this
value is then discounted to the present, as were the interim free cash flows
The terminal value should be an asset (firm) value; remember that not all multiples
produce an asset value
Note that in the exit multiple method terminal value is always assumed to be calculated at
the end of the final projected year, irrespective of whether you are using the mid-year
convention
Should the terminal multiple be an LTM multiple or a forward multiple?
If the terminal value is based on the last year of your projection then the multiple should
be based on an LTM multiple (most common)
There are circumstances where you will project an additional year of EBITDA and apply aforward multiple
CommentsComments
Discountedcash flowanalysis
43 D I S C
O
U N T E D
C A S H F
L O
W
A N A L Y S I S

8/12/2019 McCombs 2007 Valuation Presentation 103007
http://slidepdf.com/reader/full/mccombs-2007-valuation-presentation-103007 45/71
Fiscal year ending December 31,
2003 2004 2005 2006E 2007E 2008E 2009E 2010E
Net sales $400.0 $440.0 $484.0 $532.4 $585.6 $644.2 $708.6 $779.5
EBITDA 80.0 88.0 96.8 106.5 117.1 128.8 141.7 155.9
Less: Depreciation 12.0 13.2 14.5 16.0 17.6 19.3 21.3 23.4
EBITA 68.0 74.8 82.3 90.5 99.6 109.5 120.5 132.5
Less: Taxes at marginal rate 27.2 29.9 32.9 36.2 39.8 43.8 48.2 53.0
Tax-effected EBITA $40.8 $44.9 $49.4 $54.3 $59.7 $65.7 $72.3 $79.5
Plus: Depreciation 16.0 17.6 19.3 21.3 23.4
Plus: Deferred taxes – – – – –
Less: Capital expenditures 20.0 22.0 24.2 26.6 29.3
Less: Incr./(decr.) in working capital 10.0 8.5 7.0 5.5 4.0
Unlevered free cash flow $40.3 $46.8 $53.8 $61.4 $69.6
Adjustment for deal date (40.3) – – – –
Unlevered FCF to acquirer $0.0 $46.8 $53.8 $61.4 $69.6
Memo: Discounting factor 0.0 0.5 1.5 2.5 3.5
Discounted value of unlevered FCF $0.0 $44.6 $46.7 $48.4 $49.9
Discounted value of FCF 2007E–2010E 189.6
EBITDA in 2010E $155.9
Exit multiple 7.0x
Firm value at exit 1,091.3
Discounted terminal value 745.4
Total present value to acquirer $934.9
Stand-alone DCF analysis of Company X ($ millions)Stand-alone DCF analysis of Company X ($ millions)
EXAMPLE: Terminal multiple method
$745.4 =($155.9 * 7.0x)
(1+.10)4
Formula
Note: Key assumptions:Deal/valuation date = 12/31/06
Marginal tax rate = 40%Discount rate = 10%Exit multiple of EBITDA = 7.0x
Discountedcash flowanalysis
44 D I S C
O
U N T E D
C A S H F
L O
W
A N A L Y S I S

8/12/2019 McCombs 2007 Valuation Presentation 103007
http://slidepdf.com/reader/full/mccombs-2007-valuation-presentation-103007 46/71
A + B = C
Discounted
FCF
Discounted terminal value
at 2010E multiple of
Firm value at 2010E
EBITDA multiple of
Discount rate 2006-2010 6.0x 7.0x 8.0x 6.0x 7.0x 8.0x
8% $196.8 $687.5 $802.1 $916.7 $884.4 $999.0 $1,113.6
9% 193.1 662.6 773.1 883.5 855.8 966.2 1,076.7
10% 189.6 638.9 745.4 851.8 828.4 934.9 1,041.4
11% 186.1 616.2 718.9 821.6 802.3 904.9 1,007.6
12% 182.7 594.5 693.5 792.6 777.2 876.3 975.3
- D = E
Net debt
Equity value at 2010E
EBITDA multiple of
Equity value per share1 at
2010E EBITDA multiple of
Discount rate 12/31/06 6.0x 7.0x 8.0x 6.0x 7.0x 8.0x
8% $100.0 $784.4 $899.0 $1,013.6 $19.17 $21.97 $24.77
9% 100.0 755.8 866.2 976.7 $18.47 $21.17 $23.87
10% 100.0 728.4 834.9 941.4 $17.80 $20.41 $23.01
11% 100.0 702.3 804.9 907.6 $17.16 $19.67 $22.18
12% 100.0 677.2 776.3 875.3 $16.55 $18.97 $21.39
Stand-alone DCF analysis of Company X ($ millions, except per share data)Stand-alone DCF analysis of Company X ($ millions, except per share data)
EXAMPLE: Terminal multiple method (cont’d)
1 Based on 40.0 million basic shares outstanding and 2.0 million options with a weighted exercise price of $8.13 calculated using the treasury methodNote: DCF value as of 12/31/06 based on mid-year convention
Discountedcash flowanalysis
45 D I S C
O
U N T E D
C A S H F
L O
W
A N A L Y S I S

8/12/2019 McCombs 2007 Valuation Presentation 103007
http://slidepdf.com/reader/full/mccombs-2007-valuation-presentation-103007 47/71
G th i t it th d ( t’d) Discounted

8/12/2019 McCombs 2007 Valuation Presentation 103007
http://slidepdf.com/reader/full/mccombs-2007-valuation-presentation-103007 48/71
Note that when using the mid-year convention, terminal value is discounted as if cash flowsoccur in the middle of the final projection period
Here the growth-in-perpetuity method differs from the exit-multiple method
Typical adjustments to normalize free cash flow in Year n include revising the relationshipbetween revenues, EBIT and capital spending, which in turn affects CAPEX and depreciation
Working capital may also need to be adjusted
Often capex and depreciation are assumed to be equal
CommentsComments
Growth in perpetuity method (cont’d) Discountedcash flowanalysis
47 D I S C
O
U N T E D
C A S H F
L O
W
A N A L Y S I S
EXAMPLE G th i t it th d Discounted

8/12/2019 McCombs 2007 Valuation Presentation 103007
http://slidepdf.com/reader/full/mccombs-2007-valuation-presentation-103007 49/71
Fiscal year ending December 31,
2003 2004 2005 2006E 2007E 2008E 2009E 2010E
Net sales $400.0 $440.0 $484.0 $532.4 $585.6 $644.2 $708.6 $779.5
EBITDA 80.0 88.0 96.8 106.5 117.1 128.8 141.7 155.9
Less: Depreciation 12.0 13.2 14.5 16.0 17.6 19.3 21.3 23.4
EBITA 68.0 74.8 82.3 90.5 99.6 109.5 120.5 132.5
Less: Taxes at marginal rate 27.2 29.9 32.9 36.2 39.8 43.8 48.2 53.0
Tax-effected EBITA $40.8 $44.9 $49.4 $54.3 $59.7 $65.7 $72.3 $79.5
Plus: Depreciation 16.0 17.6 19.3 21.3 23.4
Plus: Deferred taxes – – – – –
Less: Capital expenditures 20.0 22.0 24.2 26.6 29.3
Less: Incr./(decr.) in working capital 10.0 8.5 7.0 5.5 4.0
Unlevered free cash flow 40.3 46.8 53.8 61.4 69.6
Adjustment for deal date (40.3) – – – –
Unlevered FCF to acquirer $0.0 $46.8 $53.8 $61.4 $69.6
Memo: Discounting factor 0.0 0.5 1.5 2.5 3.5
Discounted value of unlevered FCF $0.0 $44.6 $46.7 $48.4 $49.9
Discounted value of FCF 2007E–2010E 189.6
Value 2010E - Terminal Value 733.7
Total present value to acquirer $923.3
Stand-alone DCF analysis of Company X ($ millions)Stand-alone DCF analysis of Company X ($ millions)
EXAMPLE: Growth in perpetuity method
$733.7 =$69.6 * (1 + .03)
(.10-.03)*(1+.10)3.5
Formula
Note: Key assumptions:Deal/valuation date = 12/31/06Marginal tax rate = 40%Discount rate = 10%Perpetuity growth rate = 3%
Discountedcash flowanalysis
48 D I S C
O
U N T E D
C A S H
F L O
W
A N A L Y S I S
EXAMPLE: Growth in perpetuity method (cont’d) Discounted

8/12/2019 McCombs 2007 Valuation Presentation 103007
http://slidepdf.com/reader/full/mccombs-2007-valuation-presentation-103007 50/71
A + B = C
Discounted
FCF
Discounted terminal value
at perpetuity growth rate of
Firm value at perpetuity
growth rate of
Discount rate 2006-2010 2.5% 3.0% 3.5% 2.5% 3.0% 3.5%
8% $196.8 $991.0 $1,095.4 $1,223.0 $1,187.8 $1,292.2 $1,419.8
9% 193.1 811.9 883.8 968.9 1,005.0 1,077.0 1,162.0
10% 189.6 681.5 733.7 794.0 871.1 923.3 983.6
11% 186.1 582.6 622.0 666.7 768.7 808.1 852.8
12% 182.7 505.1 535.8 570.1 687.9 718.5 752.8
- D = E
Net debt
Equity value at perpetuity
growth rate of
Equity value per share1 at
perpetuity growth rate of
Discount rate 12/31/06 2.5% 3.0% 3.5% 2.5% 3.0% 3.5%
8% $100.0 $1,087.8 $1,192.2 $1,319.8 $26.59 $29.14 $32.26
9% 100.0 905.0 977.0 1,062.0 $22.12 $23.88 $25.96
10% 100.0 771.1 823.3 883.6 $18.84 $20.12 $21.59
11% 100.0 668.7 708.1 752.8 $16.34 $17.31 $18.40
12% 100.0 587.9 618.5 652.8 $14.37 $15.12 $15.95
Stand-alone DCF analysis of Company X ($ millions, except per share data)Stand-alone DCF analysis of Company X ($ millions, except per share data)
EXAMPLE: Growth in perpetuity method (cont’d)
1 Based on 40.0 million basic shares outstanding and 2.0 million options with a weighted exercise price of $8.13 calculated using the treasury methodNote: DCF value as of 12/31/06 based on mid-year convention
Discountedcash flowanalysis
49 D I S C
O
U N T E D
C A S H
F L O
W
A N A L Y S I S
Terminal multiples and perpetuity growth rates are often
considered side by side Discounted

8/12/2019 McCombs 2007 Valuation Presentation 103007
http://slidepdf.com/reader/full/mccombs-2007-valuation-presentation-103007 51/71
Assumptions regarding exit multiples are often checked for reasonableness by calculating thegrowth rates in perpetuity that they imply (and vice versa)
To go from the exit-multiple approach to an implied perpetuity growth rate:
g = [(WACC*terminal value) / (1+WACC)0.5 - FCFn] / [FCFn + (terminal value / (1 + WACC)0.5)]
To go from the growth-in-perpetuity approach to an implied exit multiple:
multiple = [FCFn * (1 + g)(1 + WACC)0.5] / [EBITDAn * (WACC - g)]
These formulas adjust for the different approaches to discounting terminal value when using
the mid-year convention
CommentsComments
considered side-by-side cash flowanalysis
50 D I S C
O
U N T E D
C A S H
F L O
W
A N A L Y S I S
Terminal multiple method and implied growth rates
Discounted
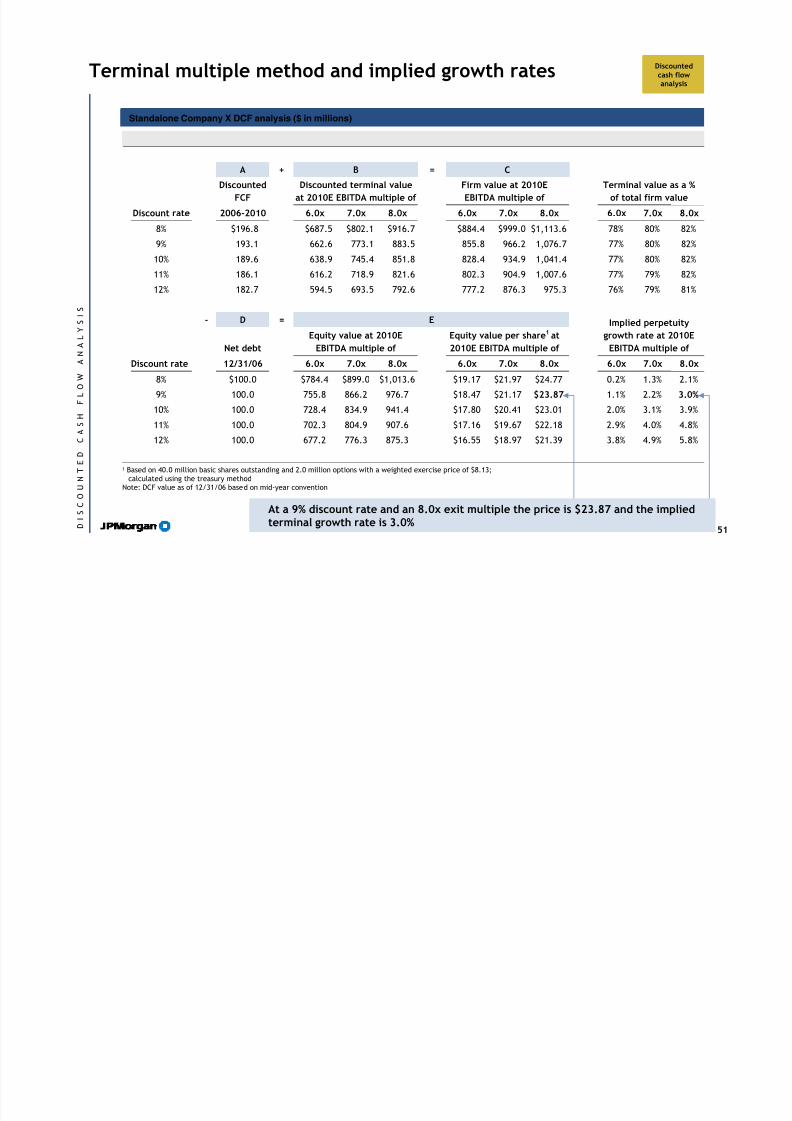
8/12/2019 McCombs 2007 Valuation Presentation 103007
http://slidepdf.com/reader/full/mccombs-2007-valuation-presentation-103007 52/71
A + B = C
Discounted
FCF
Discounted terminal value
at 2010E EBITDA multiple of
Firm value at 2010E
EBITDA multiple of
Terminal value as a %
of total firm value
Discount rate 2006-2010 6.0x 7.0x 8.0x 6.0x 7.0x 8.0x 6.0x 7.0x 8.0x
8% $196.8 $687.5 $802.1 $916.7 $884.4 $999.0 $1,113.6 78% 80% 82%
9% 193.1 662.6 773.1 883.5 855.8 966.2 1,076.7 77% 80% 82%
10% 189.6 638.9 745.4 851.8 828.4 934.9 1,041.4 77% 80% 82%
11% 186.1 616.2 718.9 821.6 802.3 904.9 1,007.6 77% 79% 82%
12% 182.7 594.5 693.5 792.6 777.2 876.3 975.3 76% 79% 81%
- D = E
Net debt
Equity value at 2010E
EBITDA multiple of
Equity value per share1 at
2010E EBITDA multiple of
Implied perpetuity
growth rate at 2010E
EBITDA multiple of
Discount rate 12/31/06 6.0x 7.0x 8.0x 6.0x 7.0x 8.0x 6.0x 7.0x 8.0x
8% $100.0 $784.4 $899.0 $1,013.6 $19.17 $21.97 $24.77 0.2% 1.3% 2.1%
9% 100.0 755.8 866.2 976.7 $18.47 $21.17 $23.87 1.1% 2.2% 3.0%
10% 100.0 728.4 834.9 941.4 $17.80 $20.41 $23.01 2.0% 3.1% 3.9%
11% 100.0 702.3 804.9 907.6 $17.16 $19.67 $22.18 2.9% 4.0% 4.8%
12% 100.0 677.2 776.3 875.3 $16.55 $18.97 $21.39 3.8% 4.9% 5.8%
Terminal multiple method and implied growth rates
1 Based on 40.0 million basic shares outstanding and 2.0 million options with a weighted exercise price of $8.13;calculated using the treasury method
Note: DCF value as of 12/31/06 based on mid-year convention
At a 9% discount rate and an 8.0x exit multiple the price is $23.87 and the impliedterminal growth rate is 3.0%
Standalone Company X DCF analysis ($ in millions)Standalone Company X DCF analysis ($ in millions)
cash flowanalysis
51 D I S C
O
U N T E D
C A S H
F L O
W
A N A L Y S I S
Perpetuity growth rate and implied terminal multiples
Discountedh l

8/12/2019 McCombs 2007 Valuation Presentation 103007
http://slidepdf.com/reader/full/mccombs-2007-valuation-presentation-103007 53/71
A + B = C
Discounted
FCF
Discounted terminal value
at perpetuity growth rate of
Firm value at perpetuity
growth rate of
Terminal value as a %
of total firm value
Discount rate 2006-2010 2.5% 3.0% 3.5% 2.5% 3.0% 3.5% 2.5% 3.0% 3.5%
8% $196.8 $991.0 $1,095.4 $1,223.0 $1,187.8 $1,292.2 $1,419.8 83% 85% 86%
9% 193.1 811.9 883.8 968.9 1,005.0 1,077.0 1,162.0 81% 82% 83%
10% 189.6 681.5 733.7 794.0 871.1 923.3 983.6 78% 79% 81%
11% 186.1 582.6 622.0 666.7 768.7 808.1 852.8 76% 77% 78%
12% 182.7 505.1 535.8 570.1 687.9 718.5 752.8 73% 75% 76%
- D = E
Net debt
Equity value at perpetuity
growth rate of
Equity value per share1 at
perpetuity growth rate of
Implied EBITDA exit
multiple at perpetuity
growth rate of
Discount rate 12/31/06 2.5% 3.0% 3.5% 2.5% 3.0% 3.5% 2.5% 3.0% 3.5%
8% $100.0 $1,087.8 $1,192.2 $1,319.8 $26.59 $29.14 $32.26 8.6x 9.6x 10.7x
9% 100.0 905.0 977.0 1,062.0 $22.12 $23.88 $25.96 7.4 8.0 8.8
10% 100.0 771.1 823.3 883.6 $18.84 $20.12 $21.59 6.4 6.9 7.5
11% 100.0 668.7 708.1 752.8 $16.34 $17.31 $18.40 5.7 6.1 6.5
12% 100.0 587.9 618.5 652.8 $14.37 $15.12 $15.95 5.1 5.4 5.8
Perpetuity growth rate and implied terminal multiples
1 Based on 40.0 million basic shares outstanding and 2.0 million options with a weighted exercise price of $8.13;calculated using the treasury method
Note: DCF value as of 12/31/06 based on mid-year convention
At a 9% discount rate and terminal growth rate of 3.0%, the price is $23.88 and theimplied EBITDA exit multiple is 8.0x
Standalone Company X DCF analysis ($ in millions)Standalone Company X DCF analysis ($ in millions)
cash flowanalysis
52 D I S C
O
U N T E D
C A S H
F L O
W
A N A L Y S I S
Choosing the discount rate is a critical step in DCF analysis Discountedh fl

8/12/2019 McCombs 2007 Valuation Presentation 103007
http://slidepdf.com/reader/full/mccombs-2007-valuation-presentation-103007 54/71
The discount rate represents the required rate of return given the risks inherent in the business,its industry, and thus the uncertainty regarding its future cash flows, as well as its optimalcapital structure
Typically the weighted average cost of capital (WACC) will be used as a foundation for settingthe discount rate
The WACC is always forward-looking and is predicted based on the expectations of aninvestment's future performance; an investor contributes capital with the expectation that theriskiness of cash flows will be offset by an appropriate return
The WACC is typically estimated by studying capital costs for existing investment opportunitiesthat are similar in nature and risk to the one being analyzed
The WACC is related to the risk of the investment, not the risk or creditworthiness of theinvestor¹
CommentsComments
Choosing the discount rate is a critical step in DCF analysis
1 In valuing a company, always use the riskiness of its cash flows or comparable companies in estimating a weighted average cost of capital. Never use the acquirer’scost capital unless, by some chance, it is engaged in an extremely similar line of business. However, if a business is small relative to an acquirer's, sometimes ti maybe appropriate to consider the use of the acquirer's WACC in performing the valuation. The additional value created by using the acquirer's WACC can be viewed as a
synergy to the acquirer in the context of the transaction.
cash flowanalysis
53 D I S C
O
U N T E D
C A S H
F L O
W
A N A L Y S I S
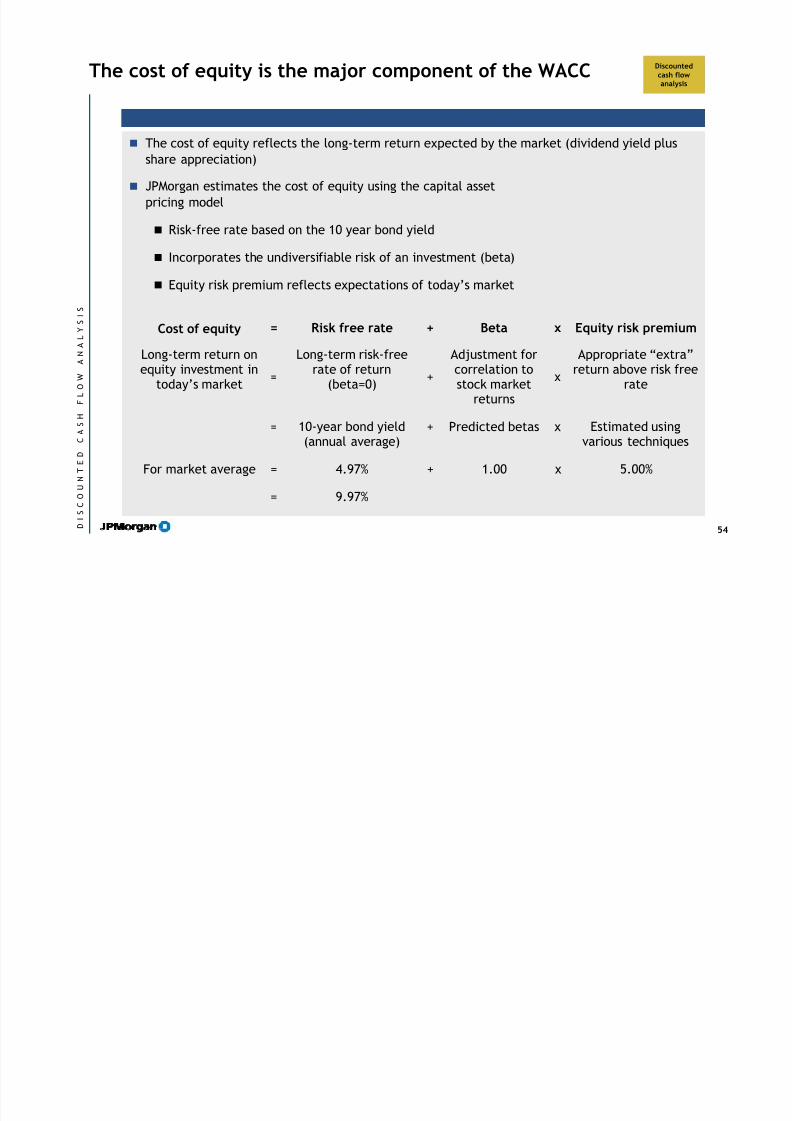
The cost of equity is the major component of the WACC Discountedcash flow
8/12/2019 McCombs 2007 Valuation Presentation 103007
http://slidepdf.com/reader/full/mccombs-2007-valuation-presentation-103007 55/71
The cost of equity reflects the long-term return expected by the market (dividend yield plusshare appreciation)
JPMorgan estimates the cost of equity using the capital assetpricing model
Risk-free rate based on the 10 year bond yield
Incorporates the undiversifiable risk of an investment (beta)
Equity risk premium reflects expectations of today’s market
The cost of equity is the major component of the WACC
Cost of equity = Risk free rate + Beta x Equity risk premium
Long-term return onequity investment in
today’s market=
Long-term risk-freerate of return
(beta=0)+
Adjustment forcorrelation tostock market
returns
x
Appropriate “extra”return above risk free
rate
= 10-year bond yield(annual average)
+ Predicted betas x Estimated usingvarious techniques
For market average = 4.97% + 1.00 x 5.00%
= 9.97%
cash flowanalysis
54 D I S C
O
U N T E D
C A S H
F L O
W
A N A L Y S I S
The cost of equity and debt are blended together based
on a target capital structure
Discountedcash flow

8/12/2019 McCombs 2007 Valuation Presentation 103007
http://slidepdf.com/reader/full/mccombs-2007-valuation-presentation-103007 56/71
The target capital structure reflects the company’s rating objective
Firms generally try to minimize the cost of capital through the appropriate use of leverage
The percentage weighting of debt and equity is usually based on the market value of a firm’s equity and debtposition
Most firms are at their target capital structure
Adjustments should be made for seasonal or cyclical swings, as well as for firms moving toward a target
Using a weighted average cost of capital assumes that all investments are funded with the same mix of equityand debt as the target capital structure
CommentsComments
Cost of equity Cost of debtCost of capital10-year T-bond (Avg) 4.97%
Market risk premium 5.00%(x) Beta (current predicted) 0.62Adjusted market premium 3.10%
Cost of equity = 8.07%
Cost of debt 6.25%
(-) Tax shield1 2.19%
After-tax cost of debt 4.06%
on a target capital structure
Target capital structure(Assumes current = optimal)
Debt/total capital = 6.1%
Nominal WACC = 7.82%1 Assumes 35% marginal tax rate
WACC = rd * [D *(1-T)] + re * ED+E D+E Where:
E = Market value of equityD = Market value of debt
T = Marginal tax ratere = Return on equityrd = Return on debt
WACC formula
Illustrative Weighted Average Cost of Capital calculationIllustrative Weighted Average Cost of Capital calculation
cash flowanalysis
55 D I S C
O
U N T E D
C A S H
F L O
W
A N A L Y S I S
The appropriate cost of capital will depend on the entity
which is being valued
Discountedcash flow

8/12/2019 McCombs 2007 Valuation Presentation 103007
http://slidepdf.com/reader/full/mccombs-2007-valuation-presentation-103007 57/71
g
Note: Assumes 35% marginal tax rate1 Assuming an equity risk premium of 6.5%2 Assuming an equity risk premium of 7.5%
Debt/equity
10% 20% 30% 40%
0.65 7.8% 7.5% 7.3% 7.0%
0.70 8.1% 7.7% 7.5% 7.2%
0.75 8.3% 7.9% 7.7% 7.4%
0.80 8.5% 8.2% 7.8% 7.6% L e v e r e d
b e t a
0.85 8.8% 8.4% 8.0% 7.8%
WACC sensitivityWACC sensitivity
Debt/equity
10% 20% 30% 40%
0.70 9.1% 8.7% 8.4% 8.2%
0.75 9.4% 9.0% 8.7% 8.4%
0.80 9.7% 9.3% 8.9% 8.7%
0.85 10.0% 9.6% 9.2% 8.9% L e v e r e d
b e t a
0.90 10.3% 9.8% 9.4% 9.1%
$1 billion target WACC sensitivity1$1 billion target WACC sensitivity1
Debt/equity
10% 20% 30% 40%
0.70 9.8% 9.4% 9.1% 8.9%
0.75 10.1% 9.8% 9.4% 9.1%
0.80 10.5% 10.1% 9.7% 9.4%
0.85 10.8% 10.4% 10.0% 9.7% L e v e r e d
b e t a
0.90 11.2% 10.7% 10.3% 10.0%
$200 million target WACC sensitivity2$200 million target WACC sensitivity2
For illustrative purposesFor illustrative purposes
CompanyRisk
premiumUnlevered
betaOptimal
debt/equityRe-levered
betaCost ofequity
Cost offinancing WACC
$1 billion target 5.0% - 6.5% 0.70 20% 0.80 9.0% - 10.3% 6.25% - 7.50% 8.3% - 9.3%
$500 million target 5.0% - 7.0% 0.70 20% 0.80 9.0% - 10.6% 6.25% - 8.00% 8.4% - 9.7%
$200 million target 5.0% - 7.5% 0.70 20% 0.80 9.0% - 11.0% 6.25% - 8.50% 8.4% - 10.1%
analysis
56 D I S C
O
U N T E D
C A S H
F L O
W
A N A L Y S I S
Most common errors in calculating WACC
Discountedcash flow

8/12/2019 McCombs 2007 Valuation Presentation 103007
http://slidepdf.com/reader/full/mccombs-2007-valuation-presentation-103007 58/71
Equity risk premium based on very long time frame (post 1926: Ibbotson data)
Substitute hurdle rate (goal) for cost of capital
Use of historical (or predicted) betas that are clearly wrong
Investment specific risk not fully incorporated (e.g., country risk premiums)
Incorrect releveraging of the cost of equity
Cost of equity based on book returns, not market expectations
Cost of equityCost of equity
g
The actual, not target, capital structure is used
WACC calculated based on book weights
Target capital structureTarget capital structure
analysis
57 D I S C
O
U N T E D
C A S H
F L O
W
A N A L Y S I S
EXAMPLE: DCF output
Discountedcash flow

8/12/2019 McCombs 2007 Valuation Presentation 103007
http://slidepdf.com/reader/full/mccombs-2007-valuation-presentation-103007 59/71
p
Projected FY ending March 31,LTMSept 30, 2006 2007 2008 2009 2010 2011
Sales $803.5 $900.0 $1,000.0 $1,030.0 $1,060.9 $1,092.7
EBITDA 55.1 63.0 75.0 77.3 79.6 82.0
% EBITDA Margin 6.9% 7.0% 7.5% 7.5% 7.5% 7.5%
Less: depreciation & amortization 17.8 20.5 21.8 23.1 24.5 25.9EBIT 37.3 42.5 53.2 54.1 55.1 56.1
Less: taxes @ 38.0% 14.2 16.1 20.2 20.6 20.9 21.3
EBIAT $23.1 $26.3 $33.0 $33.6 $34.2 $34.8
Plus: depreciation & amortization $20.5 $21.8 $23.1 $24.5 $25.9
Less: capital expenditures 8.8 9.0 9.3 9.5 9.8
Less: Incr./(decr.) in working capital 8.1 8.8 2.6 2.7 2.8
Unlevered free cash flow $30.0 $37.0 $44.8 $46.4 $48.1
Summary financials ($ in millions)Summary financials ($ in millions)
Source: Historical information from 10-K dated 3/31/06 and 10Q dated 9/30/06; Projections are Illustrative JPMorgan estimates, assumes revenue of $900 million for FYE3/31/07, $1 billion for FYE 3/31/08, 3% revenue growth thereafter, and constant EBITDA margins after FYE 3/31/08
Firm value atperpetuity growth
rate of
0.0% 1.0% 2.0%
10.00% $474 $512 $560
10.50% $451 $485 $527
D i s c o u n t
R a t e
11.00% $430 $461 $498
Implied EBITDA exit multipleImplied EBITDA exit multipleFirm value ($ in millions)Firm value ($ in millions)
Implied 2011 EBITDAmultiple at perpetuity
growth rate of
0.0% 1.0% 2.0%
10.00% 6.2x 6.9x 7.8x
10.50% 5.9x 6.6x 7.4x
D i s c o u n t
R a t e
11.00% 5.6x 6.2x 7.0x
Implied stock price atperpetuity growth
rate of
0.0% 1.0% 2.0%
10.00% $31.28 $34.49 $38.52
10.50% $29.36 $32.22 $35.75
D i s c o u n t
R a t e
11.00% $27.62 $30.17 $33.29
Implied equity value per shareImplied equity value per share
analysis
58 D I S C
O
U N T E D
C A S H
F L O
W
A N A L Y S I S
Agenda

8/12/2019 McCombs 2007 Valuation Presentation 103007
http://slidepdf.com/reader/full/mccombs-2007-valuation-presentation-103007 60/71
LBO analysis
Discounted cash flow analysis
Transaction comparables
Trading comparables
Introduction
59
1
6
20
31
59
M
& A
V A L U A T I O
N
O V
E R V I E W
Valuation methodologies

8/12/2019 McCombs 2007 Valuation Presentation 103007
http://slidepdf.com/reader/full/mccombs-2007-valuation-presentation-103007 61/71
Publicly traded
comparablecompanies analysis
Comparable
transactionsanalysis
Valuationmethodologies
Discounted
cash flowanalysis
Leveraged
buyout/recapanalysis
Other
“Public Market
Valuation”
Value based on
market trading
multiples ofcomparable
companies
Applied using
historical and
prospective
multiples
Does not include a
control premium
“Private Market
Valuation”
Value based on
multiples paid for
comparablecompanies in sale
transactions
Includes control
premium
“Intrinsic” value
of business
Present value of
projected free
cash flows
Incorporates both
short-term and
long-term
expected
performance
Risk in cash flowsand capital
structure captured
in discount rate
Value to a
financial/LBO
buyer
Value based on
debt repaymentand return on
equity investment
Liquidation
analysis
Break-up analysis
Historical tradingperformance
Expected IPO
valuation
EPS impact
Dividend discount
model
60 L B O
A N A L Y S I S
8/12/2019 McCombs 2007 Valuation Presentation 103007
http://slidepdf.com/reader/full/mccombs-2007-valuation-presentation-103007 62/71
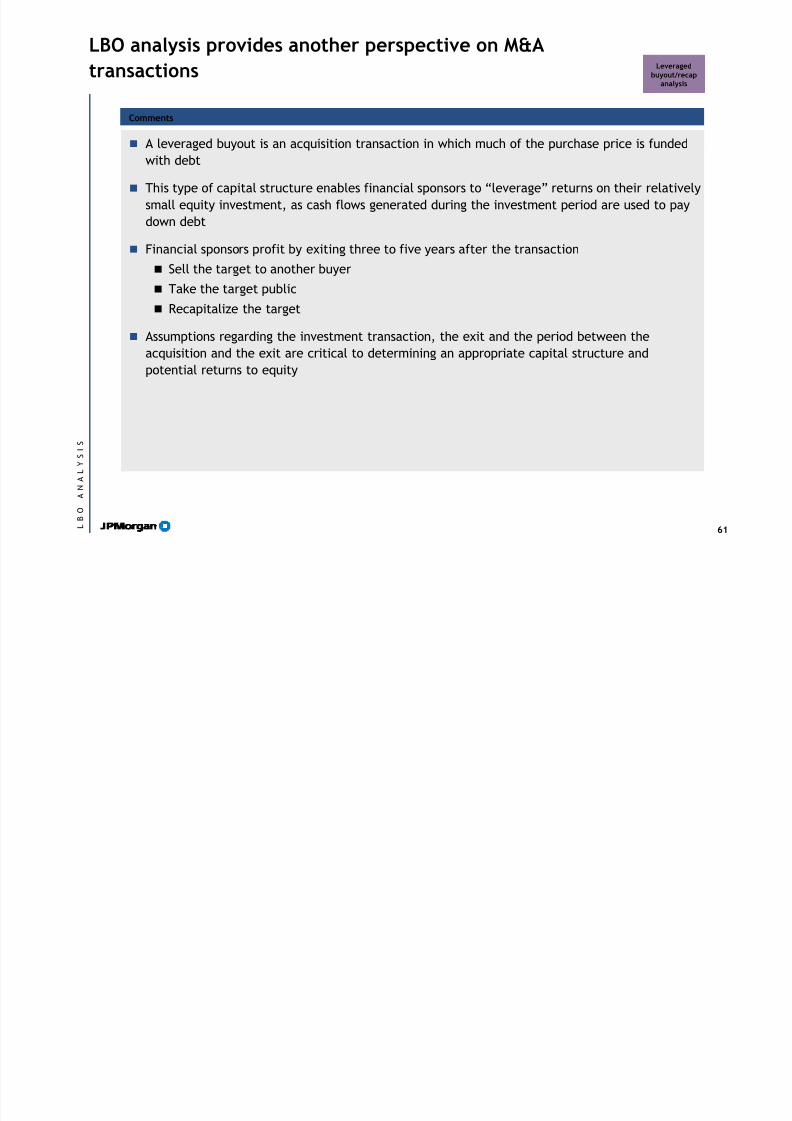
The process of LBO analysis Leveragedbuyout/recap
analysis

8/12/2019 McCombs 2007 Valuation Presentation 103007
http://slidepdf.com/reader/full/mccombs-2007-valuation-presentation-103007 63/71
a alys s
Develop an integrated model of the business that projects EBITDA andcash available for debt repayment over the investment horizon(typically 3–5 years)
Estimate the multiple at which the sponsor can be expected to exit theinvestment at the end of the investment period
Determine a transaction structure and a pro forma capital structure thatresult in realistic financial coverage
Calculate returns (IRR) to the equity sponsor
Tweak the transaction/capital structure as needed to achieve harmony(if possible) between IRR, leverage and valuation
Projections/FCF
Terminal value
Discount rate
Present value
Adjustments
Process overviewProcess overview
62 L B O
A N A L Y S I S
The initial steps in an LBO analysis are identical to those
in a DCF analysis
Leveragedbuyout/recap
analysis

8/12/2019 McCombs 2007 Valuation Presentation 103007
http://slidepdf.com/reader/full/mccombs-2007-valuation-presentation-103007 64/71
CommentsComments
The same financial projections developed for a DCF analysis can be used to build a basic LBO
model
Free cash flows are expected to be used to service debt, with positive flows to equity typically
coming at exit Amount and predictability of free cash flows dictate whether a company is an attractive or
viable LBO target
Cash flows are not discounted
Terminal value drives valuation, and is calculated on the basis of multiples
Multiple of exit-year EBITDA is generally used to bound the valuation of the enterprise in
any possible exit scenario
y
63 L B O
A N A L Y S I S
Pro forma capitalization and transaction structure are set
forth in “sources & uses”
Leveragedbuyout/recap
analysis

8/12/2019 McCombs 2007 Valuation Presentation 103007
http://slidepdf.com/reader/full/mccombs-2007-valuation-presentation-103007 65/71
Sources and usesSources and uses
Sources should show the entire pro forma capitalization of the company, including:
New debt
New equity
Rolled-over debt and equity
Uses of funds should address all parts of the target’s existing capital structure, as well as
transaction-related leakage:
Refinancing existing debt
Transaction expenses
Equity purchase price Debt and equity to be rolled-over
Sources must equal uses
Any debt or equity that is rolled-over shows up under both sources and uses
Always depict every part of the capitalization, whether it changes pro forma or not
64 L B O
A N A L Y S I S
LBO models are driven by the characteristics of the
sources of capital for the transaction
Leveragedbuyout/recap
analysis

8/12/2019 McCombs 2007 Valuation Presentation 103007
http://slidepdf.com/reader/full/mccombs-2007-valuation-presentation-103007 66/71
Typically supplied by an investment or commercial bank
Usually secured / most restrictive covenants
Amortizing 5- to 8-year tenor
First in line at liquidation
Lowest coupon
Typically supplied by an investment/commercial bank or mezzanine fund
Riskier debt / typically unsecured
Primarily bullet structures
Typical tenor is 10-year
High coupon
Typically supplied by an investment or commercial bank or a mezzaninefund (often sponsor-affiliated)
Multiple forms: Convertible debt, exchangeable debt, convertiblepreferred stock, PIK securities and warrants
Expected IRR in the 15%– 20% range
Typically supplied by a financial sponsor
Highest risk / cost of capital
Sometimes “stapled” to high-yield paper to attract broader investorgroup
Minimum annual returns >20%
Mezzanine securities
Subordinated debt
Common equity
Senior debt
• Revolving• Term
• 30%–50% of totalcapital
• LIBOR + 200-400• 5–8 years
• Senior/sub notes• Discount notes
• 25%–35% of totalcapital
• T + 350–650
• 7–10 years
• Sub. debt(conv.)
• Preferred stock• PIK• Warrants
• 0%–35% total capital• High teens/low 20s• 7–10+ years
• 20%–40% of totalcapital
• 20%-30% IRR•
5–7 year horizon
Sample inputs
Sample inputs
Sample inputs
Sample inputs
Components of capitalComponents of capital
65 L B O
A N A L Y S I S
Internal rate of return (IRR) is the key return benchmark
utilized by financial investors
Leveragedbuyout/recap
analysis

8/12/2019 McCombs 2007 Valuation Presentation 103007
http://slidepdf.com/reader/full/mccombs-2007-valuation-presentation-103007 67/71
Importance of IRR Importance of IRR
IRR represents the implied discount rate at which the net present value of cash flows equals
zero
The math underlying IRR is highly complex
Excel and financial calculators effectively back into IRR by narrowing a series of guesses at
the appropriate rate
When calculating IRR, cash outflows (e.g., initial investment) are always negative, and cash
inflows (e.g., exit proceeds) are always positive
Keep in mind that there may be cash flows to the sponsor prior to exit
These flows must be factored into the calculation of IRR in the period in which they are
received
Remember that equity sits at the bottom of the capital structure
Debt must be paid-off or refinanced for holders of equity to receive any return on their
investment
IRR is also driven by the investor’s pro forma equity ownership percentage
Three important factors drive IRRs:
De-levering
Operating improvement
Multiple expansion (arbitrage)
66 L B O
A N A L Y S I S
Together, IRR & credit ratios serve as gauges of the
transaction structure’s viability
Leveragedbuyout/recap
analysis

8/12/2019 McCombs 2007 Valuation Presentation 103007
http://slidepdf.com/reader/full/mccombs-2007-valuation-presentation-103007 68/71
Transaction parametersTransaction parameters
Key credit ratios include:
Total debt to EBITDA
Senior debt to EBITDA
EBITDA to total interest
EBITDA less capital expenditures to total interest
Both providers of debt and equity have minimum requirements for participating in a transaction
Debt covenants typically require periodic certification of financial ratios
Equity sponsors generally will not invest without comfort as to likely returns
67 L B O
A N A L Y S I S
IRR drivers Leveragedbuyout/recap
analysis

8/12/2019 McCombs 2007 Valuation Presentation 103007
http://slidepdf.com/reader/full/mccombs-2007-valuation-presentation-103007 69/71
At purchase
No operatingimprovement and
no arbitrage
Operatingimprovement and
no arbitrage
Operatingimprovement and
arbitrage
EBITDA purchase multiple 7.0x
EBITDA on purchase date $100
Firm value at purchase date 700Debt at purchase (5x EBITDA) 500
Equity value invested 200
EBITDA exit multiple 7.0x 7.0x 8.0x
EBITDA at exit $100 $128 $128
Firm value at exit 700 896 1,024
Debt (after paydown of $75 per year) 125 125 125
Equity value at exit 575 771 899
IRR (5-year exit) 23.5% 31.0% 35.1%
Three important factors drive IRRs: 1) De-levering 2) Operating improvement and 3) Multiple expansion (arbitrage)Three important factors drive IRRs: 1) De-levering 2) Operating improvement and 3) Multiple expansion (arbitrage)
68 L B O
A N A L Y S I S
EXAMPLE: Required capital output
Leveragedbuyout/recap
analysis

8/12/2019 McCombs 2007 Valuation Presentation 103007
http://slidepdf.com/reader/full/mccombs-2007-valuation-presentation-103007 70/71
Share price $18.44 $20.28 $22.13 $23.97 $25.82
Diluted shares outstanding 5.8 5.9 5.9 6.0 6.0
Equity value $107.5 $119.3 $131.1 $143.0 $154.8
Plus: net debt $26.4 $26.4 $26.4 $26.4 $26.4
Enterprise value $133.9 $145.7 $157.5 $169.4 $181.2
2006E base case EBITDA $21.3 $21.3 $21.3 $21.3 $21.3
Sources of capital:
Debt capacity at total debt / EBITDA limit of:
2.50x $53.2 $53.2 $53.2 $53.2 $53.2
2.75x $58.5 $58.5 $58.5 $58.5 $58.5
3.00x$63.9 $63.9 $63.9 $63.9 $63.9
Management ownership at total debt / EBITDA of:
2.50x debt 51.1% 49.8% 48.9% 48.1% 47.4%
2.75x debt 54.4% 52.7% 51.4% 50.3% 49.4%
3.00x debt 58.1% 55.9% 54.1% 52.7% 51.6%
($ in millions, except share amounts)($ in millions, except share amounts)
Sources of fundsSources of funds Uses of fundsUses of funds
New senior debt $31.9
New subordinated debt $26.6
Rolled equity (Management) $59.4
New equity $57.1
TOTAL SOURCES $175.0
Acquire common stock $143.0
Refinance existing debt $27.4
Fees $4.7
TOTAL USES $175.0
69 L B O
A N A L Y S I S
EXAMPLE: LBO analysis output
Leveragedbuyout/recap
analysis
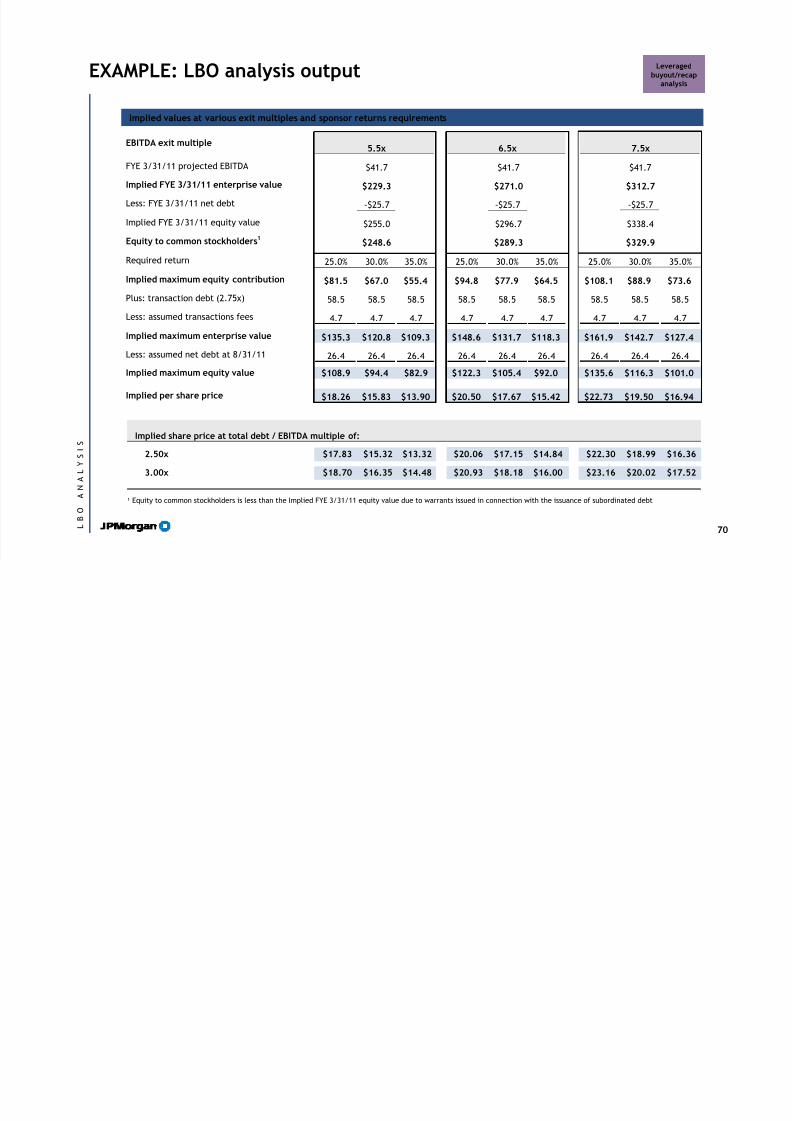
8/12/2019 McCombs 2007 Valuation Presentation 103007
http://slidepdf.com/reader/full/mccombs-2007-valuation-presentation-103007 71/71
Implied values at various exit multiples and sponsor returns requirementsImplied values at various exit multiples and sponsor returns requirements
EBITDA exit multiple5.5x 6.5x 7.5x
FYE 3/31/11 projected EBITDA $41.7 $41.7 $41.7
Implied FYE 3/31/11 enterprise value $229.3 $271.0 $312.7
Less: FYE 3/31/11 net debt -$25.7 -$25.7 -$25.7
Implied FYE 3/31/11 equity value $255.0 $296.7 $338.4
Equity to common stockholders1 $248.6 $289.3 $329.9
Required return 25.0% 30.0% 35.0% 25.0% 30.0% 35.0% 25.0% 30.0% 35.0%
Implied maximum equity contribution $81.5 $67.0 $55.4 $94.8 $77.9 $64.5 $108.1 $88.9 $73.6
Plus: transaction debt (2.75x) 58.5 58.5 58.5 58.5 58.5 58.5 58.5 58.5 58.5
Less: assumed transactions fees 4.7 4.7 4.7 4.7 4.7 4.7 4.7 4.7 4.7
Implied maximum enterprise value $135.3 $120.8 $109.3 $148.6 $131.7 $118.3 $161.9 $142.7 $127.4
Less: assumed net debt at 8/31/11 26.4 26.4 26.4 26.4 26.4 26.4 26.4 26.4 26.4
Implied maximum equity value $108.9 $94.4 $82.9 $122.3 $105.4 $92.0 $135.6 $116.3 $101.0
Implied per share price $18.26 $15.83 $13.90 $20.50 $17.67 $15.42 $22.73 $19.50 $16.94
1 Equity to common stockholders is less than the Implied FYE 3/31/11 equity value due to warrants issued in connection with the issuance of subordinated debt
Implied share price at total debt / EBITDA multiple of:
2.50x $17.83 $15.32 $13.32 $20.06 $17.15 $14.84 $22.30 $18.99 $16.36
3.00x $18.70 $16.35 $14.48 $20.93 $18.18 $16.00 $23.16 $20.02 $17.52
70 L B O
A N A L Y S I S