mbs market strategies - the baker group · 1700 io grande suite 120 austin, tx (888) 480-0301...
TRANSCRIPT

Oklahoma City, OK | Atlanta, GA | Austin, TX | Indianapolis, IN | Salt Lake City, UT | Springfield, IL | www.GoBaker.comThe Baker Group | 1601 Northwest Expressway, 20th Floor | Oklahoma City, OK 73118 | 800.937.2257 | Member FINRA and SIPC
MBS Market Strategies
April 2016 Page 1
Drew SimmonsVice President
[email protected](866) 214-1153
April 2016 - Agency MBS Prepayments
Financial Strategies Group
The Baker Group LP | Headquarters1601 NW Expressway, 20th Floor
Oklahoma City, OK 73118(800) 937-2257
Austin, TX1700 Rio Grande, Suite 120
Austin, TX 78701(888) 480-0301
Springfield, IL 901 Community Drive
Springfield, IL 62703(888) 333-7704
Indianapolis, IN 8365 Keystone Crossing, Suite 100
Indianapolis, IN(866) 370-3580
Salt Lake City, UT2975 West Executive Pkwy, Suite 139
Lehi, UT 84043(800) 288-9411
Contact Information
www.GoBaker.com
Atlanta, GA 2300 Windy Ridge Parkway, Suite 76
Atlanta, GA 30339(800) 937-2257
• Speeds in March increased 19%-50% month-over-month, led by 30yr Fannie and Freddie issued pools
• Prints were the fastest since last June, the result of a higher day count, increased refi activity, lower rates and about 20% more home purchase activity
• Both Fannie and Freddie 30yr pools increased about 5 CPR on the month to 15.6, a 49% and 50% increase respectively
• Fannie 20yrs added 3.6 CPR to 12.4 (+40%) and Freddie 20yrs increased 3.4 CPR to 12.2 (+38%)
• Within 15yr terms, Fannies were up 2.7 CPR to 11.4 (+31%) with Freddies adding 2.7 CPR to 11.1 (+32%)
• Ten-year terms had a more modest increase with Fannies up 2.1 CPR to 13.2 (+19%) and Freddies increasing 2.3 CPR to 12.4 (+22%)
• The biggest increases in government paper came from Ginnie II 30yrs which added 5.5 CPR to 19.7 (+39%) while Ginnie I 30yrs increased 3.3 CPR to 19.4 (+21%)
• Ginnie II 15yrs increased 2.9 CPR to 13.3 (+28%) and Ginnie I 15yrs added 2.6 CPR to 14.6 (+22%)
• From a collateral perspective, the 2014 vintage had the fastest speeds in March, especially in higher loan balance pools. The average loan size from the MBA’s refinance index reached an all-time high of $342K in February and remains well above the 5yr average of $230K
MBA Refinance Index - Average Loan Size

April 2016 Page 2
Oklahoma City, OK | Atlanta, GA | Austin, TX | Indianapolis, IN | Salt Lake City, UT | Springfield, IL | www.GoBaker.comThe Baker Group | 1601 Northwest Expressway, 20th Floor | Oklahoma City, OK 73118 | 800.937.2257 | Member FINRA and SIPC
MBS Market Strategies
March SpeedsThe biggest month-over-month increase in the coupon stack came from 30yr 3.5s with Fannies increasing 84% to 14.4 and Freddies up 96% to 14.6. This was followed by 20yr 3s which showed a 60% increase for Fannies to 10 CPR and a 72% increase for Freddies to 9.3 CPR. This time last year, jumbos printed some of the fastest speeds on record, nearing 60 CPR on some vintages. Last month, jumbos led the increase in specified pools with 2014 3.5s nearing 40 CPR. While speeds across the board experienced a notable jump, the increase wasn’t all that surprising. The higher day count by 3 days increased speeds by 15% and it’s fairly typical to see an increase in home purchases in March. The best protected collateral from faster prints came from shorter term, high coupon, low loan balance collateral.
Apr-15 May-15 Jun-15 Jul-15 Aug-15 Sep-15 Oct-15 Nov-15 Dec-15 Jan-16 Feb-16 Mar-16FNMA 16.6 15.9 16.3 14.4 12.8 12.6 12.6 10.9 12.4 9.5 10.5 15.6FHLMC 16.9 16.5 16.6 14.7 13.1 12.6 12.7 10.9 12.1 9.7 10.4 15.6GNMA I 20.8 20.3 22 20.6 19.5 19.1 18.2 16 17.6 15.5 16 19.4GNMA II 23.8 21.6 21.9 18.6 17 17.1 15.8 13.7 15.6 13.3 14.2 19.7
0
5
10
15
20
25
1-mo CPR
30-Year Fixed MBS Historical Prepayment Speeds
Apr-15 May-15 Jun-15 Jul-15 Aug-15 Sep-15 Oct-15 Nov-15 Dec-15 Jan-16 Feb-16 Mar-16
FNMA 12.7 12.7 13.3 12.1 11 10.5 11 9.4 10.5 8.3 8.8 12.4FHLMC 13.1 13 13.7 12.6 11.1 10.6 10.8 9.6 10.4 8.2 8.8 12.2
0
2
4
6
8
10
12
14
16
1-mo CPR
20-Year Fixed MBS Historical Prepayment Speeds
Apr-15 May-15 Jun-15 Jul-15 Aug-15 Sep-15 Oct-15 Nov-15 Dec-15 Jan-16 Feb-16 Mar-16FNMA 11.6 11.6 12.4 11.8 10.8 10.2 10.3 8.9 10.2 8.4 8.7 11.4FHLMC 11.7 11.6 12.4 11.6 10.8 10.3 10 8.9 10.1 8.4 8.5 11.1GNMA I 14.5 14.9 16.2 16.8 15 14.8 14.4 12.5 13.5 12.3 12 14.6GNMA II 13.9 13.2 14.3 14.2 12.4 12.4 12.3 10.2 11.6 9.5 10.4 13.3
0
2
4
6
8
10
12
14
16
18
20
1-mo CPR
15-Year Fixed MBS Historical Prepayment Speeds
Apr-15 May-15 Jun-15 Jul-15 Aug-15 Sep-15 Oct-15 Nov-15 Dec-15 Jan-16 Feb-16 Mar-16
FNMA 12.4 12.5 13.7 13.5 12.5 12.2 12.3 10.8 12.3 11 11.1 13.2FHLMC 12.3 12.7 12.8 13.4 12 12 11 10.5 11.5 10.4 10.1 12.4
0
2
4
6
8
10
12
14
16
1-mo CPR
10-Year Fixed MBS Historical Prepayment Speeds
0
5
10
15
20
25
2.5 3 3.5 4 4.5 5 5.5
15-Year by Issuer
FNMA FHLMC GNMA I GNMA II
0
5
10
15
20
25
30
3.0 3.5 4.0 4.5 5.0 5.5 6.0
30-Year by Issuer
FNMA FHLMC GNMA I GNMA II
April 2016 Page 3
Oklahoma City, OK | Atlanta, GA | Austin, TX | Indianapolis, IN | Salt Lake City, UT | Springfield, IL | www.GoBaker.comThe Baker Group | 1601 Northwest Expressway, 20th Floor | Oklahoma City, OK 73118 | 800.937.2257 | Member FINRA and SIPC
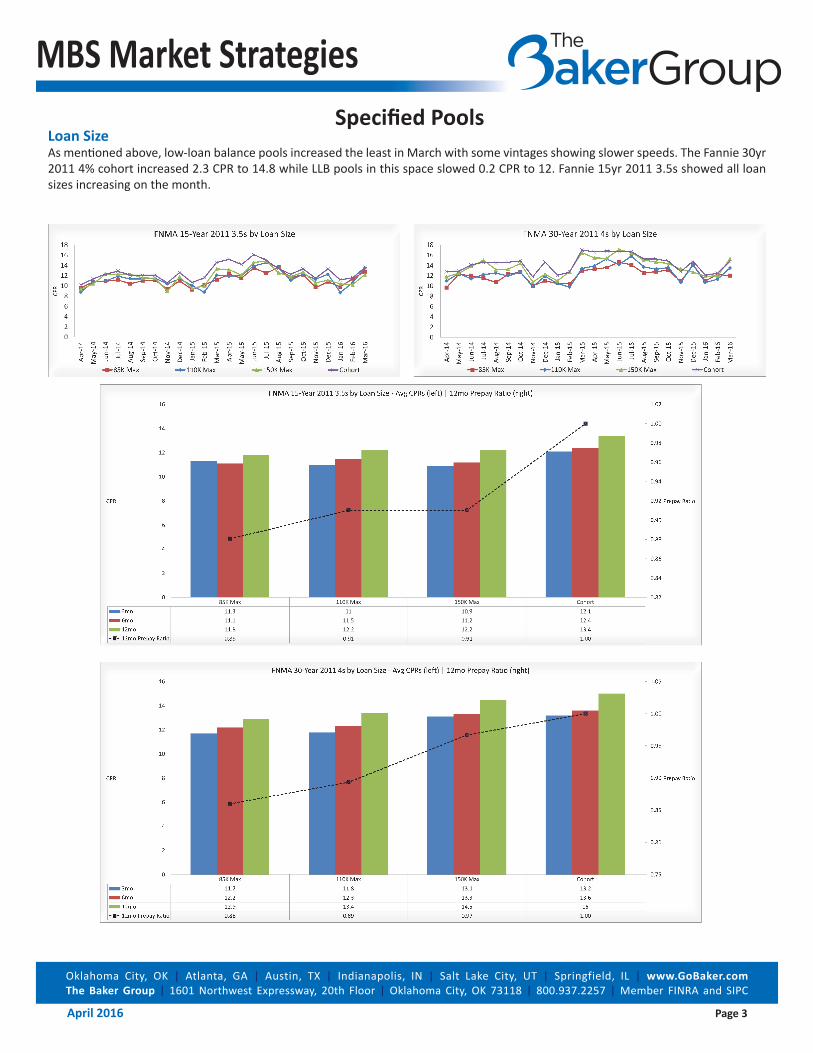
MBS Market Strategies Specified Pools
Loan SizeAs mentioned above, low-loan balance pools increased the least in March with some vintages showing slower speeds. The Fannie 30yr 2011 4% cohort increased 2.3 CPR to 14.8 while LLB pools in this space slowed 0.2 CPR to 12. Fannie 15yr 2011 3.5s showed all loan sizes increasing on the month.
02468
1012141618
Apr-
14
May
-14
Jun-
14
Jul-1
4
Aug-
14
Sep-
14
Oct
-14
Nov
-14
Dec-
14
Jan-
15
Feb-
15
Mar
-15
Apr-
15
May
-15
Jun-
15
Jul-1
5
Aug-
15
Sep-
15
Oct
-15
Nov
-15
Dec-
15
Jan-
16
Feb-
16
Mar
-16
CPR
FNMA 15-Year 2011 3.5s by Loan Size
85K Max 110K Max 150K Max Cohort
02468
1012141618
Apr-
14
May
-14
Jun-
14
Jul-1
4
Aug-
14
Sep-
14
Oct
-14
Nov
-14
Dec-
14
Jan-
15
Feb-
15
Mar
-15
Apr-
15
May
-15
Jun-
15
Jul-1
5
Aug-
15
Sep-
15
Oct
-15
Nov
-15
Dec-
15
Jan-
16
Feb-
16
Mar
-16
CPR
FNMA 30-Year 2011 4s by Loan Size
85K Max 110K Max 150K Max Cohort
85K Max 110K Max 150K Max Cohort3mo 11.3 11 10.9 12.16mo 11.1 11.5 11.2 12.412mo 11.8 12.2 12.2 13.412mo Prepay Ratio 0.88 0.91 0.91 1.00
0.82
0.84
0.86
0.88
0.90
0.92
0.94
0.96
0.98
1.00
1.02
0
2
4
6
8
10
12
14
16
Prepay RatioCPR
FNMA 15-Year 2011 3.5s by Loan Size - Avg CPRs (left) | 12mo Prepay Ratio (right)
85K Max 110K Max 150K Max Cohort3mo 11.7 11.8 13.1 13.26mo 12.2 12.3 13.3 13.612mo 12.9 13.4 14.5 1512mo Prepay Ratio 0.86 0.89 0.97 1.00
0.75
0.80
0.85
0.90
0.95
1.00
1.05
0
2
4
6
8
10
12
14
16
Prepay RatioCPR
FNMA 30-Year 2011 4s by Loan Size - Avg CPRs (left) | 12mo Prepay Ratio (right)

April 2016 Page 4
Oklahoma City, OK | Atlanta, GA | Austin, TX | Indianapolis, IN | Salt Lake City, UT | Springfield, IL | www.GoBaker.comThe Baker Group | 1601 Northwest Expressway, 20th Floor | Oklahoma City, OK 73118 | 800.937.2257 | Member FINRA and SIPC
MBS Market Strategies
Investor PoolsInvestor pools within Fannie 15yrs of 2011 increased to a modest extent, up 0.3 CPR to 13.6 while the cohort jumped 2.3 CPR to 13. Fannie 30yrs of the same vintage increased 4.1 CPR to 16.1 while investor pools added 2.2 CPR on the month.
02468
101214161820
Apr-
14
May
-14
Jun-
14
Jul-1
4
Aug-
14
Sep-
14
Oct
-14
Nov
-14
Dec-
14
Jan-
15
Feb-
15
Mar
-15
Apr-
15
May
-15
Jun-
15
Jul-1
5
Aug-
15
Sep-
15
Oct
-15
Nov
-15
Dec-
15
Jan-
16
Feb-
16
Mar
-16
CPR
FNMA 15-Year 2011s 50%-100% Investor
Cohort 50-100% Investor
0
5
10
15
20
25
Apr-
14
May
-14
Jun-
14
Jul-1
4
Aug-
14
Sep-
14
Oct
-14
Nov
-14
Dec-
14
Jan-
15
Feb-
15
Mar
-15
Apr-
15
May
-15
Jun-
15
Jul-1
5
Aug-
15
Sep-
15
Oct
-15
Nov
-15
Dec-
15
Jan-
16
Feb-
16
Mar
-16
CPR
FNMA 30-Year 2011s 50%-100% Investor
Cohort 50-100% Investor
50-100% Investor Cohort3mo 13.1 11.56mo 13.5 11.912mo 15.5 1312mo Prepay Ratio 1.19 1.00
0.90
0.95
1.00
1.05
1.10
1.15
1.20
1.25
0
2
4
6
8
10
12
14
16
18
Prepay RatioCPR
FNMA 15-Year 2011s Investor %- Avg CPRs (left) | 12mo Prepay Ratio (right)
Cohort 50-100% Investor
50-100% Investor Cohort3mo 14.4 13.46mo 15.3 1412mo 17.2 16.112mo Prepay Ratio 1.07 1.00
0.96
0.98
1.00
1.02
1.04
1.06
1.08
0
2
4
6
8
10
12
14
16
18
20
Prepay RatioCPR
FNMA 30-Year 2011s Investor % - Avg CPRs (left) | 12mo Prepay Ratio (right)

April 2016 Page 5
Oklahoma City, OK | Atlanta, GA | Austin, TX | Indianapolis, IN | Salt Lake City, UT | Springfield, IL | www.GoBaker.comThe Baker Group | 1601 Northwest Expressway, 20th Floor | Oklahoma City, OK 73118 | 800.937.2257 | Member FINRA and SIPC
MBS Market Strategies
Geographic DistributionThe best prepayment protection from geographic pools remained in New York and Puerto Rico concentrations which paid 7.1 and 6.8 CPR for 15yrs respectively. The lag in geo-reporting shows speeds fell in-line with the cohorts in February and we’ll expect the same trend with a jump next month.
0
2
4
6
8
10
12
14
16
Apr-
14
May
-14
Jun-
14
Jul-1
4
Aug-
14
Sep-
14
Oct
-14
Nov
-14
Dec-
14
Jan-
15
Feb-
15
Mar
-15
Apr-
15
May
-15
Jun-
15
Jul-1
5
Aug-
15
Sep-
15
Oct
-15
Nov
-15
Dec-
15
Jan-
16
Feb-
16
Mar
-16
CPR
FNMA 15-Years by Geographic Distribution
CA FL NY TX US
0
5
10
15
20
25
30
Apr-
14
May
-14
Jun-
14
Jul-1
4
Aug-
14
Sep-
14
Oct
-14
Nov
-14
Dec-
14
Jan-
15
Feb-
15
Mar
-15
Apr-
15
May
-15
Jun-
15
Jul-1
5
Aug-
15
Sep-
15
Oct
-15
Nov
-15
Dec-
15
Jan-
16
Feb-
16
Mar
-16
CPR
FNMA 30-Years by Geographic Distribution
CA FL NY TX US
NY TX CA FL US3mo 9.0 10.8 12.3 11.1 10.96mo 9.5 12.2 13.1 11.8 11.812mo 10.6 14.3 16.4 13.2 14.112mo Prepay Ratio 0.76 1.01 1.17 0.94 1.00
0.00
0.20
0.40
0.60
0.80
1.00
1.20
1.40
0.0
2.0
4.0
6.0
8.0
10.0
12.0
14.0
16.0
18.0
Prepay RatioCPR
FNMA 30-Years by Geographic Distribution
0
2
4
6
8
10
12
14
16
18
20
PR NY CT PA NM DE OK LA WV MD Avg KS WA MA MI OR AZ NV UT CA CO
12-M
onth
Ave
rage
CPR
FNMA 30-Year Speeds by State
Slowest 10 Fastest 10

April 2016 Page 6
Oklahoma City, OK | Atlanta, GA | Austin, TX | Indianapolis, IN | Salt Lake City, UT | Springfield, IL | www.GoBaker.comThe Baker Group | 1601 Northwest Expressway, 20th Floor | Oklahoma City, OK 73118 | 800.937.2257 | Member FINRA and SIPC
MBS Market Strategies
Origination ChannelSpeeds in TPO 15yrs of 2011 fell by nearly 6 CPR to 10.2 with retail pools increasing 2 CPR to 12.3. Both TPO and Retail pools increased about 2 CPR on the month within 30yr 2011s, to 18.6 and 15.3 respectively.
0
5
10
15
20
25
Apr-
14
May
-14
Jun-
14
Jul-1
4
Aug-
14
Sep-
14
Oct
-14
Nov
-14
Dec-
14
Jan-
15
Feb-
15
Mar
-15
Apr-
15
May
-15
Jun-
15
Jul-1
5
Aug-
15
Sep-
15
Oct
-15
Nov
-15
Dec-
15
Jan-
16
Feb-
16
Mar
-16
CPR
FNMA 15-Year 2011s by Origination Channel
100% TPO 100% Retail
0
5
10
15
20
25
Apr-
14
May
-14
Jun-
14
Jul-1
4
Aug-
14
Sep-
14
Oct
-14
Nov
-14
Dec-
14
Jan-
15
Feb-
15
Mar
-15
Apr-
15
May
-15
Jun-
15
Jul-1
5
Aug-
15
Sep-
15
Oct
-15
Nov
-15
Dec-
15
Jan-
16
Feb-
16
Mar
-16
CPR
FNMA 30-Year 2011s by Origination Channel
100% TPO 100% Retail
Servicer ConcentrationQuicken’s most recent speeds have been trending down and the most recent speeds within Fannie 15yr 3.5s showed their serviced pools increased to the same degree as the cohort, up 2.7 CPR to 13.8. However, the 2014 vintage showed Quicken accelerating by as much as 50% higher than the cohort.
0 2 4 6 8 10 12 14 16
QUICKEN LOANS INC.
WELLS FARGO BANK, N.A.
JP MORGAN CHASE BANK, NA
U.S. BANK N.A.
CITIMORTGAGE, INC.
SUNTRUST MORTGAGE INC.
PHH MORTGAGE CORPORATION
BANK OF AMERICA, N.A.
NATIONSTAR MORTGAGE, LLC
PNC BANK, N.A.
DITECH FINANCIAL LLC
6mo, 12mo CPRs - FNMA 15-Year 3.5s by Servicer
6mo CPR
12mo CPR

April 2016 Page 7
Oklahoma City, OK | Atlanta, GA | Austin, TX | Indianapolis, IN | Salt Lake City, UT | Springfield, IL | www.GoBaker.comThe Baker Group | 1601 Northwest Expressway, 20th Floor | Oklahoma City, OK 73118 | 800.937.2257 | Member FINRA and SIPC
MBS Market Strategies
Cpn % Chg CPR Chg Mar CPR Feb CPR % Chg CPR Chg Mar CPR Feb CPR % Chg CPR Chg Mar CPR Feb CPR % Chg CPR Chg Mar CPR Feb CPR10-Year 2.5 23% 2.2 11.9 9.7 27% 2.4 11.6 9.1
3.0 19% 2.3 14.0 11.8 34% 3.5 13.7 10.23.5 14% 1.9 16.1 14.2 17% 2.2 15.0 12.84.0 22% 3.4 19.1 15.6 13% 2.1 18.1 16.0
All 10y 19% 2.1 13.2 11.1 22% 2.3 12.4 10.1
15-Year 2.5 44% 2.8 9.3 6.5 45% 2.8 9.1 6.3 8% 0.8 10.2 9.5 39% 3.0 10.6 7.63.0 41% 3.3 11.4 8.1 39% 3.1 10.9 7.8 31% 3.4 14.2 10.8 30% 3.2 13.6 10.43.5 25% 2.6 12.9 10.3 23% 2.4 12.8 10.4 29% 3.5 15.9 12.3 23% 3.1 16.6 13.54.0 12% 1.7 15.5 13.8 15% 2.1 16.6 14.5 26% 3.3 16.0 12.7 10% 1.4 16.0 14.64.5 10% 1.6 17.9 16.2 15% 2.4 18.7 16.3 -1% -0.2 15.6 15.8 14% 2.2 18.0 15.85.0 8% 1.3 19.1 17.8 9% 1.5 19.4 17.9 6% 1.0 16.7 15.7 -1% -0.1 16.3 16.45.5 7% 1.1 18.6 17.4 12% 2.1 19.2 17.1 25% 3.1 15.8 12.7 -39% -6.1 9.7 15.8
All 15y 31% 2.7 11.4 8.7 32% 2.7 11.1 8.5 22% 2.6 14.6 12.0 28% 2.9 13.3 10.4
20-Year 3.0 60% 3.8 10.0 6.3 72% 3.9 9.3 5.43.5 50% 4.5 13.4 8.9 46% 4.0 12.8 8.84.0 31% 3.4 14.3 10.9 30% 3.3 14.5 11.24.5 15% 2.2 17.1 14.9 5% 0.7 15.8 15.15.0 13% 1.9 16.6 14.7 18% 2.7 17.5 14.8
All 20y 40% 3.6 12.4 8.8 38% 3.4 12.2 8.8
30-Year 3.0 67% 3.7 9.3 5.6 68% 3.5 8.6 5.1 51% 4.7 14.0 9.3 46% 4.0 12.8 8.83.5 84% 6.6 14.4 7.8 96% 7.2 14.6 7.5 38% 5.0 18.1 13.1 60% 7.3 19.3 12.04.0 56% 6.7 18.8 12.1 55% 6.6 18.6 12.0 32% 5.0 20.9 15.9 30% 5.8 24.9 19.14.5 26% 3.9 19.0 15.1 27% 4.1 19.3 15.1 14% 2.7 22.6 19.9 16% 3.6 25.3 21.85.0 17% 3.0 20.2 17.2 13% 2.4 20.7 18.3 9% 1.8 21.3 19.5 8% 1.7 23.9 22.25.5 6% 1.1 20.3 19.2 9% 1.7 21.2 19.5 9% 1.5 19.4 17.8 9% 1.8 21.3 19.66.0 7% 1.3 20.8 19.5 3% 0.6 20.9 20.3 5% 0.9 18.9 18.1 7% 1.2 20.1 18.9
All 30y 49% 5.1 15.6 10.5 50% 5.2 15.6 10.4 21% 3.3 19.4 16.0 39% 5.5 19.7 14.2
Prod % Chg CPR Chg Mar CPR Feb CPR % Chg CPR Chg Mar CPR Feb CPR % Chg CPR Chg Mar CPR Feb CPR2014 8% 3.4 47.6 44.32013 1% 0.2 28.6 28.42012 1% 0.2 18.2 18.02011 1% 0.1 17.8 17.7
All 3x1 9% 1.9 21.8 19.9
2014 22% 7.1 39.3 32.22013 15% 4.1 32.3 28.22012 22% 5.2 28.8 23.62011 22% 5.9 32.9 27.12010 28% 4.5 20.8 16.32009 57% 5.9 16.3 10.4
All 5x1 26% 6.1 29.2 23.1
2008 -99% -63.3 0.6 63.9 19% 11.8 73.1 61.32007 43% 7.4 24.5 17.1 101100% 1.0 1.0 0.02006 -56% -12.2 9.6 21.8 -5% -0.6 12.7 13.32005 104% 9.8 19.2 9.4 -15% -3.2 17.3 20.42004 7% 1.1 18.2 17.1 31% 4.5 19.1 14.6
All 7x1 16% 2.4 17.2 14.8 10% 1.5 16.9 15.4
2007 150% 17.4 29.0 11.6 172% 21.0 33.3 12.22006 72% 10.8 25.7 14.9 -26% -10.3 29.7 40.02005 -94% -10.9 0.7 11.5 7% 0.7 10.1 9.42004 130% 16.6 29.3 12.8 67% 8.7 21.5 12.9
All 10x1 64% 7.9 20.1 12.2 22% 3.4 18.7 15.3
10x1 Treas
FNMA FHLMC GNMA
3x1 Treas
5x1 Treas
7x1 Treas
Hybrid MBS - CPR Change
Fixed MBS - CPR ChangeFNMA FHLMC GNMA I GNMA II
Prepayment Chart Book

April 2016 Page 8
Oklahoma City, OK | Atlanta, GA | Austin, TX | Indianapolis, IN | Salt Lake City, UT | Springfield, IL | www.GoBaker.comThe Baker Group | 1601 Northwest Expressway, 20th Floor | Oklahoma City, OK 73118 | 800.937.2257 | Member FINRA and SIPC
MBS Market Strategies
0
5
10
15
20
25
Apr-15 May-15 Jun-15 Jul-15 Aug-15 Sep-15 Oct-15 Nov-15 Dec-15 Jan-16 Feb-16 Mar-16
CPR
10-Year FNMA Historical Speeds by Coupon
2% 2.5% 3% 3.5% 4% 4.5%
0
5
10
15
20
25
Apr-15 May-15 Jun-15 Jul-15 Aug-15 Sep-15 Oct-15 Nov-15 Dec-15 Jan-16 Feb-16 Mar-16
CPR
10-Year FHLMC Historical Speeds by Coupon
2% 2.5% 3% 3.5% 4% 4.5%
0
5
10
15
20
25
Apr-15 May-15 Jun-15 Jul-15 Aug-15 Sep-15 Oct-15 Nov-15 Dec-15 Jan-16 Feb-16 Mar-16
CPR
15-Year FNMA Historical Speeds by Coupon
2.5% 3% 3.5% 4% 4.5% 5% 5.5%
0
5
10
15
20
25
Apr-15 May-15 Jun-15 Jul-15 Aug-15 Sep-15 Oct-15 Nov-15 Dec-15 Jan-16 Feb-16 Mar-16
CPR
15-Year FHLMC Historical Speeds by Coupon
2.5% 3% 3.5% 4% 4.5% 5% 5.5%
0
5
10
15
20
25
Apr-15 May-15 Jun-15 Jul-15 Aug-15 Sep-15 Oct-15 Nov-15 Dec-15 Jan-16 Feb-16 Mar-16
CPR
20-Year FNMA Historical Speeds by Coupon
3% 3.5% 4% 4.5% 5% 5.5% 6%
0
5
10
15
20
25
Apr-15 May-15 Jun-15 Jul-15 Aug-15 Sep-15 Oct-15 Nov-15 Dec-15 Jan-16 Feb-16 Mar-16
CPR
20-Year FHLMC Historical Speeds by Coupon
3% 3.5% 4% 4.5% 5% 5.5% 6%
0
5
10
15
20
25
30
Apr-15 May-15 Jun-15 Jul-15 Aug-15 Sep-15 Oct-15 Nov-15 Dec-15 Jan-16 Feb-16 Mar-16
CPR
30-Year FNMA Historical Speeds by Coupon
3% 3.5% 4% 4.5% 5% 5.5% 6%
0
5
10
15
20
25
30
Apr-15 May-15 Jun-15 Jul-15 Aug-15 Sep-15 Oct-15 Nov-15 Dec-15 Jan-16 Feb-16 Mar-16
CPR
30-Year FHLMC Historical Speeds by Coupon
3% 3.5% 4% 4.5% 5% 5.5% 6%
05
101520253035404550
Apr-15 May-15 Jun-15 Jul-15 Aug-15 Sep-15 Oct-15 Nov-15 Dec-15 Jan-16 Feb-16 Mar-16
CPR
GNMA 3x1 Historical Speeds by Production Year
2014 2013 2012 2011 2010 2009
05
1015202530354045
Apr-15 May-15 Jun-15 Jul-15 Aug-15 Sep-15 Oct-15 Nov-15 Dec-15 Jan-16 Feb-16 Mar-16
CPR
GNMA 5x1 Historical Speeds by Production Year
2014 2013 2012 2011 2010 2009

April 2016 Page 9
Oklahoma City, OK | Atlanta, GA | Austin, TX | Indianapolis, IN | Salt Lake City, UT | Springfield, IL | www.GoBaker.comThe Baker Group | 1601 Northwest Expressway, 20th Floor | Oklahoma City, OK 73118 | 800.937.2257 | Member FINRA and SIPC
MBS Market Strategies
0
5
10
15
20
25
Apr-15 May-15 Jun-15 Jul-15 Aug-15 Sep-15 Oct-15 Nov-15 Dec-15 Jan-16 Feb-16 Mar-16
CPR
15-Year GNI Historical Speeds by Coupon
2.5% 3% 3.5% 4% 4.5% 5% 5.5%
0
5
10
15
20
25
Apr-15 May-15 Jun-15 Jul-15 Aug-15 Sep-15 Oct-15 Nov-15 Dec-15 Jan-16 Feb-16 Mar-16
CPR
15-Year GNII Historical Speeds by Coupon
2.5% 3% 3.5% 4% 4.5% 5% 5.5%
0
5
10
15
20
25
30
Apr-15 May-15 Jun-15 Jul-15 Aug-15 Sep-15 Oct-15 Nov-15 Dec-15 Jan-16 Feb-16 Mar-16
CPR
30-Year GNI Historical Speeds by Coupon
3% 3.5% 4% 4.5% 5% 5.5% 6%
0
5
10
15
20
25
30
35
40
Apr-15 May-15 Jun-15 Jul-15 Aug-15 Sep-15 Oct-15 Nov-15 Dec-15 Jan-16 Feb-16 Mar-16
CPR
30-Year GNII Historical Speeds by Coupon
3% 3.5% 4% 4.5% 5% 5.5% 6%
2% 2.5% 3% 3.5% 4% 4.5%Mar-16 9.5 9.7 11.8 14.2 15.6 18.4Feb-16 8.1 9.5 11.9 14.4 17.5 16.9
02468
101214161820
CPR
Monthly Change - FNMA 10-Year by Coupon
2.5% 3% 3.5% 4% 4.5%Mar-16 9.1 10.9 12.8 16.6 18.7Feb-16 6.3 7.8 10.4 14.5 16.3
02468
101214161820
CPR
Monthly Change - FHLMC 10-Year by Coupon
2.5% 3% 3.5% 4% 4.5% 5% 5.5%Mar-16 9.3 11.4 12.9 15.5 17.9 19.1 18.6Feb-16 6.5 8.1 10.3 13.8 16.2 17.8 17.4
0
5
10
15
20
25
CPR
Monthly Change - FNMA 15-Year by Coupon
2.5% 3% 3.5% 4% 4.5% 5% 5.5%Mar-16 9.1 10.9 12.8 16.6 18.7 19.4 19.2Feb-16 6.3 7.8 10.4 14.5 16.3 17.9 17.1
0
5
10
15
20
25
CPR
Monthly Change - FHLMC 15-Year by Coupon
3% 3.5% 4% 4.5% 5% 5.5% 6%Mar-16 6.3 8.9 10.9 14.9 14.7 14.9 14.5Feb-16 5.5 8.3 11 14.5 13.5 14.1 14.9
02468
10121416
CPR
Monthly Change - FNMA 20-Year by Coupon
3% 3.5% 4% 4.5% 5% 5.5% 6%Mar-16 5.4 8.8 11.2 15.1 14.8 15 15.5Feb-16 5.3 7.5 10.6 14.4 14.9 12.8 13.8
02468
1012141618
CPR
Monthly Change - FHLMC 20-Year by Coupon

April 2016 Page 10
INTENDED FOR INSTITUTIONAL INVESTORS ONLY. The data provided in these reports is for informational purposes only and is intended solely for your private use. Information herein is believed to be reliable but The Baker Group LP does not guarantee its completeness or accuracy. Opinions constitute our judgment and are subject to change without notice. Past performance is not indicative of future results. The investments and strategies discussed here may not be suitable for all investors; if you have any doubts you should consult your Baker representative. The investments discussed may fluctuate in price or value. Changes in rates of exchange may have an adverse effect on the value of investments. This material is not intended as an offer or solicitation for the purchase or sale of any financial instruments.
Oklahoma City, OK | Atlanta, GA | Austin, TX | Indianapolis, IN | Salt Lake City, UT | Springfield, IL | www.GoBaker.comThe Baker Group | 1601 Northwest Expressway, 20th Floor | Oklahoma City, OK 73118 | 800.937.2257 | Member FINRA and SIPC
MBS Market Strategies
3% 3.5% 4% 4.5% 5% 5.5% 6%Mar-16 9.3 14.4 18.8 19 20.2 20.3 20.8Feb-16 5.6 7.8 12.1 15.1 17.2 19.2 19.5
0
5
10
15
20
25
CPR
Monthly Change - FNMA 30-Year by Coupon
3% 3.5% 4% 4.5% 5% 5.5% 6%Mar-16 8.6 14.6 18.6 19.3 20.7 21.2 20.9Feb-16 5.1 7.5 12 15.1 18.3 19.5 20.3
0
5
10
15
20
25
CPR
Monthly Change - FHLMC 30-Year by Coupon
2.5% 3% 3.5% 4% 4.5% 5% 5.5%Mar-16 10.2 14.2 15.9 16 15.6 16.7 15.8Feb-16 9.5 10.8 12.3 12.7 15.8 15.7 12.7
02468
1012141618
CPR
Monthly Change - GNMA 15-Year by Coupon
2.5% 3% 3.5% 4% 4.5% 5% 5.5%Mar-16 7.6 10.4 13.5 14.6 15.8 16.4 15.8Feb-16 6.2 9.8 12.6 14.3 18.2 11.2 15.4
02468
101214161820
CPR
Monthly Change - GNMAII 15-Year by Coupon
3% 3.5% 4% 4.5% 5% 5.5% 6%Mar-16 14 18.1 20.9 22.6 21.3 19.4 18.9Feb-16 9.3 13.1 15.9 19.9 19.5 17.8 18.1
0
5
10
15
20
25
CPR
Monthly Change - GNMA 30-Year by Coupon
2.5% 3% 3.5% 4% 4.5% 5% 5.5%Mar-16 10.7 12.8 19.3 24.9 25.3 23.9 21.3Feb-16 8 8.8 12 19.1 21.8 22.2 19.6
0
5
10
15
20
25
30
CPR
Monthly Change - GNMAII 30-Year by Coupon