802 stratton ofc. bldg., springfield, il 62706 monthly
TRANSCRIPT

1
802 Stratton Ofc. Bldg., Springfield, IL 62706
MONTHLY BRIEFING FOR THE MONTH ENDED: APRIL 2021 http://cgfa.ilga.gov
SENATE
David Koehler, Co-Chair
Omar Aquino
Darren Bailey
Donald DeWitte
Elgie Sims
Dave Syverson
HOUSE
C.D. Davidsmeyer, Co-Chair
Amy Elik
Amy Grant
Sonya Harper
Elizabeth Hernandez
Anna Moeller
EXECUTIVE DIRECTOR
Clayton Klenke
DEPUTY DIRECTOR
Laurie Eby
INSIDE THIS ISSUE
PAGE 1: Consumer Behavior Post-COVID
PAGE 3: Illinois Economic Indicators
PAGE 4: Cannabis Quarterly – 3rd Quarter FY 2021
PAGE 5: FY 2022 Capital Plan Appropriations
Request
PAGE 7: The Recent Volatility of April Tax Receipts
PAGE 11: REVENUE: April Revenues Change
Course from Last Year’s Perfect Storm – Receipts
Snap Back Due to Timing and Strong Underlying
Economic Performance
PAGES 13-14: Revenue Tables
Consumer Behavior Post-COVID
Benjamin L. Varner, Senior Analyst and Economic
Specialist
As the COVID-19 pandemic spread across the
country in 2020, consumer behavior changed in
response. Consumers changed how they purchased
items, how they obtained their purchases, and where
they consumed their acquisitions. Changes in
consumer behavior such as this can affect State tax
revenue such as the income tax and especially the
sales tax. As such, a key question is will these new
patterns continue once the country is beyond the
pandemic. The Commission examined two recent
reports that discuss the changes seen in consumer
behavior in the last year and provided insight into
which of these changes would continue after the
pandemic has subsided. The first report was from
market intelligence company Numerator that
conducted surveys on consumer behavior from
March 2020 through January 2021. The second
report was from the McKinsey Global Institute that
looked at consumer behavior changes by income
levels and estimated the long term nature of six major
changes going forward.
In its report entitled The Impact of COVID-19 on
Consumer Behavior, Numerator compiled ten
months of observations related to consumer behavior
change developed from surveys they conducted
throughout the pandemic. One of the first insights
was a change in how customers ordered and received
their goods. A significant shift to placing orders
online with either home delivery, in-store, or
curbside pick-up was noted. Eighty-seven percent of

2
shoppers placed online orders for delivery during the
pandemic, while 51% placed orders online for store
or curbside pickup. Between March and June of
2020, roughly 1/3rd of the “click and collect”
shoppers were new to the service or hadn’t done so
in at least six months. As of the end of January 2021,
39% of respondents indicated that they were still
making online purchases when they would usually
shop in store. This metric peaked at 50% in the
summer of 2020. This trend is expected to continue
as 22% of respondents said they plan on maintaining
a higher frequency of on-line purchases after the
pandemic subsides.
Another shift that happened due to the pandemic is
seen in the consumption of food and drink. Fifty-
seven percent of respondents indicated more frequent
eating at home since the pandemic began. Twenty-
four percent expected to continue to eat more at
home post-COVID-19. Forty-three percent of
respondents indicated that they ordered food for
pick-up or delivery more often during the pandemic
and 18% anticipate continuing to do so in the future.
Fifty-eight percent of participants were going to bars
and restaurants less frequently, and 21% have not
done so at all. However, post-C0VID-19, 32% of
those taking the survey thought they would go to bars
and restaurants more frequently compared to before
COVID-19. How this situation evolves could affect
the amount of sales and income taxes brought into
the State as most food not for immediate
consumption is exempt from sales tax at the State
level and the number of employees needed in this
new consumer environment may be different than
prior to the pandemic.
A final change in consumer behavior that can be seen
in the Numerator report is the fall-off in travel.
Eighty-three percent of respondents were traveling
less or not at all for their work during the pandemic.
A similar 77% are not traveling or are traveling less
for personal reasons. However, expectations are for
this to basically bounce back once COVID-19 is
under more control especially leisure travel.
Fourteen percent of those traveling professionally
expect to do so more compared to prior to COVID,
while 10% expect to do less travel. Traveling for
personal reasons is expected to rise as 33% of those
interviewed expected to travel more, while 17%
thought they would travel less. A bounce-back in
travel is needed to see a rebound in all areas of the
Leisure and Hospitality sector which includes food
service, lodging, live entertainment, and recreation.
The second report the Commission examined was
from the McKinsey Global Institute, which is the
business and economics research arm of the
consulting firm McKinsey and Company. The recent
March 2021 report, titled The Consumer Demand
Recovery and Lasting Effects of COVID-19,
highlights many of the same trends as the Numerator
report, but also examined differences in consumer
behavior by age and income level. McKinsey noted
that in the U.S., consumer spending had recovered
in all the high income age groups, while spending in
the low income age groups remained below pre-
COVID levels. Spending by young and middle-age,
high-income earners was more than two percentage
points higher, while older high-income and middle-
age, middle-income households were up between 0%
and 2%. Young and middle-age, low-income
households’ consumer spending remained more than
2% below levels seen prior to the pandemic.
The McKinsey report also examined six consumer
trends in depth to determine if the change in
consumer behavior brought on by COVID-19 would
continue once the virus is under control. They
developed a methodology to assign each trend a
“stickiness” score that would estimate how well the
change in consumer behavior would be maintained.
Of the six adjustments in consumer behavior
scrutinized, three were deemed likely to continue
post-pandemic and three were viewed as likely to
revert back.
The three trends that they identified as likely to
continue once the economy opens fully were the
acceleration of e-grocery shopping, the rise of virtual
healthcare visits, and home nesting. E-grocery
orders grew to over 10% of all grocery sales in 2020.
Virtual healthcare visits grew 25-fold from February
to April in 2020. Illinois passed legislation
expanding telehealth options during the COVID-19
pandemic in the spring of 2020. These first two
trends emphasize the continuing digitization of
consumer spending as more and more products are
delivered using the internet versus on-site visits. The

3
last trend, home nesting, refers to spending on items
such as home gyms, backyards and gardens, and
kitchen equipment. Many consumers spent
extensively on items used at home during the
pandemic. McKinsey believes that this will continue
into the future as consumers will reap the benefits of
these past purchases and add to them.
The other three trends in consumer behavior the
report looked at were the sharp decline in live
entertainment, the decrease in leisure air travel, and
the emergence of remote learning. All three of these
changes are not expected to endure once the virus is
more contained. Spending on live entertainment was
down over 80% in the spring of 2020. At the same
time, spending on in-home entertainment increased
by 6%. While this trend has persisted into 2021,
McKinsey believes that live entertainment will
rebound but it may take some time due to the large
amount of closures in the industry. As of September
2020, 6,500 nightlife businesses in the U.S. were
closed with approximately 54% of those closures
being permanent. Leisure air travel basically did not
occur during the worst periods of the COVID
pandemic. Pent-up demand is expected to lead to a
bounce back in 2021 as consumers are again ready
to go on vacation. Remote education was made
necessary over the last year but it is not expected to
continue at such high levels in the future. Surveys
have indicated that students, parents, and teachers all
have had challenges with remote learning. While
remote learning will likely continue to be used to
enhance elementary learning and continue to grow at
the college level, the use of virtual learning as a
primary tool is unlikely at the elementary and
secondary levels.
While these reports offer insight on future consumer
behavior, it remains unclear which trends will carry
on in the post-COVID environment. Spending
changes discussed herein will continue to need to be
monitored going forward to ascertain any effects on
tax receipts. The make-up of consumer spending
could affect the amount of sales taxes and income
taxes brought in by the State. A continued trend
towards more spending on goods could support
growth in the sales tax in Illinois which doesn’t tax
many services, while a lack of employee hiring in
the service sector due to a slow rebound could hold
back income tax growth.
INDICATORS*LATEST
MONTH PRIOR MONTH A YEAR AGO
Unemployment Rate (Average) (Mar.) 7.1% 7.4% 3.7%
Inflation in Chicago (12-month percent change) (Mar.) 2.6% 1.2% 1.1%
LATEST
MONTH
CHANGE OVER
PRIOR MONTH
CHANGE OVER
A YEAR AGO
Civilian Labor Force (thousands) (Mar.) 6,129.6 -0.1% -3.4%
Employment (thousands) (Mar.) 5,693.3 0.2% -6.8%
Nonfarm Payroll Employment (Mar.) 5,730,000 32,200 -360,700
New Car & Truck Registration (Mar.) 52,644 33.7% 34.2%
Single Family Housing Permits (Mar.) 1,032 52.9% 48.5%
Total Exports ($ mil) (Feb.) 4,824.1 8.7% 0.7%
Chicago Purchasing Managers Index (Apr.) 72.1 8.7% 103.7%
INDICATORS OF ILLINOIS ECONOMIC ACTIVITY
* Due to monthly fluctuations, trend best shown by % change from a year ago

4
Cannabis Quarterly – 3rd Quarter FY 2021
5
FY 2022 Capital Plan Appropriations Request By Lynnae Kapp, Senior Analyst
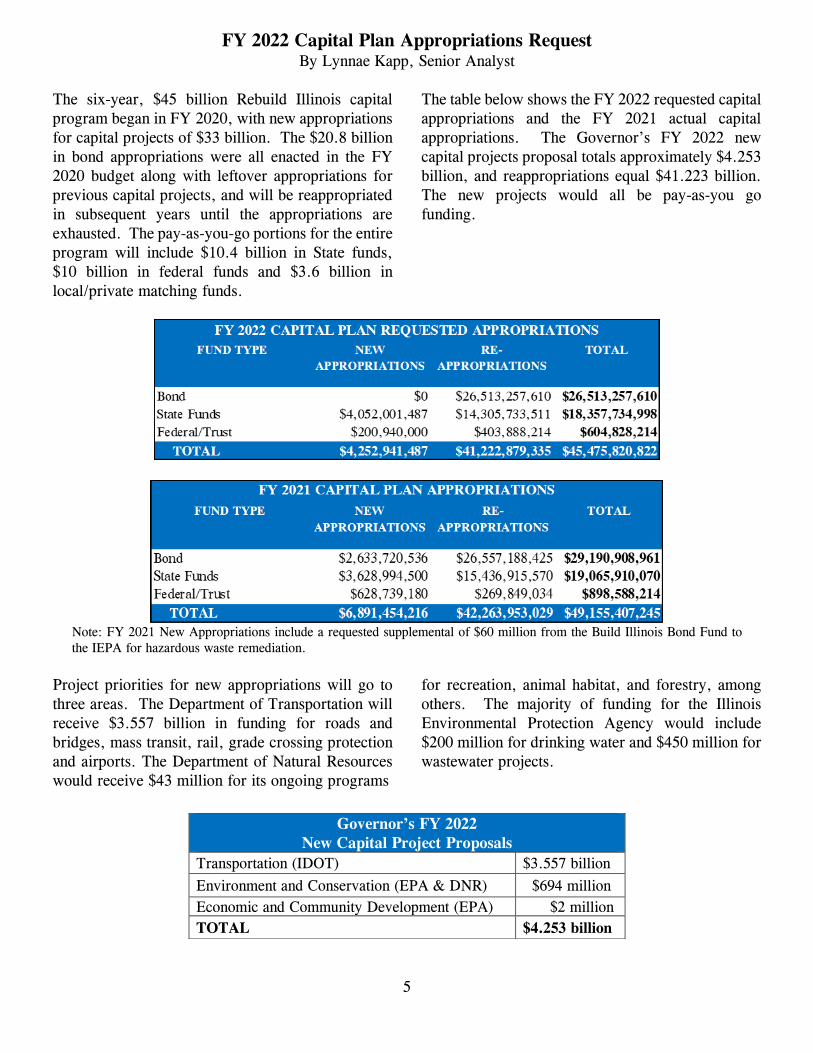
The six-year, $45 billion Rebuild Illinois capital
program began in FY 2020, with new appropriations
for capital projects of $33 billion. The $20.8 billion
in bond appropriations were all enacted in the FY
2020 budget along with leftover appropriations for
previous capital projects, and will be reappropriated
in subsequent years until the appropriations are
exhausted. The pay-as-you-go portions for the entire
program will include $10.4 billion in State funds,
$10 billion in federal funds and $3.6 billion in
local/private matching funds.
The table below shows the FY 2022 requested capital
appropriations and the FY 2021 actual capital
appropriations. The Governor’s FY 2022 new
capital projects proposal totals approximately $4.253
billion, and reappropriations equal $41.223 billion.
The new projects would all be pay-as-you go
funding.
Note: FY 2021 New Appropriations include a requested supplemental of $60 million from the Build Illinois Bond Fund to
the IEPA for hazardous waste remediation.
Project priorities for new appropriations will go to
three areas. The Department of Transportation will
receive $3.557 billion in funding for roads and
bridges, mass transit, rail, grade crossing protection
and airports. The Department of Natural Resources
would receive $43 million for its ongoing programs
for recreation, animal habitat, and forestry, among
others. The majority of funding for the Illinois
Environmental Protection Agency would include
$200 million for drinking water and $450 million for
wastewater projects.
Governor’s FY 2022
New Capital Project Proposals
Transportation (IDOT) $3.557 billion
Environment and Conservation (EPA & DNR) $694 million
Economic and Community Development (EPA) $2 million
TOTAL $4.253 billion

6
The new pay-as-you-go appropriations come from
revenues, including State funds (e.g. State
Construction Account Fund, Road Fund, Downstate
Transit Improvement Fund, Grade Crossing
Protection Fund, High-Speed Rail Rolling Stock
Fund, Park and Conservation Fund, Water
Revolving Fund), federal sources (e.g. Abandoned
Mined Lands Reclamation Council Federal Trust
Fund, Federal Mass Transit Trust Fund,
Federal/State/Local Airport Fund, Forest Reserve
Fund) and local matching funds. The chart below
shows new appropriations separated out into
categories. The Road Fund & State Construction
Fund are separate to show that they will pay for a
majority of State-funded projects, paying 78% of
new appropriations, while other State funds would
pay for 17% and Federal funds approximately 5%.
DEBT MANAGEMENT
General Obligation capital projects total authorization is
$51.5 billion, with approximately $21 billion remaining
unissued as of March 31, 2021. Available Pension
Acceleration bond authorization is $263 million. Build
Illinois authorization is $9.5 billion, with approximately
$3.7 billion unissued. There is no refunding limit placed
on Build Illinois bonds.
Through March of FY 2021, the State has sold $1.623
billion in General Obligation bonds for capital projects,
$227 million of Pension Acceleration Bonds, and
another $2.0 billion in a three-year borrowing to the
MLF. The Governor’s Budget Book anticipates a total
of $2.795 billion of G.O. capital bonds, $325 million of
Pension Acceleration bonds, and $300 million of Build
Illinois bonds. Bond sales for FY 2022 are expected to
reach $2.555 billion of General Obligation bonds for
capital projects, the remaining $150 million of Pension
Acceleration bonds, and $350 million of Build Illinois
bonds.
The June 2020 $1.2 billion GO Certificates were sold
with an interest rate of 3.82%, which was lowered
by the Municipal Liquidity Facility to 3.36% on
August 27, 2020, when they decided to lower the
rates they would give to any users of the facility and
retroactively fixed the rate for Illinois. The State
owes another $2.0 billion plus $204.8 million in
interest on the December 2020 GO Certificates
which were supposed to be paid off in three years.
With the recent passage of the American Rescue
Plan, Illinois is expected to receive $7.5 billion. The
Governor has said he will ask the Legislature to
appropriate enough of the funds to pay off the
remaining amounts of the Short-Term borrowings
from the Municipal Liquidity Facility, as these
borrowings were used due to the failure of revenues
caused by the Coronavirus pandemic.

7
In April 2020, near the beginning of the
COVID-19 pandemic, Fitch lowered the State’s
G.O. rating to BBB-. The State’s ratings have
remained unchanged since then at the lowest
investment grade from all three rating agencies
through March 2021. Though all three ratings
agencies had Illinois at a negative outlook, S&P
revised the State to a stable outlook after the
State’s budget recommendation in February
2021 and Moody’s did so in March 2021 after
the American Rescue Plan had been signed into
law.
The Recent Volatility of April Tax Receipts Eric Noggle, Senior Revenue Analyst
Historically, the month of April is one of the
most important months for State tax revenues.
Over the last decade, on average, 14.4% of
personal income taxes and 21.1% of corporate
income taxes are receipted during this single
month. Normally, the outcome of April tax
collections goes a long way in deciding how the
overall revenue performance of a particular
fiscal year is judged. However, over the last
decade, there have been very few “normal”
years, which has made revenue estimating
extremely challenging.
From “April surprises” to last year’s “perfect
storm”, over the last decade April’s income tax
receipts have experienced significant
fluctuation. The following charts and
accompanying tables on pages 9 and 10 illustrate

8
those significant swings in revenues, along with
a brief explanation of the assumed key behind
that volatility. In essence, the largest
contributors to those swings can be attributed to:
The multiple changes in the State’s
income tax rates—both increases and
decreases—and the multiple year-over-
year effect that these changes have had
on April receipts.
Substantial federal tax policy changes
that encouraged filing changes in
taxpayer behavior and timing of receipts.
While those periods may create a
positive “April Surprise” of revenues in
the initial year, an accompanying falloff
in revenues in April of the following year
can result.
Pandemic related delays in final payment
deadlines over the last couple of years
have moved revenues that typically are
receipted in April to instead fall into
subsequent months. The tax deadline in
2020 was shifted to July 15th, which
caused approximately $1.3 billion in
revenues that would have been receipted
in FY 2020 to fall into early FY 2021.
These wild swings of April income tax have
continued into 2021. With the pandemic
persisting, the tax filing deadline was again
delayed. This time, however, the deadline for
individual tax filers was moved back only one
month—to May 17th. [The tax deadline for
corporate tax filers was not extended this time].
Although a May deadline means that final
payments should still remain in FY 2021
(thereby, effectively giving FY 2021 two
periods of final payments), this potential one-
month delay means that April receipts are again
“not normal”.
As shown in the following revenue section
of this briefing, despite this delay in the tax
deadline, gross April receipts are actually
29.4% higher than a year ago. Part of this
increase is because current April revenues
are being compared to the even-more
delayed revenues of April 2020. Even
accounting for that differential, preliminary
figures show strong improvement in April’s
withholding and estimated tax payments--
which are not directly impacted by the delay
in the tax deadline. This would seem to
indicate a positive trend in Illinois’ recovery
from the pandemic.
For context however, when comparing April
2021 receipts with those of 2018 and 2019,
the revenue totals in 2021 remain well short
of these earlier year levels (as observed in
the graph on page 9). Since a large chunk
of Tax Year 2020 final payments will now
shift into May 2021, it will not be until late
May before a more definitive view of
personal income tax receipt performance can
be made.
Furthermore, it appears that many corporate
taxpayers underpaid their estimated tax
payments during the pandemic’s onset early
in Tax Year 2020 (FY 2020). Once the tax
year’s final figures were calculated,
businesses had to make up for these
underpayments via final payments. As a
result, corporate income tax revenues for the
month of April (FY 2021) reached $1.130
billion, the highest monthly total on record
for this revenue source. This level of final
payments should not be expected in FY 2022
once businesses adjust their future estimated
payments accordingly. This adds another
layer to the complicated volatility of April
income tax receipts over the last decade.

9

10

11
REVENUE: APRIL REVENUES CHANGE COURSE FROM LAST YEAR’S PERFECT
STORM—RECEIPTS SNAP BACK DUE TO TIMING AND STRONG UNDERLYING
ECONOMIC PERFORMANCE
Jim Muschinske, Revenue Manager
One year removed from receipts dropping
$2.74 billion as the pandemic abruptly
manifested in April 2020 revenues, base
general funds revenues in April 2021 grew
$1.779 billion. Continued strong
performance from both personal income and
corporate income tax receipts were again
complemented by an impressive month for
sales tax revenues. In addition, federal
sources also posted an impressive monthly
gain. The number of receipting days were
the same as last year.
For the month, gross corporate income taxes
jumped $767 million, or $614 million on a
net basis. Much of the comparative gain can
be attributed to last April’s delayed final
payments, which fell into early FY 2021. In
addition, preliminary analysis suggests that
corporations, in the face of pandemic
disruptions, quickly adjusted down their
estimated payments in the first half of tax
year 2020. However, as the economy
recovered much quicker than originally
expected, those lower estimated payments
were insufficient to meet tax year 2020
liabilities and higher final payments have
been the result. [Further analysis of
component data is needed to confirm this
view].
Gross personal income taxes also grew
substantially in April as receipts rose $619
million, or $533 million on a net basis. A
couple of key reasons likely comprise this
level of growth. While the deadline for final
personal income tax payments were
extended, as they were last year, they were
only done so for an extra month [as
compared to last year’s three-month
extension]. Consequently, taxpayers were
less incentivized to put off filing their final
return. Preliminary estimated payments,
whose deadline was not extended, but
reflecting anticipated economic
improvement, also appear to have been very
strong [again, component breakdowns of
monthly data will have to be examined
before definitive conclusions can be made].
Gross sales tax receipts jumped $301
million, or $297 million on a net basis. This
dramatic year-over-year gain is the
consequence of the manifestation of the
economic shutdown in last April’s sales tax
receipts, coupled with the timing of the most
recent stimulus payments and further
increase in consumer confidence.
Both corporate franchise taxes and other
sources returned gains of $18 million in
April, while cigarette tax grew $11 million
likely due to timing of receipts. Vehicle use
tax grew $3 million, and liquor taxes
managed to increase $2 million.
A few revenue sources experienced declines
for the month. Insurance taxes took a
breather from what otherwise has been a
very good receipting year, as revenues
declined $40 million, inheritance taxes
dropped $12 million, public utility taxes
were off $7 million, and interest income
earnings dipped $4 million.
Overall April transfers into the general funds
grew $60 million. While Lottery transfers
were up $25 million, other miscellaneous

12
transfers improved by $35 million. As
mentioned, federal sources experienced a
comparatively strong month, rising $286
million.
Year To Date
Excluding borrowing related activity,
through the first ten months of the fiscal
year, base receipts are up $4.920 billion. In
addition to a surge in federal sources, that
growth also reflects the timing of income tax
receipts related to last year’s [2020] filing
deadline extension, as well as the positive
trajectory of underlying economic
conditions. Through April, combined net
income tax receipts are up $3.406 billion.
While approximately $1.3 billion of those
gains continue to be attributed to the shift of
FY 2020 final payments into early FY 2021,
stronger than previously expected income
tax performance continues to impress. Also
viewed positively is the continued upward
trend of sales tax receipt performance as net
receipts are up $557 million. Only now
beginning to compare against those months
most impacted by the economic shutdowns
of a year ago, sales taxes seem to be
reflecting positive consumer reactions to
stimulus payments, improving job picture,
and stronger consumer confidence.
All of the other revenue sources combined
are ahead of last year’s pace by $16 million.
While exceptional performance has been
seen from inheritance tax and insurance tax,
those gains have been mostly erased by
lower public utility tax receipts, interest
earnings, as well as all other miscellaneous
revenues directed into the general funds
including those related to one-time court
settlement proceeds receipted last fiscal
year.
Overall transfers are off considerably, down
$833 million, reflecting the lack of riverboat
gaming transfers [$195 million] and
significantly lower Income Tax Refund
transfer levels [$336 million] as well as
lower other miscellaneous transfers [$444
million]. Federal sources have experienced
an exceptional year of receipting as receipts
are up $1.774 billion.
While the full story of FY 2021 revenues has
yet to be written, given the onset of the
pandemic, receipts clearly have performed
much better than any prognosticator could
have foretold one year earlier. Despite
periodic upward revisions in the revenue
projections throughout the course of the
fiscal year, each time those updated
expectations have been met and exceeded.
That said, as illustrated by the previous
section which demonstrates the extreme
volatility of some key revenue sources, often
times swings in one direction are met with
opposing subsequent pressure, particularly
when viewed in terms of year-over-year
growth measures. Underlying economic
performances of the major revenue sources
are sometimes trumped by aspects of receipt
timing, tax policy changes at the state and/or
sometimes federal level, and other
unforeseen extraneous events. While
uncertainty is less heading into upcoming FY
2022 than last year, it still is much higher
than normal. The unwinding of the various
stimulus programs such as direct stimulus
payments, augmented unemployment
benefits, rental assistance and other business
and consumer focused benefits, will likely
create some headwinds related to growth
rates. All that without mentioning the
specter of the return of the virus in the fall
and/or resistant variant strains.

13
April April $ %
Revenue Sources FY 2021 FY 2020 CHANGE CHANGE
State Taxes
Personal Income Tax $2,721 $2,102 $619 29.4%
Corporate Income Tax (regular) 1,130 363 767 211.3%
Sales Taxes 888 587 301 51.3%
Public Utility Taxes (regular) 65 72 (7) -9.7%
Cigarette Tax 28 17 11 64.7%
Liquor Gallonage Taxes 16 14 2 14.3%
Vehicle Use Tax 3 0 3 N/A
Inheritance Tax 20 32 (12) -37.5%
Insurance Taxes and Fees 63 103 (40) -38.8%
Corporate Franchise Tax & Fees 21 3 18 600.0%
Interest on State Funds & Investments 1 5 (4) -80.0%
Cook County IGT 0 0 0 N/A
Other Sources 32 14 18 128.6%
Subtotal $4,988 $3,312 $1,676 50.6%
Transfers
Lottery $75 $50 $25 50.0%
Riverboat transfers & receipts 0 0 0 N/A
Proceeds from Sale of 10th license 0 0 0 N/A
Refund Fund transfer 0 0 0 N/A
Other 64 29 35 120.7%
Total State Sources $5,127 $3,391 $1,736 51.2%
Federal Sources $553 $267 $286 107.1%
Total Federal & State Sources $5,680 $3,658 $2,022 55.3%
Nongeneral Funds Distributions/Direct Receipts:
Refund Fund
Personal Income Tax ($245) ($200) ($45) 22.5%
Corporate Income Tax (158) (52) (106) 203.8%
LGDF--Direct from PIT (150) (109) (41) 37.6%
LGDF--Direct from CIT (67) (20) (47) 235.0%
Downstate Pub/Trans--Direct from Sales (47) (43) (4) 9.3%
Subtotal General Funds $5,013 $3,234 $1,779 55.0%
Treasurer's Investments $0 $0 $0 N/A
Interfund Borrowing $0 $207 ($207) N/A
Short Term Borrowing $0 $0 $0 N/A
Total General Funds $5,013 $3,441 $1,572 45.7%
CGFA SOURCE: Office of the Comptroller: Some totals may not equal, due to rounding 3-May-21
AprilFY 2021 vs. FY 2020
($ million)

14
$ %
Revenue Sources FY 2021 FY 2020 CHANGE CHANGE
State Taxes
Personal Income Tax $20,834 $18,183 $2,651 14.6%
Corporate Income Tax (regular) 3,491 2,111 1,380 65.4%
Sales Taxes 7,912 7,383 529 7.2%
Public Utility Taxes (regular) 641 716 (75) -10.5%
Cigarette Tax 234 227 7 3.1%
Liquor Gallonage Taxes 150 149 1 0.7%
Vehicle Use Tax 30 22 8 36.4%
Inheritance Tax 399 226 173 76.5%
Insurance Taxes and Fees 409 326 83 25.5%
Corporate Franchise Tax & Fees 278 192 86 44.8%
Interest on State Funds & Investments 48 122 (74) -60.7%
Cook County IGT 244 150 94 62.7%
Other Sources 180 467 (287) -61.5%
Subtotal $34,850 $30,274 $4,576 15.1%
Transfers
Lottery $631 $485 $146 30.1%
Riverboat transfers & receipts 0 195 (195) -100.0%
Proceeds from Sale of 10th license 6 10 (4) -40.0%
Refund Fund transfer 281 617 (336) -54.5%
Other 407 851 (444) -52.2%
Total State Sources $36,175 $32,432 $3,743 11.5%
Federal Sources $4,327 $2,553 $1,774 69.5%
Total Federal & State Sources $40,502 $34,985 $5,517 15.8%
Nongeneral Funds Distributions/Direct Receipts:
Refund Fund
Personal Income Tax ($1,875) ($1,728) ($147) 8.5%
Corporate Income Tax (489) (301) (188) 62.5%
LGDF--Direct from PIT (1,149) (947) (202) 21.3%
LGDF--Direct from CIT (206) (118) (88) 74.6%
Downstate Pub/Trans--Direct from Sales (324) (352) 28 -8.0%
Subtotal General Funds $36,459 $31,539 $4,920 15.6%
Treasurer's Investments $400 $400 $0 0.0%
Interfund Borrowing $0 $462 ($462) N/A
Short Term Borrowing $1,998 $0 $1,998 N/A
Total General Funds $38,857 $32,401 $6,456 19.9%
CGFA SOURCE: Office of the Comptroller: Some totals may not equal, due to rounding 3-May-21
GENERAL FUNDS RECEIPTS: YEAR TO DATEFY 2021 vs. FY 2020
($ million)