may 2017 - american transportation research institute –...
TRANSCRIPT
May 2017
Cost of Congestion to the Trucking Industry: 2017 Update
Congestion Photos Courtesy of Doug Turnbull, WSB Radio

Cost of Congestion to the Trucking Industry: 2017 Update
May 2017
W. Ford Torrey, IV Research Associate
American Transportation Research Institute Atlanta, GA
950 N. Glebe Road, Suite 210 Arlington, Virginia 22203
www.atri-online.org

ATRI BOARD OF DIRECTORS
Judy McReynolds Chairman of the ATRI Board Chairman, President and CEO ArcBest Corporation Fort Smith, AR David S. Congdon Vice Chairman and CEO Old Dominion Freight Line Thomasville, NC Michael L. Ducker President and CEO FedEx Freight Memphis, TN Rich Freeland President and COO Cummins Inc. Columbus, IN Hugh H. Fugleberg President and COO Great West Casualty Company South Sioux City, NE Dave Huneryager President and CEO Tennessee Trucking Association Nashville, TN Derek Leathers President and CEO Werner Enterprises Omaha, NE Chris Lofgren President and CEO Schneider National, Inc. Green Bay, WI
Robert E. Low President and CEO Prime Inc. Springfield, MO Rich McArdle President UPS Freight Richmond, VA Jeffrey J. McCaig Chairman Trimac Transportation, Inc. Houston, TX Gregory L. Owen Head Coach and CEO Ability/ Tri-Modal Transportation Services Carson, CA Annette Sandberg President and CEO Transsafe Consulting, LLC Davenport, WA Rebecca M. Brewster President and COO American Transportation Research Institute Atlanta, GA Chris Spear President and CEO American Trucking Associations Arlington, VA

ATRI RESEARCH ADVISORY COMMITTEE
Scott Mugno, RAC Chairman Vice President, Safety, Sustainability and Vehicle Maintenance FedEx Ground
Jon Blackham Policy and Government Affairs Canadian Trucking Alliance
Amy Boerger Vice President, Sales Cummins, Inc.
Randy Boyles Senior Vice President, Mobile Strategy PeopleNet Bill Brown Manager of Fleet Telematics Southeastern Freight Lines Michael Conyngham Director of Research International Brotherhood of Teamsters Bob Costello Senior Vice President and Chief Economist American Trucking Associations Tom Cuthbertson Vice President, Regulatory Compliance Omnitracs, LLC Dennis Dellinger President Cargo Transporters Chip Duden Vice President, Strategic Business Analytics Werner Enterprises Paul J. Enos Chief Executive Officer Nevada Trucking Association
Scott George Chief Executive Officer TCW, Inc. Mike Golias Director for Research, Intermodal Freight Transportation Institute University of Memphis Stan Hampton Vice President of Driver Personnel J.B. Hunt Victor Hart Director of Safety DOT Transportation, Inc. Sanford Hodes Ryder System, Inc. Senior Vice President and Deputy General Counsel Ken Howden Director, 21st Century Truck Partnership U.S. Department of Energy Kelly Killingsworth VP of Inbound Transportation Wal-mart Stores, Inc. Victoria King VP Public Affairs UPS Dustin Koehl Vice President, Sales and Marketing Total Transportation of Mississippi Caroline Mays Director, Freight and International Trade Section Texas DOT Chris McLoughlin Cargo Risk Manager C.H. Robinson Worldwide, Inc.
Lisa Mullings President and CEO National Association of Truck Stop Operators Tom Murtha Senior Planner Chicago Metropolitan Agency for Planning Brenda Neville President Iowa Motor Truck Association Dean Newell Vice President, Safety Maverick, Inc. Karen Rasmussen President and CEO HELP Inc. Wellington F. Roemer, III President and CEO Wellington F. Roemer Insurance, Inc. Mark Savage Deputy Chief Colorado State Patrol Andrea Sequin Director, Regulatory Services Schneider National, Inc. Carl Stebbins Corporate Director of Admissions and Marketing New England Tractor Trailer Training School Harold Sumerford, Jr. Chief Executive Officer J&M Tank Lines James E. Ward President and CEO D.M. Bowman Tom Weakley Director of Operations Owner-Operator Independent Drivers Association Foundation

3 Cost of Congestion to the Trucking Industry: 2017 Update
TABLE OF CONTENTS
LIST OF ACRONYMS ..................................................................................................... 5
INTRODUCTION ............................................................................................................. 6
NATIONAL HIGHWAY SYSTEM (NHS) ANALYSIS ...................................................... 8
National Level .................................................................................................................... 8
State Level ........................................................................................................................12
Metropolitan Level ...........................................................................................................16
County Level ....................................................................................................................20
LOCAL ROADS ANALYSIS ......................................................................................... 24
CONCLUSION .............................................................................................................. 25
APPENDIX A: DETAILED METHODOLOGY ............................................................... 26 Roadway Network ............................................................................................................26
Marginal Truck Travel Time Delay ..................................................................................29
Truck Speeds ............................................................................................................29
Free-flow Speed ........................................................................................................30
Congestion Threshold ..............................................................................................30
Travel Time Delay ......................................................................................................31
Estimating Truck Volumes ..............................................................................................32
Linking the FAF and NPMRDS Networks .................................................................33
Adjusting FAF Volume Estimates ............................................................................33
Calculating Total Delay and Cost ....................................................................................36
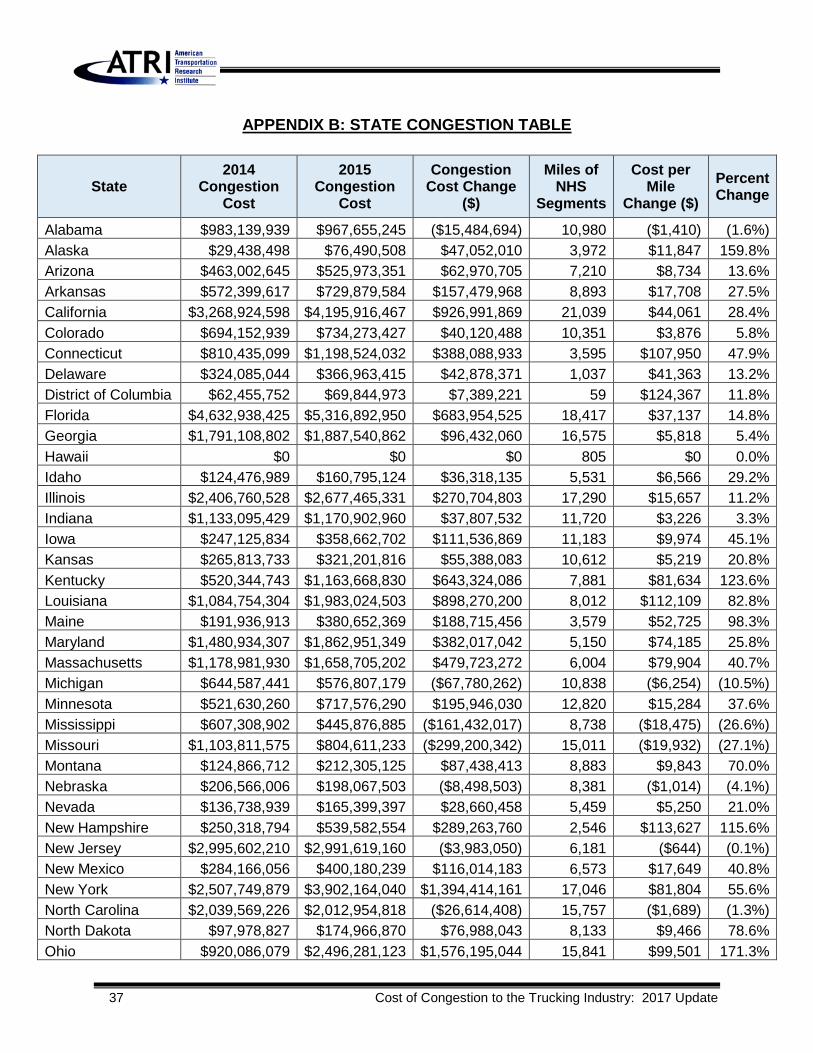
APPENDIX B: STATE CONGESTION TABLE ............................................................ 37

Cost of Congestion to the Trucking Industry: 2017 Update 4
LIST OF TABLES
Table 1: Average Congestion Cost per Truck and VMT Changes, 2014-2015 .......... 8
Table 2: Cost and Mileage by Segment Network Intensity ...................................... 11 Table 3: Top Ten States by Total Cost of Congestion ............................................. 13
Table 4: Top Ten States Based on Cost per NHS Segment Mile ............................. 14
Table 5: Top Ten States with Largest Congestion Cost Increases ......................... 15
Table 6: States with Congestion Cost Decreases .................................................... 15 Table 7: Top Ten States with Largest Per-Mile Cost Increases ............................... 16
Table 8: States with Per-Mile Cost Decreases .......................................................... 16
Table 9: Top Ten Metropolitan Areas by Total Cost of Congestion ........................ 17
Table 10: Top Ten Metropolitan Areas Based on Cost per NHS Segment Mile ..... 17 Table 11: Top Ten Metropolitan Areas with Largest Congestion Cost Increases . 19
Table 12: Top Ten Metropolitan Areas with Largest per Mile Congestion Cost Increases ...................................................................................................................... 19
Table 13: Top Ten Counties by Total Cost of Congestion ....................................... 20 Table 14: Top Ten Counties Based on Cost per NHS Segment Mile ...................... 21
Table 15: Top Ten Counties with Largest Congestion Cost Increases .................. 22
Table 16: Top Ten Counties with Largest Per-Mile Congestion Cost Increases.... 23 Table 17: Local Road Delay and Congestion Cost Change, 2014-2015 .................. 24
Table 18: Sample Cost of Congestion Database Information - ............................... 25
Table A1: NHS Roadway Network Statistics ............................................................. 28
Table A2: Local Roadway Network Statistics ........................................................... 28
LIST OF FIGURES
Figure 1: Average Congestion Cost per Truck Based on Miles Driven, 2014-2015 . 9 Figure 2: Cost of Congestion by Month, 2014-2015 ................................................. 10
Figure 3: Percent Change in Congestion Costs from 2014 to 2015 ........................ 11
Figure 4: Cost of Congestion on a per Mile Basis .................................................... 12
Figure 5: State Share of Total Cost of Congestion ................................................... 13 Figure 6: Metropolitan Area Cost of Congestion on a per Mile Basis .................... 18
Figure 7: County Cost of Congestion on a per Mile Basis ...................................... 21
Figure A1: United States NPMRDS Roadway Network ............................................ 27
Figure A2: Example Segment - Establishing Congested Conditions ..................... 31 Figure A3: Example Segment - Establishing Marginal Delay Values ...................... 32
Figure A4: Example Segment - Hourly Truck Distribution ...................................... 35

5 Cost of Congestion to the Trucking Industry: 2017 Update
LIST OF ACRONYMS
AADTT Average Annual Daily Truck Traffic
ATRI American Transportation Research Institute
CBSA Core Based Statistical Areas
CPH Cost per Hour
EIA Energy Information Administration
ELD Electronic Logging Device
FAF Freight Analysis Framework
FAF4 Freight Analysis Framework Version 4
FHWA Federal Highway Administration
FPM Freight Performance Measures
GDP Gross Domestic Product
GMT Greenwich Mean Time
GPS Global Positioning System
IHS Interstate Highway System
MPH Miles per Hour
NDA Non-Disclosure Agreement
NHS National Highway System
NPMRDS National Performance Management Research Data Set
P&D Pick-up and Delivery
RAC Research Advisory Committee
TMC Traffic Management Channel
UDOT Utah Department of Transportation
US United States
VMT Vehicle Miles Traveled

Cost of Congestion to the Trucking Industry: 2017 Update 6
INTRODUCTION The trucking industry is uniquely impacted by the level of traffic congestion experienced on the United States (U.S.) roadway network. Congestion increases motor carrier operating costs through wasted fuel, increased labor costs, vehicle wear and tear, and puts additional stresses on professional drivers as available on-duty and drive hours are spent sitting in traffic – which anecdotally contributes to the truck driver shortage crisis. Secondary impacts include inflationary effects from inefficiencies in the nation’s supply chain as pick-up and delivery schedules are impacted by traffic delays. In 2014 the American Transportation Research Institute (ATRI) commenced research to quantify and monetize the impact of traffic congestion on the trucking industry using U.S. Interstate Highway System (IHS) data from 2012 and 2013.1 Building on this research, in 2016 ATRI re-examined congestion impacts on the industry using 2014 data.2 The primary tasks of the 2016 research included the development of a revised standardized methodology to facilitate the continual monitoring of congestion impacts on a year-over-year basis, and the establishment of 2014 as a base-year of comparison for future iterations of the study. This methodology was subsequently submitted through a rigorous academic peer review process by the Transportation Research Board of the National Academies of Sciences, and was selected for publication as a verified methodological standard for congestion monitoring and monetization.3 Additionally, the continued growth of ATRI’s freight truck global positioning system (GPS) database facilitated an expanded analysis beyond the IHS to include the entire U.S. National Highway System (NHS). This 2017 report employs this standardized methodology and a revised, updated FHWA dataset to examine the level of congestion directly impacting the trucking industry using 2015 data.4 These data inputs include the revised Federal Highway Administration (FHWA) Freight Analysis Framework Version 4 (FAF4),5 FHWA’s National Performance Management Research Data Set (NPMRDS) Version 2015Q4, ATRI commercial motor vehicle GPS data from 2015, and ATRI’s 2015 national average operational cost of trucking.6
1 Pierce, Dave and Dan Murray. Cost of Congestion to the Trucking Industry. American Transportation Research Institute. Arlington, Virginia. April 2014. 2 Torrey, W. Ford. Estimating the Cost of Congestion to the Trucking Industry. American Transportation Research Institute. Arlington, Virginia. April 2016. 3 Torrey, W. Ford. Estimating the Cost of Congestion to the Trucking Industry: Standardized Methodology for Congestion Monitoring and Monetization. Transportation Research Record: Journal of the Transportation Research Board, No. 2646, Transportation Research Board of the National Academies, Washington, D.C., 2017. DOI 10.3141/2646-07 (Forthcoming) 4 A detailed description of the methodology can be found in Appendix A of this report. 5 Available online: https://ops.fhwa.dot.gov/freight/freight_analysis/faf/ 6 Torrey, W. Ford and Dan Murray. An Analysis of the Operational Costs of Trucking: 2016 Update. American Transportation Research Institute. Arlington, Virginia. September 2016.

7 Cost of Congestion to the Trucking Industry: 2017 Update
While ATRI employed its standardized congestion methodology in this analysis, it is important to note that some changes observed in year-to-year figures are a consequence of the FHWA conversion from FAF v3 to FAF v4. That said, increases in work zones / road construction, urban truck miles, e-commerce growth and national vehicle registrations likely explain the plurality of congestion impacts. More specifically, some of the 2015 congestion impacts include:
• A dramatic increase in traffic incidents including a 3.8 percent increase in police- reported crashes7 and a 7.2 percent increase in fatalities from motor vehicle crashes on U.S. roadways, the largest percentage increase in nearly 50 years.8
• Annual U.S. Gross Domestic Product (GDP) growth of 2.596 percent.9 • Growth in e-commerce sales of 14.6 percent over 2014.10 • Weather impacts including the 2015 North American blizzard (also known as
Winter Storm Juno) which impacted the northeastern U.S. in January 2015. Similar to the previous year’s report, this 2017 analysis focuses on delay associated with weekday traffic congestion on the NHS, with a high-level analysis of local roads presented at the end of the report. The results of these analyses are compared to the 2014 benchmarks to identify congestion trends.
7 U.S. Department of Transportation. National Highway Traffic Safety Administration. 2015 Motor Vehicle Crashes: Overview. August 2016. 8 Ibid. 9The World Bank. GDP growth (annual %), United States. Seen on 05/15/17 at: http://data.worldbank.org/indicator/NY.GDP.MKTP.KD.ZG?locations=US 10 Zaroban, Stefany. U.S. e-commerce grows 14.6% in 2015. Digital Commerce 360. February 17, 2016. https://www.digitalcommerce360.com/2016/02/17/us-e-commerce-grows-146-2015/

Cost of Congestion to the Trucking Industry: 2017 Update 8
NATIONAL HIGHWAY SYSTEM (NHS) ANALYSIS National Level In 2015, the trucking industry experienced over 996 million hours of delay on the NHS as a result of traffic congestion. This delay is the equivalent of 362,243 commercial truck drivers sitting idle for an entire working year.11 Applying the 2015 national average operational cost per hour (CPH) of $63.70 equated to more than $63.4 billion in added industry operational costs due to congestion.12
Distributing this cost across the 11.2 million registered large trucks in the U.S.13 results in an average congestion cost per truck of $5,664. While the actual cost for any one truck is dependent on a variety of factors such as location of operation and operating sector, it is possible to extrapolate congestion delays on a per-truck basis using the number of miles driven annually. Using FHWA’s 2015 total truck vehicle miles traveled (VMT) figure14 and the 2015 total cost figure, congestion costs were calculated to increase by an average of $0.23 per VMT (Table 1).15
Table 1: Average Congestion Cost per Truck and VMT Changes, 2014-2015
2014 2015
Truck VMT 279,131,584,582 279,843,596,449
Registered Trucks 10,905,956 11,203,184
Average Congestion Cost per VMT $0.18 $0.23
Average Congestion Cost per Truck $4,546 $5,664
As depicted in Figure 1, the impact of congestion on marginal costs varied greatly depending on an individual truck’s VMT for the year. These figures ranged from an
11 A working year is defined as driving 11 hours a day, 5 days a week, for 50 weeks per year. 12 Torrey, W. Ford. An Analysis of the Operational Costs of Trucking: 2016 Update. American Transportation Research Institute. Arlington, Virginia. September 2016. 13 Table VM-1: Annual Vehicle Distance Traveled in Miles and Related Data by Highway Category and Vehicle Type – 2015. Highway Statistics Series 2015. U.S. Department of Transportation, Federal Highway Administration, Office of Highway Policy Information. January 2017. Available online: https://www.fhwa.dot.gov/policyinformation/statistics/2015/vm1.cfm 14 Ibid. 15 2015 𝑇𝑇𝑇𝑇𝑇𝑇𝑇𝑇𝑇𝑇 𝐶𝐶𝑇𝑇𝐶𝐶𝑇𝑇
2015 𝑇𝑇𝑇𝑇𝑇𝑇𝑇𝑇𝑇𝑇 𝑉𝑉𝑉𝑉𝑇𝑇= 𝐴𝐴𝐴𝐴𝐴𝐴𝐴𝐴𝐴𝐴𝐴𝐴𝐴𝐴 𝐶𝐶𝐶𝐶𝐶𝐶𝐶𝐶 𝑝𝑝𝐴𝐴𝐴𝐴 𝑉𝑉𝑉𝑉𝑉𝑉

9 Cost of Congestion to the Trucking Industry: 2017 Update
average of $5,668 for a truck traveling 25,000 miles to over $34,000 for a truck traveling 150,000 miles in 2015.
Figure 1: Average Congestion Cost per Truck Based on Miles Driven, 2014-2015
Similar to 2014, the first quarter of 2015 saw the lowest relative level of congestion, while the third quarter saw the highest before declining slightly in the fourth quarter (Figure 2). This is consistent with steady U.S. Gross Domestic Product (GDP) growth in the first through third quarters of 2015 with a lower level of growth in the fourth quarter.16
16 Table 1.1.1 Percent Change from Preceding Period in Real Gross Domestic Product. National Income and Product Accounts Tables. Bureau of Economic Analysis. U.S. Department of Commerce. Last Revised 30 March 2017. Available online: http://www.bea.gov/iTable/iTable.cfm?ReqID=9&step=1#reqid=9&step=1&isuri=1&903=1
$0.00
$5,000.00
$10,000.00
$15,000.00
$20,000.00
$25,000.00
$30,000.00
$35,000.00
25,000 50,000 75,000 100,000 125,000 150,000
Aver
age
Cong
estio
n Co
st p
er T
ruck
Miles Driven
2014 2015

Cost of Congestion to the Trucking Industry: 2017 Update 10
Figure 2: Cost of Congestion by Month, 2014-2015
In terms of congestion cost changes, the first quarter of 2015 experienced the highest level of increase over 2014. Further, when taking into account the percentage change from the previous year, the third quarter of 2015 saw the lowest level of cost increases, with July being the only month of 2015 experiencing a lower level of congestion than in 2014 (Figure 3). This is due to July being the month with the highest congestion in 2014, with 2015 congestion figures not reaching that level until March. Congestion costs then fell through August before returning to a similar level in September resulting in the slight year-over-year decrease seen in July.
$2,000,000,000
$2,500,000,000
$3,000,000,000
$3,500,000,000
$4,000,000,000
$4,500,000,000
$5,000,000,000
$5,500,000,000
$6,000,000,000
$6,500,000,000
11 Cost of Congestion to the Trucking Industry: 2017 Update
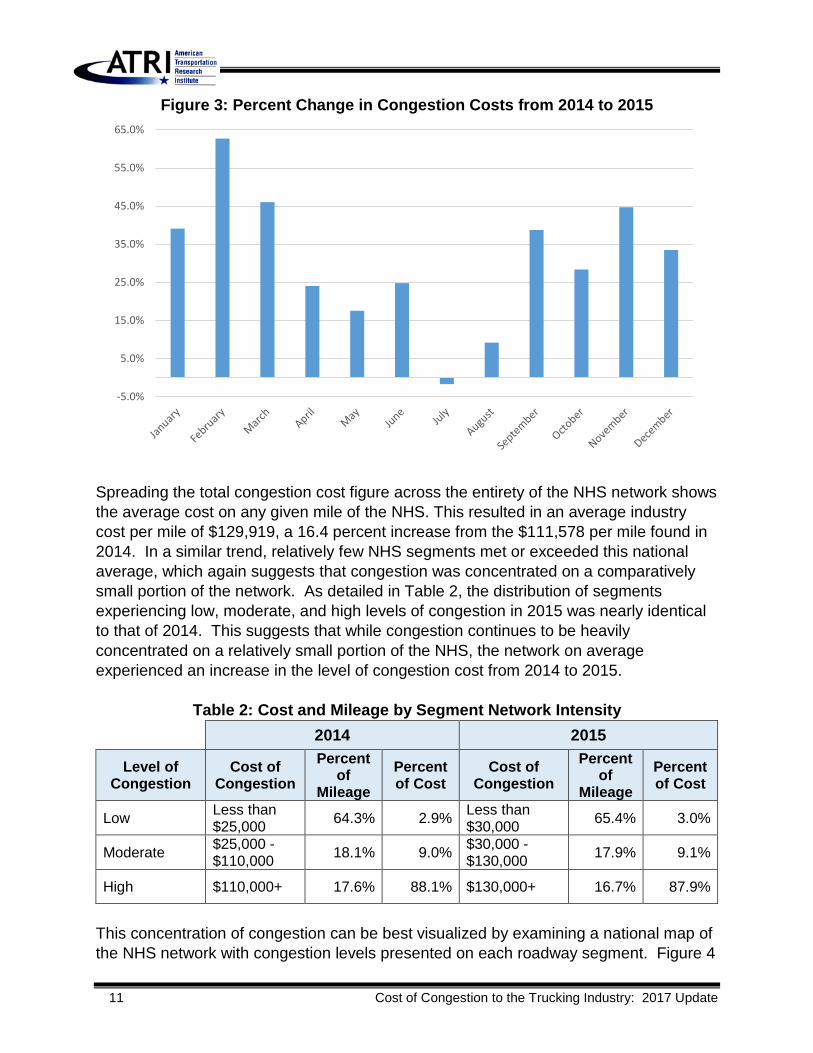
Figure 3: Percent Change in Congestion Costs from 2014 to 2015
Spreading the total congestion cost figure across the entirety of the NHS network shows the average cost on any given mile of the NHS. This resulted in an average industry cost per mile of $129,919, a 16.4 percent increase from the $111,578 per mile found in 2014. In a similar trend, relatively few NHS segments met or exceeded this national average, which again suggests that congestion was concentrated on a comparatively small portion of the network. As detailed in Table 2, the distribution of segments experiencing low, moderate, and high levels of congestion in 2015 was nearly identical to that of 2014. This suggests that while congestion continues to be heavily concentrated on a relatively small portion of the NHS, the network on average experienced an increase in the level of congestion cost from 2014 to 2015.
Table 2: Cost and Mileage by Segment Network Intensity 2014 2015
Level of Congestion
Cost of Congestion
Percent of
Mileage Percent of Cost
Cost of Congestion
Percent of
Mileage Percent of Cost
Low Less than $25,000 64.3% 2.9% Less than
$30,000 65.4% 3.0%
Moderate $25,000 - $110,000 18.1% 9.0% $30,000 -
$130,000 17.9% 9.1%
High $110,000+ 17.6% 88.1% $130,000+ 16.7% 87.9%
This concentration of congestion can be best visualized by examining a national map of the NHS network with congestion levels presented on each roadway segment. Figure 4
-5.0%
5.0%
15.0%
25.0%
35.0%
45.0%
55.0%
65.0%
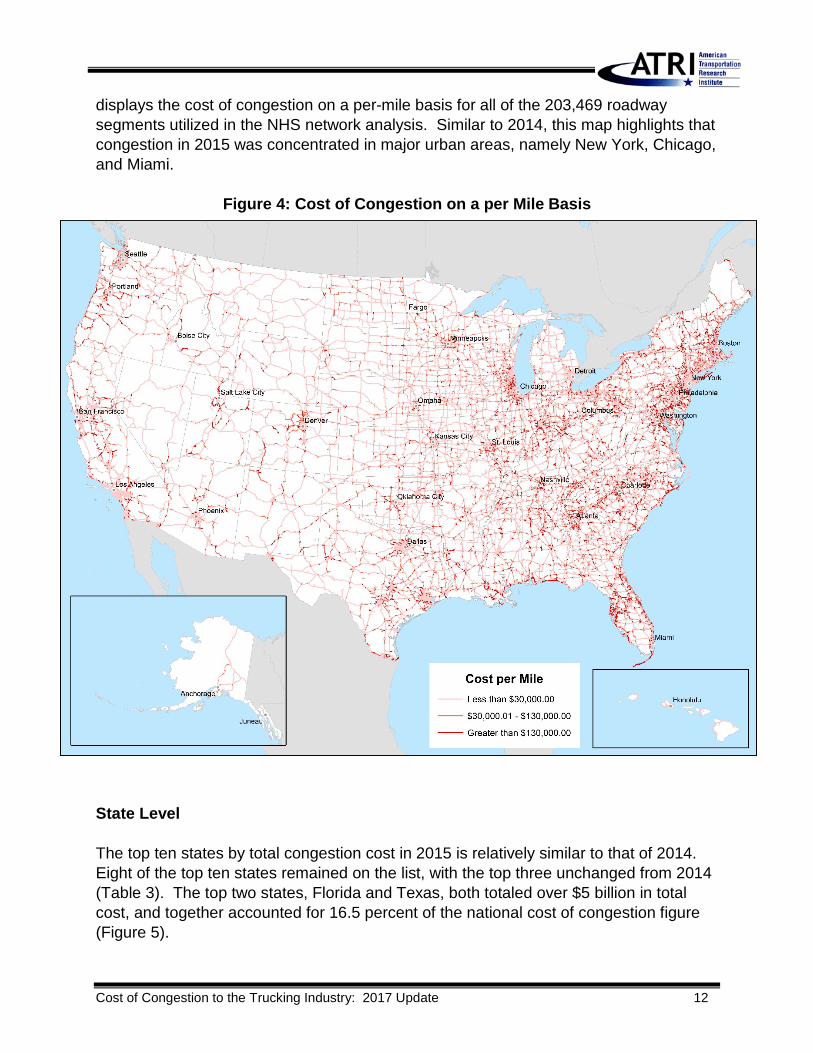
Cost of Congestion to the Trucking Industry: 2017 Update 12
displays the cost of congestion on a per-mile basis for all of the 203,469 roadway segments utilized in the NHS network analysis. Similar to 2014, this map highlights that congestion in 2015 was concentrated in major urban areas, namely New York, Chicago, and Miami.
Figure 4: Cost of Congestion on a per Mile Basis
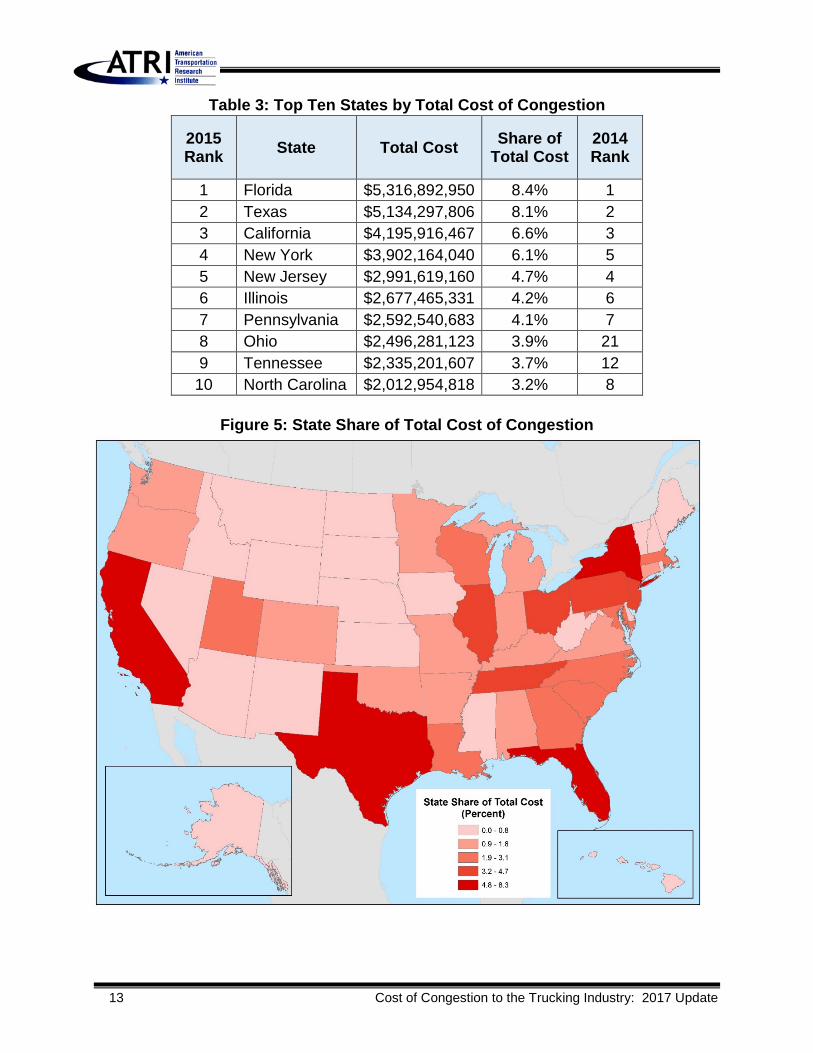
State Level The top ten states by total congestion cost in 2015 is relatively similar to that of 2014. Eight of the top ten states remained on the list, with the top three unchanged from 2014 (Table 3). The top two states, Florida and Texas, both totaled over $5 billion in total cost, and together accounted for 16.5 percent of the national cost of congestion figure (Figure 5).
13 Cost of Congestion to the Trucking Industry: 2017 Update
Table 3: Top Ten States by Total Cost of Congestion
2015 Rank State Total Cost Share of
Total Cost 2014 Rank
1 Florida $5,316,892,950 8.4% 1 2 Texas $5,134,297,806 8.1% 2 3 California $4,195,916,467 6.6% 3 4 New York $3,902,164,040 6.1% 5 5 New Jersey $2,991,619,160 4.7% 4 6 Illinois $2,677,465,331 4.2% 6 7 Pennsylvania $2,592,540,683 4.1% 7 8 Ohio $2,496,281,123 3.9% 21 9 Tennessee $2,335,201,607 3.7% 12
10 North Carolina $2,012,954,818 3.2% 8
Figure 5: State Share of Total Cost of Congestion
Cost of Congestion to the Trucking Industry: 2017 Update 14
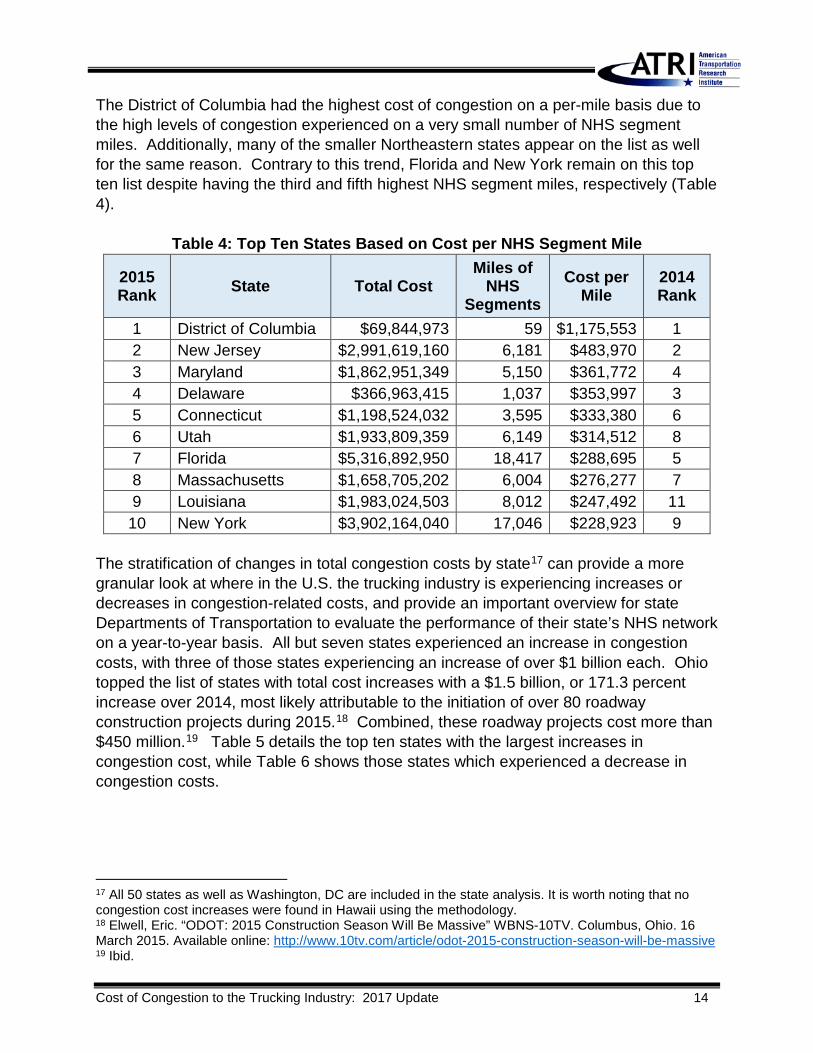
The District of Columbia had the highest cost of congestion on a per-mile basis due to the high levels of congestion experienced on a very small number of NHS segment miles. Additionally, many of the smaller Northeastern states appear on the list as well for the same reason. Contrary to this trend, Florida and New York remain on this top ten list despite having the third and fifth highest NHS segment miles, respectively (Table 4).
Table 4: Top Ten States Based on Cost per NHS Segment Mile
2015 Rank State Total Cost
Miles of NHS
Segments Cost per
Mile 2014 Rank
1 District of Columbia $69,844,973 59 $1,175,553 1 2 New Jersey $2,991,619,160 6,181 $483,970 2 3 Maryland $1,862,951,349 5,150 $361,772 4 4 Delaware $366,963,415 1,037 $353,997 3 5 Connecticut $1,198,524,032 3,595 $333,380 6 6 Utah $1,933,809,359 6,149 $314,512 8 7 Florida $5,316,892,950 18,417 $288,695 5 8 Massachusetts $1,658,705,202 6,004 $276,277 7 9 Louisiana $1,983,024,503 8,012 $247,492 11 10 New York $3,902,164,040 17,046 $228,923 9
The stratification of changes in total congestion costs by state17 can provide a more granular look at where in the U.S. the trucking industry is experiencing increases or decreases in congestion-related costs, and provide an important overview for state Departments of Transportation to evaluate the performance of their state’s NHS network on a year-to-year basis. All but seven states experienced an increase in congestion costs, with three of those states experiencing an increase of over $1 billion each. Ohio topped the list of states with total cost increases with a $1.5 billion, or 171.3 percent increase over 2014, most likely attributable to the initiation of over 80 roadway construction projects during 2015.18 Combined, these roadway projects cost more than $450 million.19 Table 5 details the top ten states with the largest increases in congestion cost, while Table 6 shows those states which experienced a decrease in congestion costs.
17 All 50 states as well as Washington, DC are included in the state analysis. It is worth noting that no congestion cost increases were found in Hawaii using the methodology. 18 Elwell, Eric. “ODOT: 2015 Construction Season Will Be Massive” WBNS-10TV. Columbus, Ohio. 16 March 2015. Available online: http://www.10tv.com/article/odot-2015-construction-season-will-be-massive 19 Ibid.

15 Cost of Congestion to the Trucking Industry: 2017 Update
Table 5: Top Ten States with Largest Congestion Cost Increases
State 2014
Congestion Cost
2015 Congestion
Cost Cost Increase Percent
Change
Ohio $920,086,079 $2,496,281,123 $1,576,195,044 171.3% New York $2,507,749,879 $3,902,164,040 $1,394,414,161 55.6% Texas $4,119,079,262 $5,134,297,806 $1,015,218,544 24.6% Tennessee $1,380,222,796 $2,335,201,607 $954,978,811 69.2% California $3,268,924,598 $4,195,916,467 $926,991,869 28.4% Louisiana $1,084,754,304 $1,983,024,503 $898,270,200 82.8% Utah $1,098,591,882 $1,933,809,359 $835,217,477 76.0% Florida $4,632,938,425 $5,316,892,950 $683,954,525 14.8% Kentucky $520,344,743 $1,163,668,830 $643,324,086 123.6% South Carolina $991,880,431 $1,616,651,678 $624,771,246 63.0%
Table 6: States with Congestion Cost Decreases
State 2014
Congestion Cost
2015 Congestion
Cost Cost
Decrease Percent Change
Missouri $1,103,811,575 $804,611,233 ($299,200,342) (27.1%) Mississippi $607,308,902 $445,876,885 ($161,432,017) (26.6%) Michigan $644,587,441 $576,807,179 ($67,780,262) (10.5%) North Carolina $2,039,569,226 $2,012,954,818 ($26,614,408) (1.3%) Alabama $983,139,939 $967,655,245 ($15,484,694) (1.6%) Nebraska $206,566,006 $198,067,503 ($8,498,503) (4.1%) New Jersey $2,995,602,210 $2,991,619,160 ($3,983,050) (0.1%)
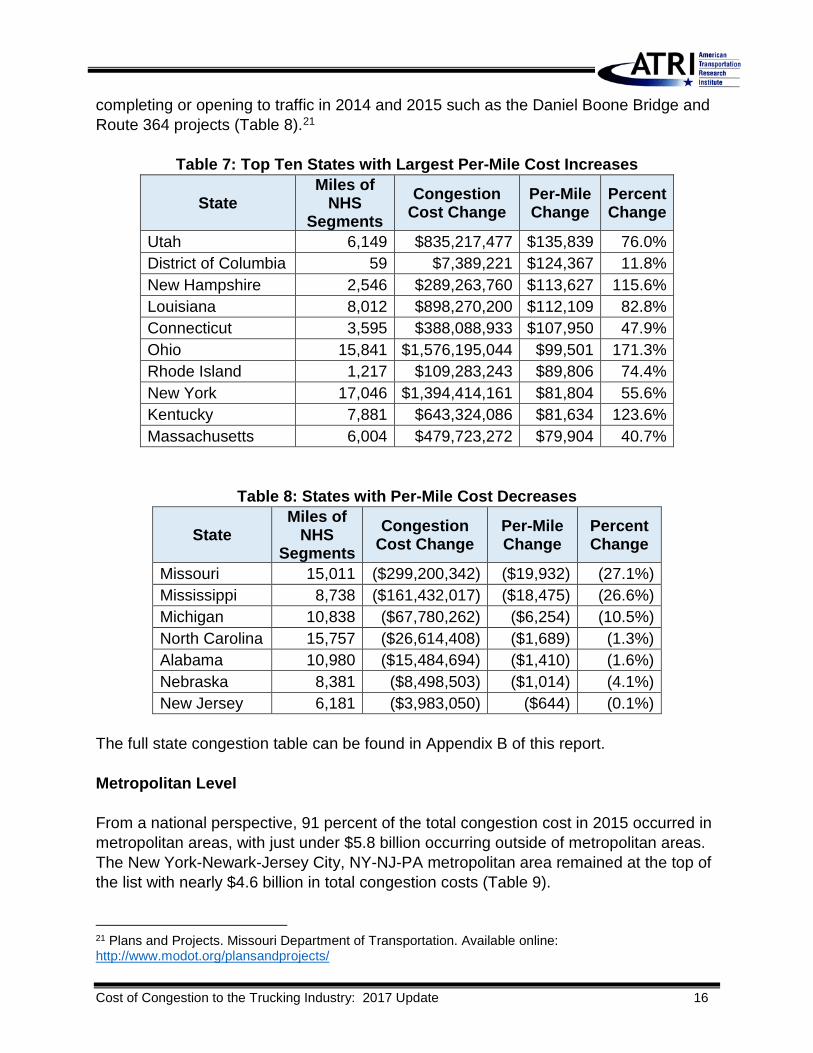
Normalizing total congestion cost changes on the number of NHS miles contained in each state helps to illustrate the level of congestion increase or decrease relative to the size of the state’s network – in turn highlighting the intensity of congestion changes experienced on each mile. Detailed in Table 7, five states saw an increase in industry-level per-mile costs of over $100,000, with Utah experiencing the largest per-mile increase; this is likely due to 13 of the state’s top 15 construction projects taking place on the NHS – nine of which commenced construction in 2015.20 Missouri experienced the largest per-mile decrease due to a number of construction projects on the NHS
20 “UDOT Release 2015 Top 15 Construction Projects.” Utah Department of Transportation. 27 February 2017. Available online: http://blog.udot.utah.gov/2015/02/udot-releases-2015-top-15-construction-projects-list/
Cost of Congestion to the Trucking Industry: 2017 Update 16
completing or opening to traffic in 2014 and 2015 such as the Daniel Boone Bridge and Route 364 projects (Table 8).21
Table 7: Top Ten States with Largest Per-Mile Cost Increases
State Miles of
NHS Segments
Congestion Cost Change
Per-Mile Change
Percent Change
Utah 6,149 $835,217,477 $135,839 76.0% District of Columbia 59 $7,389,221 $124,367 11.8% New Hampshire 2,546 $289,263,760 $113,627 115.6% Louisiana 8,012 $898,270,200 $112,109 82.8% Connecticut 3,595 $388,088,933 $107,950 47.9% Ohio 15,841 $1,576,195,044 $99,501 171.3% Rhode Island 1,217 $109,283,243 $89,806 74.4% New York 17,046 $1,394,414,161 $81,804 55.6% Kentucky 7,881 $643,324,086 $81,634 123.6% Massachusetts 6,004 $479,723,272 $79,904 40.7%
Table 8: States with Per-Mile Cost Decreases
State Miles of
NHS Segments
Congestion Cost Change
Per-Mile Change
Percent Change
Missouri 15,011 ($299,200,342) ($19,932) (27.1%) Mississippi 8,738 ($161,432,017) ($18,475) (26.6%) Michigan 10,838 ($67,780,262) ($6,254) (10.5%) North Carolina 15,757 ($26,614,408) ($1,689) (1.3%) Alabama 10,980 ($15,484,694) ($1,410) (1.6%) Nebraska 8,381 ($8,498,503) ($1,014) (4.1%) New Jersey 6,181 ($3,983,050) ($644) (0.1%)
The full state congestion table can be found in Appendix B of this report. Metropolitan Level From a national perspective, 91 percent of the total congestion cost in 2015 occurred in metropolitan areas, with just under $5.8 billion occurring outside of metropolitan areas. The New York-Newark-Jersey City, NY-NJ-PA metropolitan area remained at the top of the list with nearly $4.6 billion in total congestion costs (Table 9). 21 Plans and Projects. Missouri Department of Transportation. Available online: http://www.modot.org/plansandprojects/

17 Cost of Congestion to the Trucking Industry: 2017 Update
Table 9: Top Ten Metropolitan Areas by Total Cost of Congestion
Metropolitan Area Total Cost
New York-Newark-Jersey City, NY-NJ-PA $4,598,534,921 Chicago-Naperville-Elgin, IL-IN-WI $2,129,426,615 Miami-Fort Lauderdale-West Palm Beach, FL $2,088,975,347 Philadelphia-Camden-Wilmington, PA-NJ-DE-MD $1,612,401,048 Dallas-Fort Worth-Arlington, TX $1,309,858,490 Washington-Arlington-Alexandria, DC-VA-MD-WV $1,294,417,470 Los Angeles-Long Beach-Anaheim, CA $1,264,240,190 Houston-The Woodlands-Sugar Land, TX $1,157,412,013 Boston-Cambridge-Newton, MA-NH $1,041,298,825 Nashville-Davidson--Murfreesboro--Franklin, TN $957,836,945
Similar to the state level, calculating costs on a per-mile basis highlights how a lower level of total congestion cost can create a large impact on smaller metropolitan such as the Arkadelphia, AR metropolitan area containing only 83 NHS segment miles. Conversely, the New York-Newark-Jersey City, NY-NJ-PA metropolitan area remained on this list despite having the most NHS segment miles of all of the metropolitan areas analyzed (Table 10). Figure 6 shows the national picture of urban congestion a per-mile basis.
Table 10: Top Ten Metropolitan Areas Based on Cost per NHS Segment Mile
Metropolitan Area Total Cost Miles of
NHS Segments
Cost per Mile
Ogden-Clearfield, UT $566,605,679 619 $914,879 Arkadelphia, AR $74,026,714 83 $887,749 Miami-Fort Lauderdale-West Palm Beach, FL $2,088,975,347 2,430 $859,593 Bridgeport-Stamford-Norwalk, CT $453,779,062 562 $808,003 San Francisco-Oakland-Hayward, CA $619,759,262 948 $653,561 Provo-Orem, UT $355,354,957 558 $636,518 New York-Newark-Jersey City, NY-NJ-PA $4,598,534,921 7,299 $630,003 Los Angeles-Long Beach-Anaheim, CA $1,264,240,190 2,027 $623,682 Key West, FL $58,233,992 100 $584,517 Zanesville, OH $98,135,263 174 $562,979

Cost of Congestion to the Trucking Industry: 2017 Update 18
Figure 6: Metropolitan Area Cost of Congestion on a per Mile Basis
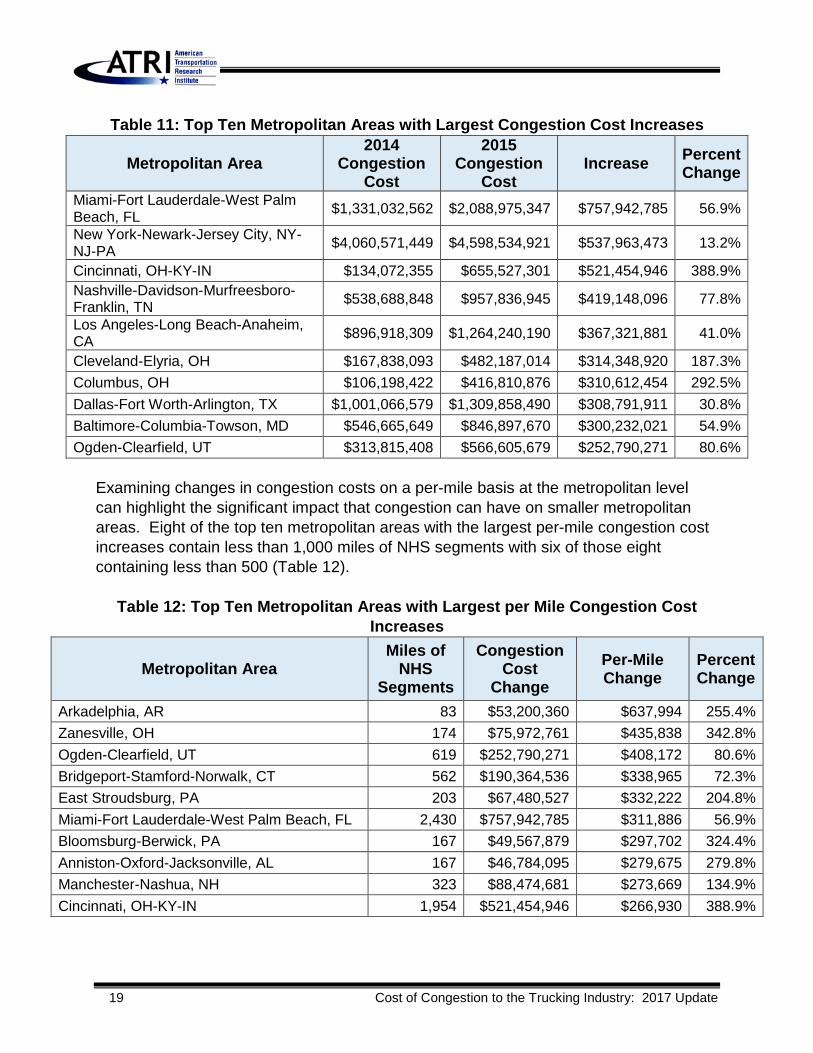
Of the $13.9 billion change in congestion costs in 2015, 76 percent occurred in urban areas. Analyzing congestion cost changes at this level can provide greater insight as to which areas of a state are driving the figures found in the state-level analysis. For example, the metropolitan area with the largest increase in total cost, Miami-Fort Lauderdale-West Palm Beach, FL, experienced a higher increase than the entire state of Florida, indicating some areas of Florida, both urban and rural, experienced decreases in congestion costs from 2014 to 2015. Additionally, three Ohio metropolitan areas are among the top ten in total congestion cost with the two metropolitan areas completely encompassed by the state, Cleveland-Elyria and Columbus, accounting for approximately 40 percent of the increase seen in Ohio (Table 11).
19 Cost of Congestion to the Trucking Industry: 2017 Update
Table 11: Top Ten Metropolitan Areas with Largest Congestion Cost Increases
Metropolitan Area 2014
Congestion Cost
2015 Congestion
Cost Increase Percent
Change Miami-Fort Lauderdale-West Palm Beach, FL $1,331,032,562 $2,088,975,347 $757,942,785 56.9%
New York-Newark-Jersey City, NY-NJ-PA $4,060,571,449 $4,598,534,921 $537,963,473 13.2%
Cincinnati, OH-KY-IN $134,072,355 $655,527,301 $521,454,946 388.9% Nashville-Davidson-Murfreesboro-Franklin, TN $538,688,848 $957,836,945 $419,148,096 77.8%
Los Angeles-Long Beach-Anaheim, CA $896,918,309 $1,264,240,190 $367,321,881 41.0%
Cleveland-Elyria, OH $167,838,093 $482,187,014 $314,348,920 187.3% Columbus, OH $106,198,422 $416,810,876 $310,612,454 292.5% Dallas-Fort Worth-Arlington, TX $1,001,066,579 $1,309,858,490 $308,791,911 30.8% Baltimore-Columbia-Towson, MD $546,665,649 $846,897,670 $300,232,021 54.9% Ogden-Clearfield, UT $313,815,408 $566,605,679 $252,790,271 80.6%
Examining changes in congestion costs on a per-mile basis at the metropolitan level can highlight the significant impact that congestion can have on smaller metropolitan areas. Eight of the top ten metropolitan areas with the largest per-mile congestion cost increases contain less than 1,000 miles of NHS segments with six of those eight containing less than 500 (Table 12).
Table 12: Top Ten Metropolitan Areas with Largest per Mile Congestion Cost Increases
Metropolitan Area Miles of
NHS Segments
Congestion Cost
Change Per-Mile Change
Percent Change
Arkadelphia, AR 83 $53,200,360 $637,994 255.4% Zanesville, OH 174 $75,972,761 $435,838 342.8% Ogden-Clearfield, UT 619 $252,790,271 $408,172 80.6% Bridgeport-Stamford-Norwalk, CT 562 $190,364,536 $338,965 72.3% East Stroudsburg, PA 203 $67,480,527 $332,222 204.8% Miami-Fort Lauderdale-West Palm Beach, FL 2,430 $757,942,785 $311,886 56.9% Bloomsburg-Berwick, PA 167 $49,567,879 $297,702 324.4% Anniston-Oxford-Jacksonville, AL 167 $46,784,095 $279,675 279.8% Manchester-Nashua, NH 323 $88,474,681 $273,669 134.9% Cincinnati, OH-KY-IN 1,954 $521,454,946 $266,930 388.9%

Cost of Congestion to the Trucking Industry: 2017 Update 20
Due to the large number of metropolitan areas examined in this analysis, the congestion figures for individual areas are not included in this report but are available upon request from ATRI. County Level As can be seen in Table 13, the counties experiencing the highest total cost of congestion were those within major metropolitan areas. Cook County, Illinois, the top county by this measure, was the only county to experience over $1 billion in congestion costs and reflects the concentration of congestion intensity in the Chicago-Naperville-Elgin, IL-IN-WI metropolitan area.
Table 13: Top Ten Counties by Total Cost of Congestion
County Total Cost
Cook, IL $1,093,167,039 Miami-Dade, FL $983,340,834 Los Angeles, CA $936,494,104 Broward, FL $727,989,748 Harris, TX $718,348,502 Davidson, TN $591,695,355 Suffolk, NY $521,676,935 Utah, UT $514,255,964 Baltimore, MD $493,292,583 Milwaukee, WI $483,573,326
Examining costs at the county level on a cost-per-NHS mile basis highlights the congestion intensity of the New York-Newark-Jersey City, NY-NJ-PA metropolitan area as the top four counties make up four of the five counties of New York City (Table 14). A national map of counties by per-mile cost of congestion creates a clear picture of how severe congestion tends to be fairly concentrated (Figure 7).

21 Cost of Congestion to the Trucking Industry: 2017 Update
Table 14: Top Ten Counties Based on Cost per NHS Segment Mile
County Total Cost Miles of
NHS Segments
Cost per Mile
New York, NY $112,354,094 43 $2,625,004 Bronx, NY $203,747,954 90 $2,251,827 Queens, NY $301,544,211 141 $2,135,774 Kings, NY $82,752,375 42 $1,973,159 Kenton, KY $194,276,737 105 $1,844,597 San Francisco, CA $100,768,690 64 $1,573,270 Hudson, NJ $225,591,094 144 $1,567,562 Weber, UT $284,159,049 185 $1,539,196 Davis, UT $266,826,163 195 $1,366,972 District of Columbia, DC $69,844,973 59 $1,175,553
Figure 7: County Cost of Congestion on a per Mile Basis

Cost of Congestion to the Trucking Industry: 2017 Update 22
While counties with the largest congestion cost increases are generally those within major metropolitan areas, analysis at the county level provides additional granularity into urban congestion issues. For example, 89.5 percent of the congestion cost increase seen in the 10-county Columbus, OH metropolitan area occurred in Franklin County, Ohio. This county completely encompasses the downtown Columbus area revealing how congestion is concentrated in one region of the metropolitan area. This level of analysis can also highlight the impact of roadway projects in non-metropolitan areas. For example, the increase seen in Worchester County, Massachusetts is likely the result of the I-290/Belmont Street Bridge Project which commenced construction in 2015.22 Table 15 details the top ten counties with the largest congestion cost increases.
Table 15: Top Ten Counties with Largest Congestion Cost Increases
County 2014
Congestion Cost
2015 Congestion
Cost Increase Percent
Change
Miami-Dade, FL $594,263,128 $983,340,834 $389,077,706 65.5% Davidson, TN $284,827,898 $591,695,355 $306,867,457 107.7% Los Angeles, CA $648,233,355 $936,494,104 $288,260,749 44.5% Broward, FL $441,008,444 $727,989,748 $286,981,304 65.1% Worcester, MA $120,709,149 $399,332,694 $278,623,544 230.8% Franklin, OH $47,100,770 $325,150,936 $278,050,166 590.3% Suffolk, NY $295,986,522 $521,676,935 $225,690,413 76.3% Baltimore, MD $278,292,861 $493,292,583 $214,999,722 77.3% Orange, NY $40,302,250 $245,797,211 $205,494,961 509.9% Salt Lake, UT $277,262,755 $476,894,725 $199,631,970 72.0%
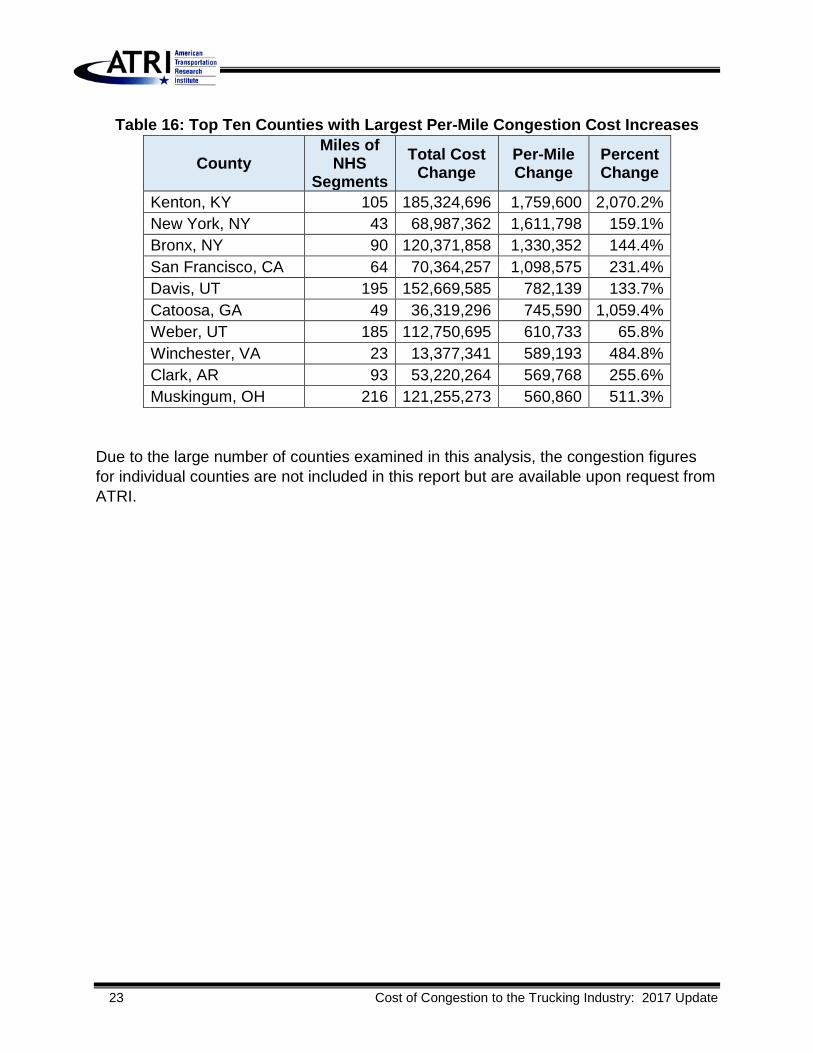
Examining county congestion cost increases on a per-mile basis can create an even more localized picture of urban congestion impacts. As can be seen in Table 16, the congestion increases in the Cincinnati, OH-KY-IN metropolitan area were highly concentrated in Kenton County, KY.
22 I-290/Belmont Street Bridge Project. Massachusetts Department of Transportation, Highway Division. Information available online: http://www.massdot.state.ma.us/highway/HighlightedProjects/I290BelmontStreetBridgeProject.aspx
23 Cost of Congestion to the Trucking Industry: 2017 Update
Table 16: Top Ten Counties with Largest Per-Mile Congestion Cost Increases
County Miles of
NHS Segments
Total Cost Change
Per-Mile Change
Percent Change
Kenton, KY 105 185,324,696 1,759,600 2,070.2% New York, NY 43 68,987,362 1,611,798 159.1% Bronx, NY 90 120,371,858 1,330,352 144.4% San Francisco, CA 64 70,364,257 1,098,575 231.4% Davis, UT 195 152,669,585 782,139 133.7% Catoosa, GA 49 36,319,296 745,590 1,059.4% Weber, UT 185 112,750,695 610,733 65.8% Winchester, VA 23 13,377,341 589,193 484.8% Clark, AR 93 53,220,264 569,768 255.6% Muskingum, OH 216 121,255,273 560,860 511.3%
Due to the large number of counties examined in this analysis, the congestion figures for individual counties are not included in this report but are available upon request from ATRI.

Cost of Congestion to the Trucking Industry: 2017 Update 24
LOCAL ROADS ANALYSIS As previously noted, congestion on the NHS network was the primary focus of this analysis, and will continue to be in future iterations of this study. This is due to the limited coverage of local roads in the NPMRDS network, as depicted in Figure A1 in Appendix A – making it difficult to standardize congestion on these roads for the purpose of year-over-year comparisons. Additionally, much of the congestion that was calculated on these roads using this report’s methodology could be due to activities such as local pick-up and delivery operations, or local repairs and maintenance using heavy duty equipment. As such, cost figures on local roads covered by the network are presented at a high level as supplemental information in this and future reports, and should be interpreted with caution. Given these caveats, the cost of congestion information relating to these roads elucidates the challenges involved in urban freight movements. The local roadway network is predominantly made up of low-speed and relatively short roadway segments in downtown urban areas, with only 22 percent of the segments having a length of over one mile, accounting for only 14 percent of the miles included in the entirety of the NPMRDS network. In 2015, this network experienced 797 million hours of delay (above and beyond the NHS congestion calculation of 996 million) – a 65.2 percent increase from the 483 million found in 2014. This is equivalent to 289,688 commercial drivers sitting idle for a work year on these roads. Applying the 2015 national average per-hour operating cost resulted in $50.7 billion in local road congestion costs (Table 17).
Table 17: Local Road Delay and Congestion Cost Change, 2014-2015
2014 2015 Increase Percent
Change Total Cost $32,837,170,351 $50,746,383,925 $17,909,213,573 54.5% Total Hours of Delay 482,265,423 796,641,983 314,376,560 65.2%
Due to the characteristics of this network, the vast majority of this cost occurred in urban areas with only 0.5 percent ($263 million) of the cost existing in rural areas. The Los Angeles-Long Beach-Anaheim, CA metropolitan area saw the largest increase in total cost on local roads of over $4.8 billion with $3.9 billion of that increase occurring in Los Angeles County.
25 Cost of Congestion to the Trucking Industry: 2017 Update
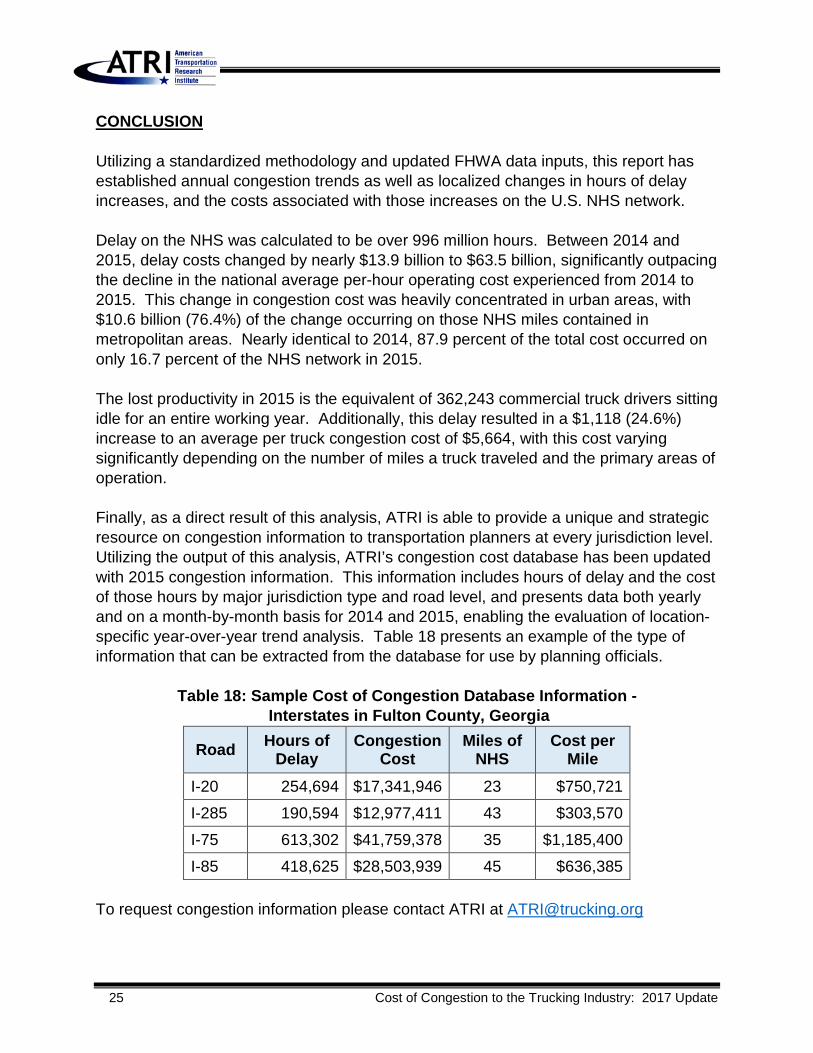
CONCLUSION Utilizing a standardized methodology and updated FHWA data inputs, this report has established annual congestion trends as well as localized changes in hours of delay increases, and the costs associated with those increases on the U.S. NHS network. Delay on the NHS was calculated to be over 996 million hours. Between 2014 and 2015, delay costs changed by nearly $13.9 billion to $63.5 billion, significantly outpacing the decline in the national average per-hour operating cost experienced from 2014 to 2015. This change in congestion cost was heavily concentrated in urban areas, with $10.6 billion (76.4%) of the change occurring on those NHS miles contained in metropolitan areas. Nearly identical to 2014, 87.9 percent of the total cost occurred on only 16.7 percent of the NHS network in 2015. The lost productivity in 2015 is the equivalent of 362,243 commercial truck drivers sitting idle for an entire working year. Additionally, this delay resulted in a $1,118 (24.6%) increase to an average per truck congestion cost of $5,664, with this cost varying significantly depending on the number of miles a truck traveled and the primary areas of operation. Finally, as a direct result of this analysis, ATRI is able to provide a unique and strategic resource on congestion information to transportation planners at every jurisdiction level. Utilizing the output of this analysis, ATRI’s congestion cost database has been updated with 2015 congestion information. This information includes hours of delay and the cost of those hours by major jurisdiction type and road level, and presents data both yearly and on a month-by-month basis for 2014 and 2015, enabling the evaluation of location-specific year-over-year trend analysis. Table 18 presents an example of the type of information that can be extracted from the database for use by planning officials.
Table 18: Sample Cost of Congestion Database Information - Interstates in Fulton County, Georgia
Road Hours of Delay
Congestion Cost
Miles of NHS
Cost per Mile
I-20 254,694 $17,341,946 23 $750,721
I-285 190,594 $12,977,411 43 $303,570
I-75 613,302 $41,759,378 35 $1,185,400
I-85 418,625 $28,503,939 45 $636,385 To request congestion information please contact ATRI at [email protected]

Cost of Congestion to the Trucking Industry: 2017 Update 26
APPENDIX A: DETAILED METHODOLOGY
Four data sources were used in this analysis to quantify the impact of traffic congestion on the trucking industry:
(1) Commercial truck travel times from the Federal Highway Administration (FHWA) National Performance Management Research Data Set (NPMRDS);
(2) Commercial truck volumes from FHWA’s Freight Analysis Framework v4 (FAF 4); (3) Commercial truck GPS data from ATRI’s Freight Performance Measures (FPM)
database; and (4) Industry financial data from ATRI’s annual An Analysis of the Operational Costs
of Trucking publication. Roadway Network The NPMRDS network, published as a shape file in each monthly iteration of the NPMRDS, was utilized as the foundational network in this analysis. The network is made up of over 319,000 bi-directional roadway segments, the bulk of which are located in the U.S. (with some segments falling in Canada, Mexico, and Puerto Rico). Each roadway segment is identified by a unique traffic management channel (TMC) code, and each TMC contains information on various jurisdiction levels (country, state, county), the length in miles of the segment, the road name, the road direction, the route type, and the latitude and longitude of the center of the segment. The first step in defining the roadway network was to extract only those TMCs corresponding to roads located within the 48 contiguous states as well as Alaska and Hawaii. This resulted in the network depicted in Figure A1.

27 Cost of Congestion to the Trucking Industry: 2017 Update
Figure A1: United States NPMRDS Roadway Network
Next, using a combination of the route type indicator and the road name, the NHS was defined and extracted from the full U.S. network for use in this analysis. This network consists of numbered interstate, federal, state, and county highways. Detailed in Table A1, this generated over 203,000 roadway segments, totaling over 488,000 bi-directional miles.
Cost of Congestion to the Trucking Industry: 2017 Update 28
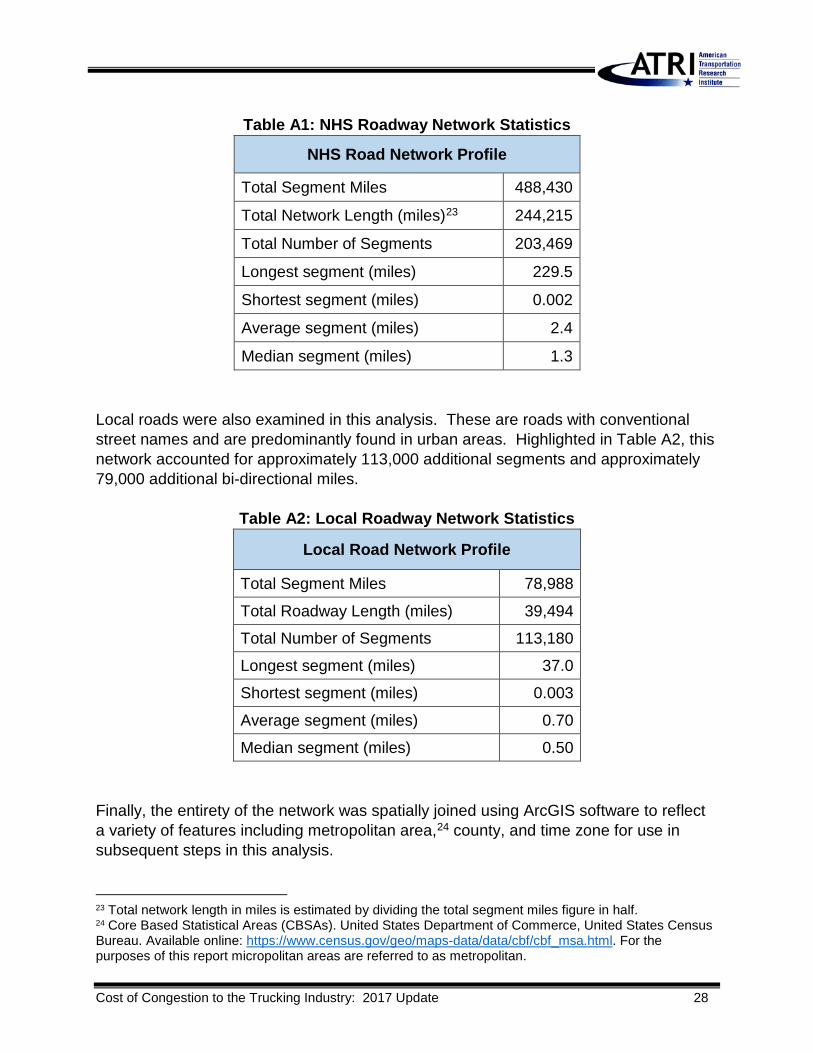
Table A1: NHS Roadway Network Statistics
NHS Road Network Profile
Total Segment Miles 488,430
Total Network Length (miles)23 244,215
Total Number of Segments 203,469
Longest segment (miles) 229.5
Shortest segment (miles) 0.002
Average segment (miles) 2.4
Median segment (miles) 1.3 Local roads were also examined in this analysis. These are roads with conventional street names and are predominantly found in urban areas. Highlighted in Table A2, this network accounted for approximately 113,000 additional segments and approximately 79,000 additional bi-directional miles.
Table A2: Local Roadway Network Statistics
Local Road Network Profile
Total Segment Miles 78,988
Total Roadway Length (miles) 39,494
Total Number of Segments 113,180
Longest segment (miles) 37.0
Shortest segment (miles) 0.003
Average segment (miles) 0.70
Median segment (miles) 0.50
Finally, the entirety of the network was spatially joined using ArcGIS software to reflect a variety of features including metropolitan area,24 county, and time zone for use in subsequent steps in this analysis. 23 Total network length in miles is estimated by dividing the total segment miles figure in half. 24 Core Based Statistical Areas (CBSAs). United States Department of Commerce, United States Census Bureau. Available online: https://www.census.gov/geo/maps-data/data/cbf/cbf_msa.html. For the purposes of this report micropolitan areas are referred to as metropolitan.

29 Cost of Congestion to the Trucking Industry: 2017 Update
Marginal Truck Travel Time Delay Truck Speeds New iterations of the NPMRDS are published each month and contain travel times in seconds for both passenger and commercial vehicles for each TMC across 288 five-minute epochs which correspond to a certain time of day on a particular day of the month. For example the average travel time for the 12:00-12:05 AM period corresponds to epoch 0. For the purposes of this analysis, the truck travel times were extracted from the full data set. Next, weekdays were extracted from the truck travel time dataset as the majority of truck traffic occurs during the week, and therefore are the days most impacted by congestion. Due to the nature of the NPMRDS, the five-minute travel times were aggregated into one-hour time periods yielding 24 average travel times in seconds for each roadway segment. The intent of this task is to reduce the impact of outliers and missing data. These average travel times were then converted from seconds to hours, and subsequently converted to speeds in miles-per-hour (MPH) using the distance corresponding to each TMC as follows:
𝐶𝐶𝐴𝐴𝐴𝐴𝐴𝐴𝑉𝑉𝑡𝑡𝑡𝑡𝐴𝐴�������������𝑇𝑇,ℎ,𝑚𝑚 = 1𝑛𝑛 ∗ ∑ 𝐶𝐶𝐴𝐴𝐴𝐴𝐴𝐴𝑉𝑉𝑡𝑡𝑡𝑡𝐴𝐴𝑇𝑇,𝑖𝑖,𝑚𝑚
𝑛𝑛𝑖𝑖=0
3600
𝐶𝐶𝑝𝑝𝐴𝐴𝐴𝐴𝑠𝑠��������𝑇𝑇,ℎ,𝑚𝑚 = 𝑠𝑠𝑡𝑡𝐶𝐶𝐶𝐶𝐴𝐴𝑛𝑛𝑑𝑑𝐴𝐴𝑇𝑇
𝐶𝐶𝐴𝐴𝐴𝐴𝐴𝐴𝑉𝑉𝑡𝑡𝑡𝑡𝐴𝐴�������������𝑇𝑇,ℎ,𝑚𝑚
Where: • 𝐶𝐶 is TMC; • ℎ is hour of the day; • 𝑡𝑡 is month of the year; • 𝑡𝑡 is epoch; • 𝑛𝑛 is the number of observations in an hour bin; • 𝐶𝐶𝐴𝐴𝐴𝐴𝐴𝐴𝑉𝑉𝑡𝑡𝑡𝑡𝐴𝐴�������������𝑇𝑇,ℎ,𝑚𝑚 is the calculated mean travel time in hours on TMC 𝐶𝐶 in hour bin ℎ
for month 𝑡𝑡; • 𝐶𝐶𝐴𝐴𝐴𝐴𝐴𝐴𝑉𝑉𝑡𝑡𝑡𝑡𝐴𝐴𝑇𝑇,𝑖𝑖,𝑚𝑚 is the travel time for TMC 𝐶𝐶 in epoch 𝑡𝑡 for month 𝑡𝑡; • 𝐶𝐶𝑝𝑝𝐴𝐴𝐴𝐴𝑠𝑠��������𝑇𝑇,ℎ,𝑚𝑚 is the calculated mean speed in MPH on TMC 𝐶𝐶 in hour bin ℎ for
month 𝑡𝑡; and • 𝑠𝑠𝑡𝑡𝐶𝐶𝐶𝐶𝐴𝐴𝑛𝑛𝑑𝑑𝐴𝐴𝑇𝑇 is the distance of TMC 𝐶𝐶 in miles.

Cost of Congestion to the Trucking Industry: 2017 Update 30
Free-flow Speed To facilitate the congestion level calculation, a free-flow speed was established for each roadway segment. While the posted speed limit of a particular segment can be used as free-flow speed, issues can arise with varying degrees of speed limit enforcement and truck speed governor usage. As such, the empirical speeds found by the above process were used in the establishment of a free-flow speed for each segment. First, a maximum speed of 80 MPH was set to further reduce the impact of outlier speeds. The fastest hourly speed was then found for each segment of each month resulting in 12 fastest speeds for each segment. Finally, the median of these 12 fastest speeds was set as the free-flow speed for the segment:
𝑓𝑓𝐴𝐴𝐴𝐴𝐴𝐴𝑓𝑓𝑓𝑓𝐶𝐶𝑓𝑓𝑇𝑇 = max 𝐶𝐶𝑝𝑝𝐴𝐴𝐴𝐴𝑠𝑠𝑇𝑇,𝑚𝑚������������� Where:
• 𝑓𝑓𝐴𝐴𝐴𝐴𝐴𝐴𝑓𝑓𝑓𝑓𝐶𝐶𝑓𝑓𝑇𝑇 is the calculated free flow speed for TMC 𝐶𝐶; and • max 𝐶𝐶𝑝𝑝𝐴𝐴𝐴𝐴𝑠𝑠𝑇𝑇,𝑚𝑚������������� is the median of the maximum average speeds for TMC 𝐶𝐶 in month
𝑡𝑡. Congestion Threshold Shown in Figure A2 below, a congestion threshold was calculated to flag instances of congestion. The congestion threshold was set at 90 percent of the identified free-flow speed as the trucking industry is generally flexible enough to adjust to minor congestion in daily operations. By using a more conservative threshold in calculating marginal delay, the results of the analysis provide a more accurate assessment of congestion that is having a noticeable impact on industry operations:
𝐶𝐶ℎ𝐴𝐴𝐴𝐴𝐶𝐶ℎ𝑇𝑇 = 𝑓𝑓𝐴𝐴𝐴𝐴𝐴𝐴𝑓𝑓𝑓𝑓𝐶𝐶𝑓𝑓𝑇𝑇 ∗ .90 Where:
• 𝐶𝐶ℎ𝐴𝐴𝐴𝐴𝐶𝐶ℎ𝑇𝑇 is the calculated congestion threshold for TMC 𝐶𝐶 in MPH.

31 Cost of Congestion to the Trucking Industry: 2017 Update
Figure A2: Example Segment - Establishing Congested Conditions
Travel Time Delay To quantify travel time delay, the observed speeds and congestion threshold speeds were first converted back to travel times in hours:
𝐶𝐶𝐴𝐴𝐴𝐴𝐴𝐴𝑉𝑉𝑡𝑡𝑡𝑡𝐴𝐴�������������𝑇𝑇,ℎ,𝑚𝑚 = 𝑠𝑠𝑡𝑡𝐶𝐶𝐶𝐶𝐴𝐴𝑛𝑛𝑑𝑑𝐴𝐴𝑇𝑇𝐶𝐶𝑝𝑝𝐴𝐴𝐴𝐴𝑠𝑠𝑇𝑇,ℎ,𝑚𝑚�������������
𝐶𝐶ℎ𝐴𝐴𝐴𝐴𝐶𝐶ℎ𝑇𝑇′ = 𝑠𝑠𝑡𝑡𝐶𝐶𝐶𝐶𝐴𝐴𝑛𝑛𝑑𝑑𝐴𝐴𝑇𝑇𝐶𝐶ℎ𝐴𝐴𝐴𝐴𝐶𝐶ℎ𝑇𝑇
Where: • 𝐶𝐶ℎ𝐴𝐴𝐴𝐴𝐶𝐶ℎ𝑇𝑇′ is the calculated congestion threshold travel time for TMC 𝐶𝐶 in hours.
The observed travel times were then compared to the congestion threshold to identify when congestion was present. In instances where congestion was present, the actual travel time was subtracted from the congestion threshold travel time to establish a marginal delay value (Figure A3):
𝑑𝑑𝐶𝐶𝑛𝑛𝐴𝐴𝑇𝑇,ℎ,𝑚𝑚 = 𝐶𝐶𝐴𝐴𝐴𝐴𝐴𝐴𝑉𝑉𝑡𝑡𝑡𝑡𝐴𝐴𝑇𝑇,ℎ,𝑚𝑚������������������ − 𝐶𝐶ℎ𝐴𝐴𝐴𝐴𝐶𝐶ℎ𝑇𝑇′ ↔ 𝐶𝐶𝐴𝐴𝐴𝐴𝐴𝐴𝑉𝑉𝑡𝑡𝑡𝑡𝐴𝐴𝑇𝑇,ℎ,𝑚𝑚������������������ > 𝐶𝐶ℎ𝐴𝐴𝐴𝐴𝐶𝐶ℎ𝑇𝑇′
0
10
20
30
40
50
60
Aver
age
Spee
d (M
PH)
Freeflow Speed (60 MPH)
Congestion Threshold (54 MPH)
NormalConditions
CongestedConditions

Cost of Congestion to the Trucking Industry: 2017 Update 32
Where:
• 𝑑𝑑𝐶𝐶𝑛𝑛𝐴𝐴𝑇𝑇,ℎ,𝑚𝑚 is the calculated travel time delay in hours for TMC 𝐶𝐶 in hour bin ℎ for month 𝑡𝑡.
This resulted in 24 marginal delay values for each segment in each month of 2015. If no delay was present at a particular time of a month, that hour bin received a delay value of zero.
Figure A3: Example Segment - Establishing Marginal Delay Values
Estimating Truck Volumes Marginal delay values can tell a very important story about the severity of congestion at a certain place and time, however truck volume data is needed in order to quantify the impact on the industry as a whole. This allows the analysis to account for the fact that two segments may have the same amount of marginal delay, but one segment is more heavily traveled by trucks than the other and therefore would result in a greater congestion impact on the industry.
0
0.02
0.04
0.06
0.08
0.1
0.12
0.14
0.16
Aver
age
Trav
el T
ime
(Hou
rs)
CongestionThreshold
UncongestedTravel Time
Travel Time Delay
33 Cost of Congestion to the Trucking Industry: 2017 Update
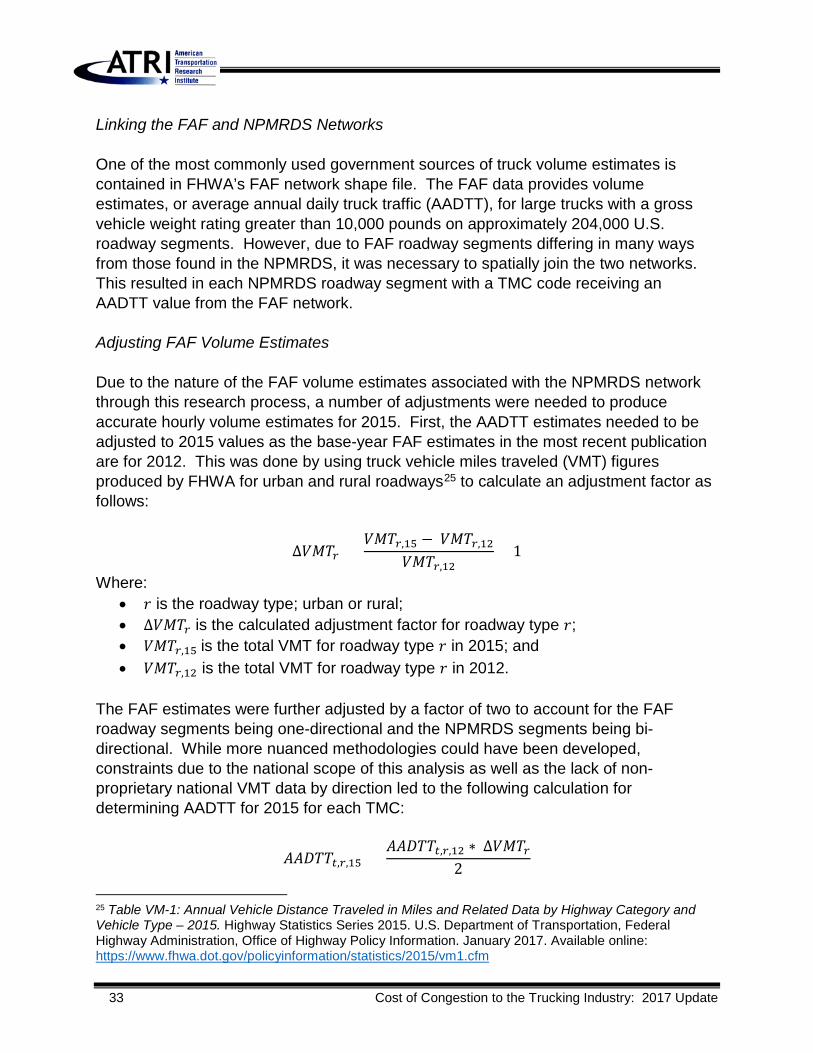
Linking the FAF and NPMRDS Networks One of the most commonly used government sources of truck volume estimates is contained in FHWA’s FAF network shape file. The FAF data provides volume estimates, or average annual daily truck traffic (AADTT), for large trucks with a gross vehicle weight rating greater than 10,000 pounds on approximately 204,000 U.S. roadway segments. However, due to FAF roadway segments differing in many ways from those found in the NPMRDS, it was necessary to spatially join the two networks. This resulted in each NPMRDS roadway segment with a TMC code receiving an AADTT value from the FAF network. Adjusting FAF Volume Estimates Due to the nature of the FAF volume estimates associated with the NPMRDS network through this research process, a number of adjustments were needed to produce accurate hourly volume estimates for 2015. First, the AADTT estimates needed to be adjusted to 2015 values as the base-year FAF estimates in the most recent publication are for 2012. This was done by using truck vehicle miles traveled (VMT) figures produced by FHWA for urban and rural roadways25 to calculate an adjustment factor as follows:
∆𝑉𝑉𝑉𝑉𝑉𝑉𝑇𝑇 = 𝑉𝑉𝑉𝑉𝑉𝑉𝑇𝑇,15 − 𝑉𝑉𝑉𝑉𝑉𝑉𝑇𝑇,12
𝑉𝑉𝑉𝑉𝑉𝑉𝑇𝑇,12+ 1
Where: • 𝐴𝐴 is the roadway type; urban or rural; • ∆𝑉𝑉𝑉𝑉𝑉𝑉𝑇𝑇 is the calculated adjustment factor for roadway type 𝐴𝐴; • 𝑉𝑉𝑉𝑉𝑉𝑉𝑇𝑇,15 is the total VMT for roadway type 𝐴𝐴 in 2015; and • 𝑉𝑉𝑉𝑉𝑉𝑉𝑇𝑇,12 is the total VMT for roadway type 𝐴𝐴 in 2012.
The FAF estimates were further adjusted by a factor of two to account for the FAF roadway segments being one-directional and the NPMRDS segments being bi-directional. While more nuanced methodologies could have been developed, constraints due to the national scope of this analysis as well as the lack of non-proprietary national VMT data by direction led to the following calculation for determining AADTT for 2015 for each TMC:
𝐴𝐴𝐴𝐴𝐴𝐴𝑉𝑉𝑉𝑉𝑇𝑇,𝑇𝑇,15 = 𝐴𝐴𝐴𝐴𝐴𝐴𝑉𝑉𝑉𝑉𝑇𝑇,𝑇𝑇,12 ∗ ∆𝑉𝑉𝑉𝑉𝑉𝑉𝑇𝑇
2
25 Table VM-1: Annual Vehicle Distance Traveled in Miles and Related Data by Highway Category and Vehicle Type – 2015. Highway Statistics Series 2015. U.S. Department of Transportation, Federal Highway Administration, Office of Highway Policy Information. January 2017. Available online: https://www.fhwa.dot.gov/policyinformation/statistics/2015/vm1.cfm

Cost of Congestion to the Trucking Industry: 2017 Update 34
Where:
• 𝐶𝐶 is TMC segment; • 𝐴𝐴𝐴𝐴𝐴𝐴𝑉𝑉𝑉𝑉𝑇𝑇,𝑇𝑇,15 is the calculated AADTT for TMC 𝐶𝐶 with roadway type 𝐴𝐴 for 2015; and • 𝐴𝐴𝐴𝐴𝐴𝐴𝑉𝑉𝑉𝑉𝑇𝑇,𝑇𝑇,12 is AADTT for TMC 𝐶𝐶 with roadway type 𝐴𝐴 in 2012.
To account for seasonality, FHWA’s national volume statistics26 were used to estimate how total volume fluctuates seasonally. A monthly utilization factor was calculated for each month for urban and rural roadways by:
𝑢𝑢𝐶𝐶𝑡𝑡𝑓𝑓𝑚𝑚,𝑇𝑇 = 𝑉𝑉𝑉𝑉𝑇𝑇𝑚𝑚,𝑟𝑟,15𝑉𝑉𝑉𝑉𝑇𝑇𝑟𝑟,15
* 12
Where: • 𝑡𝑡 is month of the year; • 𝑢𝑢𝐶𝐶𝑡𝑡𝑓𝑓𝑚𝑚,𝑇𝑇 is the calculated monthly utility factor for month 𝑡𝑡 and roadway type 𝐴𝐴; • 𝑉𝑉𝑉𝑉𝑉𝑉𝑚𝑚,𝑇𝑇,15 is VMT for month 𝑡𝑡 and roadway type 𝐴𝐴 in 2015; and • 𝑉𝑉𝑉𝑉𝑉𝑉𝑇𝑇,15 is the total VMT for roadway type 𝐴𝐴 in 2015.
Due to the granularity of the NPMRDS, AADTT estimates needed to be distributed across the hours of the day for each month of the year. To perform this, ATRI’s proprietary truck GPS database was utilized. A five weekday sample of GPS data was extracted from each month of 2015. Each truck ping data point contains a unique truck identification code, a date/time stamp recorded in Greenwich Mean Time (GMT), a latitude/longitude location, a heading, and a spot speed; the total data sample used equated to approximately 1.25 billion truck GPS points. The NPMRDS network was then spatially joined with a U.S. time zone shape file27 resulting in each TMC receiving a time zone identifier. The truck GPS data was joined to this network which resulted in each GPS point receiving a TMC code and a time zone identifier. The date/time stamp of the GPS data was then converted from GMT to the time zone in which the point fell, and binned hourly. Finally, the hourly volume distribution for each TMC per month was found by (Figure A4):
𝑠𝑠𝑡𝑡𝐶𝐶𝐶𝐶𝑇𝑇,ℎ,𝑚𝑚 = 𝐶𝐶𝐴𝐴𝑢𝑢𝑑𝑑𝑡𝑡𝐶𝐶𝑇𝑇,ℎ,𝑚𝑚
𝐶𝐶𝐴𝐴𝑢𝑢𝑑𝑑𝑡𝑡𝐶𝐶𝑇𝑇,𝑚𝑚
26 Traffic Volume Trends. Table – 1. Estimated Individual Monthly Motor Vehicle Travel in the United States. U.S. Department of Transportation, Federal Highway Administration, Office of Highway Policy Information. December 2015. Available online: https://www.fhwa.dot.gov/policyinformation/travel_monitoring/15dectvt/15dectvt.pdf 27 Muller, Eric. A Shapefile of the TZ Timezones of the United States Version 2016b. Last data update: 5 July 2013. Available online: http://efele.net/maps/tz/us/

35 Cost of Congestion to the Trucking Industry: 2017 Update
Where:
• ℎ is hour of the day; • 𝑠𝑠𝑡𝑡𝐶𝐶𝐶𝐶𝑇𝑇,ℎ,𝑚𝑚 is the calculated volume distribution for TMC 𝐶𝐶 in hour bin ℎ for month 𝑡𝑡; • 𝐶𝐶𝐴𝐴𝑢𝑢𝑑𝑑𝑡𝑡𝐶𝐶𝑇𝑇,ℎ,𝑚𝑚 is the number of trucks on TMC 𝐶𝐶 in hour bin ℎ for month 𝑡𝑡; and • 𝐶𝐶𝐴𝐴𝑢𝑢𝑑𝑑𝑡𝑡𝐶𝐶𝑇𝑇,𝑚𝑚 is the total number of trucks on TMC 𝐶𝐶 for month 𝑡𝑡.
Figure A4: Example Segment - Hourly Truck Distribution
The volume estimates were then multiplied by a factor equal to the number of weekdays in a month given that this analysis focuses on weekday congestion. Incorporating this factor, the final volume estimates are calculated as:
𝐴𝐴𝐶𝐶𝑓𝑓𝑇𝑇,ℎ,𝑚𝑚,𝑇𝑇 = 𝐴𝐴𝐴𝐴𝐴𝐴𝑉𝑉𝑉𝑉𝑇𝑇,𝑇𝑇,15 ∗ 𝑢𝑢𝐶𝐶𝑡𝑡𝑓𝑓𝑚𝑚,𝑇𝑇 ∗ 𝑠𝑠𝑡𝑡𝐶𝐶𝐶𝐶𝑇𝑇,ℎ,𝑚𝑚 ∗ 𝑠𝑠𝐴𝐴𝑑𝑑𝐶𝐶𝑚𝑚
0
0.01
0.02
0.03
0.04
0.05
0.06
0.07
0.08
Prop
ortio
n of
Tru
ck V
olum
es
Cost of Congestion to the Trucking Industry: 2017 Update 36
Where:
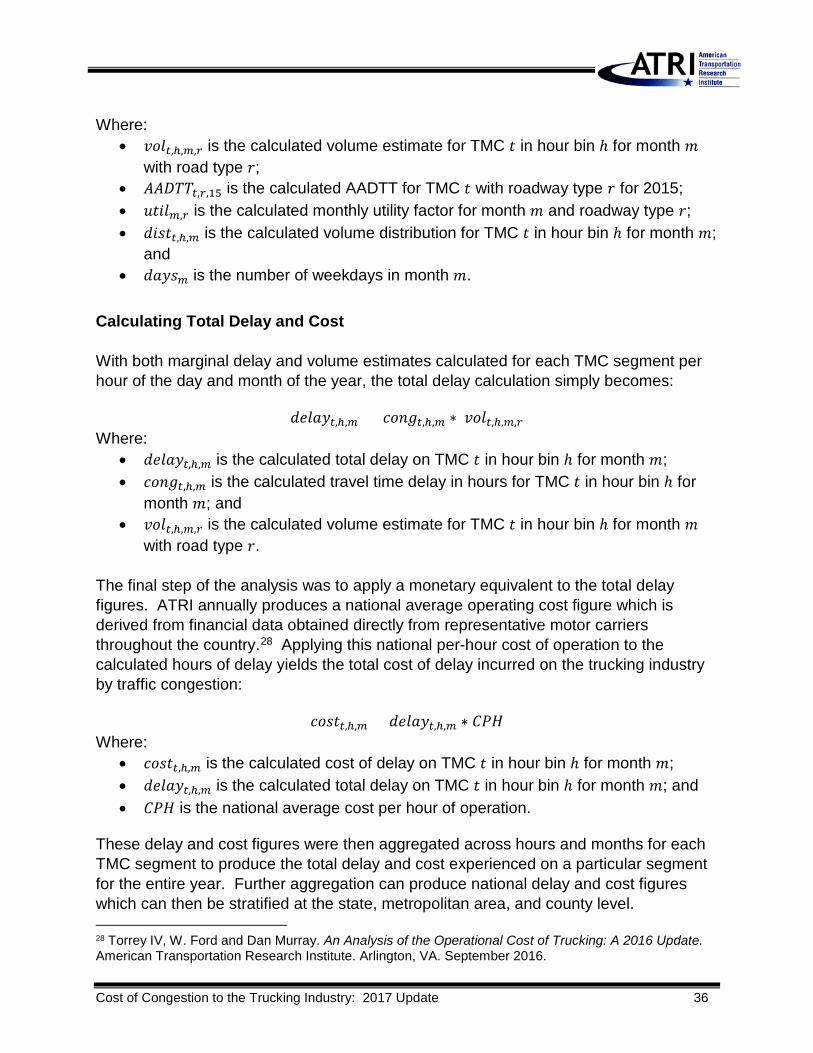
• 𝐴𝐴𝐶𝐶𝑓𝑓𝑇𝑇,ℎ,𝑚𝑚,𝑇𝑇 is the calculated volume estimate for TMC 𝐶𝐶 in hour bin ℎ for month 𝑡𝑡 with road type 𝐴𝐴;
• 𝐴𝐴𝐴𝐴𝐴𝐴𝑉𝑉𝑉𝑉𝑇𝑇,𝑇𝑇,15 is the calculated AADTT for TMC 𝐶𝐶 with roadway type 𝐴𝐴 for 2015; • 𝑢𝑢𝐶𝐶𝑡𝑡𝑓𝑓𝑚𝑚,𝑇𝑇 is the calculated monthly utility factor for month 𝑡𝑡 and roadway type 𝐴𝐴; • 𝑠𝑠𝑡𝑡𝐶𝐶𝐶𝐶𝑇𝑇,ℎ,𝑚𝑚 is the calculated volume distribution for TMC 𝐶𝐶 in hour bin ℎ for month 𝑡𝑡;
and • 𝑠𝑠𝐴𝐴𝑑𝑑𝐶𝐶𝑚𝑚 is the number of weekdays in month 𝑡𝑡.
Calculating Total Delay and Cost With both marginal delay and volume estimates calculated for each TMC segment per hour of the day and month of the year, the total delay calculation simply becomes:
𝑠𝑠𝐴𝐴𝑓𝑓𝐴𝐴𝑑𝑑𝑇𝑇,ℎ,𝑚𝑚 = 𝑑𝑑𝐶𝐶𝑛𝑛𝐴𝐴𝑇𝑇,ℎ,𝑚𝑚 ∗ 𝐴𝐴𝐶𝐶𝑓𝑓𝑇𝑇,ℎ,𝑚𝑚,𝑇𝑇 Where:
• 𝑠𝑠𝐴𝐴𝑓𝑓𝐴𝐴𝑑𝑑𝑇𝑇,ℎ,𝑚𝑚 is the calculated total delay on TMC 𝐶𝐶 in hour bin ℎ for month 𝑡𝑡; • 𝑑𝑑𝐶𝐶𝑛𝑛𝐴𝐴𝑇𝑇,ℎ,𝑚𝑚 is the calculated travel time delay in hours for TMC 𝐶𝐶 in hour bin ℎ for
month 𝑡𝑡; and • 𝐴𝐴𝐶𝐶𝑓𝑓𝑇𝑇,ℎ,𝑚𝑚,𝑇𝑇 is the calculated volume estimate for TMC 𝐶𝐶 in hour bin ℎ for month 𝑡𝑡
with road type 𝐴𝐴. The final step of the analysis was to apply a monetary equivalent to the total delay figures. ATRI annually produces a national average operating cost figure which is derived from financial data obtained directly from representative motor carriers throughout the country.28 Applying this national per-hour cost of operation to the calculated hours of delay yields the total cost of delay incurred on the trucking industry by traffic congestion:
𝑑𝑑𝐶𝐶𝐶𝐶𝐶𝐶𝑇𝑇,ℎ,𝑚𝑚 = 𝑠𝑠𝐴𝐴𝑓𝑓𝐴𝐴𝑑𝑑𝑇𝑇,ℎ,𝑚𝑚 ∗ 𝐶𝐶𝐶𝐶𝐶𝐶 Where:
• 𝑑𝑑𝐶𝐶𝐶𝐶𝐶𝐶𝑇𝑇,ℎ,𝑚𝑚 is the calculated cost of delay on TMC 𝐶𝐶 in hour bin ℎ for month 𝑡𝑡; • 𝑠𝑠𝐴𝐴𝑓𝑓𝐴𝐴𝑑𝑑𝑇𝑇,ℎ,𝑚𝑚 is the calculated total delay on TMC 𝐶𝐶 in hour bin ℎ for month 𝑡𝑡; and • 𝐶𝐶𝐶𝐶𝐶𝐶 is the national average cost per hour of operation.
These delay and cost figures were then aggregated across hours and months for each TMC segment to produce the total delay and cost experienced on a particular segment for the entire year. Further aggregation can produce national delay and cost figures which can then be stratified at the state, metropolitan area, and county level. 28 Torrey IV, W. Ford and Dan Murray. An Analysis of the Operational Cost of Trucking: A 2016 Update. American Transportation Research Institute. Arlington, VA. September 2016.
37 Cost of Congestion to the Trucking Industry: 2017 Update
APPENDIX B: STATE CONGESTION TABLE
State 2014
Congestion Cost
2015 Congestion
Cost
Congestion Cost Change
($)
Miles of NHS
Segments
Cost per Mile
Change ($) Percent Change
Alabama $983,139,939 $967,655,245 ($15,484,694) 10,980 ($1,410) (1.6%) Alaska $29,438,498 $76,490,508 $47,052,010 3,972 $11,847 159.8% Arizona $463,002,645 $525,973,351 $62,970,705 7,210 $8,734 13.6% Arkansas $572,399,617 $729,879,584 $157,479,968 8,893 $17,708 27.5% California $3,268,924,598 $4,195,916,467 $926,991,869 21,039 $44,061 28.4% Colorado $694,152,939 $734,273,427 $40,120,488 10,351 $3,876 5.8% Connecticut $810,435,099 $1,198,524,032 $388,088,933 3,595 $107,950 47.9% Delaware $324,085,044 $366,963,415 $42,878,371 1,037 $41,363 13.2% District of Columbia $62,455,752 $69,844,973 $7,389,221 59 $124,367 11.8% Florida $4,632,938,425 $5,316,892,950 $683,954,525 18,417 $37,137 14.8% Georgia $1,791,108,802 $1,887,540,862 $96,432,060 16,575 $5,818 5.4% Hawaii $0 $0 $0 805 $0 0.0% Idaho $124,476,989 $160,795,124 $36,318,135 5,531 $6,566 29.2% Illinois $2,406,760,528 $2,677,465,331 $270,704,803 17,290 $15,657 11.2% Indiana $1,133,095,429 $1,170,902,960 $37,807,532 11,720 $3,226 3.3% Iowa $247,125,834 $358,662,702 $111,536,869 11,183 $9,974 45.1% Kansas $265,813,733 $321,201,816 $55,388,083 10,612 $5,219 20.8% Kentucky $520,344,743 $1,163,668,830 $643,324,086 7,881 $81,634 123.6% Louisiana $1,084,754,304 $1,983,024,503 $898,270,200 8,012 $112,109 82.8% Maine $191,936,913 $380,652,369 $188,715,456 3,579 $52,725 98.3% Maryland $1,480,934,307 $1,862,951,349 $382,017,042 5,150 $74,185 25.8% Massachusetts $1,178,981,930 $1,658,705,202 $479,723,272 6,004 $79,904 40.7% Michigan $644,587,441 $576,807,179 ($67,780,262) 10,838 ($6,254) (10.5%) Minnesota $521,630,260 $717,576,290 $195,946,030 12,820 $15,284 37.6% Mississippi $607,308,902 $445,876,885 ($161,432,017) 8,738 ($18,475) (26.6%) Missouri $1,103,811,575 $804,611,233 ($299,200,342) 15,011 ($19,932) (27.1%) Montana $124,866,712 $212,305,125 $87,438,413 8,883 $9,843 70.0% Nebraska $206,566,006 $198,067,503 ($8,498,503) 8,381 ($1,014) (4.1%) Nevada $136,738,939 $165,399,397 $28,660,458 5,459 $5,250 21.0% New Hampshire $250,318,794 $539,582,554 $289,263,760 2,546 $113,627 115.6% New Jersey $2,995,602,210 $2,991,619,160 ($3,983,050) 6,181 ($644) (0.1%) New Mexico $284,166,056 $400,180,239 $116,014,183 6,573 $17,649 40.8% New York $2,507,749,879 $3,902,164,040 $1,394,414,161 17,046 $81,804 55.6% North Carolina $2,039,569,226 $2,012,954,818 ($26,614,408) 15,757 ($1,689) (1.3%) North Dakota $97,978,827 $174,966,870 $76,988,043 8,133 $9,466 78.6% Ohio $920,086,079 $2,496,281,123 $1,576,195,044 15,841 $99,501 171.3%

Cost of Congestion to the Trucking Industry: 2017 Update 38
State 2014
Congestion Cost
2015 Congestion
Cost
Congestion Cost Change
($)
Miles of NHS
Segments
Cost per Mile
Change ($) Percent Change
Oklahoma $407,191,879 $578,860,714 $171,668,836 9,721 $17,660 42.2% Oregon $578,553,721 $769,020,635 $190,466,914 9,200 $20,703 32.9% Pennsylvania $2,161,880,916 $2,592,540,683 $430,659,767 16,140 $26,682 19.9% Rhode Island $146,901,988 $256,185,231 $109,283,243 1,217 $89,806 74.4% South Carolina $991,880,431 $1,616,651,678 $624,771,246 9,113 $68,555 63.0% South Dakota $88,683,344 $195,313,089 $106,629,745 8,172 $13,048 120.2% Tennessee $1,380,222,796 $2,335,201,607 $954,978,811 12,554 $76,072 69.2% Texas $4,119,079,262 $5,134,297,806 $1,015,218,544 37,412 $27,136 24.6% Utah $1,098,591,882 $1,933,809,359 $835,217,477 6,149 $135,839 76.0% Vermont $93,835,564 $160,758,317 $66,922,753 2,016 $33,192 71.3% Virginia $1,189,866,723 $1,198,827,556 $8,960,833 10,250 $874 0.8% Washington $674,667,309 $943,370,496 $268,703,187 8,048 $33,390 39.8% West Virginia $316,877,468 $421,644,647 $104,767,180 4,759 $22,013 33.1% Wisconsin $1,526,754,282 $1,744,779,098 $218,024,816 14,686 $14,846 14.3% Wyoming $96,882,596 $128,719,596 $31,837,000 6,892 $4,619 32.9%

May 2017
Cost of Congestion to the Trucking Industry: 2017 Update
Traffic Photos Courtesy of Doug Turnbull, WSB Radio