3. costof congestion - wordpress.com · 3. costof congestion 3.1 vehicle operating cost the vehicle...
TRANSCRIPT

9
Economic Impact of Traffic Congestion in Metro Manila
3. COSTOF CONGESTION
3.1 Vehicle Operating Cost
The vehicle operating cost, or VOC is a monetary measure for direct costsincurred during the usage or operation of the motor vehicle. The VOCvaries according to various factors like vehicle type and age, speed, grade,traffic conditions and curvature. There are three components of the VOC,namely:
Distance Dependent Operating Costs - increase more or less directly withthe distance driven; in other words, the cost per vehicle-kilometer isrelatively constant (e.g. fuel, ties, oil, maintenance and repairs, and thatportion of depreciation attributable to wearing out)
Speed Dependent Operating Costs - some operating costs that aredistance-dependent as influenced by speed
Time Dependent Costs - vary with time and are constant over a givenperiod such as one year, or as stated in costs per vehicle-kilometer, varywith the number of kilometer driven annually, for example, driver's licenseand registration fees, garage rent, insurance, and obsolescence
In the Halcrow-Fox report for the Metro Manila Urban TransportImprovement Project (MMURTRIP), a comparison between the DPWHmodel and its own model for the determination of VOC. It was pointed outregarding the DPWH model that "although the representative vehicles andtheir individual weighing vary from year to year, the other key assumptionsare not varied (e.g. vehicle occupancy)". It was likewise indicated thatusing the DPWH model, it is be difficult to assign new vehicle types,particularly the Tamaraw FX, presently referred to as pooled taxi, to aspecific category.
It was reported that the DPWH model generates costs per vehiclekilometer and per vehicle hour for free flow traffic running on an open road,with the following characteristics:
• a reasonably good paved surface, as found on a new paved asphaltconcrete (AC) surfaces;
• at least 6.0 m of carriage way width, with shoulder widths of 2.0 m ormore;
• gradients below 1%• design speed no less that 70 kml hr for cars and 60 kml hr for trucks• minimum roadside friction and traffic volumes, with no effect of driver
behavior (free flow conditions); and• average Filipino driver behavior
On the other hand, Halcrow-Fox introduced a resource-based modeloriginally prepared by the Pakistan National Transport Research Council. Itcontends that the model is sensitive to both the speed of travel and the

Economic Impact of Traffic Congestion in Metro Manila
quality of road surface. Likewise, the model can generate costs for ninevehicle types. However, it used accurate data for three type only - salooncar, heavy 2-axle truck and standard bus. A fourth vehicle type has beenadded to represent jeepneys, with the assumption that these haverelatively similar characteristics to a 'Ford Transit 1.5-tonne van'.
However, results of the validation show that using similar resourceassumptions, the differences tend to balance out. For trucks, for example,the Halcrow-Fox Model generates higher costs per kilometer than theDPWH model for oil, tyres and spare parts, but lower costs for fuel andmaintenance labor.
MMUTIS was able to establish vehicle operating costs for road-basedpublic and private transport surveyed in the MMUTIS study as shown inTable 5. It is noted that the results were almost the same as the DPWHfigures.
Table 5.Vehicle Operating Cost (VOC)
P/km P/h PI km PI hkml hour Public Private
o 4.757 25.35 3.268 16.8810 4.197 40.25 2.849 23.68
2.284 26.9620 3.197 47.70 2.640 27.08
2.379 25.9330 3.730 50.84
2.342 24.7040 3.632 52.1350 3.670 52.78
2.422 22.3960 3.842 53.16 2.352 23.9070 4.103 53.61
2.805 21.6680 4.558 54.5090 5.339 56.33
2.562 21.43
The DPWH assumed that the working (business) time is valued at the fullrate plus employers' on costs, and commuting time is valued at 50% of thewage rate. The value of leisure time has not been considered by DPWH indetermining cost savings.
Source: MMUTIS Draft Final Report, 1999"distance-related vac (PI km)21time-related vac (pI hr)
3.2 Value of Time
On the other hand, the MMURTRIP has made an alternative assumption,in which all non-work trips (commuting and leisure) is valued in the sameway. There is some local evidence on willingness to pay for transportimprovements, but it is either corridor-specific, choice-specific, or based ona 'stated intention' survey, and is therefore inappropriate for use in a MetroManila-wide, multi-modal context.
10
11
Economic Impact of Traffic Congestion in Metro Manila
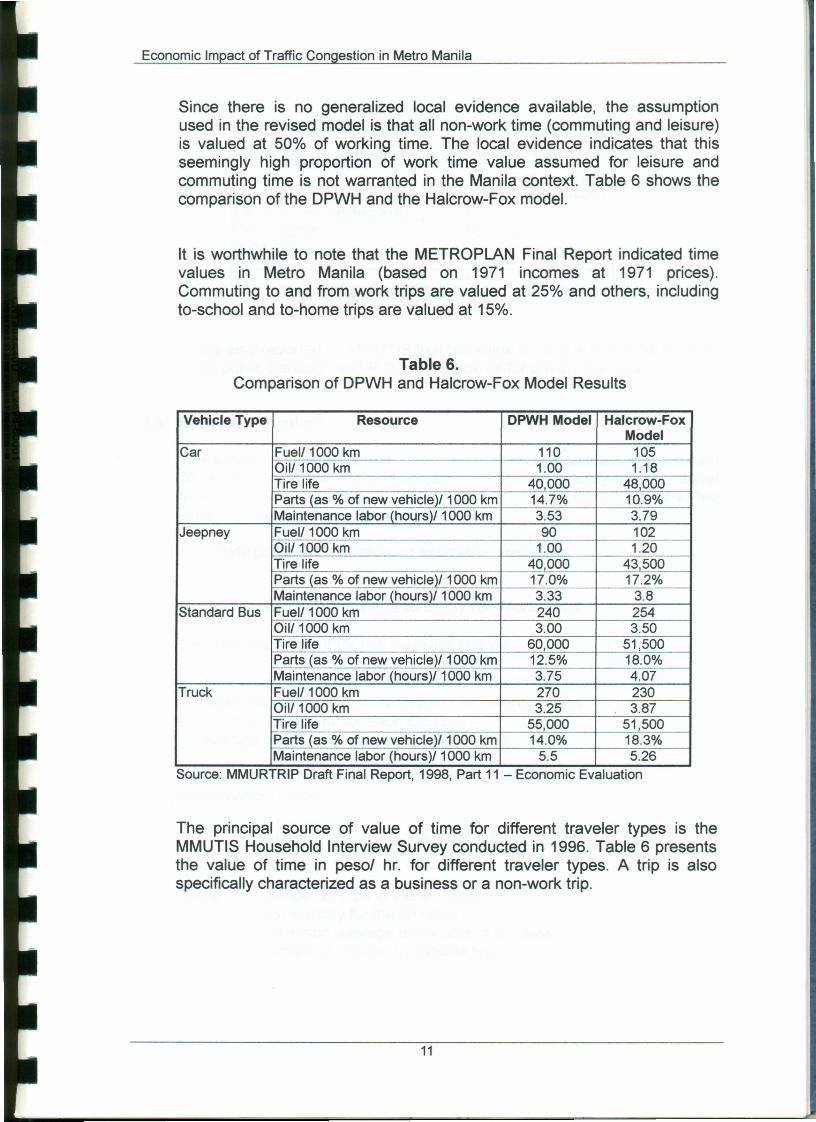
Since there is no generalized local evidence available, the assumptionused in the revised model is that all non-work time (commuting and leisure)is valued at 50% of working time. The local evidence indicates that thisseemingly high proportion of work time value assumed for leisure andcommuting time is not warranted in the Manila context. Table 6 shows thecomparison of the DPWH and the Halcrow-Fox model.
It is worthwhile to note that the METROPLAN Final Report indicated timevalues in Metro Manila (based on 1971 incomes at 1971 prices).Commuting to and from work trips are valued at 25% and others, includingto-school and to-home trips are valued at 15%.
Table 6.Comparison of DPWH and Halcrow-Fox Model Results
Vehicle Type Resource DPWH Model Halcrow-FoxModel
Car Fuell1000 km 110 105Oill1000 km 1.00 1.18Tire life 40,000 48,000Parts (as % of new vehicle)/1000 km 14.7% 10.9%Maintenance labor (hours)/1000 km 3.53 3.79
Jeepney Fuell1000 km 90 102Oill1000 km 1.00 1.20Tire life 40,000 43,500Parts (as % of new vehicle)/1000 km 17.0% 17.2%Maintenance labor (hours)/1000 km 3.33 3.8
Standard Bus Fuell1000 km 240 254Oill1000 km 3.00 3.50Tire life 60,000 51,500Parts (as % of new vehicle)/1000 km 12.5% 18.0%Maintenance labor (hours)/1000 km 3.75 4.07
Truck Fuell1000 km 270 230Oill1000 km 3.25 3.87Tire life 55,000 51,500Parts (as % of new vehicle)/1000 km 14.0% 18.3%Maintenance labor (hours)1 1000 km 5.5 5.26
Source: MMURTRIP Draft Final Report, 1998, Part 11 - Economic Evaluation
The principal source of value of time for different traveler types is theMMUTIS Household Interview Survey conducted in 1996. Table 6 presentsthe value of time in peso! hr. for different traveler types. A trip is alsospecifically characterized as a business or a non-work trip.
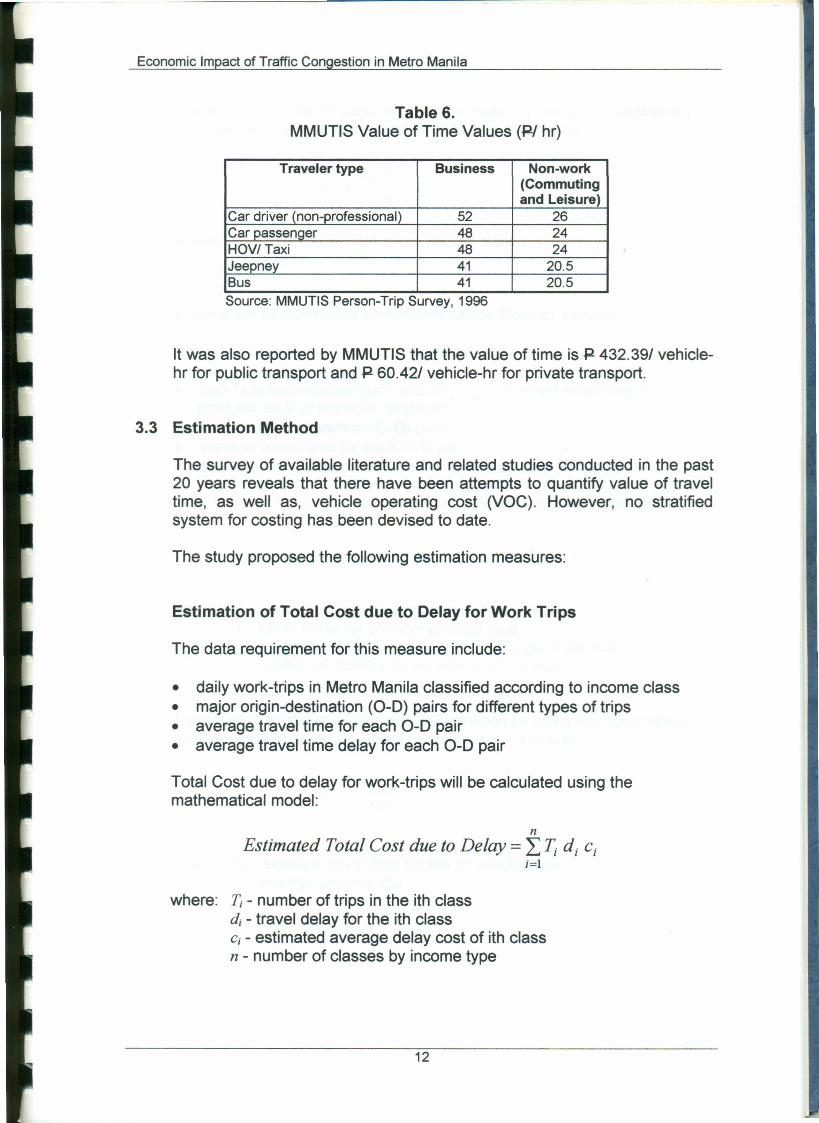
Table 6.MMUTIS Value of Time Values (PI hr)
Economic Impact of Traffic Congestion in Metro Manila
Traveler type Business Non-work(Commutingand Leisure)
Car driver (non-professional) 52 26Car passenger 48 24HOVITaxi 48 24Jeepney 41 20.5Bus 41 20.5Source: MMUTIS Person-Trip Survey, 1996
It was also reported by MMUTIS that the value of time is P 432.391 vehicle-hr for public transport and P 60.421 vehicle-hr for private transport.
3.3 Estimation Method
The survey of available literature and related studies conducted in the past20 years reveals that there have been attempts to quantify value of traveltime, as well as, vehicle operating cost (VOC). However, no stratifiedsystem for costing has been devised to date.
The study proposed the following estimation measures:
Estimation of Total Cost due to Delay for Work Trips
The data requirement for this measure include:
• daily work-trips in Metro Manila classified according to income class• major origin-destination (0-0) pairs for different types of trips• average travel time for each 0-0 pair• average travel time delay for each 0-0 pair
Total Cost due to delay for work-trips will be calculated using themathematical model:
nEstimated Total Cost due to Delay = L I: d, c,
i=l
where: T, - number of trips in the ith classd, - travel delay for the ith classc, - estimated average delay cost of ith classn - number of classes by income type
12
Economic Impact of Traffic Congestion in Metro Manila
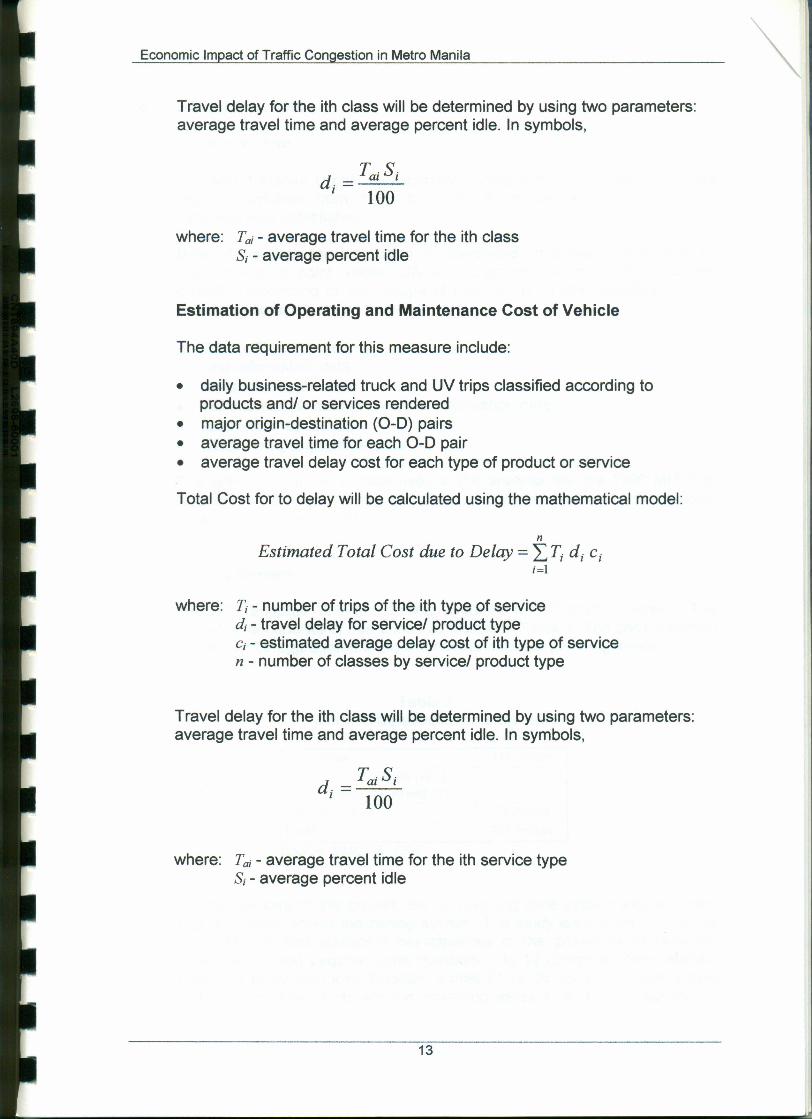
Travel delay for the ith class will be determined by using two parameters:average travel time and average percent idle. In symbols,
where: Tai - average travel time for the ith classS, - average percent idle
Estimation of Operating and Maintenance Cost of Vehicle
The data requirement for this measure include:
• daily business-related truck and UV trips classified according toproducts and! or services rendered
• major origin-destination (0-0) pairs• average travel time for each 0-0 pair• average travel delay cost for each type of product or service
Total Cost for to delay will be calculated using the mathematical model:
nEstimated Total Cost due to Delay = I,Ti d, c,
i=l
where: T. - number of trips of the ith type of serviced, - travel delay for service! product typec, - estimated average delay cost of ith type of servicen - number of classes by service! product type
Travel delay for the ith class will be determined by using two parameters:average travel time and average percent idle. In symbols,
where: Taj - average travel time for the ith service typeS, - average percent idle
13