maximizing reading gains to meet ayp targets: decision support analytics for school board providence...
TRANSCRIPT

Maximizing Reading Gains to Meet AYP Targets:
Decision Support Analytics for
School Board
Providence School District, RI
April 2014
22
Presentation Overview
• Analyzing District Reading
• Academic Improvement Recommendations
04/19/23 2
333
District Reading Achievement Data

Reading Challenge
04/19/23 4
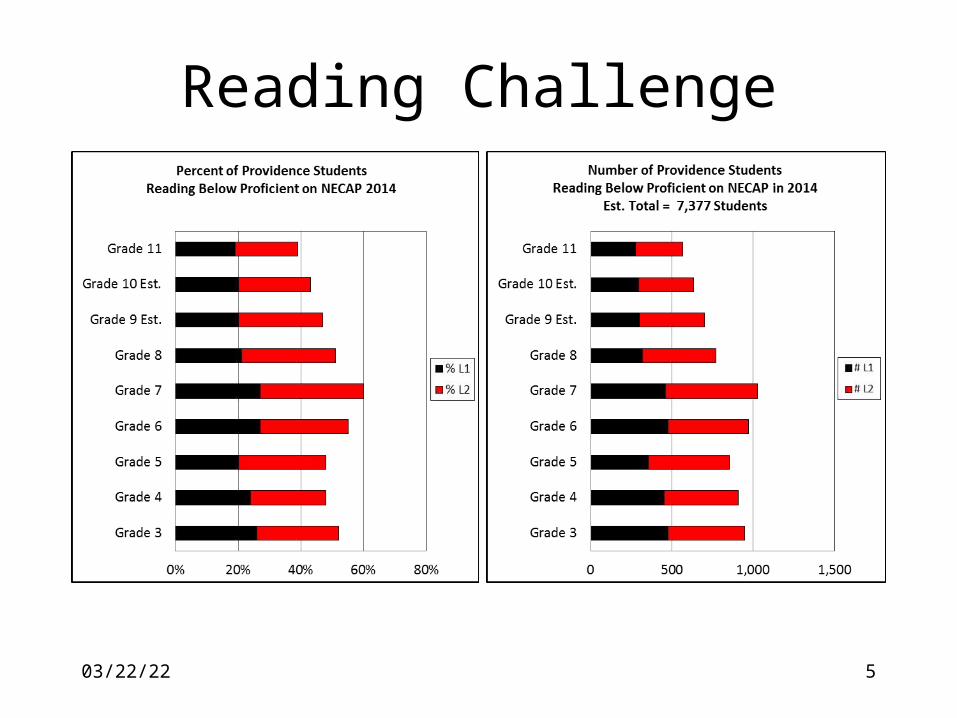
Reading Challenge
04/19/23 5

Reading Challenge
04/19/23 6

Reading Challenge
04/19/23 7
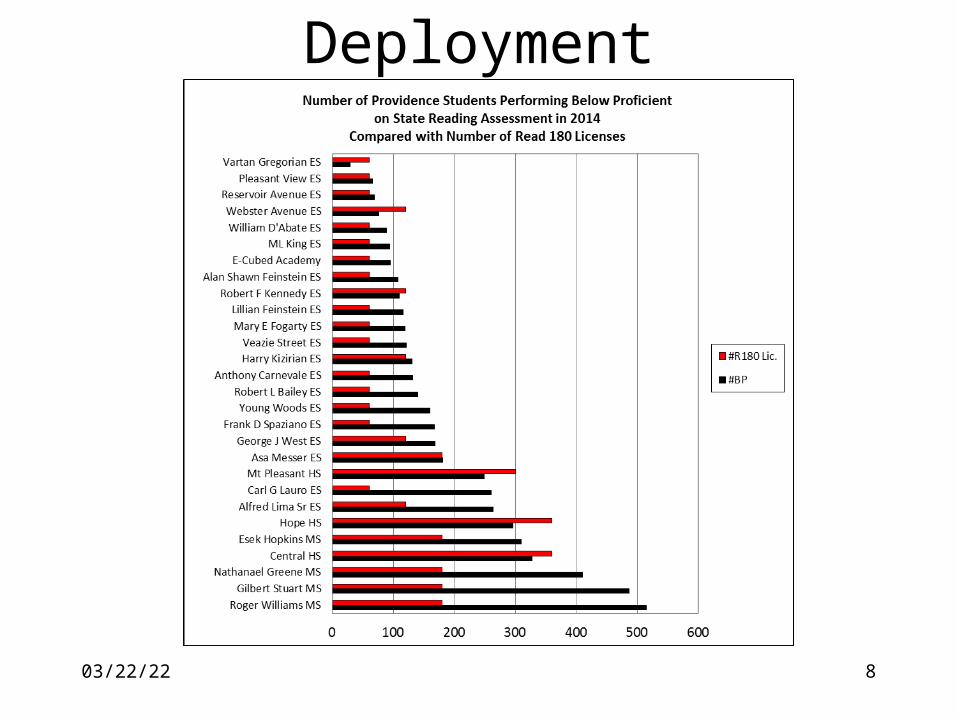
Deployment
04/19/23 8

Estimated Tiered Intervention Metrics-Elementary
* Please note: Core is the total number of students performing at Proficient.
School
Total Number of Students
Tested
Total Number of Students at
Level 1
Total Number of Students at
Level 2
Total Number of Students at Below
Proficient
Estimated Number of Tier III
Students
Estimated Number of Tier II
Students
Estimated Number of Core
StudentsLauro ES 440 141 119 260 39 221 180Lima ES 425 140 123 264 40 224 162West ES 342 62 106 168 25 142 174Veazie Street School 303 48 73 121 18 103 182Messer ES 301 81 99 181 27 154 120Carnevale ES 299 57 75 132 20 112 167Kennedy ES 290 55 55 110 17 94 180Young/Woods ES 285 68 91 160 24 136 125Spaziano ES 273 93 74 167 25 142 106King ES 269 27 67 94 14 80 175Kizirian ES 267 59 72 131 20 111 136Bailey ES 254 71 69 140 21 119 114Times2 Academy (Gr. 3-6) 218 7 57 63 9 54 155L. Feinstein ES 215 75 41 116 17 99 99D'Abate ES 208 37 52 89 13 76 119A. Feinstein ES 204 63 45 108 16 92 96Fogarty ES 192 69 50 119 18 101 73Webster Ave School 190 29 48 76 11 65 114Reservoir Ave School 157 27 42 69 10 59 88Gregorian ES 150 8 21 29 4 24 122Pleasant View School 135 32 34 66 10 56 69Leviton Dual Language 113 14 31 44 7 37 69
Elementary School Totals 5,530 1,262 1,442 2,705 406 2,299 2,825
04/19/23 9

Estimated Tiered Intervention Metrics-Middle and High School
* Please note: Core is the total number of students performing at Proficient.
School
Total Number of Students
Tested
Total Number of Students at
Level 1
Total Number of Students at
Level 2
Total Number of Students at Below
Proficient
Estimated Number of Tier III
Students
Estimated Number of Tier II
Students
Estimated Number of Core
StudentsClassical HS 819 128 137 265 40 225 554Central HS 678 160 167 328 49 279 350Hope HS 609 146 150 296 44 252 313Mount Pleasant HS 552 142 147 289 43 246 263Cooley HS 411 101 100 201 30 171 210Providence Career/Tech 390 75 108 183 27 156 207Alvarez HS 318 77 80 157 24 133 161E-Cubed Academy 231 40 55 95 14 81 136ACES 126 21 30 50 8 43 76Times2 Academy (Gr. 11) 114 18 22 40 6 34 74
High School Totals 4,248 909 996 1,905 286 1,619 2,343Greene MS 977 156 254 410 62 349 567DelSesto MS 910 319 300 619 93 526 291Stuart MS 811 187 300 487 73 414 324Williams MS 769 254 261 515 77 438 254Bishop MS 731 175 190 366 55 311 366Hopkins MS 574 126 184 310 46 263 264Times2 Academy (Gr. 7-8) 128 4 22 26 4 22 102
Middle School Totals 4,900 1,221 1,511 2,732 410 2,322 2,168
04/19/23 10

Estimated Tiered Intervention Metrics- School Totals
* Please note: Core is total number of students performing at Proficient.
School
Total Number of Students
Tested
Total Number of Students at
Level 1
Total Number of Students at
Level 2
Total Number of Students at Below
Proficient
Estimated Number of Tier III
Students
Estimated Number of Tier II
Students
Estimated Number of Core
Students
TOTAL 14,678 3,392 3,950 7,342 1,101 6,241 7,336
04/19/23 11

Rhode Island Reading and Math Rigor Risk
Rhode Island 2013Group NAEP RI State VarianceGrade 4 Reading 47.0% 69.0% 22.0%Grade 8 Reading 40.0% 77.0% 37.0%
04/19/23 12

Providence, RI– Reading Risk Analysis
Commentary for Providence School District, RI:•Common Core’s goals of preparing all students to be college and career ready means reading on grade level.•Proficiency on NAEP is specifically designed to be reading on grade level.•In 2013, the difference between RI’s NECAP reading proficiency and NAEP reading proficiency ranged from 22 to 37 percentage points. This means that the average district in RI might expect a 22 to 37 percentage point decline in reading proficiency under a Common Core test that has reading on grade level as its proficiency cut point.•This grid shows the impact of four scenarios on the number of students in Providence School District needing reading intervention.
2014 NECAP Reading Data
Grade
# Tested on Reading in
2014
% Below Prof on Reading in
2014
# Below Prof on Reading in
2014
10 Percentage
Point Decline
20 Percentage
Point Decline
30 Percentage
Point Decline
40 Percentage
Point Decline
Grade 3 1,823 52% 948 1,130 1,313 1,495 1,677Grade 4 1,888 48% 906 1,095 1,284 1,473 1,661Grade 5 1,778 48% 853 1,031 1,209 1,387 1,565Grade 6 1,765 55% 971 1,147 1,324 1,500 1,677Grade 7 1,708 60% 1,025 1,196 1,366 1,537 1,708Grade 8 1,511 51% 771 922 1,073 1,224 1,375Grade 9 Est. 1,493 47% 702 851 1,000 1,150 1,299Grade 10 Est. 1,475 43% 634 782 929 1,077 1,224Grade 11 1,455 39% 567 713 858 1,004 1,149
TOTAL 14,896 50% 7,377 8,867 10,356 11,846 13,336
20% 40% 61% 81%Percent Growth of # of Students Below Proficient
04/19/23 13

Why Scholastic Achievement Partners
Academic Improvement Services Maximizing Student Gains to Meet AYP Targets
Best Practices20 years, 18,000 classrooms and over 1,200,000 students
04/19/23 14

Next Practices for Driving Academic Improvement …What We’ve Learned … What the Research Shows
Comprehensive Implementation Support and Monitoring
Intensive and TieredIntervention
Instructional Excellence for All Teachers
Strong Instructional Leaders
360 Degree Needs Assessment and Planning
04/19/23 15

Planning Success A focused plan with 2-3 primary goals
The plan is built on a comprehensive assessment of demographic, academic, economic, and human resource needs
Clear milestones that are tied to specific leaders and linked to a progress monitoring system with strong metrics
Adequate personnel and fiscal resources
Be prepared to make mid-course adjustments in these challenging times.
04/19/23 16

Intensive & Tiered Intervention
• Assessment Data Screening, progress monitoring, and summative assessments for all
students Assessments for reading for all students on a single vertical scale to
measure both proficiency and growth trajectory
• Three Tiers for Reading Instruction Tier #2-3: Intensive intervention treatment in foundational skills for
ELL and Special populations Tier #2: Intervention treatment for students below grade level Tier #1: Core instruction All three are linked to coherent K-12 curriculum
04/19/23 17

Intensive & Tiered Intervention• Intensive Implementation Support
Initial training for teachers and academic leaders Ongoing, job embedded coaching for intervention teachers Development of a cadre of coaches to build internal capacity to
sustain the initiative
• Progress Monitoring Data Individualized student skills data Progress monitoring data Usage data Implementation fidelity data Data that rolls up from student to class to school to district
04/19/23 18

Professional Learning• Instructional Excellence for All Teachers
Tailored approach based on specific teacher growth needs
Focused on high leverage areasCurriculumEffective Teaching PracticesContent Area LiteracyEffective Math Instruction
Sustained approach to build internal capacity
Blended model of deliveryFace to faceJob-embeddedOnline
04/19/23 19

Professional Learning
• Strong Instructional Leadership Common agreement on a coherent curriculum and instructional goals
Individualized leadership growth plans
Building system-wide leadership capacity
Focus on high leverage leadership practicesPlanning and goal settingObservationData Analysis and Decision Making
Strong practices for mentoring and coaching
04/19/23 20