max financial services limited investor presentation
TRANSCRIPT

Max Financial Services Limited
Investor PresentationNovember 2018

2
Max Group Vision“To be the most admired corporate for service excellence”

Health Insurance,
JV with Bupa
Health Insurance,
JV with Bupa
3
Evolution of Max Group—Strong history of entrepreneurship and nurturing successful businesses
1985 1993 2000
Forays into Penicillin
bulk pharma
Forays into Penicillin
bulk pharma
Enters Telecom in JV with Hutchison
JV with Gist Brocades (Asia’s largest Drug
manufacturer )
Enters Telecom in JV with Hutchison
JV with Gist Brocades (Asia’s largest Drug
manufacturer )
Shift from B2B to B2C businesses:
●Life insurance
●Healthcare
●Clinical research
Shift from B2B to B2C businesses:
●Life insurance
●Healthcare
●Clinical research
Hutchison
Fund raising ~ USD 360 Mn●QIP- USD 156 Mn in 2007
●Warburg Pincus - 53 Mn in 2005
● IFC- 47 Mn(2007) &23 Mn (2009)
●Goldman Sachs 82 Mn in 2011
Fund raising ~ USD 360 Mn●QIP- USD 156 Mn in 2007
●Warburg Pincus - 53 Mn in 2005
● IFC- 47 Mn(2007) &23 Mn (2009)
●Goldman Sachs 82 Mn in 2011
2005 20112007 2009 2012 2013 2014 2015 2016
NYL exits and JV withMSI in 2012●MSI is world’s 7th largest
general insurance group
●MSI acquired 26% stake for USD 425 Mn
●Max Life valued at USD 1.6 bn
NYL exits and JV withMSI in 2012●MSI is world’s 7th largest
general insurance group
●MSI acquired 26% stake for USD 425 Mn
●Max Life valued at USD 1.6 bn
LHC inducted as JV Partner in MHC●LHC is 2nd largest hospital
chain in South Africa
●2012 - Acquired 26% stake for USD 81 Mn in MHC
●2014 - Equalize stake in MHC invests USD 120 Mn
LHC inducted as JV Partner in MHC●LHC is 2nd largest hospital
chain in South Africa
●2012 - Acquired 26% stake for USD 81 Mn in MHC
●2014 - Equalize stake in MHC invests USD 120 Mn
Enter Senior Living business,
launch first community in Dehradun with
200 units
Enter Senior Living business,
launch first community in Dehradun with
200 units
Max India demerged into 3 listed hold cosMax India demerged into 3 listed hold cos
Landmark Acquisitions by MHC●Acquired 79% stake for
USD 40 Mn in 340 bedded Pushpanjali hospital expandable upto 540 beds
●Acquired 51% stake for USD 100 Mn in 230 bedded Saket City hospital, expandable upto1200 beds
Landmark Acquisitions by MHC●Acquired 79% stake for
USD 40 Mn in 340 bedded Pushpanjali hospital expandable upto 540 beds
●Acquired 51% stake for USD 100 Mn in 230 bedded Saket City hospital, expandable upto1200 beds
Note: USD rate considered at 64
Life Insurance,
JV with NYL
Life Insurance,
JV with NYL

4
Max Group – Corporate Structure
Health & AlliedBusiness
Life InsuranceBusiness
Max Group ‐ SponsorsMax Group ‐ Sponsors
Real Estate, Manufacturing & Other businesses
Holding
Co
mpa
nies
Ope
ratin
g Co
mpa
nies
70.75%50%
51%
100%
51%
Group CSR Arm
30.3% 41.0% 47.2%
100%
100%
100%
Sponsors stake in Max Group holding companies

5
Max Group – Senior Management
Rahul Khosla• Group President• Chairman, Max India Limited• Executive President, Max Financial Services• Chairman, Max Healthcare Institute Ltd
Mohit Talwar• Managing Director, Max India Limited• Managing Director, Max Financial Services• Vice-Chairman, Max Ventures and Industries Ltd• Chairman, Max Specialty Films
Rajit Mehta• MD & CEO, Max Healthcare
Tara Singh Vachani• MD & CEO, Antara Senior Living• Director in Max India & Max Healthcare
Ramneek Jain• CEO, Max Specialty Films
Mohini Daljeet Singh• Chief Executive, Max India Foundation
Rajesh Sud• Executive Vice Chairman & MD, Max Life Insurance
(upto December 31, 2018)• Chairman, Max Bupa Health Insurance Co Ltd &
Max Skill First (upto March 31, 2019)
Ashish Mehrotra• MD & CEO, Max Bupa Health Insurance
Sahil Vachani• MD & CEO, Max Ventures and Industries Limited• Director in Max Financial & Max Life Insurance
Rajender Sud• CEO, Max Skill First Limited
Prashant Tripathy (with effect from Jan 1, 2019)• MD & CEO, Max Life Insurance

6
Max Group Overview
USD 3 billion Revenues… 10 Mn Customers… 25,000 Employees… ~80,000 Agents
Strong growth trajectory even in challenging times; a resilient & diversified business model
Steady revenue growth and cost rationalization leads to strong financial performance
Well established board governance….internationally acclaimed domain experts inducted
Diversified ownership…..marquee investor base
Superior brand recall with a proven track record of service excellence
Strong history of entrepreneurship and nurturing successful business partnerships
1
2
3
4
5
6
7

7
Max Group : Continues to grow from strength to strength
Group EBITDA (USD Mn)
81 95 110 127 129
FY'14 FY'15 FY'16 FY'17 FY'18
Group Revenue (USD Mn)
1,639 1,915 2,190 2,584 2,946
FY'14 FY'15 FY'16 FY'17 FY'18
Note: Adjusted for one‐offs for conversion assumed 1 USD = INR 65
8
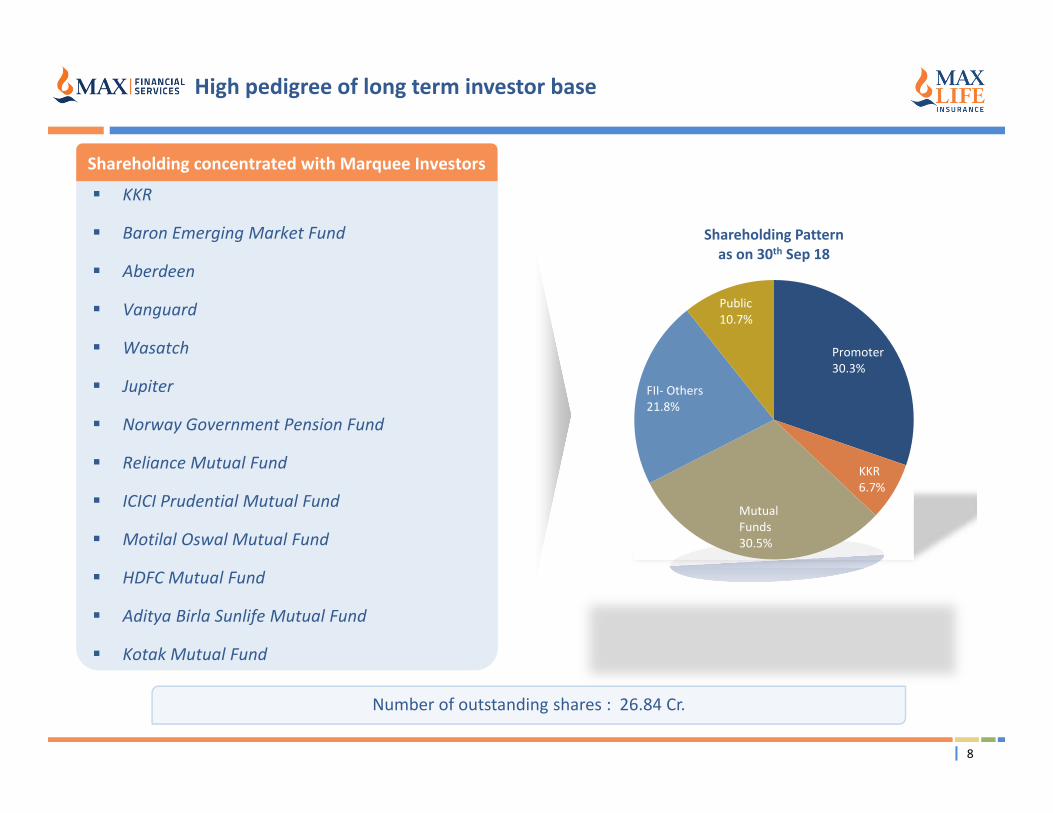
Promoter30.3%
KKR6.7%
MutualFunds30.5%
FII‐ Others21.8%
Public10.7%
Shareholding Patternas on 30th Sep 18
KKR
Baron Emerging Market Fund
Aberdeen
Vanguard
Wasatch
Jupiter
Norway Government Pension Fund
Reliance Mutual Fund
ICICI Prudential Mutual Fund
Motilal Oswal Mutual Fund
HDFC Mutual Fund
Aditya Birla Sunlife Mutual Fund
Kotak Mutual Fund
Shareholding concentrated with Marquee Investors
High pedigree of long term investor base
Number of outstanding shares : 26.84 Cr.

Max Life Insurance Company Limited

10
Key Summary Messages
Indian Life Insurance Industry has evolved rapidly; significant headroom still available for growth due to low penetration and favorable demographic profile1Max Life is well positioned to leverage this opportunity with its eminent Board, strong management team and robust governance framework2We are a differentiated Life Insurer with key strengths of multi‐channel distribution, balanced product mix, operational excellence and digital capabilities3Max Life is one of the fastest growing players with equal emphasis on profitability – Among the top quartile across the comprehensive measures of success 4Our operating RoEV of 20.6% and new business margin at 20.2% are amongst the best in the industry5Strength in business model recognised through several Awards and Accolades that Max Life Insurance wins every year6Our target to grow Sales CAGR, RoEV and margins by over 25% by FY 217
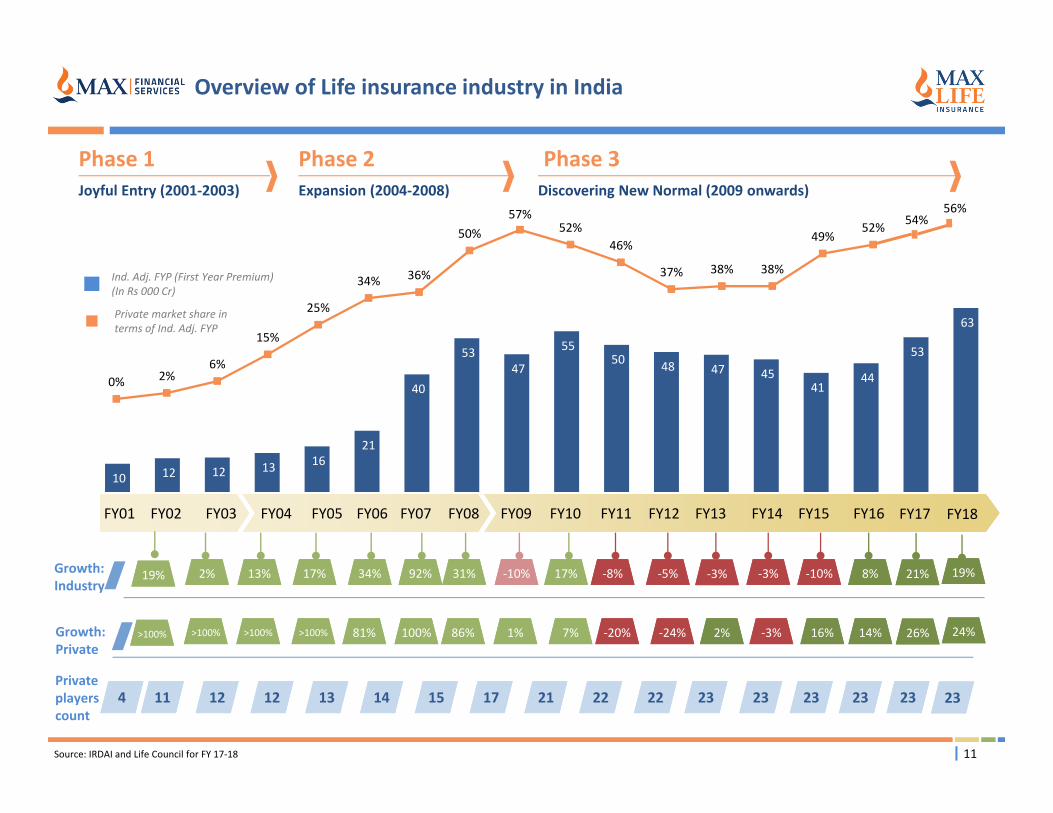
0% 2%6%
15%
25%
34% 36%
50%57%
52%46%
37% 38% 38%
49%52%
10 12 12 13 16 21
40
53 47
55 50 48 47 45
41 44
53
63
11
FY02FY01 FY03 FY04 FY05 FY06 FY07 FY08 FY09 FY10 FY11 FY12 FY14FY13
Phase 1 Joyful Entry (2001‐2003)
Phase 2Expansion (2004‐2008)
Phase 3Discovering New Normal (2009 onwards)
Ind. Adj. FYP (First Year Premium) (In Rs 000 Cr)
FY15
Source: IRDAI and Life Council for FY 17‐18
FY16
Private market share in terms of Ind. Adj. FYP
Private players count
Overview of Life insurance industry in India
11 12 12 13 14 15 17 21 22 22 23 2323 23 234
92% 31% ‐10% 17% ‐8% ‐5% ‐3% ‐10% 8%
100% 86% 1% 7% ‐20% ‐24% 2% ‐3% 16% 14%Growth: Private
Growth: Industry
13% 17% 34%
>100% >100% 81%
2%
>100%
19%
>100%
‐3%
FY17
21%
26%
23
FY18
19%
24%
56%54%
Investor Release 12
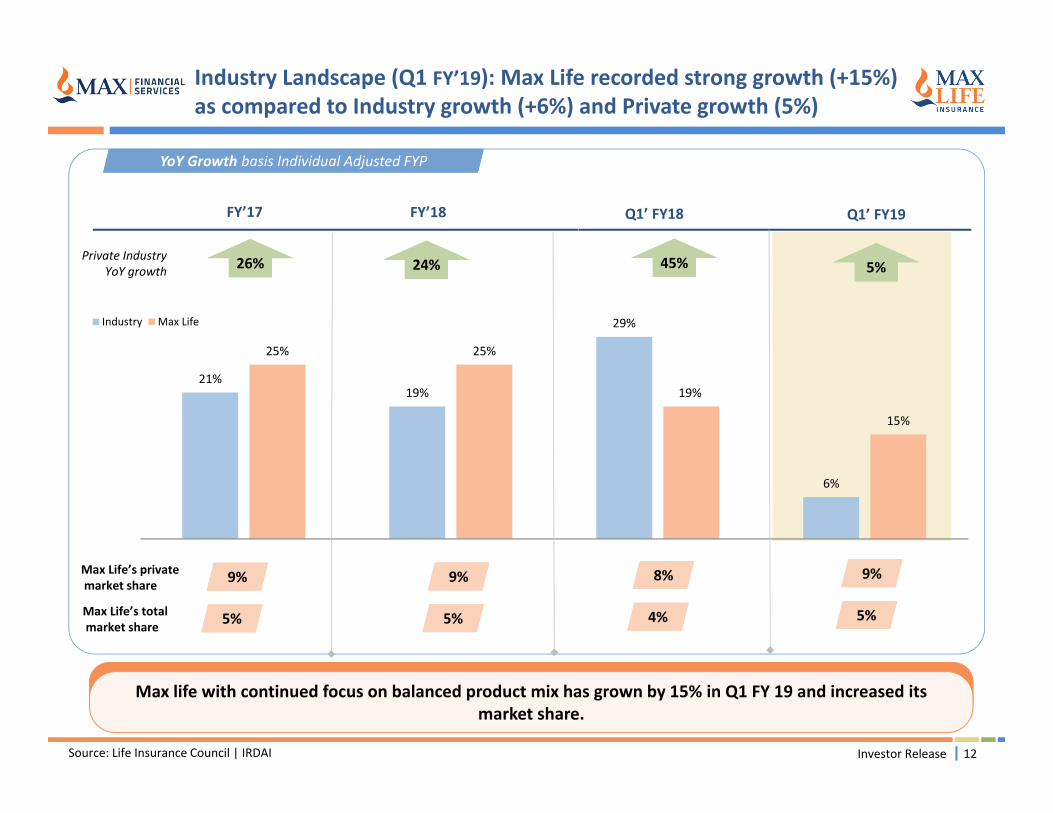
Industry Landscape (Q1 FY’19): Max Life recorded strong growth (+15%) as compared to Industry growth (+6%) and Private growth (5%)
Source: Life Insurance Council | IRDAI
YoY Growth basis Individual Adjusted FYP
21%19%
29%
6%
25% 25%
19%
15%
Industry Max Life
Max Life’s privatemarket share
FY’17
9% 9%
Private Industry YoY growth 24% 5%
Max Life’s totalmarket share 5% 5%
Max life with continued focus on balanced product mix has grown by 15% in Q1 FY 19 and increased its market share.
FY’18 Q1’ FY18
45%26%
8%
4%
9%
5%
Q1’ FY19
13
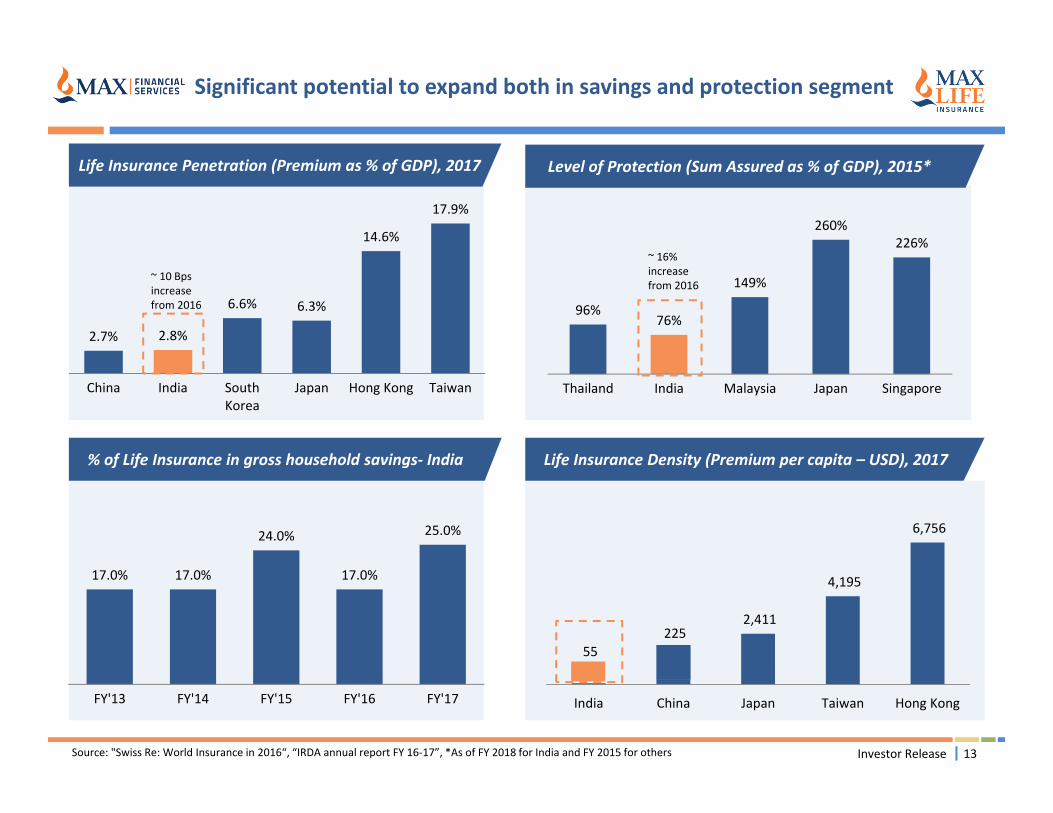
% of Life Insurance in gross household savings‐ India
Significant potential to expand both in savings and protection segment
Life Insurance Penetration (Premium as % of GDP), 2017
2.7% 2.8%
6.6% 6.3%
14.6%
17.9%
China India SouthKorea
Japan Hong Kong Taiwan
Level of Protection (Sum Assured as % of GDP), 2015*
226%260%
149%
76%96%
SingaporeJapanMalaysiaIndiaThailand
Life Insurance Density (Premium per capita – USD), 2017
55 225
2,411
4,195
6,756
India China Japan Taiwan Hong Kong
17.0% 17.0%
24.0%
17.0%
25.0%
FY'13 FY'14 FY'15 FY'16 FY'17
Source: "Swiss Re: World Insurance in 2016“, “IRDA annual report FY 16‐17”, *As of FY 2018 for India and FY 2015 for others Investor Release
~ 10 Bps increase from 2016
~ 16% increase from 2016

Highly experienced and versatile Board of Directors providing strong and secure foundation
Founder and ChairmanEmeritus Mr. Analjit Singh
Chairman Mr. Rahul Khosla
Founder and Chairman of Max India. Awarded with highest civilian honor, the Padma Bhushan
Founder and Chairman of Max India. Awarded with highest civilian honor, the Padma Bhushan
Seasoned business manager with wide domain expertise built over 27 years in financial services
Seasoned business manager with wide domain expertise built over 27 years in financial services
DirectorMr. John Poole
DirectorMs. Marielle Theron
Fellow of the Institute and Faculty of Actuaries. Served as the AA for Max Life from 2005 till 2011
Fellow of the Institute and Faculty of Actuaries. Served as the AA for Max Life from 2005 till 2011
Fellow of the Society of Actuary (FSA). She is a Principal of ErlenStreet Corporation, Switzerland
Fellow of the Society of Actuary (FSA). She is a Principal of ErlenStreet Corporation, Switzerland
DirectorMr. Rajit Mehta
Independent Director Mr. K. NarasimhaMurthy
Currently the CEO and MD of Max Healthcare Institute and also the founding member of Max Life
Currently the CEO and MD of Max Healthcare Institute and also the founding member of Max Life
Serving on the Board of Max Ventures, Srikari Management Consultants, STCI, Infiniti Retail‚ Max Bupa, Max Speciality Films , Saket City Hospitals and Max Healthcare
Serving on the Board of Max Ventures, Srikari Management Consultants, STCI, Infiniti Retail‚ Max Bupa, Max Speciality Films , Saket City Hospitals and Max Healthcare
Independent DirectorMr. Rajesh Khanna
Independent DirectorMr. D. K. Mittal
Founder and CEO of Arka Capital Advisors. Previously served as MD and India Head at Warburg Pincus
Founder and CEO of Arka Capital Advisors. Previously served as MD and India Head at Warburg Pincus
Former IAS officer of 1977 batch and has served the government of India in various capacities
Former IAS officer of 1977 batch and has served the government of India in various capacities
DirectorMr. MasatakaKitagawa
DirectorMr. Hideaki Nomura
Responsible for Mitsui Sumitomo overseas life insurance business with more than 30 years of experience
Responsible for Mitsui Sumitomo overseas life insurance business with more than 30 years of experience
Seasoned professional with 31 years experience in financial industries
Seasoned professional with 31 years experience in financial industries
Exec. Vice Chairmanand MDMr. Rajesh Sud
A founder team member. Appointed as CEO and Managing Director in November 2008
A founder team member. Appointed as CEO and Managing Director in November 2008
DirectorMr. Mohit Talwar
Seasoned professional with 24 years of experience in Corporate Finance and Investment Banking
Seasoned professional with 24 years of experience in Corporate Finance and Investment Banking
DirectorMr. Sahil Vachani
Currently CEO & Managing Director of Max Ventures and Industries Limited. He has diverse experience across various sectors including consumer durables and real estate.
Currently CEO & Managing Director of Max Ventures and Industries Limited. He has diverse experience across various sectors including consumer durables and real estate.
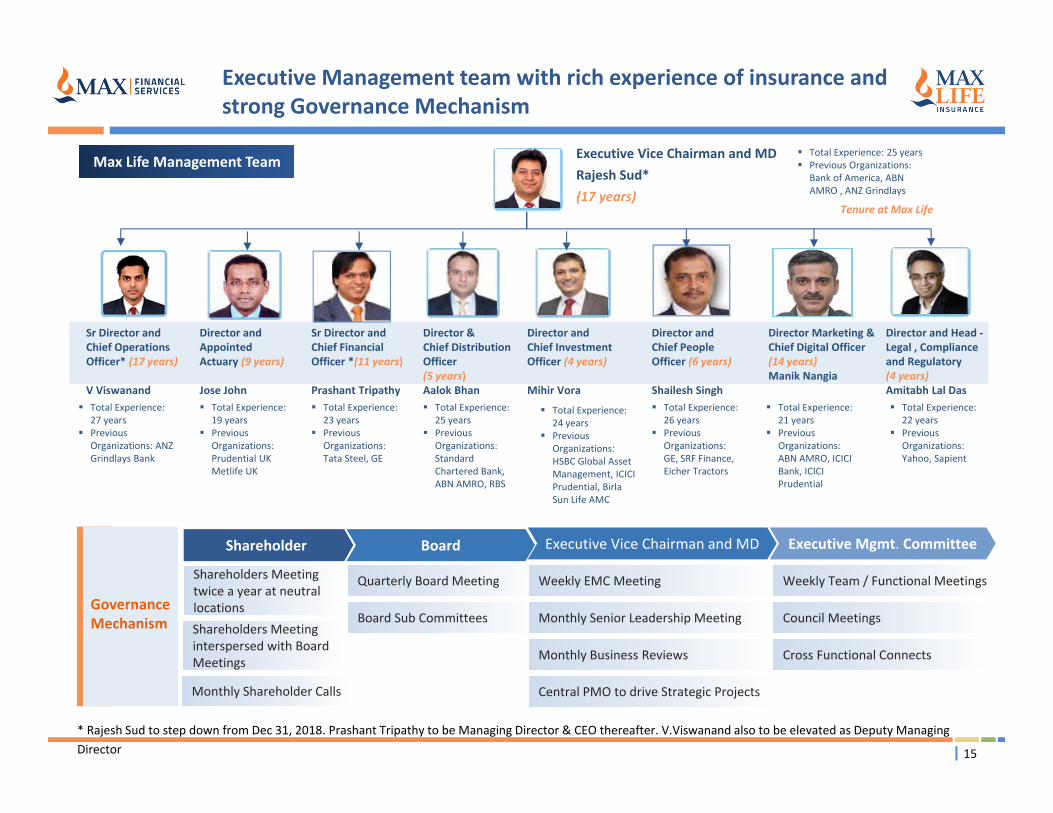
Executive Management team with rich experience of insurance and strong Governance Mechanism
Max Life Management Team Executive Vice Chairman and MDRajesh Sud*(17 years)
Sr Director and Chief OperationsOfficer* (17 years)
V Viswanand
Director andChief PeopleOfficer (6 years)
Shailesh Singh Total Experience:
26 years Previous
Organizations: GE, SRF Finance, Eicher Tractors
Director Marketing & Chief Digital Officer(14 years)Manik Nangia
Director & Chief DistributionOfficer(5 years)Aalok Bhan Total Experience:
25 years Previous
Organizations: Standard Chartered Bank, ABN AMRO, RBS
Director and Appointed Actuary (9 years)
Jose John Total Experience:
19 years Previous
Organizations: Prudential UK Metlife UK
Director and Head ‐Legal , Complianceand Regulatory(4 years)Amitabh Lal Das
Sr Director and Chief Financial Officer *(11 years)
Prashant Tripathy Total Experience:
23 years Previous
Organizations: Tata Steel, GE
Director and Chief Investment Officer (4 years)
Mihir Vora
Total Experience: 24 years
Previous Organizations: HSBC Global Asset Management, ICICI Prudential, Birla Sun Life AMC
Total Experience: 27 years
Previous Organizations: ANZ Grindlays Bank
Total Experience: 21 years
Previous Organizations: ABN AMRO, ICICI Bank, ICICI Prudential
Total Experience: 22 years
Previous Organizations: Yahoo, Sapient
Total Experience: 25 years Previous Organizations:
Bank of America, ABN AMRO , ANZ Grindlays
Tenure at Max Life
Quarterly Board Meeting
Board Sub Committees
Executive Vice Chairman and MD Executive Mgmt. Committee
Weekly EMC Meeting
Monthly Senior Leadership Meeting
Monthly Business Reviews
Weekly Team / Functional Meetings
Council Meetings
Cross Functional Connects
Governance Mechanism
Central PMO to drive Strategic Projects
15
Shareholders Meeting twice a year at neutral locations
Shareholder
Monthly Shareholder Calls
Board
Shareholders Meeting interspersed with Board Meetings
* Rajesh Sud to step down from Dec 31, 2018. Prashant Tripathy to be Managing Director & CEO thereafter. V.Viswanand also to be elevated as Deputy Managing Director

To be the most admired life insurance company by securing the financial future of our customers
FY 2020‐21 Touch 1 crore lives Two fold increase in GWP & statutory profits
Caring Credibility Collaborative Excellence
We are an honest life insurance company, committed to doing what is right
We serve our customers through Long term savings, protection and retirement solutions, delivered by our high quality Agency & Multi channel Distribution Partners
We are a business with strong social relevance and contribute to Society by supporting causes in health and wellbeing.
Financial Strength Quality of AdviceService Excellence Superior Human CapitalValue Driven Culture Corporate Governance
Vision
Goals
We Stand for
Values
Integrity
Mission
16
Long Term strategy is driven by our vision to be the “Most Admired Life Insurance Company”
» Quality of advice
» Human Capital and Leadership depth
» Differentiated distribution capabilities
» Product suite focused on “Long Term Savings and Protection
» Quality of Business
» Strong & Distinctive Brand
What are we known for

17
Our Strategy: Strengthen multi‐channel architecture and leverage technology to continue profitable growth
Superior financial performance with profitable growth
Balanced product mix with focus on long term saving and protection proposition
Superior customer outcomes and retention
Continue to chase profitable growthContinue to chase profitable growth
Comprehensive multi‐channel distribution model with highly efficient and productive agency channel and strong Banca relationships
Proprietary channels to work towards driving efficiencies of existing assets and variablizing costs by leveraging technology
Using digital technologies to harness data and analytics for more efficient sales processes and better customer experience
Build a digital organization to drive efficiency across value chain
Strong digital footprintsStrong digital footprints
Comprehensive multi‐channel distribution model
Comprehensive multi‐channel distribution model
Supported by eminent Board, strong management team and robust governance framework
1
2
3
Investor Release

Pvt Market Share*
9%[8%]
Individual APE
Rs 552 Cr[Rs 472 Cr]
Gross Written Premium
Rs 2,320 Cr[Rs 2,007 Cr]
AUM^
Rs 53,940 Cr[Rs 52,237 Cr]
Profit Before tax^^
Rs 91 Cr[Rs 106 Cr]
Net Worth^
Rs 2,581 Cr[Rs 2,699 Cr]
Embedded Value^
7,645[7,706]
Policyholder Expense to GWP Ratio
17.3%[18.9%]
New Business Margins RoEV
15.0%[N.A]
Solvency Ratio^
262%[263%]
Policyholder Cost to GWP Ratio23.6% [25.7%]
No. of Offices
257[210]
Case Size
49,359 [45,470]
Claim Settlement Ratio
96.3%[94.6%]
Protection Mix**
Growth on Embedded value is operating RoEV and March 18 EV is pre dividend, **Group protection (incl. Group credit life adjusted for 10% for single premium and term business) 18
17%3%
Abs 47
10 bpsAbs. 1%
212 bps
9%
Financial Performance Summary Q1’ FY19
14%
16%
170 bps
1
15.0%
Investor Release
165 bps
Individual Group Total7%[6%]
9%[7%]
16%[13]
310 bps
77 bps
Figures in [brackets] are for previous year Q1 numbers; ^ Represents comparison from March’18 numbers; * Basis Adj FYP^^ Profit lower than previous year due to higher protection business and investment in proprietary channels
4%
Structural Actual23.5%22.2%
18.1%18.0%
19
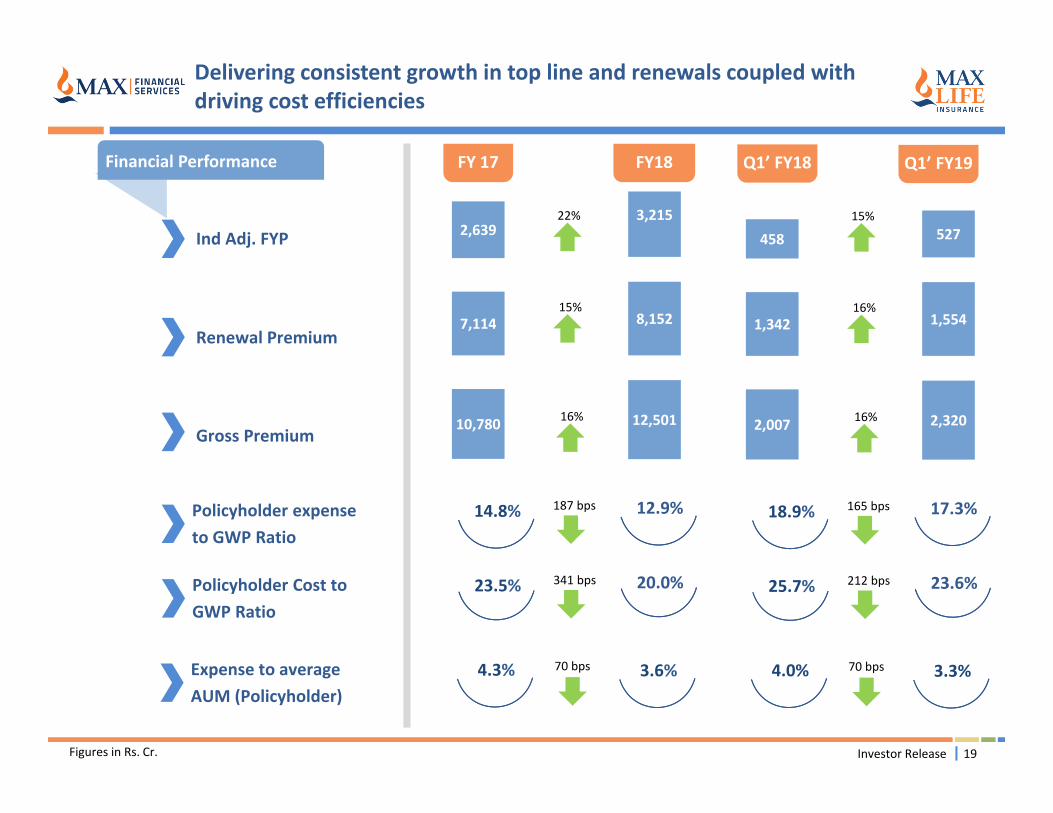
Delivering consistent growth in top line and renewals coupled with driving cost efficiencies
Figures in Rs. Cr.
Ind Adj. FYP
Renewal Premium
Gross Premium
FY 17
2,639
7,114
FY18
3,215
8,152
10,780 12,501
22%
15%
16%
Policyholder expense to GWP Ratio
12.9%14.8% 187 bps
Expense to average AUM (Policyholder)
4.3% 3.6%70 bps
Investor Release
Policyholder Cost to GWP Ratio
20.0%23.5% 341 bps
Q1’ FY18
458
1,342
527
1,554
2,007 2,320
15%
16%
16%
17.3%18.9% 165 bps
4.0% 3.3%70 bps
23.6%25.7% 212 bps
Q1’ FY19Financial Performance

FY 17Financial Performance
20
Healthy and consistent profitability creating value to all the stakeholders while maintaining solvency above required levels
Figures in Rs. Cr.
AUM
Profit(before Tax)
Solvency Ratio 309%
768 615
275%
44,370 52,237
20%
18%
Abs 34%
FY18
^Arrow represents growth in Operating RoEV
Operating RoEV^
MCEV 6,739
19.9% 20.6%
7,706
New Business Margin 18.8% 20.2%140 bps
70 bps
20%
Investor Release
295%
106 91
262%
45,871 53,940
14%
18%
Abs 33%
N.A
N.A 15.0%
7,645
18.0% 18.1%10 bps
Q1’ FY18 Q1’ FY19

Rs in Cr
21
Assets under management‐ Y‐o‐Y growth at 18%
Linked fund vs Controlled fundLinked fund vs Controlled fund Debt vs EquityDebt vs Equity
Investor Release
Debt portfolio exposure to AAA rated debt is well above the regulatory requirement of 75%AUM Size has grown more than Rs 50,000 Crore
Debt portfolio exposure to AAA rated debt is well above the regulatory requirement of 75%AUM Size has grown more than Rs 50,000 Crore

22
54%43%
51%38%
4%
4%
6%
7%
3%
4%
8%
9%
9%
8%
7%
5%
30%41%
28%41%
FY 17 FY 18 Q1' FY 18 Q1' FY 19
PAR Individual Protection Group Protection Non PAR‐ Savings ULIP
7%
Product mix basis total APE (incl. Group credit life adjusted for 10% for single premium and term business)
Balanced product mix with enhanced focus on long term saving and protection contribution1
Investor Release
8% 16%
13%

23
96 137
29 41
93
120
39 58
FY 17 FY18 Q1' FY 18 Q1' FY 19
Individual Group
Focus on Protection32% of total individual new business policies are protection1
Investor Release
78
114
25 33
FY 17 FY 18 Q1' FY 18 Q1' FY 19
Individual
Total APE (Individual + Group) No of Policies (Individual)
Figures in Rs. Cr. Figures in ‘000.
Total APE (incl. Group credit life adjusted for 10% for single premium and term business)
99
189
256
67

*PPT: Premium Payment Term 24
24
14
64
17
32
19
16
29
22
57
35
37
36
28
35
43
39
38
35
63
Product Type
Average Average Average
Endowment
ULIP
Whole Life
Money back
Pure Term
GMIP/GIP
Health
Cancer Insurance
Pension
Annuity
11
10
52
16
32
9
16
29
21
1
Balanced product mix with focus on long tenor life coverage1
Investor Release
Average Policy Term(Years)
Average Policyholder Age (Years)
Average PPT*(Years)
As on 30th June 201836 25 16

Continuous improvement in persistencyContinuous improvement in persistency
Steady retention capabilitiesSteady retention capabilitiesHigh quality business franchise High quality business franchise
25
21% 20%
32%
24%
FY17 FY18 Q1' FY 18 Q1' FY 19
Surrender to GWP
89% 90%
92%91%
FY17 FY18 Q1' FY 18 Q1' FY 19
Conservation Ratio*
Superior customer outcomes and retention with continuous improvement across all quality parameters
80%70%
60% 55% 53%
80%72%
62%57% 53%
82%72%
61% 56% 53%
83%72%
64%57% 54%
13th Month 25th Month 37th Month 49th Month 61st Month
FY17 FY 18 Q1' FY 18 Q1' FY 19
1
*Conservation Ratio : Current year total renewal premium(excluding Group)/(total first year individual regular premium of previous year+ renewal premium (excluding group) of previous year‐previous year premium from term completed policies, matured policies and policies which has ceased to exist due to death)
Investor Release
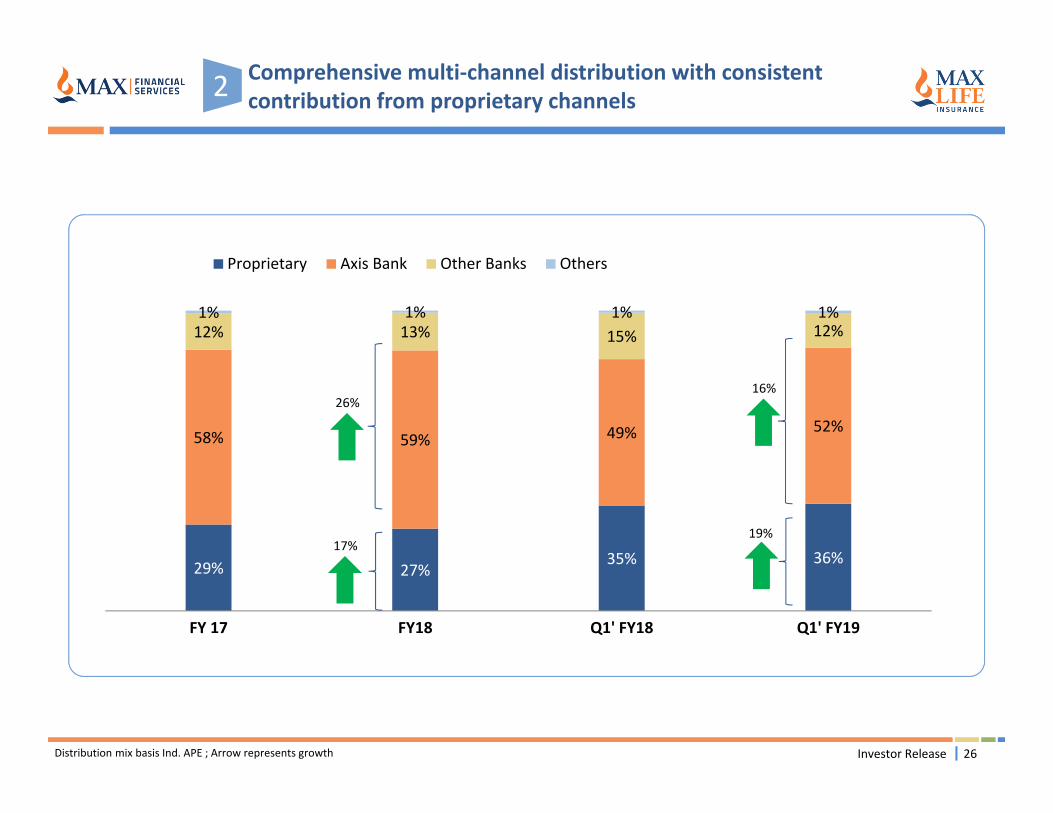
2 Comprehensive multi‐channel distribution with consistent contribution from proprietary channels
26Distribution mix basis Ind. APE ; Arrow represents growth
29% 27%35% 36%
58% 59% 49% 52%
12% 13% 15% 12%1% 1% 1% 1%
FY 17 FY18 Q1' FY18 Q1' FY19
Proprietary Axis Bank Other Banks Others
Investor Release
19%
16%
17%
26%

27
Channelize efforts and investments towards growth in Proprietary channel2
Investor Release
Agency office expansion
Increase in offices by leveraging existing infrastructure
Selectively expand in higher affluent geographies utilizing low cost model
L1
New service to sale initiatives
Drive policy density via cross sell
Leverage opportunity to drive protection
L4
L2
L3
Variable agency cost model
Significant expansion of IMF channel
Drive recruitment and productivity through variable cost model
Pilot and proof of new channels/products
POS channel: Lean cost model to drive sales of over the counter product
Defence channel: New set‐up to focus on defence personnel
Participate aggressively in the online savings market
Accelerated Investments in Proprietary Channel
Aspiration to increase proprietary share to ~35%‐40% by FY 21
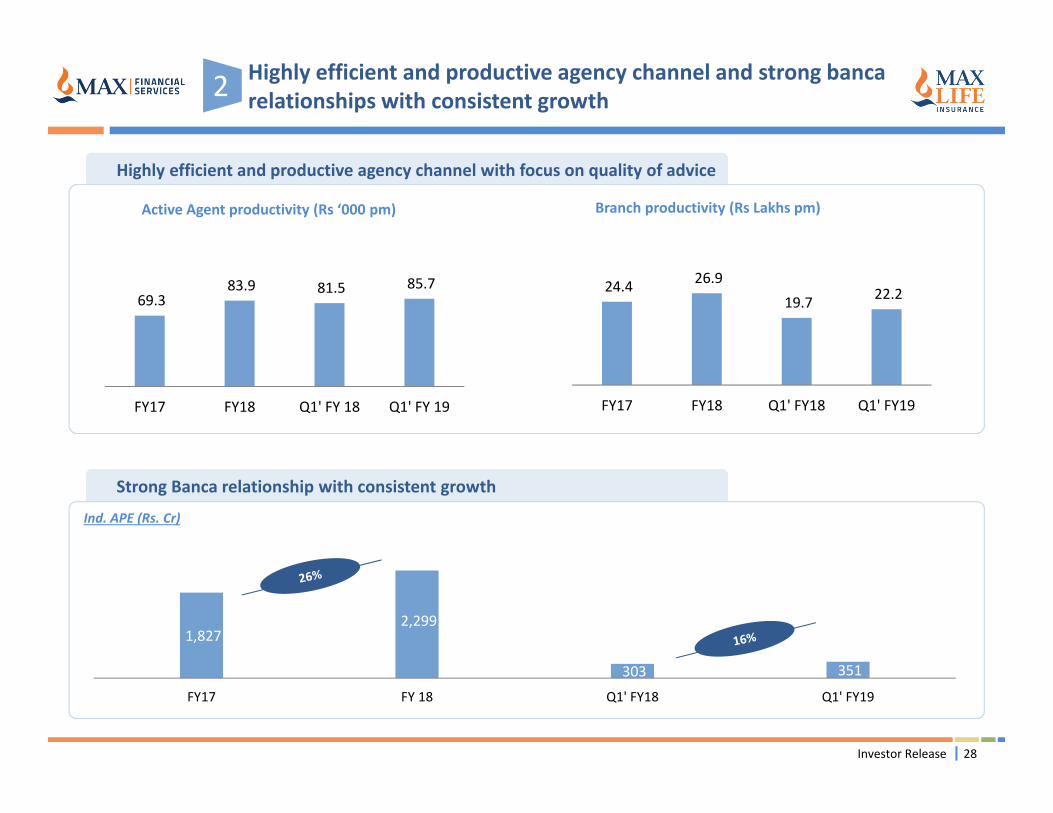
Highly efficient and productive agency channel with focus on quality of adviceHighly efficient and productive agency channel with focus on quality of advice
Strong Banca relationship with consistent growthStrong Banca relationship with consistent growth
28
Active Agent productivity (Rs ‘000 pm) Branch productivity (Rs Lakhs pm)
24.4 26.9 19.7 22.2
FY17 FY18 Q1' FY18 Q1' FY19
Ind. APE (Rs. Cr)
Highly efficient and productive agency channel and strong bancarelationships with consistent growth
1,827 2,299
303 351
FY17 FY 18 Q1' FY18 Q1' FY19
2
69.3 83.9 81.5 85.7
FY17 FY18 Q1' FY 18 Q1' FY 19
Investor Release
Investor Release 29
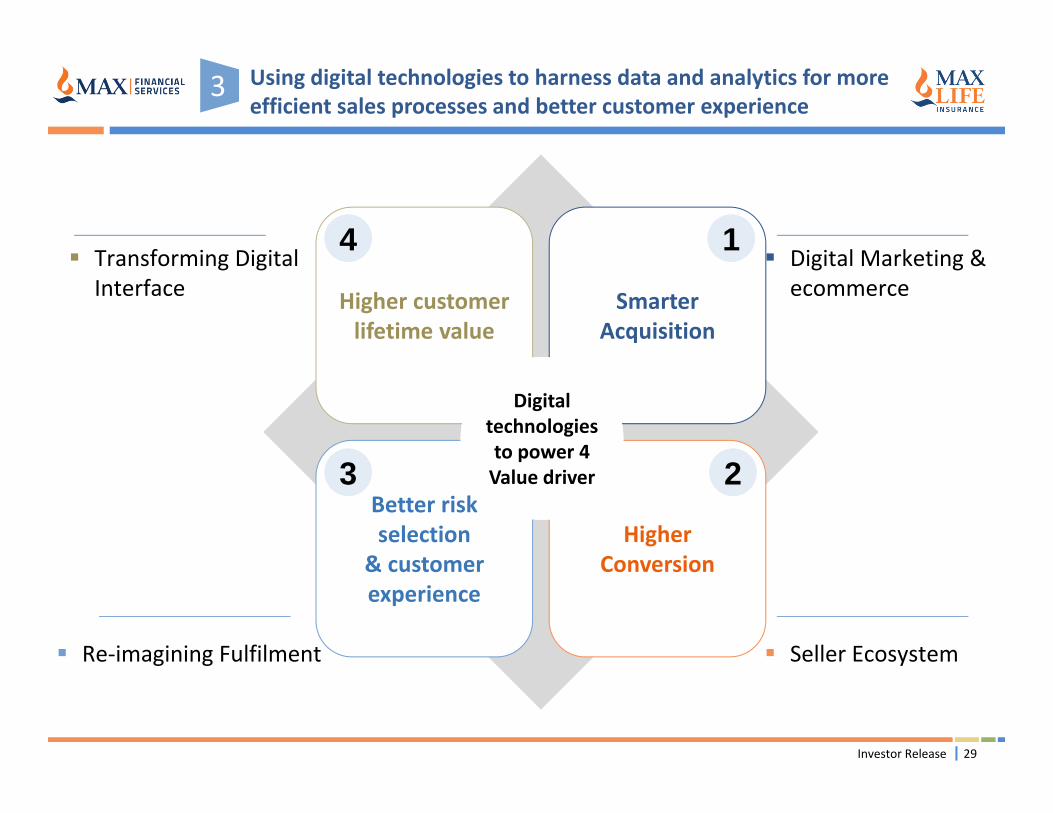
Using digital technologies to harness data and analytics for more efficient sales processes and better customer experience
Higher customer lifetime value
SmarterAcquisition
Better risk selection
& customer experience
Higher Conversion
Digital technologies to power 4 Value driver
Digital Marketing & ecommerce
Seller Ecosystem
Transforming Digital Interface
Re‐imagining Fulfilment
1
23
4
3
Investor Release 30
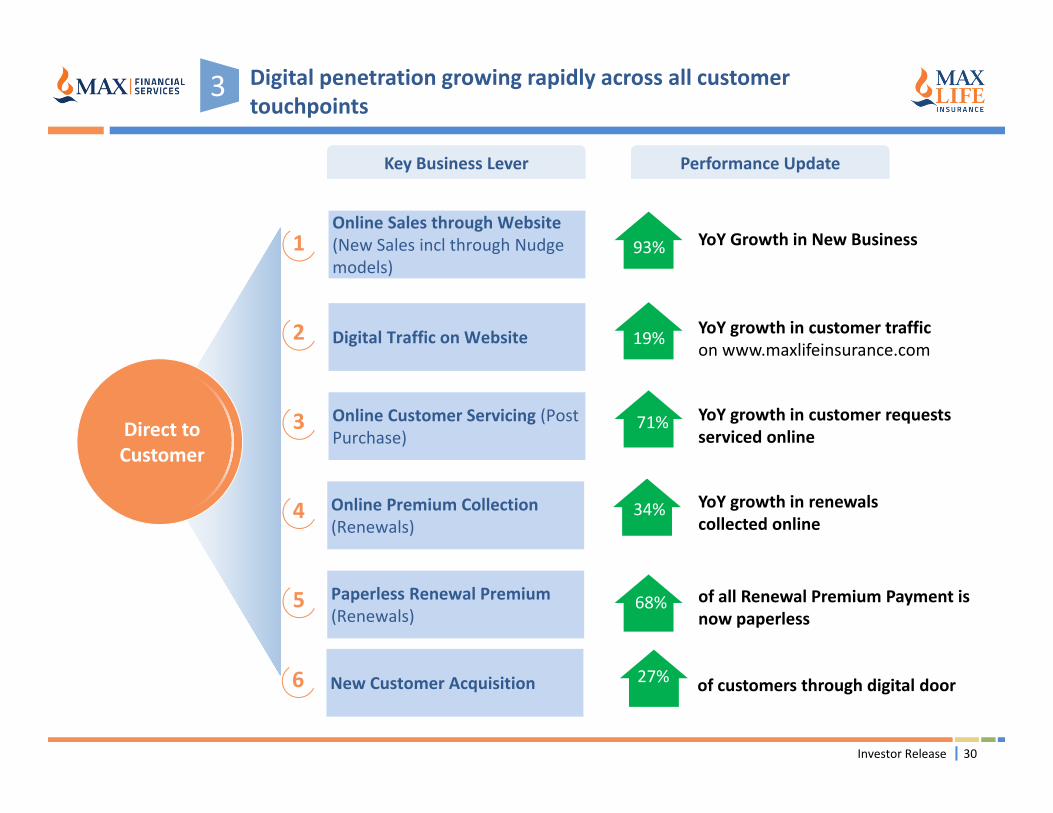
Digital penetration growing rapidly across all customer touchpoints
Online Sales through Website (New Sales incl through Nudge models)
Direct to Customer
Online Customer Servicing (Post Purchase)
Digital Traffic on Website
Online Premium Collection (Renewals)
93%1
2
3
4
Key Business LeverKey Business Lever Performance UpdatePerformance Update
15%
YoY Growth in New Business
YoY growth in customer trafficon www.maxlifeinsurance.com
19%
Paperless Renewal Premium (Renewals)
5
71%
34%
68%
YoY growth in customer requests serviced online
YoY growth in renewals collected online
of all Renewal Premium Payment is now paperless
3
New Customer Acquisition6 27% of customers through digital door
Investor Release 31
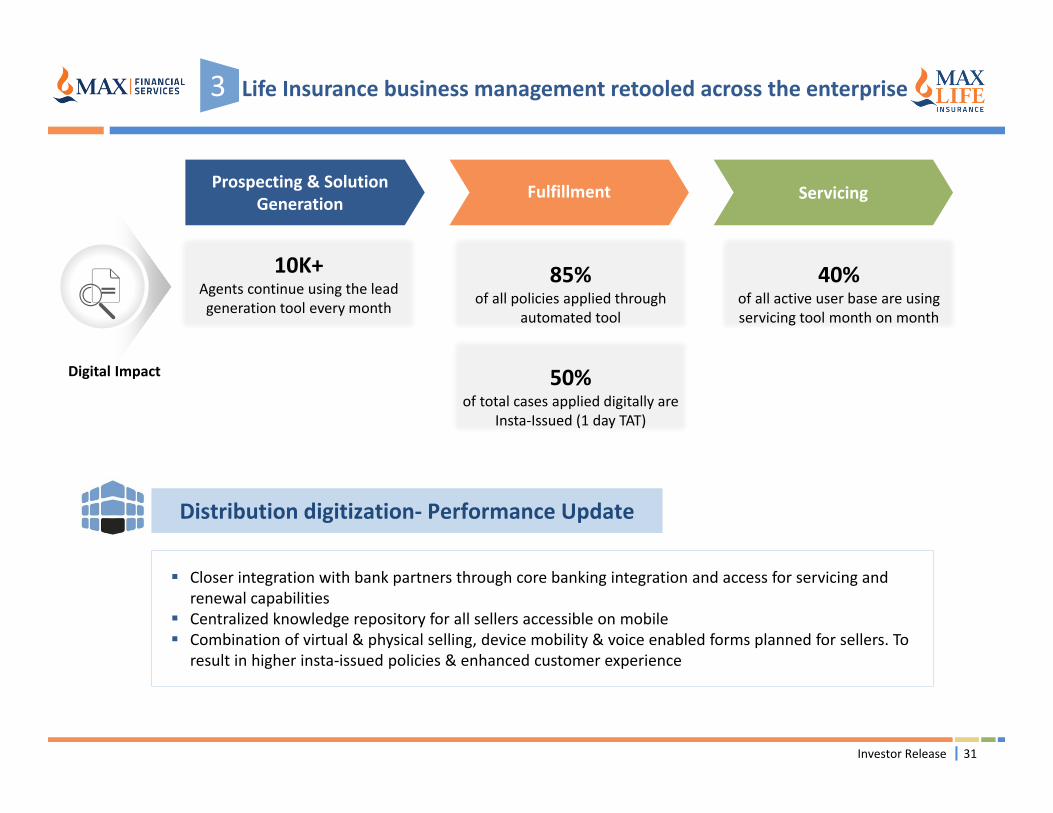
Prospecting & Solution Generation
Fulfillment Servicing
10K+Agents continue using the lead generation tool every month
10K+Agents continue using the lead generation tool every month
85%of all policies applied through
automated tool
85%of all policies applied through
automated tool
40%of all active user base are using servicing tool month on month
40%of all active user base are using servicing tool month on month
50%of total cases applied digitally are
Insta‐Issued (1 day TAT)
50%of total cases applied digitally are
Insta‐Issued (1 day TAT)
Digital Impact
Distribution digitization‐ Performance Update
Life Insurance business management retooled across the enterprise3
Closer integration with bank partners through core banking integration and access for servicing and renewal capabilities
Centralized knowledge repository for all sellers accessible on mobile Combination of virtual & physical selling, device mobility & voice enabled forms planned for sellers. To
result in higher insta‐issued policies & enhanced customer experience

32Investor ReleaseNote: Figures in Rs Cr.
EV movement analysis from March 2017 to March 2018
Operating RoEV: 20.6%
Operating return on EV of 20.6% is mainly driven by new business growth and unwind.
Operating variances are positive due to demographic experience variances along with certain modeling enhancements.
Non‐operating variances are mainly driven by equity and interest rate movements since March 2017.
The final shareholder dividend of Rs 197 Cr for H2 FY18 will be accounted post 31st March 2018. Post the payment of the final dividend, the closing EV will be Rs 7,509 Cr.
NAV2,398
NAV2,678
NAV2,481
VIF4,192
VIF5,028
VIF 5,028
656
641 62 47 196 197
Opening EV Value ofNew Business
Unwind Operatingvariance
Non‐OperatingVariance
Dividend paidduring the year
Closing EV(before finaldividend)
Final proposeddividend
Closing EV(after finaldividend)
6,590
7,706 7,509

33Investor Release
Key Results – Embedded Value and VNB Disclosure for Q1FY19
The Embedded Value1 (EV) as at 30th June 2018 is Rs 7,645 Cr.
The annualized Operating Return on EV (RoEV) over Q1 FY19 is circa 15.0%. Due to the salesbeing skewed towards later part of the year and investments being made by the Company inexpansion of proprietary channels, the impact of cost overrun is higher for Q1 FY19 leading tolower RoEV than full year level.
The New Business Margin (NBM) for Q1 FY19 is 23.5% (before allowing for acquisition operatingcost overrun) and 18.1% (post overrun). The Value of New Business (VNB) written over the periodis Rs 101 Cr (post overrun).
Notes:1 Max Life’s Embedded Value (EV) is based on a market consistent methodology. However, they are not intended to be compliant with the MCEV Principles issued by the Stitching CFO Forum Foundation (CFO Forum) or the Actuarial Practice Standard 10 (APS10) as issued by the Institute of Actuaries of India.
Corporate tax rate is assumed to be 14.56% for life business and nil for pension business.

34
Awards and recognitions for Max Life
CELENT MODELINSURER AWARD in the Asia Pacific Region
Best use of six sigma in banking and financial sector ‐ Insta claim (1 day approval)
Best Life Insurance company
Best business leader –Sumit Rai
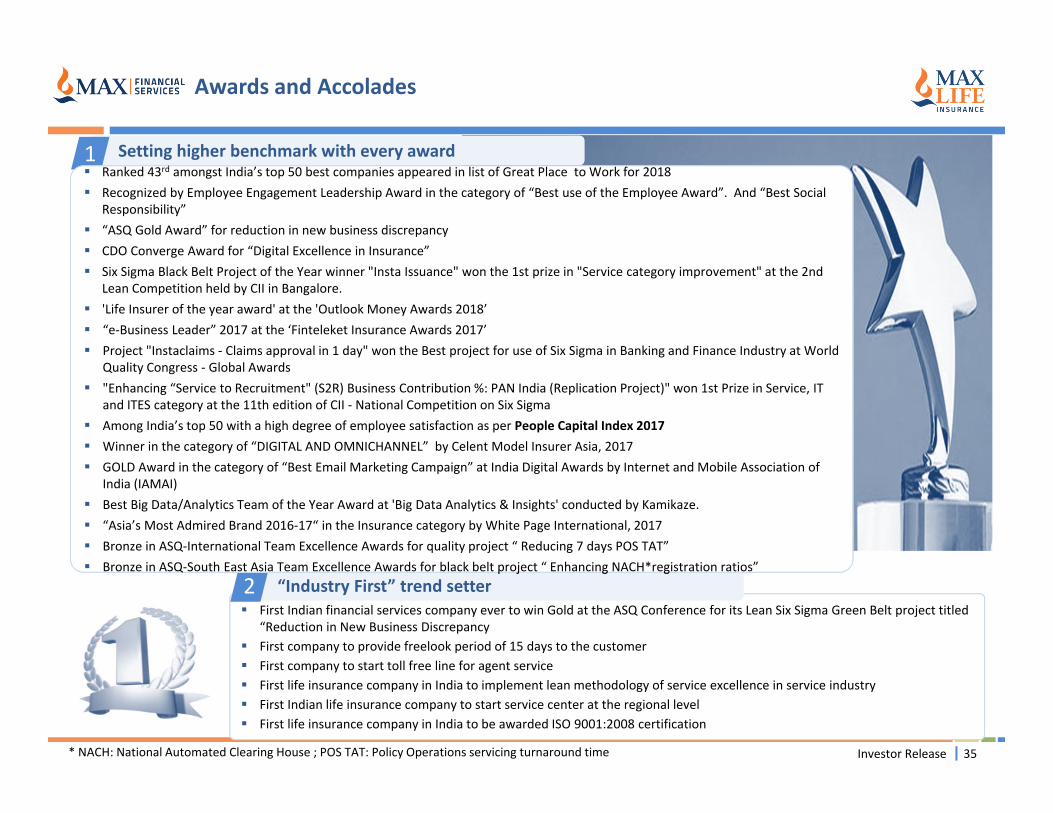
First Indian financial services company ever to win Gold at the ASQ Conference for its Lean Six Sigma Green Belt project titled “Reduction in New Business Discrepancy
First company to provide freelook period of 15 days to the customer First company to start toll free line for agent service First life insurance company in India to implement lean methodology of service excellence in service industry First Indian life insurance company to start service center at the regional level First life insurance company in India to be awarded ISO 9001:2008 certification
“Industry First” trend setter“Industry First” trend setter2
Setting higher benchmark with every awardSetting higher benchmark with every award1d
Q p j g g
Ranked 43rd amongst India’s top 50 best companies appeared in list of Great Place to Work for 2018 Recognized by Employee Engagement Leadership Award in the category of “Best use of the Employee Award”. And “Best Social
Responsibility” “ASQ Gold Award” for reduction in new business discrepancy CDO Converge Award for “Digital Excellence in Insurance” Six Sigma Black Belt Project of the Year winner "Insta Issuance" won the 1st prize in "Service category improvement" at the 2nd
Lean Competition held by CII in Bangalore. 'Life Insurer of the year award' at the 'Outlook Money Awards 2018’ “e‐Business Leader” 2017 at the ‘Finteleket Insurance Awards 2017’ Project "Instaclaims ‐ Claims approval in 1 day" won the Best project for use of Six Sigma in Banking and Finance Industry at World
Quality Congress ‐ Global Awards "Enhancing “Service to Recruitment" (S2R) Business Contribution %: PAN India (Replication Project)" won 1st Prize in Service, IT
and ITES category at the 11th edition of CII ‐ National Competition on Six Sigma Among India’s top 50 with a high degree of employee satisfaction as per People Capital Index 2017 Winner in the category of “DIGITAL AND OMNICHANNEL” by Celent Model Insurer Asia, 2017 GOLD Award in the category of “Best Email Marketing Campaign” at India Digital Awards by Internet and Mobile Association of
India (IAMAI) Best Big Data/Analytics Team of the Year Award at 'Big Data Analytics & Insights' conducted by Kamikaze. “Asia’s Most Admired Brand 2016‐17“ in the Insurance category by White Page International, 2017 Bronze in ASQ‐International Team Excellence Awards for quality project “ Reducing 7 days POS TAT” Bronze in ASQ‐South East Asia Team Excellence Awards for black belt project “ Enhancing NACH*registration ratios”
35
Awards and Accolades
* NACH: National Automated Clearing House ; POS TAT: Policy Operations servicing turnaround time Investor Release

Thank you

37
Annexure

38
Rank CompanyIndividual new business premium (Rs Cr)
Q1FY19 Q1FY18 Growth (%) Private Market Share (%)
1 ICICI Prudential Life 1,282 1,636 ‐22% 21.0%
2 SBI Life 1,204 1,108 9% 19.7%
3 HDFC Standard Life 812 687 18% 13.3%
4 Max Life 526 458 15% 8.6%
5 Bajaj Allianz Life 283 278 2% 4.6%
6 Tata AIA Life 265 194 37% 4.3%
7 Aditya Birla Sun Life 227 162 40% 3.7%
8 PNB MetLife 225 191 17% 3.7%
9 Kotak Life 208 186 12% 3.4%
10 Reliance Nippon Life 171 138 23% 2.8%
Others 904 803 12% 14.8%
Private Total 6,105 5,840 5%
LIC 5,213 4,878 7%
Grand Total 11,318 10,718 6%
Market Share of private players 53.9% 54.5%
Max Life maintains 4th rank among private players

Key Business Drivers Unit Quarter Ended
Y‐o‐Y GrowthJun'17 Jun'18
a) Individual Adjusted Premium Rs. Crore 458 527 15%
b) Gross written premium income Rs. Crore 2,007 2,320 16%
First year premium 453 536 18%
Renewal premium 1,342 1,554 16%
Single premium 212 230 9%
c) Shareholder Profit (Pre Tax) Rs. Crore 106 91 ‐14%
d) Policy Holder Expense to Gross Premium % 19.0% 17.3% >100 bps
e) Conservation ratio % 92.0% 90.8% >100 bps
f) Average case size(Agency) Rs. 45,965 56,235 22%
g) Case rate per agent per month No. 0.18 0.16 ‐9%
h) Number of agents (Agency) No. 53,120 55,610 5%
i) Share Capital Rs. Crore 1,919 1,919 0%
j) Individual Policies in force No. Lacs 39.06 40.81 4%
k) Sum insured in force Rs. Crore 390,017 538,956 38%
l) Grievance RatioPer Tenthousand 174 87 NA
m) No. of offices # 210 257 47
39
Performance update‐ Q1’FY19
Investor Release

40Investor Release
Overview of the components of the EV as at 30th June 2018
Net worth and EVVIF
Present Value of Future Profits(PVFP)
Rs 5,992Cr
Value of Inforce(VIF)
Rs 5,141 Cr
Time value of financial options and guarantees
Frictional cost Net Worth
Rs 2,504 Cr
Market value of Shareholders’ owned assets over liabilities
EVRs 7,645 Cr
Cost of residual non‐hedgeable
risks
TVFOG Rs 21 Cr CRNHR
Rs 716 Cr FC Rs 114 Cr
1. The deductions for risks to arrive at the VIF represent a reduction of ~14% in the PVFP, in line with last year’s reduction. The largest deduction is in respect of CRNHR.
2. Within CRNHR, persistency risk constitutes the largest risk component.
Note: Figures in Rs Cr. And may not add up due to rounding

41Investor Release
Value of New Business and New Business Margins as at 30th June 2018
The New Business Margin (NBM) before cost overrun has increased by circa 130 bps to 23.5% for Q1 FY19compared to 22.2% for Q1 FY18. The increase in margin is primarily driven by higher contribution of protection‐oriented products.
Post allowing for acquisition operating cost overrun chargeable to Shareholders, the NBM would reduce to18.1% for Q1 FY19 compared to 18.0% for Q1 FY18. The impact of cost overrun is higher for Q1 FY19 for reasonsmentioned earlier. For the full year FY19, based on managements’ expectation of sales and costs, the NBM islikely to be in excess of 20%.
Description Q1 FY18 Q1 FY19 Y‐o‐Y growth
APE 1 478 558 17%
New Business Margin (NBM)(before cost overrun) 22.2% 23.5% +130 bps
New Business Margin (NBM)(post cost overrun) 18.0% 18.1% +10 bps
Value of New Business (VNB) (post cost overrun) 86 101 17%
1 Annual Premium Equivalent (APE) is calculated as 100% of regular premium + 10% of single premium.2 The VNB is accumulated from the point of sale to the end of the reporting period (i.e. 30th June 2018), using the beginning of quarter’s risk free yield curve.
Note: Figures in Rs Cr.

42Investor ReleaseNote: Figures in Rs Cr.
Sensitivity analysis as at 31st March 2018
SensitivityEV New business
Value (Rs Cr) % change VNB (Rs Cr) | NBM % change
Base Case (before final SH dividends) 7,706 ‐ 656 | 20.2% ‐
Lapse/Surrender ‐ 10% increase 7,562 (2%) 620 | 19.1% (5%)
Lapse/Surrender ‐ 10% decrease 7,859 2% 694 | 21.4% 6%
Mortality ‐ 10% increase 7,605 (1%) 632 | 19.5% (4%)
Mortality ‐ 10% decrease 7,807 1% 679 | 20.9% 4%
Expenses ‐ 10% increase 7,640 (1%) 621 | 19.1% (5%)
Expenses ‐ 10% decrease 7,772 1% 691 | 21.3% 5%
Risk free rates ‐ 1% increase 7,561 (2%) 688 | 21.2% 5%
Risk free rates ‐ 1% reduction 7,826 2% 612 | 18.9% (7%)
Equity values ‐ 10% immediate rise 7,760 1% 656 | 20.2% Negligible
Equity values ‐ 10% immediate fall 7,652 (1%) 656 | 20.2% Negligible
Corporate tax Rate – 2% increase 7,577 (2%) 637 | 19.6% (3%)
Corporate tax Rate – 2% decrease 7,835 2% 675 | 20.8% 3%
Corporate tax rate increased to 25% 7,034 (9%) 559 | 17.2% (15%)
1. Reduction in interest rate curve leads to an increase in the value of assets which offsets the loss in the value of future profits.
2. Risk free rate sensitivities allow for the change in cost of hedging due to derivative arrangements. The cost of hedging reduces under the risk free rate reduction sensitivity and increases under the risk free rate increase sensitivity.

Investor Release 43
Key Assumptions for the EV and VNB (1/2)
Economic Assumptions
The EV is calculated using risk free (government bond) spot rate yield curve taken from FBIL1 as at 30th June 2018. The VNB is calculated using the beginning of respective quarter’s risk free yield curve (i.e. 31st March 2018).
No allowance has been made for liquidity premium because of lack of credible information on liquidity spreads in the Indian market.
A flat rate adjustment is made to the yield curve such that the market value of government bonds is equal to discounted value of future cash flows of those bonds.
Samples from the un‐adjusted 30th June 2018 and 31st March 2018 spot rate yield curves used:
Demographic Assumptions
The lapse and mortality assumptions are approved by a Board committee and are set by product line and distribution channel on a best estimate basis, based on the following principles:
Assumptions are based on last one year experience and expectations of future experience given the likely impact of current and proposed management actions on such assumptions.
Aims to avoid arbitrary changes, discontinuities and volatility where it can be justified.
Aims to exclude the impacts of non‐recurring factors.
1 Financial Benchmark India Pvt. Ltd.
Year 1 2 3 4 5 10 15 20 25 30
Mar 18 6.53% 6.83% 7.09% 7.26% 7.43% 7.41% 7.69% 7.85% 7.72% 7.51%
Jun 18 7.34% 7.79% 7.96% 8.07% 8.24% 8.13% 8.32% 8.35% 8.27% 8.16%
Change 0.81% 0.96% 0.87% 0.81% 0.81% 0.72% 0.63% 0.50% 0.55% 0.65%

Investor Release 44
Key Assumptions for the EV and VNB (2/2)
Expense and Inflation
Maintenance expenses are based on the recent expense studies performed internally by the Company. The VIF is reduced for the value of any maintenance expense overrun in the future. The overrun represents the excess maintenance expenses expected to be incurred by the Company over the expense loadings assumed in the calculation of PVFP.
Future CSR related expenses have been taken to be 2% of post tax (risk adjusted) profits emerging each year.
Expenses denominated in fixed rupee terms are inflated at 6.0% per annum.
The commission rates are based on the actual commission payable, if any.
Tax
The corporate tax rate is assumed to be 14.56% for life business and nil for pension business.
For participating business, the transfers to shareholders resulting from surplus distribution are not taxed as tax is assumedto be deducted before surplus is distributed to policyholders and shareholders.
Goods and Service tax is assumed to be 18%.
The mark to market adjustments are also adjusted for tax.
