maus kpi dashboard manual kpi and strategy... · maus kpi dashboard manual maus business systems 02...
TRANSCRIPT
1
MAUS KPI Dashboard Manual
MAUS Business Systems
02 9907 1669
www.maus.com.au
MAUS KPI Dashboard is a fast and easy way to manage your staff, division, and company KPIs. KPI Dashboard enables you to instantly create a one-page snapshot for your business, create customised KPIs for financial and non-financial data, and view and export a range of analysis graphs and tables.
2
Another Quality MAUS Product
Copyrights
© Copyright 2015 MAUS Business Systems.
All Rights Reserved. Printed in Australia.
Acknowledgements
Product Design & Concept: Peter Hickey
Programming: Developed by the very talented MAUS programming team.
Important
By using this software, you accept the terms and conditions of this licence agreement. If you do not agree with the licence agreement, you should not use the software and return it immediately.
Important Disclaimer
No person should rely on the contents of this publication without first obtaining advice from a qualified professional person. This publication and software package is sold on the terms and understanding that
(1) The authors, consultants and editors are not responsible for the results of any actions taken on the basis of information in this publication, nor for any error in or omission from this publication; and
(2) The publisher is not engaged in rendering legal, accounting, professional or other advice or services.
The publisher, and the authors, consultants and editors, expressly disclaim all and any liability and responsibility to any person, whether a purchaser or reader of this publication or not, in respect of anything, and of the consequences of anything, done or omitted to be done by any such person in reliance, whether wholly or partially, upon the whole or any part of the contents of this publication. Without limiting the generality of the above, no author, consultant or editor shall have any responsibility for any act or omission of any other author, consultant or editor.
User Agreement The full user agreement can be found at the back of the full MAUS Hub User Manual
3
Table of Contents
ANOTHER QUALITY MAUS PRODUCT ....................................................................................................................... 2
COPYRIGHTS ........................................................................................................................................................ 2
ACKNOWLEDGEMENTS ......................................................................................................................................... 2
IMPORTANT .......................................................................................................................................................... 2
IMPORTANT DISCLAIMER ...................................................................................................................................... 2
USER AGREEMENT ............................................................................................................................................... 2
ABOUT THIS QUICK START GUIDE ............................................................................................................................... 4
GENERAL NAVIGATION TIPS: ...................................................................................................................................... 4
ABOUT THE KPI & STRATEGY MODULE ....................................................................................................................... 5
The KPI Dashboard module allows you to: ........................................................................................................ 5
SETTINGS – MANAGE KPIS ....................................................................................................................................... 6
To Add new KPIs: .............................................................................................................................................. 6
To Edit your KPIs .............................................................................................................................................. 7
To Sort your KPIs .............................................................................................................................................. 7
SETTINGS - MANAGE GROUPS ................................................................................................................................. 8
Navigation and General Group Info: ................................................................................................................. 8
To Create a New Group: ................................................................................................................................... 8
To Rename a Group: ........................................................................................................................................ 8
To Sort Groups: ................................................................................................................................................ 8
To Move a Sub-Group to a Division (Group): ..................................................................................................... 9
To Assign or Remove or Remove a KPI: ............................................................................................................. 9
To Setup Group Tags: ....................................................................................................................................... 9
ENTER KPI DATA ..................................................................................................................................................... 10
To Enter your KPI Data: .................................................................................................................................. 10
Entering Successes, Obstacles, Achivements, and Future Plans: ...................................................................... 10
Exporting/Importing Data Sheets: .................................................................................................................. 10
ONE PAGE SNAP SHOT ........................................................................................................................................... 12
To view a One Page Snapshot: ....................................................................................................................... 12
To View a Graphs Snapshot: ........................................................................................................................... 13
To View a Snapshot by KPI: ............................................................................................................................ 13
To View a Snapshot by Task: .......................................................................................................................... 13
VIEW KPI ................................................................................................................................................................ 14
To View an overview of a KPI or Group: .......................................................................................................... 14
GENERATING REPORTS .......................................................................................................................................... 15
To Generate a report by Group or KPI: ............................................................................................................ 15
To Generate a Summarised Report: ................................................................................................................ 16
To Generate a Rankings Report: ..................................................................................................................... 16
4
About this Quick Start guide The Quick Start button from the right hand menu gives you access to the KPI Dashboard Manual. If you have received this help file through an email or other means, you can access it again by:
1. Hovering over Menu Items within KPI Dashboard 2. Selecting Quick Start
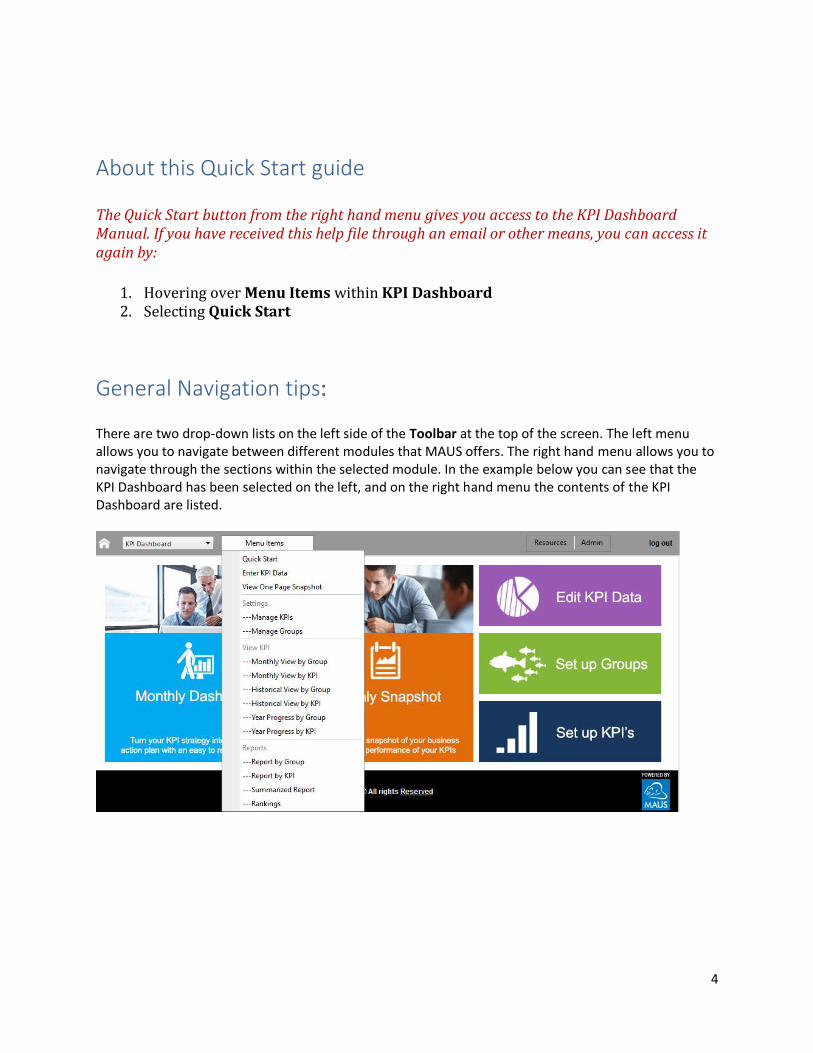
General Navigation tips: There are two drop-down lists on the left side of the Toolbar at the top of the screen. The left menu allows you to navigate between different modules that MAUS offers. The right hand menu allows you to navigate through the sections within the selected module. In the example below you can see that the KPI Dashboard has been selected on the left, and on the right hand menu the contents of the KPI Dashboard are listed.
5
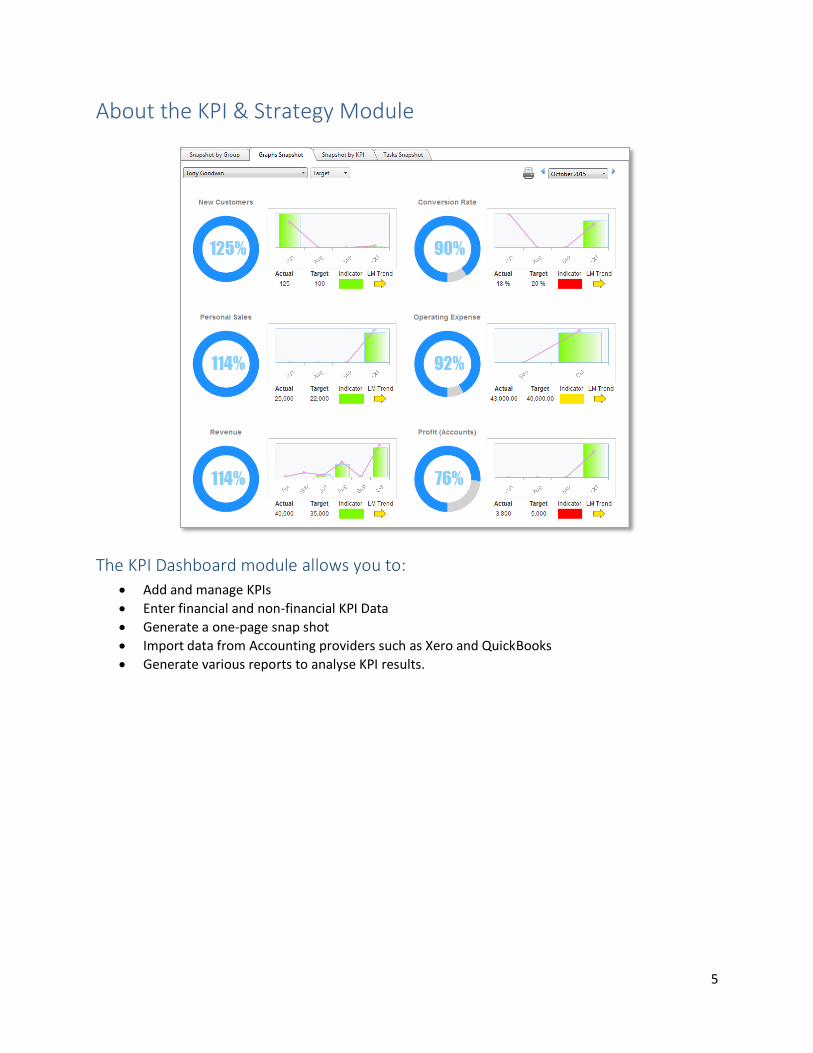
About the KPI & Strategy Module
The KPI Dashboard module allows you to:
Add and manage KPIs
Enter financial and non-financial KPI Data
Generate a one-page snap shot
Import data from Accounting providers such as Xero and QuickBooks
Generate various reports to analyse KPI results.
6
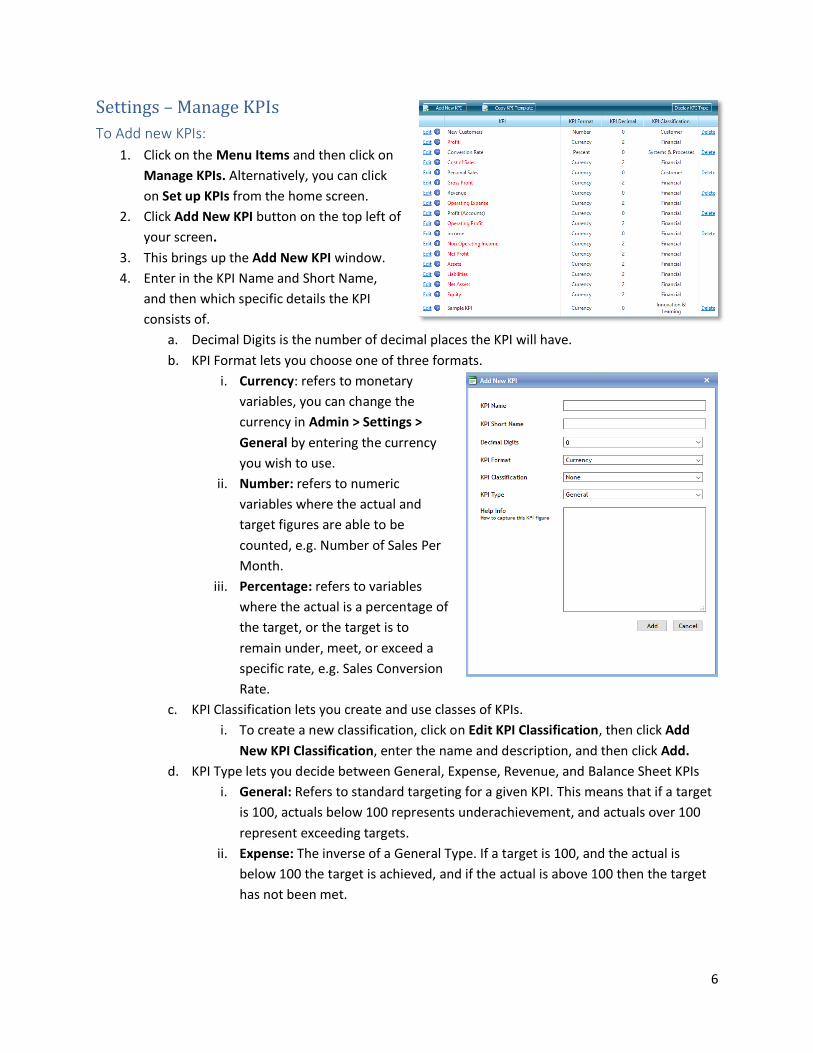
Settings – Manage KPIs
To Add new KPIs:
1. Click on the Menu Items and then click on
Manage KPIs. Alternatively, you can click
on Set up KPIs from the home screen.
2. Click Add New KPI button on the top left of
your screen.
3. This brings up the Add New KPI window.
4. Enter in the KPI Name and Short Name,
and then which specific details the KPI
consists of.
a. Decimal Digits is the number of decimal places the KPI will have.
b. KPI Format lets you choose one of three formats.
i. Currency: refers to monetary
variables, you can change the
currency in Admin > Settings >
General by entering the currency
you wish to use.
ii. Number: refers to numeric
variables where the actual and
target figures are able to be
counted, e.g. Number of Sales Per
Month.
iii. Percentage: refers to variables
where the actual is a percentage of
the target, or the target is to
remain under, meet, or exceed a
specific rate, e.g. Sales Conversion
Rate.
c. KPI Classification lets you create and use classes of KPIs.
i. To create a new classification, click on Edit KPI Classification, then click Add
New KPI Classification, enter the name and description, and then click Add.
d. KPI Type lets you decide between General, Expense, Revenue, and Balance Sheet KPIs
i. General: Refers to standard targeting for a given KPI. This means that if a target
is 100, actuals below 100 represents underachievement, and actuals over 100
represent exceeding targets.
ii. Expense: The inverse of a General Type. If a target is 100, and the actual is
below 100 the target is achieved, and if the actual is above 100 then the target
has not been met.
7
iii. Revenue: Refers to standard targeting for a given KPI, however this should be
used in conjunction with a Currency KPI Format. This is calculated the same as
the General KPI Type.
iv. Balance Sheet: Refers to KPIs that will be used when importing data directly
from accounting software such as Xero or QuickBooks.
5. Enter in any Help Info that you require to instruct users how to obtain and interpret the data for
the KPI.
6. Click the Add button to create the KPI.
7. You will now see the KPI listed in the main Manage KPIs screen.
8. To show/hide the KPI type click on Display/Hide KPI TYPE button (Note once
you click the button it will change the button to reflect the alternative view).
To Edit your KPIs
1. Click on the Menu Items and then click on Manage KPIs. Alternatively, you can click on Set up
KPIs from the home screen.
2. Click the Edit button to the left of a KPIs name.
3. This will bring up the Edit KPI Window which lets you look at or amend any of the details of a
given KPI.
4. Click Update to save your changes, or Cancel to close the window without saving.
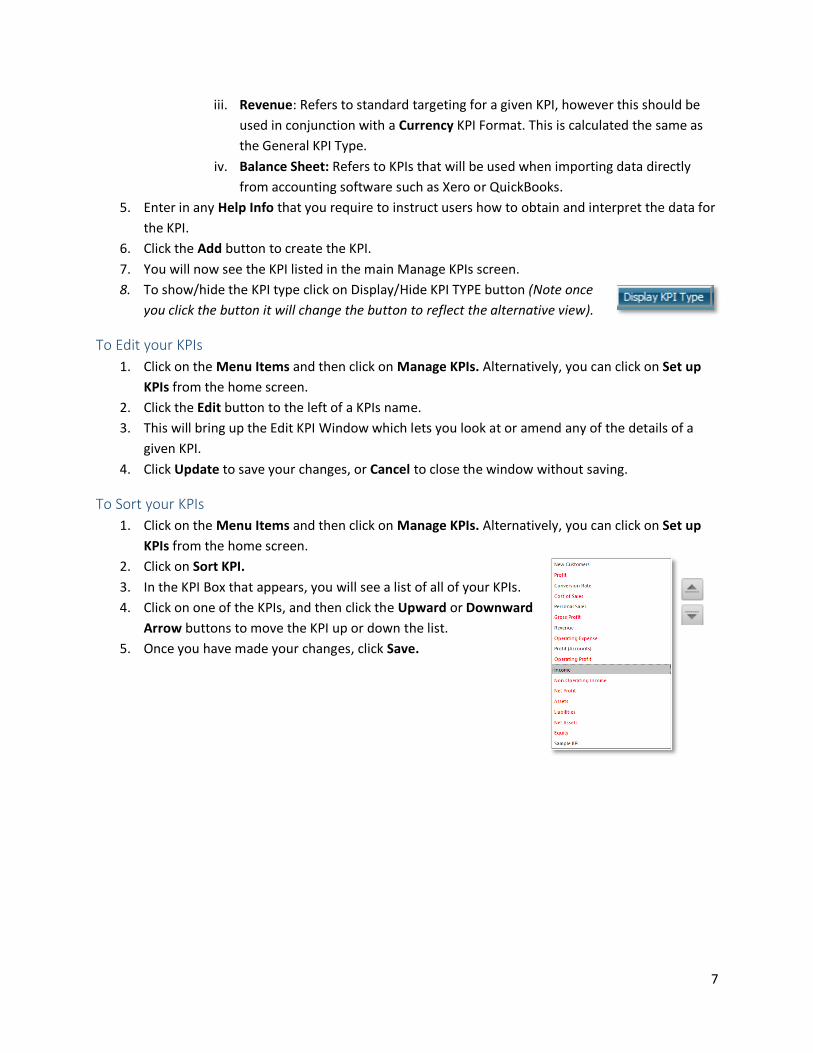
To Sort your KPIs
1. Click on the Menu Items and then click on Manage KPIs. Alternatively, you can click on Set up
KPIs from the home screen.
2. Click on Sort KPI.
3. In the KPI Box that appears, you will see a list of all of your KPIs.
4. Click on one of the KPIs, and then click the Upward or Downward
Arrow buttons to move the KPI up or down the list.
5. Once you have made your changes, click Save.
8
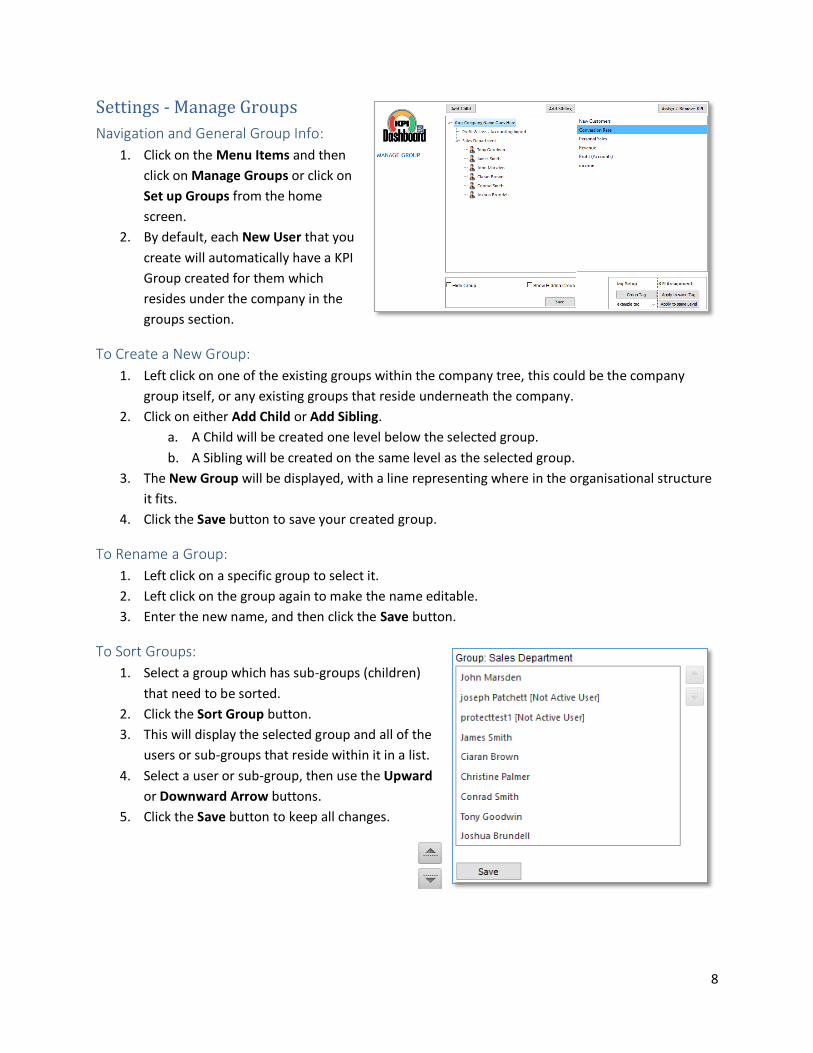
Settings - Manage Groups
Navigation and General Group Info:
1. Click on the Menu Items and then
click on Manage Groups or click on
Set up Groups from the home
screen.
2. By default, each New User that you
create will automatically have a KPI
Group created for them which
resides under the company in the
groups section.
To Create a New Group:
1. Left click on one of the existing groups within the company tree, this could be the company
group itself, or any existing groups that reside underneath the company.
2. Click on either Add Child or Add Sibling.
a. A Child will be created one level below the selected group.
b. A Sibling will be created on the same level as the selected group.
3. The New Group will be displayed, with a line representing where in the organisational structure
it fits.
4. Click the Save button to save your created group.
To Rename a Group:
1. Left click on a specific group to select it.
2. Left click on the group again to make the name editable.
3. Enter the new name, and then click the Save button.
To Sort Groups:
1. Select a group which has sub-groups (children)
that need to be sorted.
2. Click the Sort Group button.
3. This will display the selected group and all of the
users or sub-groups that reside within it in a list.
4. Select a user or sub-group, then use the Upward
or Downward Arrow buttons.
5. Click the Save button to keep all changes.
9
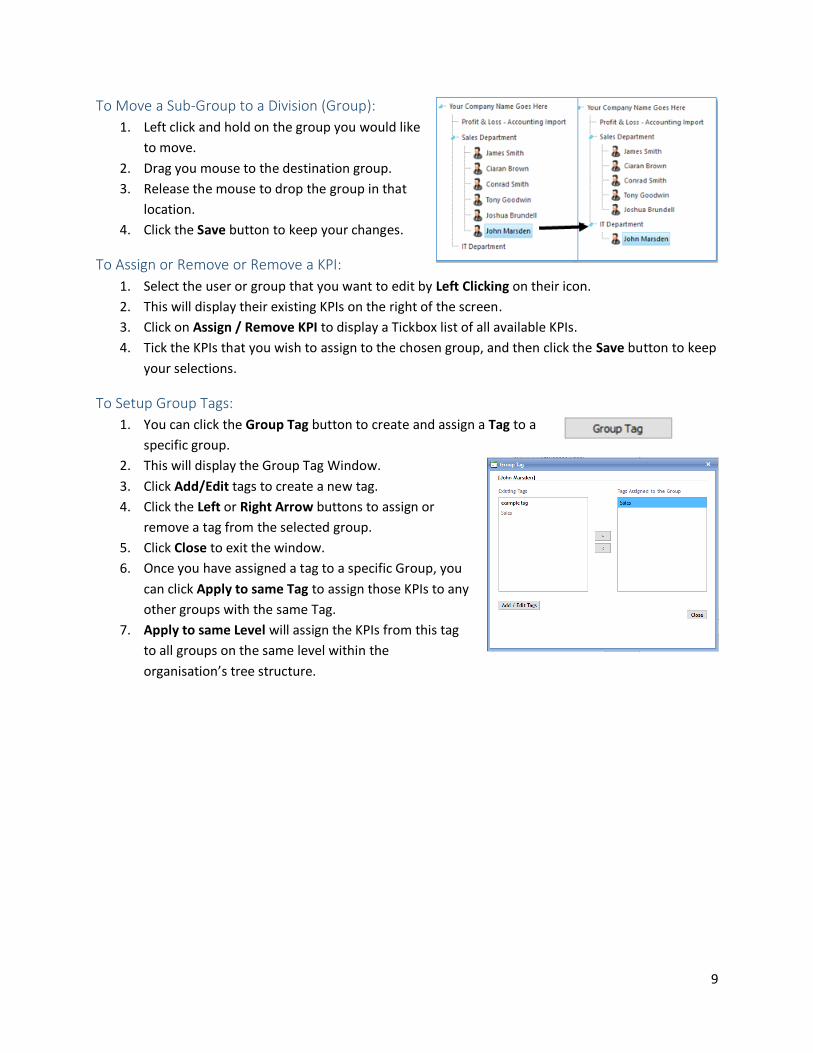
To Move a Sub-Group to a Division (Group):
1. Left click and hold on the group you would like
to move.
2. Drag you mouse to the destination group.
3. Release the mouse to drop the group in that
location.
4. Click the Save button to keep your changes.
To Assign or Remove or Remove a KPI:
1. Select the user or group that you want to edit by Left Clicking on their icon.
2. This will display their existing KPIs on the right of the screen.
3. Click on Assign / Remove KPI to display a Tickbox list of all available KPIs.
4. Tick the KPIs that you wish to assign to the chosen group, and then click the Save button to keep
your selections.
To Setup Group Tags:
1. You can click the Group Tag button to create and assign a Tag to a
specific group.
2. This will display the Group Tag Window.
3. Click Add/Edit tags to create a new tag.
4. Click the Left or Right Arrow buttons to assign or
remove a tag from the selected group.
5. Click Close to exit the window.
6. Once you have assigned a tag to a specific Group, you
can click Apply to same Tag to assign those KPIs to any
other groups with the same Tag.
7. Apply to same Level will assign the KPIs from this tag
to all groups on the same level within the
organisation’s tree structure.
10
Enter KPI Data
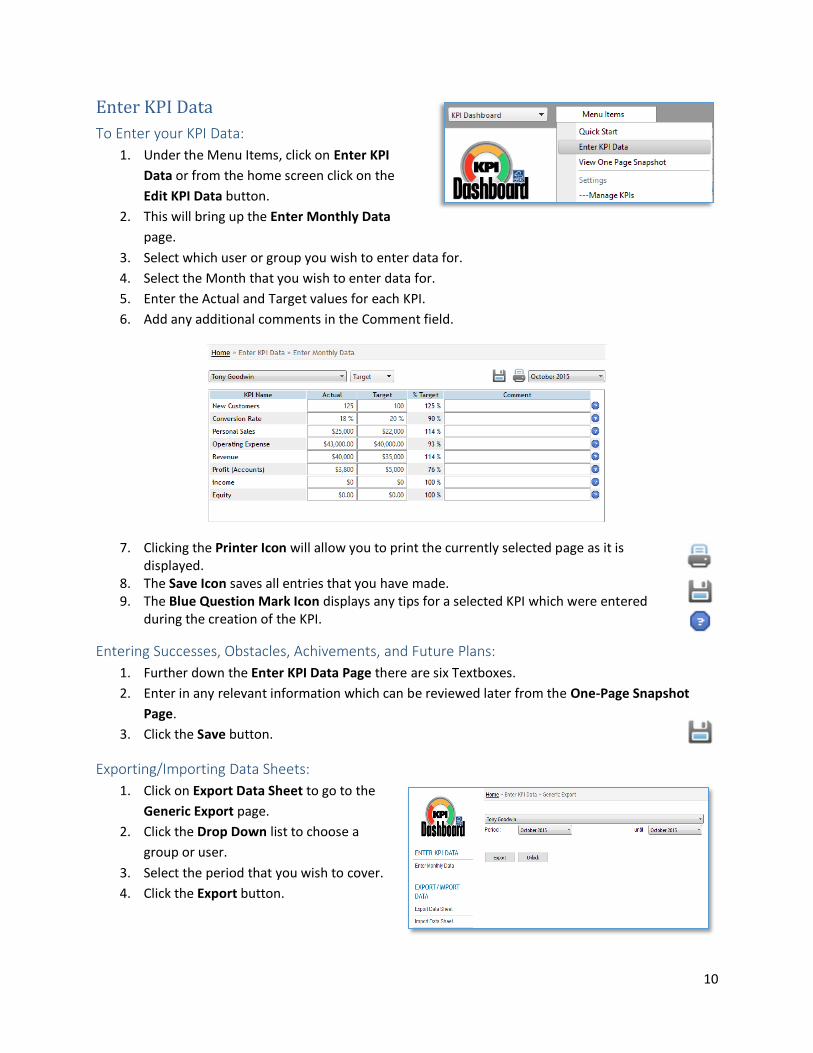
To Enter your KPI Data:
1. Under the Menu Items, click on Enter KPI
Data or from the home screen click on the
Edit KPI Data button.
2. This will bring up the Enter Monthly Data
page.
3. Select which user or group you wish to enter data for.
4. Select the Month that you wish to enter data for.
5. Enter the Actual and Target values for each KPI.
6. Add any additional comments in the Comment field.
7. Clicking the Printer Icon will allow you to print the currently selected page as it is displayed.
8. The Save Icon saves all entries that you have made. 9. The Blue Question Mark Icon displays any tips for a selected KPI which were entered
during the creation of the KPI.
Entering Successes, Obstacles, Achivements, and Future Plans:
1. Further down the Enter KPI Data Page there are six Textboxes.
2. Enter in any relevant information which can be reviewed later from the One-Page Snapshot
Page.
3. Click the Save button.
Exporting/Importing Data Sheets:
1. Click on Export Data Sheet to go to the
Generic Export page.
2. Click the Drop Down list to choose a
group or user.
3. Select the period that you wish to cover.
4. Click the Export button.
11
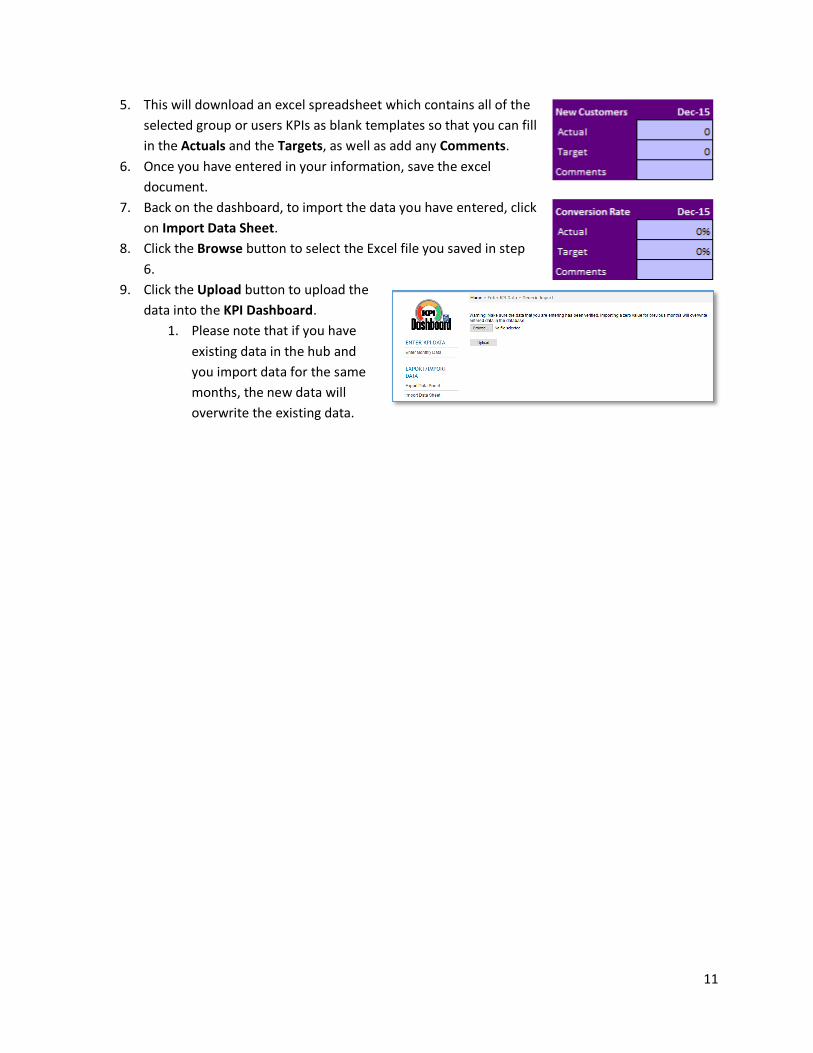
5. This will download an excel spreadsheet which contains all of the
selected group or users KPIs as blank templates so that you can fill
in the Actuals and the Targets, as well as add any Comments.
6. Once you have entered in your information, save the excel
document.
7. Back on the dashboard, to import the data you have entered, click
on Import Data Sheet.
8. Click the Browse button to select the Excel file you saved in step
6.
9. Click the Upload button to upload the
data into the KPI Dashboard.
1. Please note that if you have
existing data in the hub and
you import data for the same
months, the new data will
overwrite the existing data.
12
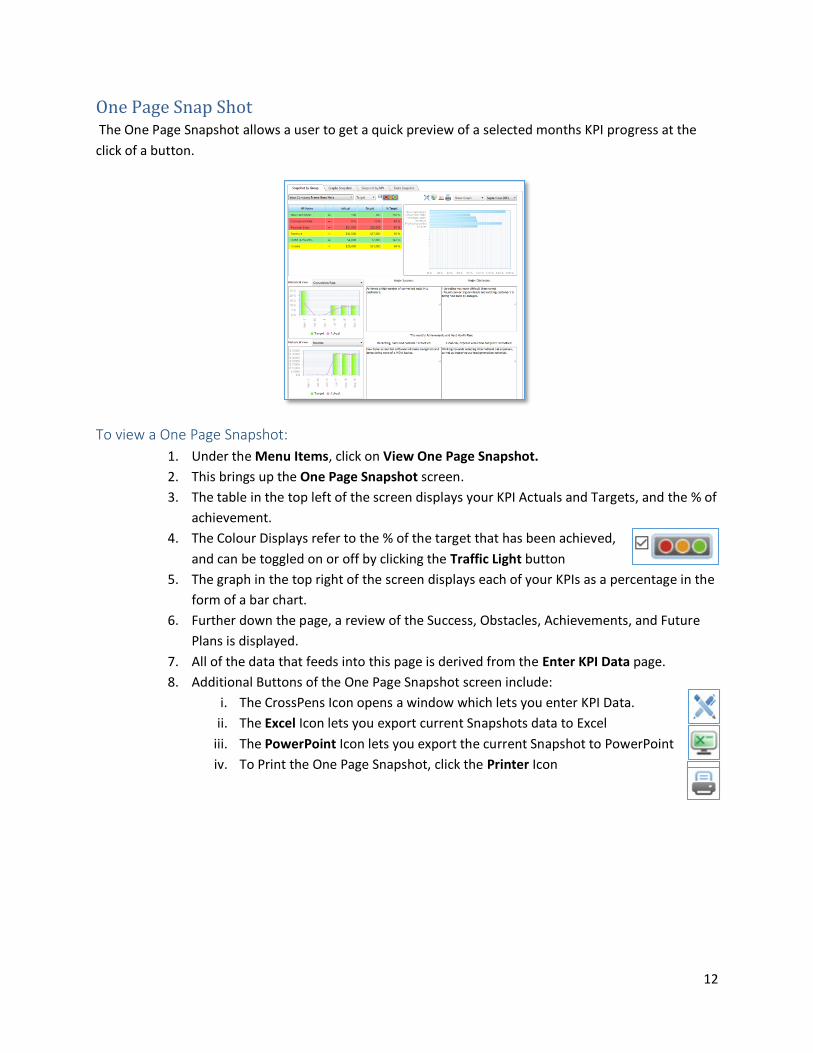
One Page Snap Shot The One Page Snapshot allows a user to get a quick preview of a selected months KPI progress at the
click of a button.
To view a One Page Snapshot:
1. Under the Menu Items, click on View One Page Snapshot.
2. This brings up the One Page Snapshot screen.
3. The table in the top left of the screen displays your KPI Actuals and Targets, and the % of
achievement.
4. The Colour Displays refer to the % of the target that has been achieved,
and can be toggled on or off by clicking the Traffic Light button
5. The graph in the top right of the screen displays each of your KPIs as a percentage in the
form of a bar chart.
6. Further down the page, a review of the Success, Obstacles, Achievements, and Future
Plans is displayed.
7. All of the data that feeds into this page is derived from the Enter KPI Data page.
8. Additional Buttons of the One Page Snapshot screen include:
i. The CrossPens Icon opens a window which lets you enter KPI Data.
ii. The Excel Icon lets you export current Snapshots data to Excel
iii. The PowerPoint Icon lets you export the current Snapshot to PowerPoint
iv. To Print the One Page Snapshot, click the Printer Icon
13
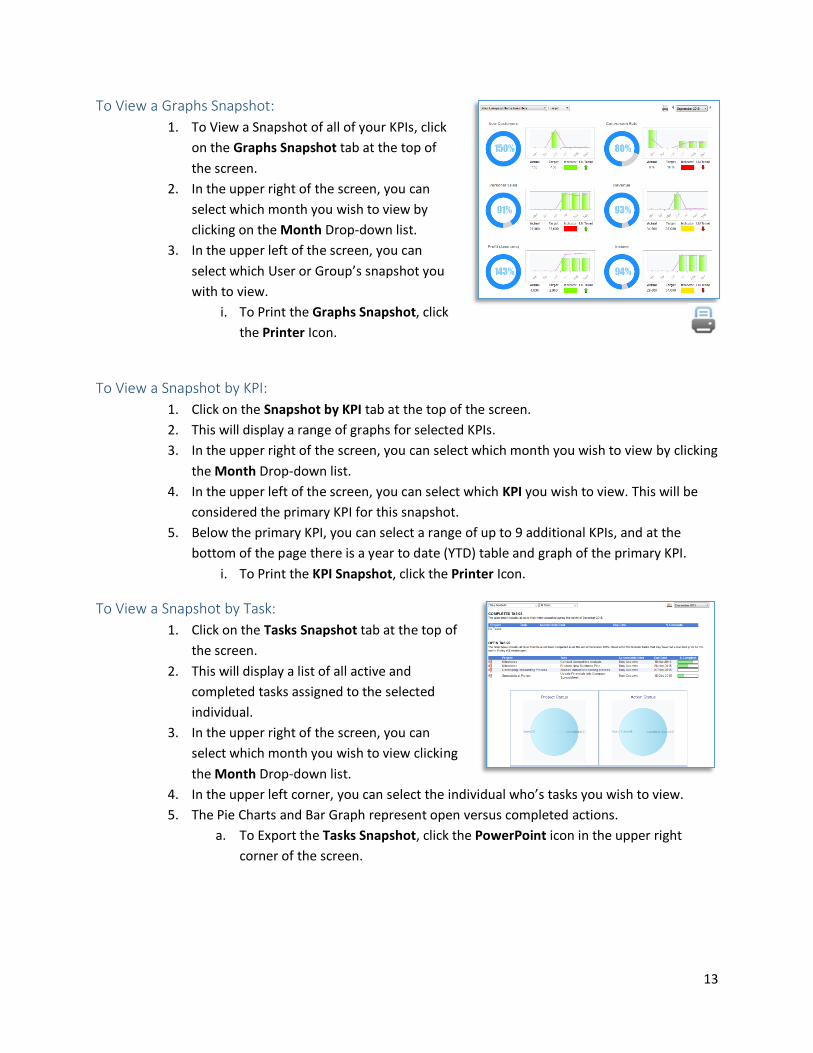
To View a Graphs Snapshot:
1. To View a Snapshot of all of your KPIs, click
on the Graphs Snapshot tab at the top of
the screen.
2. In the upper right of the screen, you can
select which month you wish to view by
clicking on the Month Drop-down list.
3. In the upper left of the screen, you can
select which User or Group’s snapshot you
with to view.
i. To Print the Graphs Snapshot, click
the Printer Icon.
To View a Snapshot by KPI:
1. Click on the Snapshot by KPI tab at the top of the screen.
2. This will display a range of graphs for selected KPIs.
3. In the upper right of the screen, you can select which month you wish to view by clicking
the Month Drop-down list.
4. In the upper left of the screen, you can select which KPI you wish to view. This will be
considered the primary KPI for this snapshot.
5. Below the primary KPI, you can select a range of up to 9 additional KPIs, and at the
bottom of the page there is a year to date (YTD) table and graph of the primary KPI.
i. To Print the KPI Snapshot, click the Printer Icon.
To View a Snapshot by Task:
1. Click on the Tasks Snapshot tab at the top of
the screen.
2. This will display a list of all active and
completed tasks assigned to the selected
individual.
3. In the upper right of the screen, you can
select which month you wish to view clicking
the Month Drop-down list.
4. In the upper left corner, you can select the individual who’s tasks you wish to view.
5. The Pie Charts and Bar Graph represent open versus completed actions.
a. To Export the Tasks Snapshot, click the PowerPoint icon in the upper right
corner of the screen.
14
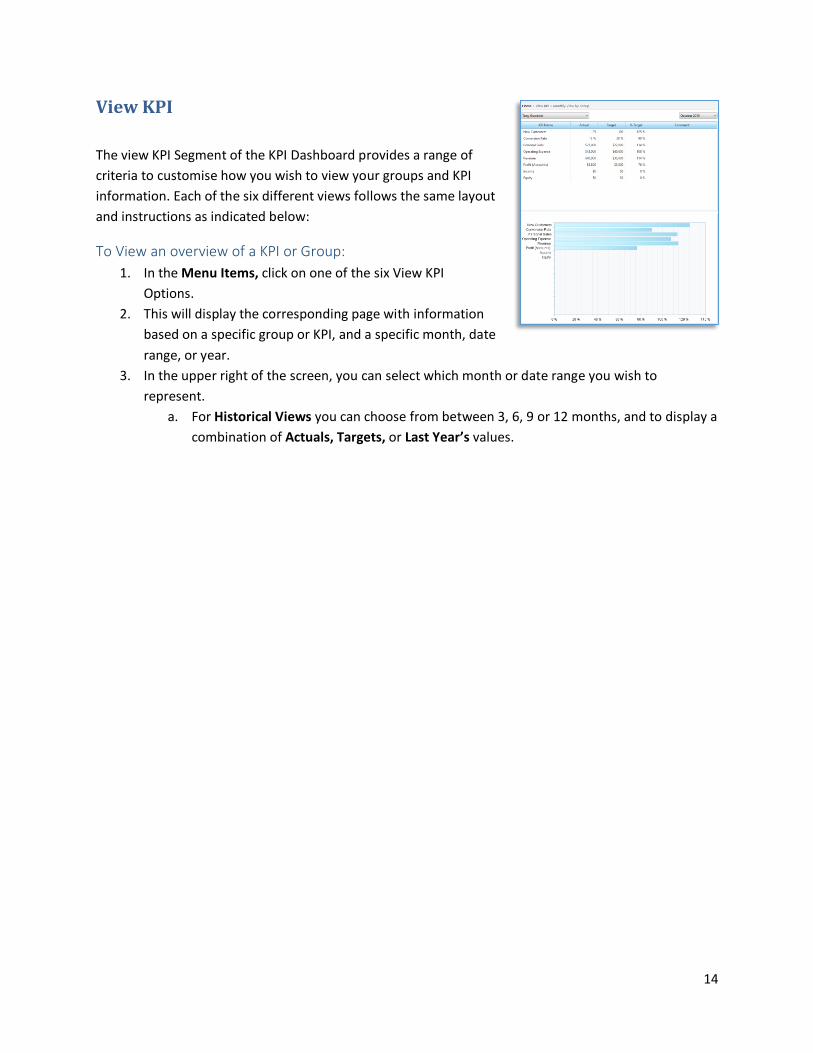
View KPI
The view KPI Segment of the KPI Dashboard provides a range of
criteria to customise how you wish to view your groups and KPI
information. Each of the six different views follows the same layout
and instructions as indicated below:
To View an overview of a KPI or Group:
1. In the Menu Items, click on one of the six View KPI
Options.
2. This will display the corresponding page with information
based on a specific group or KPI, and a specific month, date
range, or year.
3. In the upper right of the screen, you can select which month or date range you wish to
represent.
a. For Historical Views you can choose from between 3, 6, 9 or 12 months, and to display a
combination of Actuals, Targets, or Last Year’s values.
15
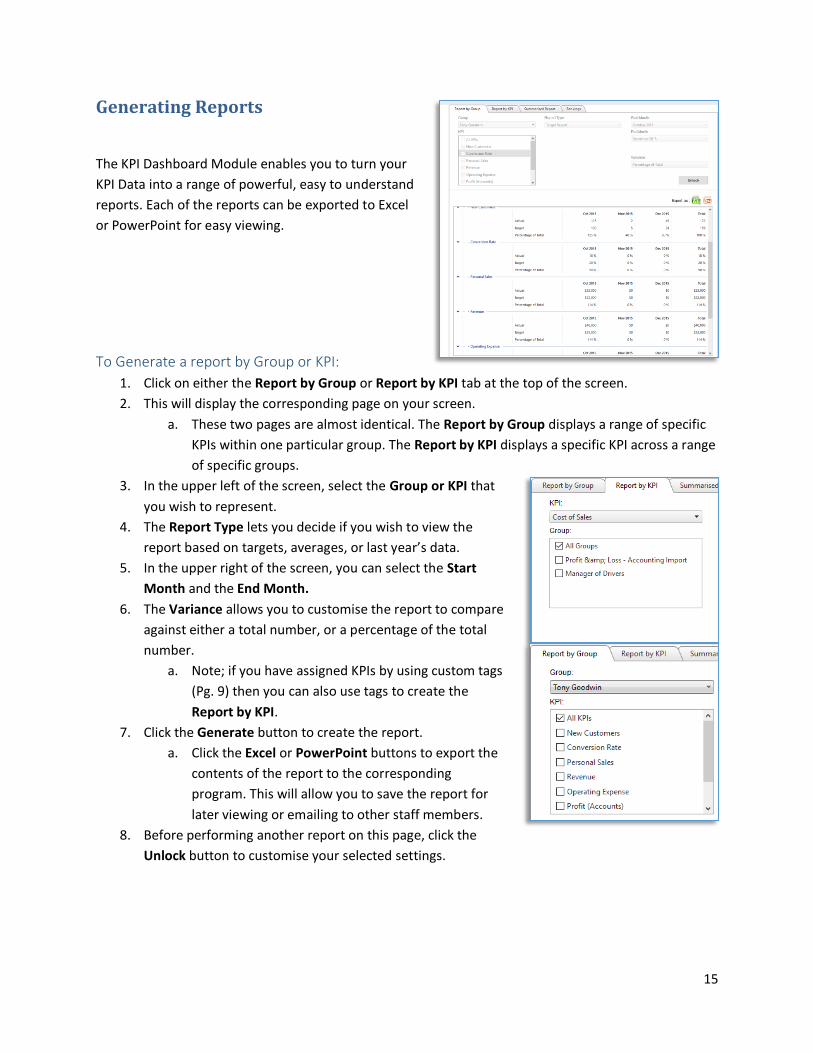
Generating Reports
The KPI Dashboard Module enables you to turn your
KPI Data into a range of powerful, easy to understand
reports. Each of the reports can be exported to Excel
or PowerPoint for easy viewing.
To Generate a report by Group or KPI:
1. Click on either the Report by Group or Report by KPI tab at the top of the screen.
2. This will display the corresponding page on your screen.
a. These two pages are almost identical. The Report by Group displays a range of specific
KPIs within one particular group. The Report by KPI displays a specific KPI across a range
of specific groups.
3. In the upper left of the screen, select the Group or KPI that
you wish to represent.
4. The Report Type lets you decide if you wish to view the
report based on targets, averages, or last year’s data.
5. In the upper right of the screen, you can select the Start
Month and the End Month.
6. The Variance allows you to customise the report to compare
against either a total number, or a percentage of the total
number.
a. Note; if you have assigned KPIs by using custom tags
(Pg. 9) then you can also use tags to create the
Report by KPI.
7. Click the Generate button to create the report.
a. Click the Excel or PowerPoint buttons to export the
contents of the report to the corresponding
program. This will allow you to save the report for
later viewing or emailing to other staff members.
8. Before performing another report on this page, click the
Unlock button to customise your selected settings.
16
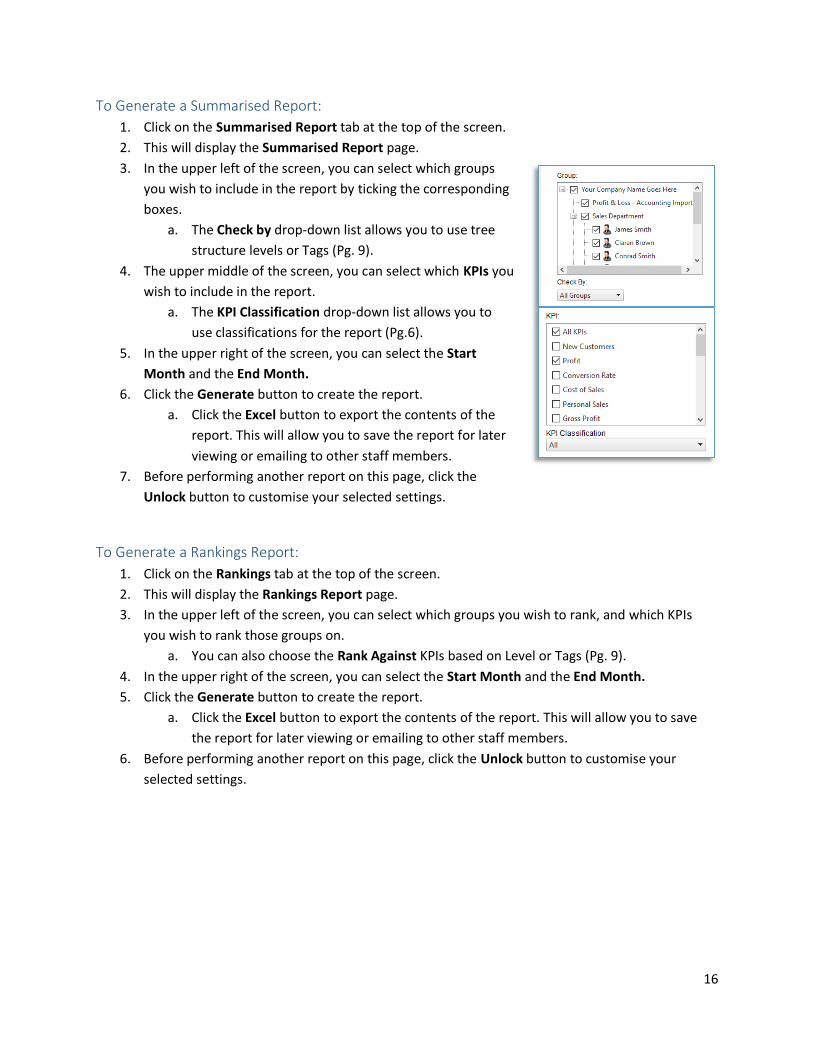
To Generate a Summarised Report:
1. Click on the Summarised Report tab at the top of the screen.
2. This will display the Summarised Report page.
3. In the upper left of the screen, you can select which groups
you wish to include in the report by ticking the corresponding
boxes.
a. The Check by drop-down list allows you to use tree
structure levels or Tags (Pg. 9).
4. The upper middle of the screen, you can select which KPIs you
wish to include in the report.
a. The KPI Classification drop-down list allows you to
use classifications for the report (Pg.6).
5. In the upper right of the screen, you can select the Start
Month and the End Month.
6. Click the Generate button to create the report.
a. Click the Excel button to export the contents of the
report. This will allow you to save the report for later
viewing or emailing to other staff members.
7. Before performing another report on this page, click the
Unlock button to customise your selected settings.
To Generate a Rankings Report:
1. Click on the Rankings tab at the top of the screen.
2. This will display the Rankings Report page.
3. In the upper left of the screen, you can select which groups you wish to rank, and which KPIs
you wish to rank those groups on.
a. You can also choose the Rank Against KPIs based on Level or Tags (Pg. 9).
4. In the upper right of the screen, you can select the Start Month and the End Month.
5. Click the Generate button to create the report.
a. Click the Excel button to export the contents of the report. This will allow you to save
the report for later viewing or emailing to other staff members.
6. Before performing another report on this page, click the Unlock button to customise your
selected settings.