eva express (master kpi dashboard) user guide kpi dashboar… · kpi dashboard is designed to...
TRANSCRIPT

The path to financial truth.
EVA® is a registered service mark of EVA Dimensions LLC (in the field of financial data, valuation analytics, and investment management) and of Stern Stewart & Co. (in the field of financial and incentive consulting) Copyright © 2009 by EVA Dimension LLC. All rights reserved
EVA Express (Master KPI
Dashboard) User Guide

EVA® is a registered service mark of EVA Dimensions LLC (in the field of financial data, valuation analytics, and investment management) and of Stern Stewart & Co. (in the field of financial and incentive consulting) Copyright © 2009 by EVA Dimension LLC. All rights reserved
The path to financial truth.
EVA Express 4.5 -- the Essential FRS Companion
#1 best EVA financial analysis tool on the market
Faster, more accurate, more penetrating insights
See the big picture, and details that count
Enhanced ability to project real value
Populate Excel dashboards with up to 10
companies, sectors, and/or indices at a time - in
seconds
Access a series of interactive charts, graphs and
comp sheets for step-by-step de-construction of a
company's performance , risk and valuation
relative to peers
Includes up to 20 years of Annual data, 6 years of
TFQ data, 12 qtrs of Quarterly data & nightly mkt
updates
Features:
Applications: Drill into underlying drivers of profitability & capital
efficiency by company, sector or indices
Examine trends in market expectations, valuation
multiples & risk profiles
View peer comp and industry stats to identify
competitive strengths & weaknesses and put
those insights into perspective
Utilize as a back-drop for developing projection
assumptions
Benefits:
Provides access to detailed fundamental EVA analytics ,enhancing your overall understanding of the EVA Momentum
methodology, allowing you to dig deeper, and expanding the role and power it can play in tracking performance trends,
benchmarking vs peers or against internal units, deconstructing forward plan expectations
*Latest enhancements include better search functionality, industry/indices aggs and percentile breakouts, 20-Year trend view, COC
reconciliation, PRVit metrics, and more GAAP Gaps and variant perceptions
2

EVA® is a registered service mark of EVA Dimensions LLC (in the field of financial data, valuation analytics, and investment management) and of Stern Stewart & Co. (in the field of financial and incentive consulting) Copyright © 2009 by EVA Dimension LLC. All rights reserved
The path to financial truth.
Table of Contents
Overview of Master KPI Dashboard – key features and
functionality of the different reports and charts
Master KPI Dashboard User Instructions – how to
populate the dashboard in FRS and use the user-controls
within the dashboard
3

EVA® is a registered service mark of EVA Dimensions LLC (in the field of financial data, valuation analytics, and investment management) and of Stern Stewart & Co. (in the field of financial and incentive consulting) Copyright © 2009 by EVA Dimension LLC. All rights reserved
The path to financial truth.
EVA Express (Master KPI Dashboard)The Master KPI Dashboard is a pre-structured Excel Workbook that is furnished as part of your license to FRS. You run a set
of Standard Reports in FRS, export them into specific tabs on the Master KPI Dashboard Excel Template, and voila, you will
automatically be able to view a wide spectrum performance, valuation & benchmarking statistics, annotated to guide you in
interpreting what you see as well as prebuilt charts and graphs to utilize for presentations and deliverables.
You can drop in up to 10 runs and rotate among them. Use this to examine your company vs. a set of public peers or an
aggregation of peer companies. Or, use it to drop in a group of business units and rotate your view among them. The Master
KPI Dashboard is designed to assist in developing critical insights that will allow you to better evaluate and answer key
questions surrounding historical and recent financial/operational performance, valuation, risk, etc. The Master Dashboard is
only a beginning. Edit and expand it to meet your needs, and share your best practices within the FRS Community.
The Dashboard covers the gauntlet of Key Performance Indicators areas, including:
EVA PERFORMANCE - Is EVA positive or negative, rising or falling – has the company been an EVA creator or destroyer?, How have margins,
capital intensity, and return on capital changed?, What are the biggest gap sources between net income and EVA? Is there a growing or shrinking
gap between EVA and EPS?
CAPITAL COST COMPONENTS - Which capital cost components are most significant, have most improved/deteriorated?, Do goodwill and special
items capital account for a significant component of cost structure?, What is the risk profile? Compare the risk (variation) in EBITDAR and EVA vs.
sales – are relatively fixed operating and capital costs increasing EVA risk compared to sales risk? Can that be better managed?
DELTA EVA & EVA MOMENTUM - What are the most significant components of the improvement or deterioration in the EVA margin?, Has growth
been profitable, or a detriment to EVA?, For public companies, has the expected EVA Improvement (over 1 to 5 years), expressed as a percent of
sales or capital, been rising or falling, and has actual EVA momentum been in the size and direction to match those expectations?
MVA & SHAREHOLDER WEALTH - Has MVA been positive or negative, on the rise or in decline? How much shareholder wealth has your company
created now vs. 5 years before?, What about the components of MVA, is there relatively more or less reliance on future growth in EVA as indicated
by FVA?
CASH FLOW - Is there a distinct difference between NOPAT and Operating Cash Generation, which is measured before depreciation but after
working capital investment (hence it eliminates non cash sales, inventory accumulations, and reserve draw-downs from profit), leaving the spread
compared to NOPAT as a measure of earnings vs. cash flow quality?, Has the company been shifting either its investment or financing mix over time,
and if so, have the mix shifts been appropriately correlated?
CAPITAL STRUCTURE - What is the current capital structure condition, and how has that evolved through time?, What capital structure mix of debt
and equity has the company employed over time as an average that would be used in determining its weighted average cost of capital?, Are
shareholder distributions sensible in light of the firm’s operating risk, growth strategy, and financial policies?
4

EVA® is a registered service mark of EVA Dimensions LLC (in the field of financial data, valuation analytics, and investment management) and of Stern Stewart & Co. (in the field of financial and incentive consulting) Copyright © 2009 by EVA Dimension LLC. All rights reserved
The path to financial truth.
Dashboard Report Tabs & Functionality
Overview Tab: Provides a high-level summary of how the Dashboard is structured, the
different reports and tabs.
Snapshot, Stats, Charts, EVA Mo Pyramid, Benchmark Stats, Benchmark Charts & 20
Year Charts: These worksheets contain your pre-formatted output.
KPI Legend: Lists the KPI definitions including greater explanations and additional
background on calculations.
5

EVA® is a registered service mark of EVA Dimensions LLC (in the field of financial data, valuation analytics, and investment management) and of Stern Stewart & Co. (in the field of financial and incentive consulting) Copyright © 2009 by EVA Dimension LLC. All rights reserved
The path to financial truth.
Dashboard Features 7 User Controlled Tabs
Offers a one-page high-level executive tear-sheet and view of some of the
most critical EVA based operating, performance and valuation metrics.
Examines EVA dollars, Key EVA Ratios, Expectations and Valuation. This
includes EVA Spread, Capital Intensity, EVA Margins, Productive Capital
Charges, EVA Momentum, Market Expectations, MVA, Market Multiples and
our PRVit Stock Rating. Benchmarking percentiles and scores are highlighted
with conditional formatting.
Provides the most in-depth view and analysis in the dashboard, presents essential
KPIs in a convenient table that expands step by step to reveal the underlying
drivers and key performance benchmarks and scores with conditional formatting.
Covers Performance and Risk - EVA Measures, EVA Returns, EVA Margins,
EVA Momentum, EVA Per Employee, and Risk, Valuation - MVA, Expectations,
Multiples, PRVit Values, Cash Flow and Credit - Free Cash Flow, Leverage,
Surplus Cash, Distributions, Basics - Conventional Metrics & GAAP Gaps
In this tab you can expand the data in various ways looking at data over 6 TFQs
or 12 Quarters and break out each metric to various level of detail and its
individual components.
Snapshot Report Stats Report
6

EVA® is a registered service mark of EVA Dimensions LLC (in the field of financial data, valuation analytics, and investment management) and of Stern Stewart & Co. (in the field of financial and incentive consulting) Copyright © 2009 by EVA Dimension LLC. All rights reserved
The path to financial truth.
7 User Controlled Tabs – continued
An extension of the Stats Tab, consists of a set of pre-structured graphs for one
entity that focus on financial/operating performance results over the past 12
quarters or 6 TFQs.
Includes 7 key sections: MVA, Returns, and Expectations, EVA Momentum and
EVA Margin, Cost Driver Summary, EVABT per Employee, EVA and ROC,
Financial Risk and Return, Variant Perceptions
Each subsection and series of charts consists of a short narrative and explanation
to guide you in interpreting and analyzing the results, this includes a summary of
the key terms and an overview of the calculations used. Provides guidance on
how to leverage this analysis in developing key conclusions and potential
recommendations based on trends.
Examine all the sources of EVA Momentum improvement or degradation. Offers
various historical views, looking over 1 to 5 years and quarter to quarter the year
before, for any of the past 8 quarters. Dig down and examine the underlying
drivers, from Sales, Operating Costs, EBITDAR Margin, Productive Capital
Charges, EVA Before Tax and EVA After Tax Margin. Includes trends relative to a
sector, index or custom group.
In this tab you can choose between 2 EVA Momentum Trees: 1.) 1 to 5 TFQs
strategic view, where the user can specify the time period to examine. 2.) Quarter
vs. Same Q Year Ago, where the user can select any of the most recent 8 Qtrs to
examine year to year EVA Momentum changes based on Quarterly performance.
Charts EVA Momentum Pyramid
7

EVA® is a registered service mark of EVA Dimensions LLC (in the field of financial data, valuation analytics, and investment management) and of Stern Stewart & Co. (in the field of financial and incentive consulting) Copyright © 2009 by EVA Dimension LLC. All rights reserved
The path to financial truth.
7 User Controlled Tabs – continued
An extension of the Stats Tab, where you can select and view up to 5 of any 10
companies to benchmark financial/operating performance side by side at any point
in time, looking at TFQ or Quarterly results. Performance percentile scores for
each company are shown for each metric as well as performance at the 50th
percentile. This tab includes a condensed view of the sections shown in the Stats
tab.
This tab provides tremendous value in establishing and benchmarking
financial/operational performance to peers, determining leaders and laggards in
the industry, spotting potential improvement areas, and setting improvement
targets based on where you rank against your peer set.
This tab is an extension of the Charts Tab, where you can select and view up to 5
of any 10 companies or entities to benchmark financial/operating performance
side by side over the last 12 past quarters or 6 TFQs. This tab includes the same
five key sections similar to the Charts Tab, including a comprehensive set of
similar charts and graphs.
Sections include: MVA, Returns, & Expectations, EVA Momentum & EVA Margin,
Cost Driver Summary, EVABT per Employee, and Financial Risk & Return.
Benchmark Stats Benchmark Charts
8

EVA® is a registered service mark of EVA Dimensions LLC (in the field of financial data, valuation analytics, and investment management) and of Stern Stewart & Co. (in the field of financial and incentive consulting) Copyright © 2009 by EVA Dimension LLC. All rights reserved
The path to financial truth.
7 User Controlled Tabs – continued
This tab is an extension of the Charts Tab, where you can select and view up to 2
of any 10 companies or entities to benchmark financial/operating performance
side by side over the last 20 years for deeper and longer term trend analysis. This
tab includes the same five key sections similar to the Charts Tab, including a
comprehensive set of similar charts and graphs.
The 5 key sections are: 1.) MVA, Returns, & Expectations, 2.) EVA Momentum &
EVA Margin, 3.) Cost Driver Summary, 4.) ROC, COC & Capital Intensity, 5.)
GAAP Gaps -- Variant Perceptions
Each subsection and series of charts consists of a short narrative and explanation
to guide you in interpreting and analyzing the results, this includes a summary of
the key terms and an overview of the calculations used.
20 Year Charts
9

EVA® is a registered service mark of EVA Dimensions LLC (in the field of financial data, valuation analytics, and investment management) and of Stern Stewart & Co. (in the field of financial and incentive consulting) Copyright © 2009 by EVA Dimension LLC. All rights reserved
The path to financial truth.
User InstructionsFinancial intelligence for measuring and maximizing value
10

EVA® is a registered service mark of EVA Dimensions LLC (in the field of financial data, valuation analytics, and investment management) and of Stern Stewart & Co. (in the field of financial and incentive consulting) Copyright © 2009 by EVA Dimension LLC. All rights reserved
The path to financial truth.
Two Distinct Dashboards: OPCO vs. FINCO
There are two distinct
dashboards that have been
customized for either an OPCO
or a FINCO
You cannot mix and match
OPCO and FINCO companies
when using the Dashboards
As a first step you must identify
which companies, business units
and competitors you want to
include and whether they are
OPCOs or FINCOs
You will then use the correct
dashboards as specified on the
following slide
OPCO‟s include most traditional
operating firms, FINCO‟s include all
financial institutions, such as:
- Capital Markets
- Commercial Banks
- Consumer Finance
- Diversified Financial Services
- Insurance
- Real Estate & Real Estate Mgmt &
Development
- Thrifts & Mortgage Finance
11

EVA® is a registered service mark of EVA Dimensions LLC (in the field of financial data, valuation analytics, and investment management) and of Stern Stewart & Co. (in the field of financial and incentive consulting) Copyright © 2009 by EVA Dimension LLC. All rights reserved
The path to financial truth.
Population Options There are two ways to populate the Dashboard.
The first is manual – you run the reports and copy them into the
Dashboard one at a time, using the Excel export feature of the Reports
module.
The second is an automated version, which uses a “Wizard” and a new
Batch Run function within the Reports module.
You can also use Batch Run to tee up any list of reports you want to run
and possibly export on a regular basis, and not just to populate the
Dashboard. In short, you should find Batch Run to be a dramatic time
saver and means of generating the reports and charts you want to view
on a recurring basis.
Let‟s first look at the automatic method, which we recommend.
12

EVA® is a registered service mark of EVA Dimensions LLC (in the field of financial data, valuation analytics, and investment management) and of Stern Stewart & Co. (in the field of financial and incentive consulting) Copyright © 2009 by EVA Dimension LLC. All rights reserved
The path to financial truth.
First Step: Turn on Macros in Excel
13
1. The first step is to obtain a copy of the Master KPI Dashboard, which you have been provided as part of your FRS License.
Once you have a copy, you want to check that your Excel has Macros enabled which the dashboard uses.
2. To do this, first open the
dashboard and click on the
Microsoft Office icon on the top left
and then click on Excel options on
the bottom.
3. Then click on Trust Center and then Trust
Center Settings.
5. Once you have saved the updated settings,
you will need to save and close the dashboard
and reopen it so that Excel will recognize the
Macros in the dashboard. One you have
reopened the file proceed to the next slide.
4. Then click on Macro Setting and under Macro
settings select Enable all Macros, and then press
OK.

EVA® is a registered service mark of EVA Dimensions LLC (in the field of financial data, valuation analytics, and investment management) and of Stern Stewart & Co. (in the field of financial and incentive consulting) Copyright © 2009 by EVA Dimension LLC. All rights reserved
The path to financial truth.
Wizard Step 1: Open Batch Reports and Wizard
1. Click Batch Run on Ribbon bar to bring up the
Batch Run pop-up window.
2. Click Wizard to bring up the Wizard pop-up
window.
3. There are 3 methods to
populate the Wizard, we
will cover the first using
the Data Source ellipsis
on slides 14-17. We have
outlined the other 2
alternative approaches on
slide 18 using Group &
Tickers that you are free
to use once you are
comfortable with the first
method.
14

EVA® is a registered service mark of EVA Dimensions LLC (in the field of financial data, valuation analytics, and investment management) and of Stern Stewart & Co. (in the field of financial and incentive consulting) Copyright © 2009 by EVA Dimension LLC. All rights reserved
The path to financial truth.
Wizard Step 2: Fill in the Wizard
1. Click the ellipsis to the right of Data
Source, and select the source you want
2. Click down arrow to right of Benchmark to
bring up the standard and custom groups: click
on the one you want, and click on the “x” in lower
left corner to close.
Do not change the Benchmark Options; they are
set by default to the correct values for populating
the Dashboard.
15
EVA® is a registered service mark of EVA Dimensions LLC (in the field of financial data, valuation analytics, and investment management) and of Stern Stewart & Co. (in the field of financial and incentive consulting) Copyright © 2009 by EVA Dimension LLC. All rights reserved
The path to financial truth.
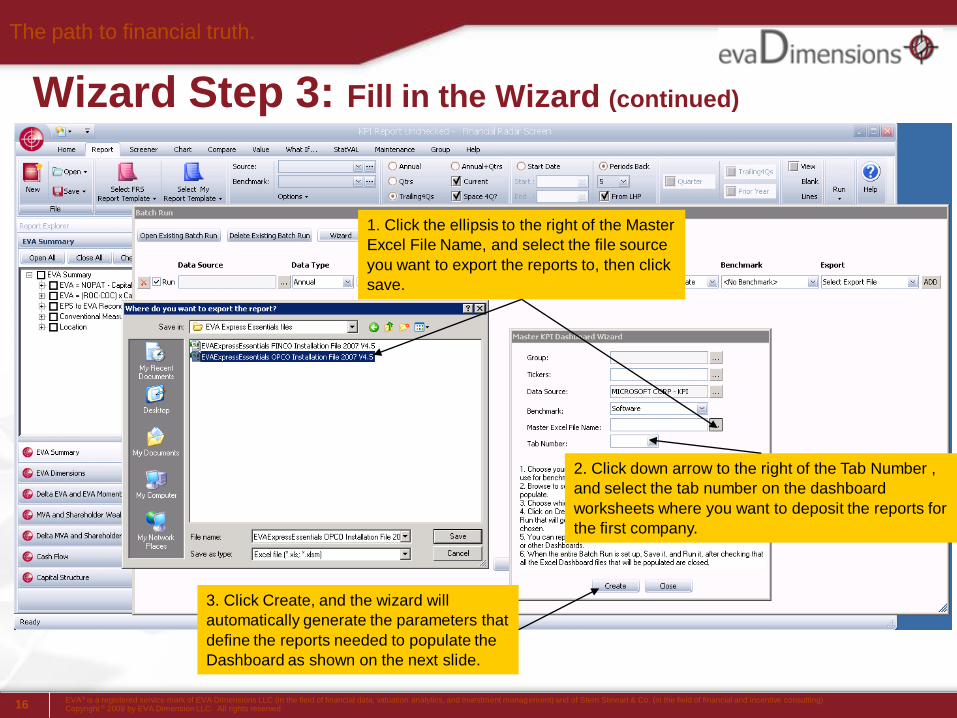
Wizard Step 3: Fill in the Wizard (continued)
2. Click down arrow to the right of the Tab Number ,
and select the tab number on the dashboard
worksheets where you want to deposit the reports for
the first company.
3. Click Create, and the wizard will
automatically generate the parameters that
define the reports needed to populate the
Dashboard as shown on the next slide.
1. Click the ellipsis to the right of the Master
Excel File Name, and select the file source
you want to export the reports to, then click
save.
16

EVA® is a registered service mark of EVA Dimensions LLC (in the field of financial data, valuation analytics, and investment management) and of Stern Stewart & Co. (in the field of financial and incentive consulting) Copyright © 2009 by EVA Dimension LLC. All rights reserved
The path to financial truth.
Wizard Step 4: Fill in the Wizard (continued)
2. You can now enter a 2nd data source (a public peer
company or other internal division for instance), and another
tab (2, 3,…..,10) where you want the other data source to be
stored on the dashboard, and click Create again to add
another set of 2 Batch Report Lines. You can include up to
10 data sources in each Dashboard.
3. Once you finished
adding data sources, click
Close and then proceed to
the remaining steps on
the next slide.
17
1. The Wizard automatically generates three lines in the
Batch Run pop-up screen which define the three reports
that go into the Dashboard.

EVA® is a registered service mark of EVA Dimensions LLC (in the field of financial data, valuation analytics, and investment management) and of Stern Stewart & Co. (in the field of financial and incentive consulting) Copyright © 2009 by EVA Dimension LLC. All rights reserved
The path to financial truth.
Wizard Step 5: Fill in the Wizard (continued)
1. Once you‟ve created a Batch Run,
you can give it a name and Save it, and
then subsequently retrieve it by clicking
Open Existing Batch Run
2. Simply click Run, and FRS will run
the reports and export them into the
Dashboard tab number you indicated,
ready for your appraisal.
3. Once the Dashboard process is complete
click Close and navigate to the file you
referenced to export the reports to
4. Before reviewing the dashboard you
created, proceed to the next slide outlining the
two alternative population options.
18

EVA® is a registered service mark of EVA Dimensions LLC (in the field of financial data, valuation analytics, and investment management) and of Stern Stewart & Co. (in the field of financial and incentive consulting) Copyright © 2009 by EVA Dimension LLC. All rights reserved
The path to financial truth.
Wizard: Alternative Population Options
1. In addition to
populating the
dashboard as we have
just covered with
individual companies
using the Data Source
ellipsis, shown to the
left, two options exist
that save quite a bit of
time populating the
Wizard once you
become more familiar
with the dashboard
process.
2. The first option is to upload a custom Group you have built that includes up to 10 companies you want to include in the
dashboard. Simply click on the ellipsis next to Group, and select the Group you want. This will automatically load all the
companies in that Group as well as specify the Benchmark to be used and complete all the Tab numbering, the only step
left is to click the ellipsis to the right of the Master Excel File Name, and select the file source you want to export the
reports to, then click save. Then click Create and Close.
3. The second option is to
upload a list of companies using
their tickers. You can either type
in the tickers separated by
commas, or you can click on the
Tickers ellipsis and select up to
10 companies at one time. This
will automatically load all the
companies as well as complete
the Tab numbering. The only
remaining steps are to specify
the Benchmark and the Master
Excel File name to export to.
Then click Create and Close.4. Now proceed to the next slide outlining the
instructions for the Dashboard Excel file you
created.
19

EVA® is a registered service mark of EVA Dimensions LLC (in the field of financial data, valuation analytics, and investment management) and of Stern Stewart & Co. (in the field of financial and incentive consulting) Copyright © 2009 by EVA Dimension LLC. All rights reserved
The path to financial truth.
The Dashboard: Use of Selector windows1. All 7 output tabs have a Selector window at the top of each spreadsheet. Click the
down arrow, and select the name of the entity you want to examine.
2. The Snapshot, Stats, Charts, and EVA Mo Pyramid Tab are all linked and
changing the name on any one selector on these 4 tabs automatically shifts the
output of the other three.
4. Instructions for additional
functionality on the user controlled
tabs is covered in the next slides.
3. As you will see on the Benchmark
Stats and Benchmarks Chart tab later,
there are 5 Selector windows which
are independently controlled from the
other 4 tabs.
20

EVA® is a registered service mark of EVA Dimensions LLC (in the field of financial data, valuation analytics, and investment management) and of Stern Stewart & Co. (in the field of financial and incentive consulting) Copyright © 2009 by EVA Dimension LLC. All rights reserved
The path to financial truth.
Snapshot Tab: Instructions
21
1. Click down arrow on selector box for the company you
want to examine.
2. Use Excel to “Hide” Columns B-F, which will
automatically update the periods in the chart to remove
blank periods of data.
Note: Performance percentiles
have been highlighted through
conditional formatting. This is
only available for users who have
Excel 2007.

EVA® is a registered service mark of EVA Dimensions LLC (in the field of financial data, valuation analytics, and investment management) and of Stern Stewart & Co. (in the field of financial and incentive consulting) Copyright © 2009 by EVA Dimension LLC. All rights reserved
The path to financial truth.
Stats Tab: Instructions
3. Click “1” to “4” to
reveal more detail.
Level “5” provides
performance and
percentile scores.
2. Click “1” for 6 years, “2” to add most recent qtr/prior years, and “3” to see all trailing 12 qtrs.
1. Click down arrow on selector box for the company you
want to examine.
Note: This tab also uses conditional
formatting available in Excel 2007 to
highlight Performance percentiles
scores.
22

EVA® is a registered service mark of EVA Dimensions LLC (in the field of financial data, valuation analytics, and investment management) and of Stern Stewart & Co. (in the field of financial and incentive consulting) Copyright © 2009 by EVA Dimension LLC. All rights reserved
The path to financial truth.
Charts Tab: Instructions
3. Click “1” to collapse reports to section
headers, “4” to reveal all, and scroll down to
section of interest.
1. Click down arrow on selector box for the company you
want to examine.
2. Click down arrow on selector box to specify either
Quarterly or TFQ data to use in the charts.
23

EVA® is a registered service mark of EVA Dimensions LLC (in the field of financial data, valuation analytics, and investment management) and of Stern Stewart & Co. (in the field of financial and incentive consulting) Copyright © 2009 by EVA Dimension LLC. All rights reserved
The path to financial truth.
Charts Tab: Instructions
3. Click “1” to collapse reports to section
headers, “4” to reveal all, and scroll down to
section of interest.
1. Click down arrow on selector box for the company you
want to examine.
2. Click down arrow on selector box to specify either
Quarterly or TFQ data to use in the charts.
24

EVA® is a registered service mark of EVA Dimensions LLC (in the field of financial data, valuation analytics, and investment management) and of Stern Stewart & Co. (in the field of financial and incentive consulting) Copyright © 2009 by EVA Dimension LLC. All rights reserved
The path to financial truth.
EVA Mo Pyramid: Instructions
3. Click “1”
to “5” to
reveal more
detail in
stages
2. Choose Among 2 Trees:
i. 1 through 5 TFQs Strategic View
(Choose between 1 to 5 TFQs)
ii. Choose Qtr vs Same Qtr Year Ago
(Choose ending Qtr from any of most
recent 8 Qtrs)
1. Click down arrow on selector box for the company you
want to examine.
25

EVA® is a registered service mark of EVA Dimensions LLC (in the field of financial data, valuation analytics, and investment management) and of Stern Stewart & Co. (in the field of financial and incentive consulting) Copyright © 2009 by EVA Dimension LLC. All rights reserved
The path to financial truth.
Benchmarks Stats: Instructions
26
3.Click “1” to collapse reports to section
headers, “5” to reveal all, and scroll down to
section of interest.
1.Click down arrow on selector boxes for the
companies you want to examine. Review the note
on the adjustments made based on Fiscal Year End
Calendar Month.
2. Click down arrow on selector box to
specify either Quarterly or TFQ data view.
2. Click down
arrow on selector
box to specify
how many
historical periods
to look back. The
maximum is 11
periods for
Quarterly data
and 5 periods for
TFQ data.
Note: This tab also uses conditional
formatting available in Excel 2007 to
highlight Performance percentiles
scores.

EVA® is a registered service mark of EVA Dimensions LLC (in the field of financial data, valuation analytics, and investment management) and of Stern Stewart & Co. (in the field of financial and incentive consulting) Copyright © 2009 by EVA Dimension LLC. All rights reserved
The path to financial truth.
Benchmark Charts: Instructions
3. Click “1” to
collapse reports to
section headers, “4”
to reveal all.
1. Click down arrow on selector boxes for the companies you want to
examine. Review the note on the adjustments made based on Fiscal
Year End Calendar Month, it is the same as made on the Benchmark
Stats Tab.
2. Click down arrow on selector box to specify either
Quarterly or TFQ data view.
27
EVA® is a registered service mark of EVA Dimensions LLC (in the field of financial data, valuation analytics, and investment management) and of Stern Stewart & Co. (in the field of financial and incentive consulting) Copyright © 2009 by EVA Dimension LLC. All rights reserved
The path to financial truth.
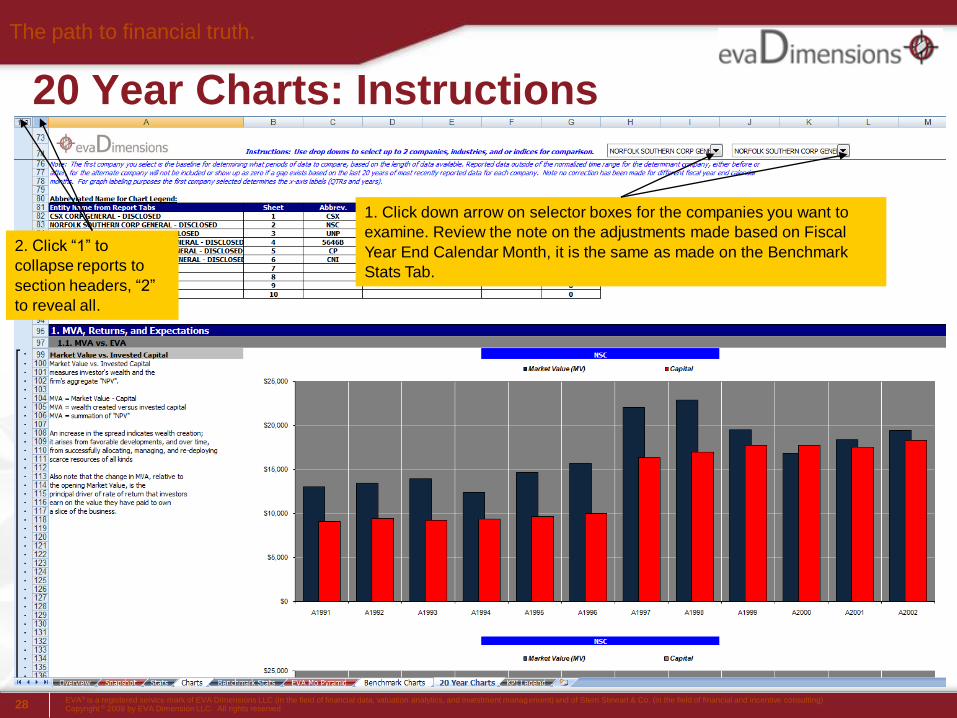
20 Year Charts: Instructions
2. Click “1” to
collapse reports to
section headers, “2”
to reveal all.
1. Click down arrow on selector boxes for the companies you want to
examine. Review the note on the adjustments made based on Fiscal
Year End Calendar Month, it is the same as made on the Benchmark
Stats Tab.
28

EVA® is a registered service mark of EVA Dimensions LLC (in the field of financial data, valuation analytics, and investment management) and of Stern Stewart & Co. (in the field of financial and incentive consulting) Copyright © 2009 by EVA Dimension LLC. All rights reserved
The path to financial truth.
KPI Legend Tab: Definitions and Explanations
29
Click
“1” to
“2” to
revel
more
detail

EVA® is a registered service mark of EVA Dimensions LLC (in the field of financial data, valuation analytics, and investment management) and of Stern Stewart & Co. (in the field of financial and incentive consulting) Copyright © 2009 by EVA Dimension LLC. All rights reserved
The path to financial truth.
If you experience any issues with EVA Express, it may be due to one of the following:
1. If you are using Excel 2003, make sure you are using the Excel 2003 version of PRVit Express.
EVA Express OPCO Installation 2003.xls is the version for Excel 2003.
EVA Express OPCO Installation 2007.xlsm is the version for Excel 2007
2. If the buttons and fields do not work at all, it is likely that Macros are not enabled. If you see the Security
Warning at the top of your screen, click on Options and then choose to „Enable this Content‟. If you do
not see the Security Warning, close and reopen your workbook.
Troubleshooting Tips
30

EVA® is a registered service mark of EVA Dimensions LLC (in the field of financial data, valuation analytics, and investment management) and of Stern Stewart & Co. (in the field of financial and incentive consulting) Copyright © 2009 by EVA Dimension LLC. All rights reserved
The path to financial truth.
If you are using Excel 2007 and EVA express is not working, your computer may be configured
to disable ActiveX and/or Macros without warning.
1. To enable ActiveX in Excel 2007:
o Open Excel Options by clicking on the windows icon and then select Excel Options
o Open the Trust Center and then click on the Trust Center Settings button
o Select ActiveX settings in the left navigation
o Make sure the first option „Disable all controls without notification‟ is NOT SELECTED. The second
option is recommended: ‘Prompt me before enabling Unsafe for Initialization controls..’
o Click OK
o Close and reopen EVA Express. You should now receive an ActiveX security alert (see previous
slide). Choose to enable ActiveX.
Troubleshooting Tips continued
31

EVA® is a registered service mark of EVA Dimensions LLC (in the field of financial data, valuation analytics, and investment management) and of Stern Stewart & Co. (in the field of financial and incentive consulting) Copyright © 2009 by EVA Dimension LLC. All rights reserved
The path to financial truth.
If you are using Excel 2007 and EVA Express is not working at all, your computer may be
configured to disable ActiveX and/or Macros without warning.
2. To change your Macro security settings in Excel 2007:
o Open Excel Options by clicking on the windows icon and then select Excel Options
o Open the Trust Center and then click on the Trust Center Settings button
o Select Macro settings in the left navigation
o Make sure the SECOND option „Disable all controls WITH notification‟ is SELECTED.
o Click OK
o Close and reopen EVA Express. You should now receive a Macro security alert (see slide 28).
Choose to enable Macros.
Troubleshooting Tips continued
32

EVA® is a registered service mark of EVA Dimensions LLC (in the field of financial data, valuation analytics, and investment management) and of Stern Stewart & Co. (in the field of financial and incentive consulting) Copyright © 2009 by EVA Dimension LLC. All rights reserved
The path to financial truth.
Troubleshooting Tips continued
1. If you are using Excel 2003 and receive the warning on
the right, your security settings will need to be changed to
allow PRVit Express to run properly.
2. Go to the Tools menu, and select Macro and Security as
depicted on the bottom right.
3. Change your security setting to „Medium‟ so that you can
choose whether to run Macros. Click OK.
4. ** Close and re-open the EVA Express workbook
before continuing.
33
* Contact support with any password issues at [email protected] 888.500.3560

EVA® is a registered service mark of EVA Dimensions LLC (in the field of financial data, valuation analytics, and investment management) and of Stern Stewart & Co. (in the field of financial and incentive consulting) Copyright © 2009 by EVA Dimension LLC. All rights reserved
The path to financial truth.
Troubleshooting Tips continued
34
• If your temporary Internet files take up too much space on your computer, you may need to
delete your temporary internet files:
o In Internet Explorer, select Tools>Internet Options.
o On the Internet Options window, select the Delete button to open the Delete Browsing History window. Check
Temporary Internet files and then the Delete button.

EVA® is a registered service mark of EVA Dimensions LLC (in the field of financial data, valuation analytics, and investment management) and of Stern Stewart & Co. (in the field of financial and incentive consulting) Copyright © 2009 by EVA Dimension LLC. All rights reserved
The path to financial truth.
Next Steps
For questions or issues, please contact support at:- [email protected]
- 888.500.3560
To schedule a demo or learn more about
EVA Express, please contact:- Tucker Edmundson
- (203.561.0837)
35