mathematical programming-based sales and operations ...taskin/pdf/vestelsop.pdf · mathematical...
TRANSCRIPT
Mathematical Programming-Based Sales and
Operations Planning at Vestel Electronics
Z. Caner Taskın∗1, Semra Agralı2, A. Tamer Unal1, Vahdet Belada3, and
Filiz Gokten-Yılmaz3
1Department of Industrial Engineering, Bogazici University, 34342 Bebek,
Istanbul, Turkey {[email protected]}, {[email protected]}2Department of Industrial Engineering, Bahcesehir University, 34353,
Besiktas, Istanbul, Turkey {[email protected]}3Vestel Electronics, Organize Sanayi Bolgesi, 45030, Manisa, Turkey
{[email protected]}, {[email protected]}
Abstract
We investigate the sales and operations planning (S&OP) problem at Vestel Electronics,
a major television manufacturer located in Turkey. The company’s product portfolio is
very wide due to a large number of configuration options, and changes rapidly due to
technological advances. Demand volatility is high and materials procurement requires
long lead times. Hence, the S&OP process is critical for efficient management of
company resources and its supply chain as well as customer satisfaction. We devise
∗Corresponding author
1
a mathematical programming formulation for Vestel’s S&OP problem and describe
our experience in implementation of a decision support system (DSS) based on our
optimization model. We have fully implemented and deployed our DSS at Vestel, and
Vestel has been using it on a daily basis since 2011.
Keywords: Sales and operations planning, decision support system, television indus-
try, mathematical programming
Vestel Group comprises several companies operating in various areas such as manufactur-
ing, household appliances, defense industries and marketing. Vestel Group has approximately
$4.2 billion turnover and Vestel Electronics is the flagship company of the group with its
revenue and industry-wide market share. Vestel Electronics operates in consumer electronics
industry and produces LCD/LED televisions (TV), which is its main product line, and dig-
ital set-top boxes. Vestel exports approximately 90% of their products to customers in 140
countries under its own brands as well as various leading Japanese and European brands.
Vestel City in Manisa, Turkey is one of the largest industrial complexes in the world oper-
ating on a single location, with an area of 1.1 million square meters and annual production
capacity of 15 million products [Vestel Electronics, 2013].
A distinctive characteristic of the consumer electronics industry in general, and TV man-
ufacturing industry in particular, is rapid technological evolution [Conlon, 2012, Chang and
Chung, 2013]. In the last few years, the mainstream in TV industry has shifted from cathode
ray tube (CRT) to plasma and liquid-crystal display (LCD), followed by light-emitting diode
(LED) TVs. Recently three-dimensional (3D) and smart TVs have become prevalent, and
4K ultra high definition (UHD) TVs that provide four times as many pixels compared to
high definition (HD) TVs have appeared in the market. Moreover, there have been advances
in the broadcasting systems. Radical changes such as transition from analog to digital broad-
2
cast and Internet protocol television (IPTV) broadcast directly affect the product. Other
than these, minor technological improvements, cosmetic changes and changes to reduce costs
happen continuously. As a result, product lifecyles are very short and a significant portion
of research and development (R&D) effort is spent at the operational level.
LCD/LED TV market is a “buyer’s market” where the marketability of a product is
very sensitive to its price. Furthermore, customer loyalty is limited and demand volatility
is high [Conlon, 2012]. TV demand fluctuates seasonally and special events such as sports
organizations heavily affect demand. Television prices tend to decrease over time while prices
of input materials fluctuate. This is especially the case for the display (also called panel or
screen), which accounts for a significant portion of the total cost [Conlon, 2012]. Price-based
competition in the market forces producers to work with low profit margins, and employ
opportunistic purchasing of input materials.
Business Model of Vestel Electronics
Vestel Electronics operates in a make-to-order environment, and it allows mass customization
of its products. Mass customization is a paradigm in which products are customized in large
quantities at low cost rather than standardized [Chen-Ritzo et al., 2010]. Vestel produces
approximately 10% of its products under its own brand names while manufacturing the rest
under original equipment manufacturer (OEM) and original design manufacturer (ODM)
agreements with various customers including well-known Japanese and European brands.
For OEM/ODM business model, Vestel follows customer demands and trends in the market,
does R&D to design products and produces them under its customers’ brand names. This
strategy – producing for a large number of customers under hundreds of different brands –
requires Vestel’s product portfolio to be very wide and products to be diverse in terms of both
electronics and cosmetic properties. TV is a heavily customizable product. There are various
physical attributes (e.g., size, color), electronic options (e.g., display frequency, USB/HDMI
3
support, 3D support, smart TV capability), cosmetic properties (e.g., front and back cabins),
electronic components (e.g., main card, power card, speaker type, remote control type) as
well as various software options. When all combinations are considered, the number of
products that can be produced at any given time is expressed in tens of thousands, and
this number increases as new customization options are added. Due to the rapidly changing
technology and the large number of customization options, approximately 5000 new models
enter the product portfolio annually. Roughly 60% of the products produced in a month are
new products and the entire product portfolio renews almost every six months.
Unlike several of its competitors, which try to create stable operational environments
by limiting product variety and limiting customers’ flexibility, Vestel’s competitive strategy
aims to maximize flexibility and responsiveness. To this end, Vestel allows its customers to
order any product that can be manufactured from a technical point of view. It also accepts
orders of small batch sizes. In particular, 37% of its annual 9.5 million production is for
orders of 200 or fewer units, and 66% is for orders 500 or fewer units. Vestel accepts orders
with short due dates. It employs no frozen zone in planning horizon, and allows customers
to change order quantity, due date and product specifications before actually manufacturing
the product. While providing such a level of flexibility to customers is a key component of
Vestel’s competitive strategy, it increases the difficulty of managing its supply chain.
Vestel works with over 500 suppliers to procure more than 20,000 different stock keeping
units (SKUs). Vestel procures a significant number of items from multiple suppliers to
decrease costs, resolve supply constraints and due to strategic reasons. These concerns are
particularly important for the procurement of displays for which the global supply is limited,
costs are significant and prices fluctuate over time. Displays that share similar technical
specifications are substitutable to a certain extent. In other words, it is possible to produce
a TV unit by using one of several equivalent displays produced by different suppliers. On
the other hand, due to some customer requirements, quality concerns or technical reasons,
4
some products cannot be produced by using some of the displays. While exploiting the bill-
of-material (BOM) flexibility is crucial for profitability, it also makes material management
more difficult because the requirement of several materials (such as power cards and optical
materials) depend on the type of the display used. Similarly, usage of a significant number
of materials depends on the front and back cabins that customers choose while ordering.
Even though cabin choice is mostly cosmetic and does not affect electronic properties of the
product, requirement of many materials such as plastic components, speakers, paints depend
on the cabin type chosen. Since customers tend to order different cabins in successive orders,
and since they tend to delay ordering as much as possible, planning of such materials is
particularly difficult.
A unique characteristic of Vestel’s supply chain is the result of Turkey’s proximity to
Europe, which is Vestel’s primary market. Vestel sells almost 90% of its products to its
customers in Europe. In the meantime, less than one third of its suppliers are located in
Turkey, and it procures approximately 90% (in terms of monetary value) of its input materials
from Far Eastern countries. Vestel’s average order satisfaction lead time is 30 days while
its average materials procurement lead time is 90 days. Efficient management of the timing
difference between inbound and outbound materials flow is critical for balancing inventory
holding costs and order satisfaction performance.
Outputs of Vestel’s S&OP process derive long-term material procurement plans. In this
sense, S&OP is the most important process in the inventory optimization and demand sat-
isfaction performance at Vestel. Since the flexibility in demand satisfaction is Vestel’s main
competitive advantage, effective management of the S&OP process carries vital importance
in sustaining Vestel’s competitive advantage.
5
S&OP Process at Vestel Electronics
S&OP is a tactical level integrated business process through which companies aim to keep
demand and supply in balance and achieve synchronization among different functions of the
organization [Wallace, 2004, Sheldon, 2006]. S&OP has received a significant research interest
recently. In particular, Feng et al. [2008] propose several integer programming formulations
that represent different levels of cross-functional integration. They compare these models on
data obtained from a firm operating in oriented strand board industry to estimate potential
financial impact of S&OP before actual implementation. Chen-Ritzo et al. [2010] investigate
S&OP problem in configure-to-order systems with configuration uncertainty. They propose
a stochastic programming approach, and test the efficacy of their approach on data obtained
from IBM System and Technology Group. Oliva and Watson [2011] report their experience
on organizational alignment and business processes perspectives of S&OP gained through a
set of interviews at a consumer electronics firm. Affonso et al. [2008] propose a simulation
model to investigate the effect of lead times and level of collaboration between different
entities on S&OP performance. We refer the reader to Thome et al. [2012] for a recent
review of the literature on S&OP. While several authors have performed studies on various
aspects of S&OP, to the best of our knowledge there is no existing study that addresses
S&OP challenges such as imbalance between inbound and outbound flow lead times, rapid
technological evolution, BOM and process flexibility in a mass customization and make-to-
order environment comparable to Vestel.
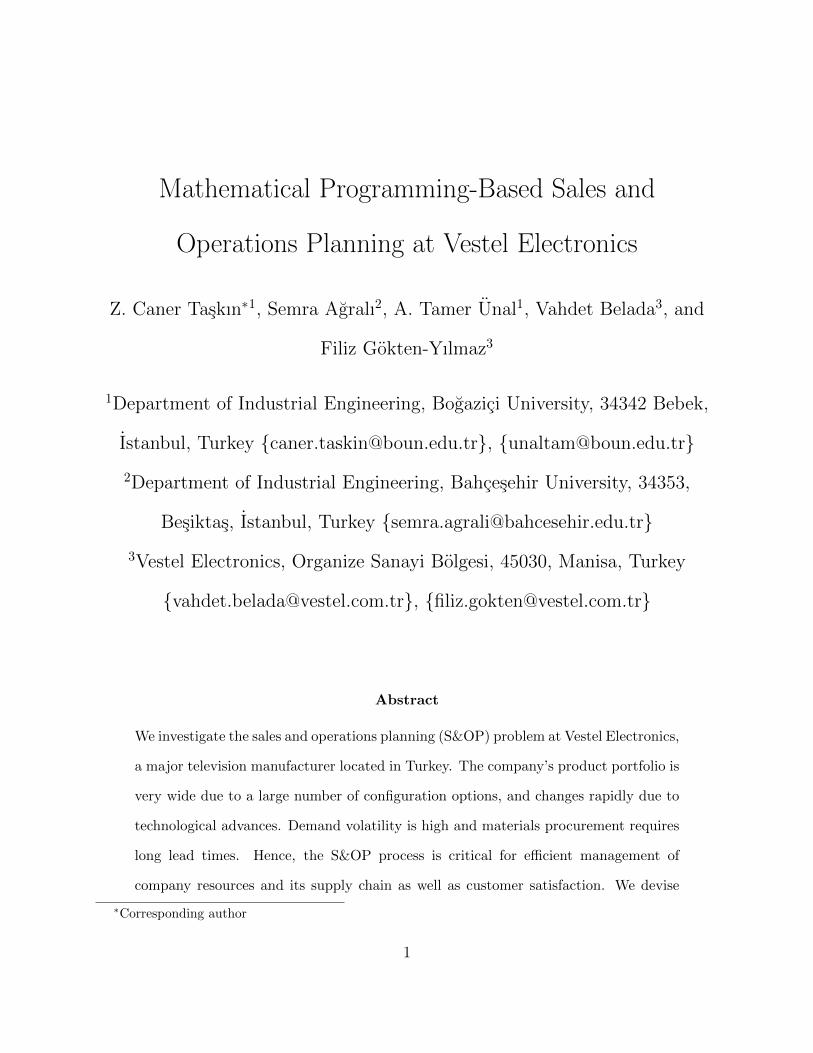
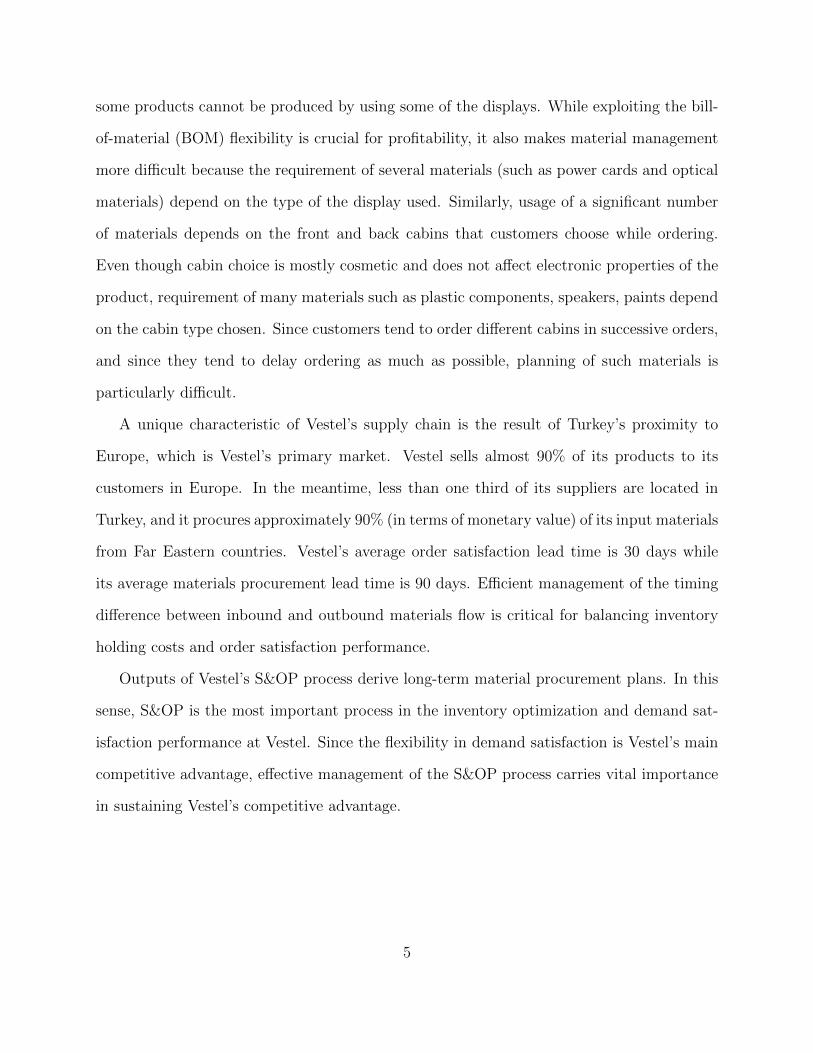
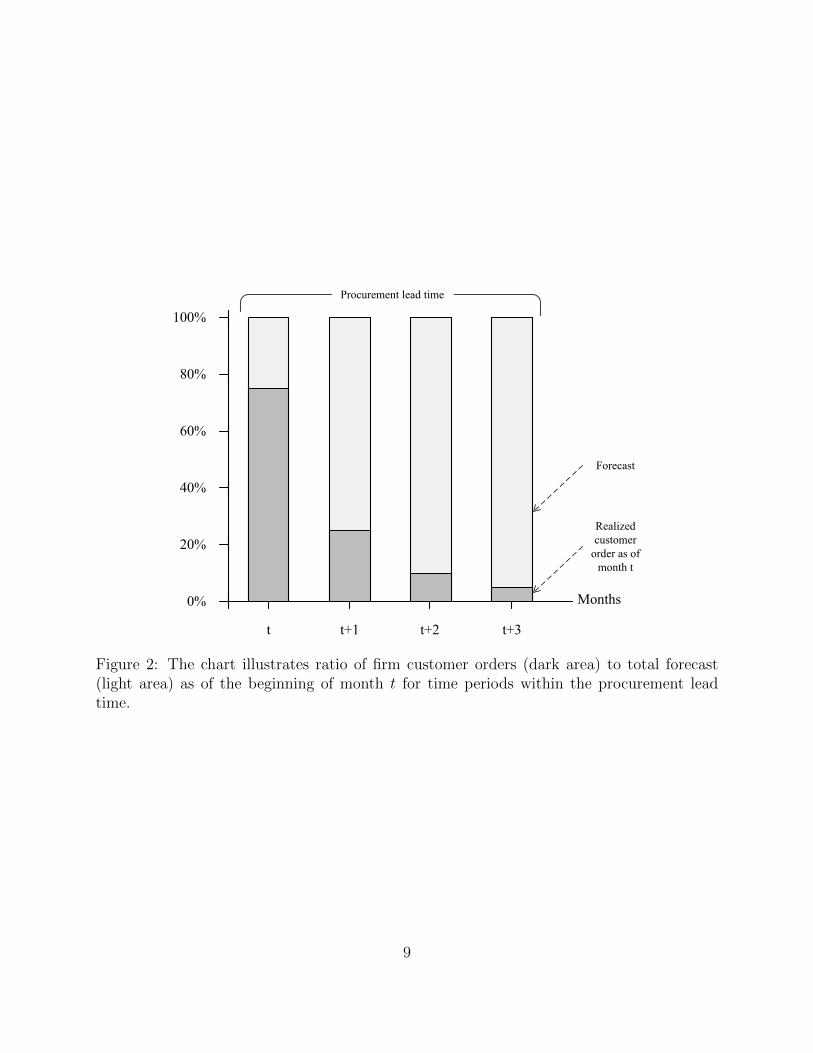
Figure 1 provides an overview of the S&OP process employed at Vestel Electronics.
Executive Management leads S&OP meetings to align Sales & Marketing, Manufacturing,
Procurement and Research & Development (R&D) functions. Since the lead time of some
critical materials supplied from Far Eastern countries is up to 16 weeks, planning horizon
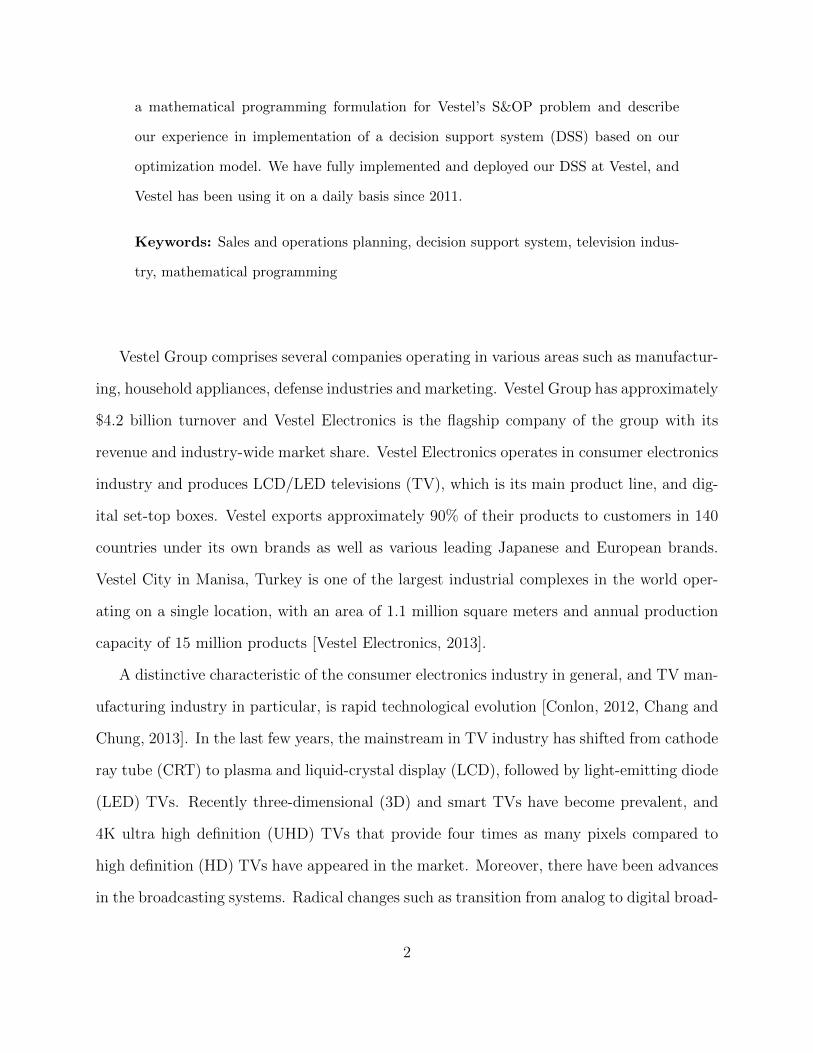
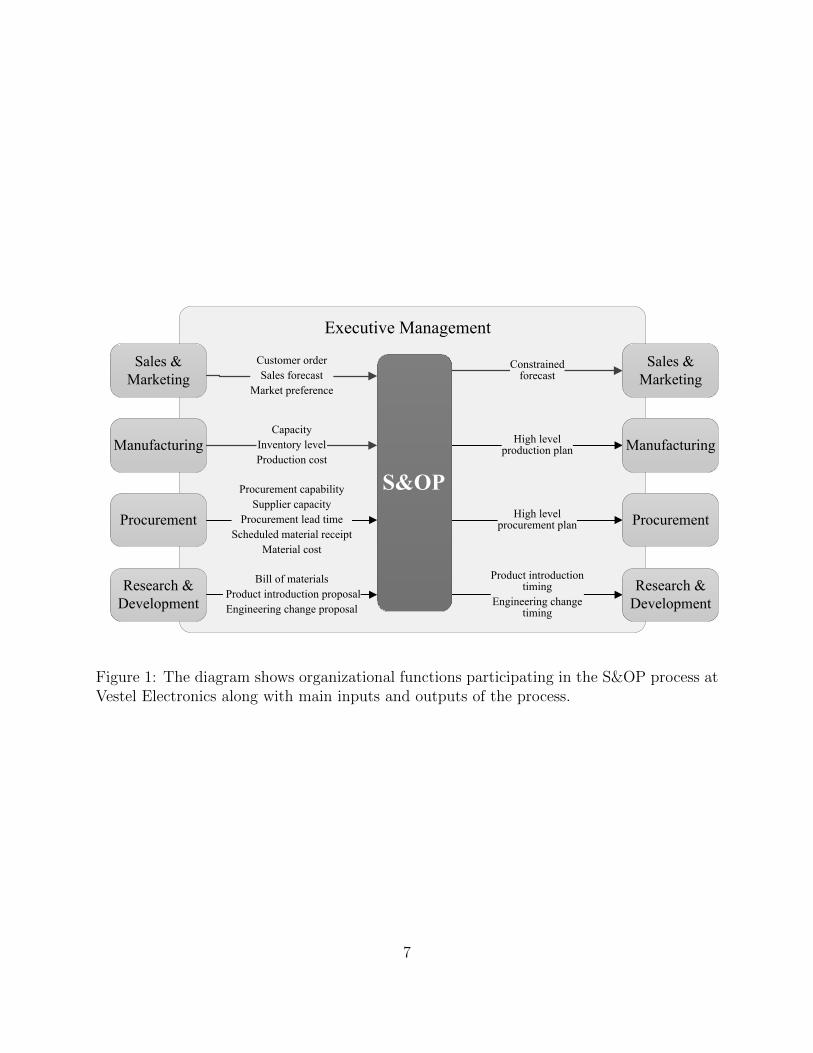
length is at least 4 months. On the other hand, customers tend to order late. As shown
on Figure 2, as of the beginning of month t, fewer than 80% of forecasted sales for month t
6
Executive Management
Customer order
Sales forecast
Market preference
Capacity
Inventory level
Production cost
Procurement capability
Supplier capacity
Procurement lead time
Scheduled material receipt
Material cost
Bill of materials
Product introduction proposal
Engineering change proposal
Constrainedforecast
High levelproduction plan
High levelprocurement plan
Product introduction timing
Engineering change timing
Sales &
Marketing
Manufacturing
Procurement
Research &
Development
S&OP
Sales &
Marketing
Manufacturing
Procurement
Research &
Development
Figure 1: The diagram shows organizational functions participating in the S&OP process atVestel Electronics along with main inputs and outputs of the process.
7
have turned into firm customer orders. Similarly, as of the beginning of month t, fewer than
30% of forecasted sales for month t + 1, fewer than 10% for month t + 2, and fewer than
5% for month t+ 3 have been realized as customer orders. Customer orders, sales forecasts,
market preferences and trends are very important inputs for the S&OP process. Vestel Group
has several subsidiary companies for sales and marketing worldwide, and these companies
are responsible for generating sales forecasts. They consider and closely monitor various
factors including past sales, country-based pricing policies of competitors, screen size and
technological preferences of customers, important sports events in the world (such as UEFA
European Championship, FIFA World Cup, Olympics), and agreements with ODM/OEM
customers. Sales companies make most forecasts at screen size and main technology level
(e.g., 32” LCD TV, 40” LED TV). However, they provide more specific forecasts for certain
market segments and customers. This implies that Vestel needs to work with sales forecasts
containing different levels of detail.
Manufacturing department provides information regarding production capacity, current
inventory levels of materials and manufacturing costs of semi-finished components and end
products. By analyzing the effect of capacity bottlenecks on sales targets and taking correc-
tive actions, S&OP process increases coordination between production and sales activities.
Furthermore, knowledge about production costs and bottlenecks can be used to guide sales
activities towards a more profitable product mix.
Another important goal of the S&OP process is the management of demand and supply
of displays and other critical materials having long lead times. As discussed earlier, global
supply of displays is limited and display prices are subject to fluctuations. Procurement
department provides information about display procurement capability, supplier capacities,
procurement lead times and scheduled receipt quantity/timing of critical materials along
with material costs. S&OP process facilitates coordination between procurement and sales
activities by investigating the effect of procurement problems on sales targets. Furthermore,
8
100%
0
100%
0
100%
0
100%
Months
75%
0
25%
010%
0 5%
t t+1 t+2 t+3
0%
20%
80%
100%
60%
40%
Realized
customer
order as of
month t
Forecast
Procurement lead time
Figure 2: The chart illustrates ratio of firm customer orders (dark area) to total forecast(light area) as of the beginning of month t for time periods within the procurement leadtime.
9
since many end products can be produced with different displays having equivalent technical
specifications, BOM flexibility can be utilized to improve profitability.
R&D department is an important contributor to Vestel’s S&OP process since product
life cycles are very short and new products enter the market continuously. R&D shares
information about various projects in their pipeline to increase BOM flexibility of existing
products (such as adding new display options), new product introduction plans and engineer-
ing changes to existing products or replacing certain components with new ones. Timing of
these projects needs to be aligned with Sales & Marketing to improve customer satisfaction
and Manufacturing and Procurement departments to decrease operational costs.
In S&OP meetings Executive Management gets together with representatives of the cor-
responding functions to formulate a consensus plan given the input from various functions
and financial and strategic goals. The consensus plan represents the constrained forecast for
Sales & Marketing, high level production plan for Manufacturing, high level procurement
plan for Procurement and provides target project timings for R&D. Executive Management
holds S&OP meetings regularly and as needed (such as in case of major supply disruptions,
manufacturing problems or changes in market conditions).
Given unique characteristics of TV manufacturing, Vestel’s business model and its orga-
nizational structure, Vestel’s S&OP process presents some challenges that we address in our
study:
• How to plan for products that do not yet exist: Since product life cycles are quite short,
new products replace a significant portion of currently existing products by the end of
the planning horizon. This implies that long-term production and material requirement
plans have to incorporate products that do not yet exist.
• How to identify and resolve inconsistencies between various targets and constraints:
Since there are various functions involved in the S&OP process with their own goals
and constraints, there can be conflicts between them. Furthermore, since different sales
10
companies make sales forecasts at different levels of detail at different times, there can
be internal inconsistencies between those.
• How to identify a least costly/most profitable operations plan: While customer orders
are associated with specific products, Sales & Marketing makes forecasts at a high
level, and there are many products that can be used to satisfy each forecast item.
However, manufacturing and material costs of these products are typically different
(due to being compatible with different displays, using different kinds of electronic
components, whether or not their required components are already in inventory or
need to be ordered, etc.). This flexibility can be exploited to guide Sales & Marketing
towards a more profitable sales plan.
• How to put the consensus plan into action: Vestel uses an enterprise resource planning
(ERP) system for its operations. Once the functions reach an agreement, the consensus
plan needs to be integrated into the ERP system so that it provides an input for
materials requirements planning (MRP) and long term capacity planning processes.
Furthermore, it needs to be communicated to various employees within the organization
rapidly so that actions taken in other processes are in alignment with the decisions
made at S&OP process.
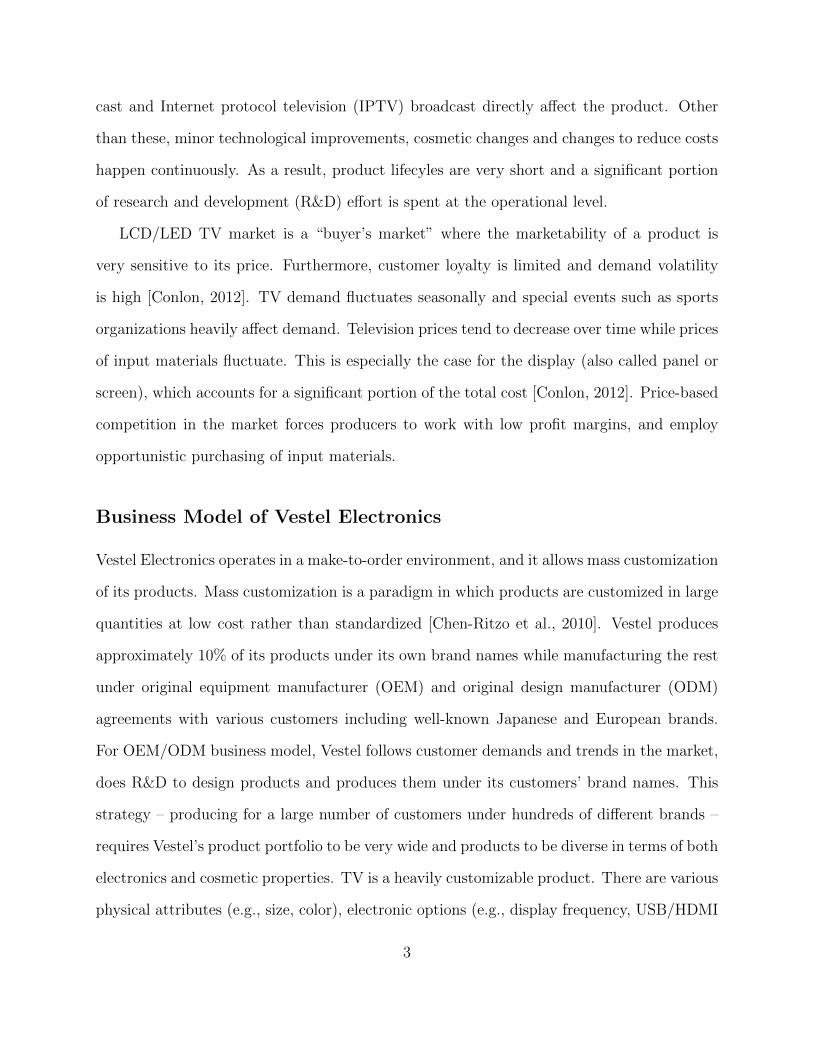
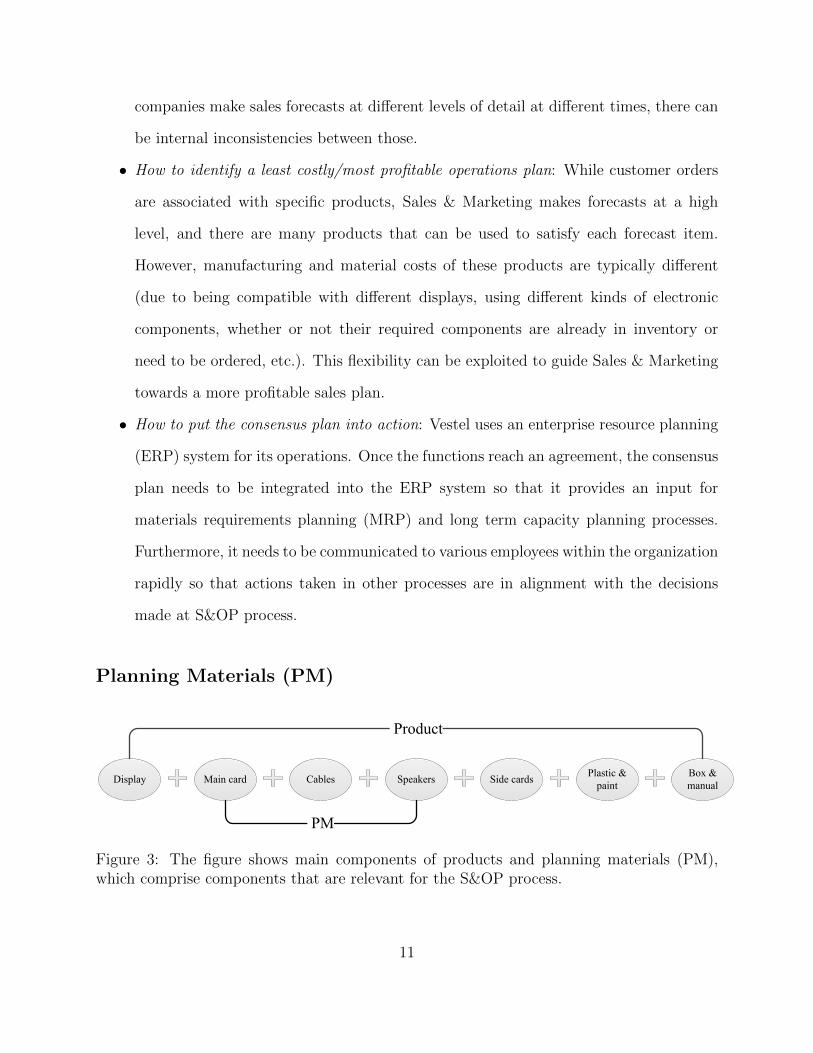
Planning Materials (PM)
Display Main card Cables Speakers Side cardsPlastic &
paint
Box &
manual
PM
Product
Figure 3: The figure shows main components of products and planning materials (PM),which comprise components that are relevant for the S&OP process.
11
Figure 3 shows main components of an LCD/LED TV. A product contains various me-
chanical and electronic components, a remote control, possibly an integrated DVD/DVR
unit, printed documents, packaging materials and software. As discussed earlier, there are
various customization options (such as size, color, display frequency, USB/HDMI inputs, in-
tegrated DVD/DVR units, 3D/smart TV capability, speaker and remote control type etc.),
and Vestel allows mass customization of its products. The number of products that the
customers can order is on the order of tens of thousands, and the product portfolio changes
rapidly due to technological advances. Therefore, it is not possible to create a long term
operations plan based on existing products. On the other hand, various components are
manufactured in-house (e.g. plastic materials such as front and back cabins), have relatively
short procurement lead times (e.g. side cards, boxes and manuals), or are purchased in bulk
quantities and used commonly in a diverse range of products (e.g. paint). Such materials are
out of the scope of S&OP process, and operational-level MRP calculates their requirements.
In order to provide a basis for the S&OP process Vestel has defined high level products
called Planning Materials (PM). PMs are representative virtual products that i) capture
basic product attributes (e.g. size, display type, power card type, customer group), and ii)
have a simplified BOM consisting of components having long procurement lead times (e.g.
main card, cables, speakers) (see Figure 3). PMs provide a grouping of products having
common attributes and common components that are relevant for long term procurement
planning. Hence, each existing product corresponds to a single PM, but a PM can have
several corresponding products. Furthermore, each PM has a corresponding set of displays
that are compatible with it considering technical specifications and customer preferences.
Similarly, each display can be used by several PMs. PMs capture the information needed for
long term sales, manufacturing and procurement planning, and are the main building blocks
of Vestel’s S&OP process.
Table 1 demonstrates a simplified example to illustrate dynamics of the problem. For this
12
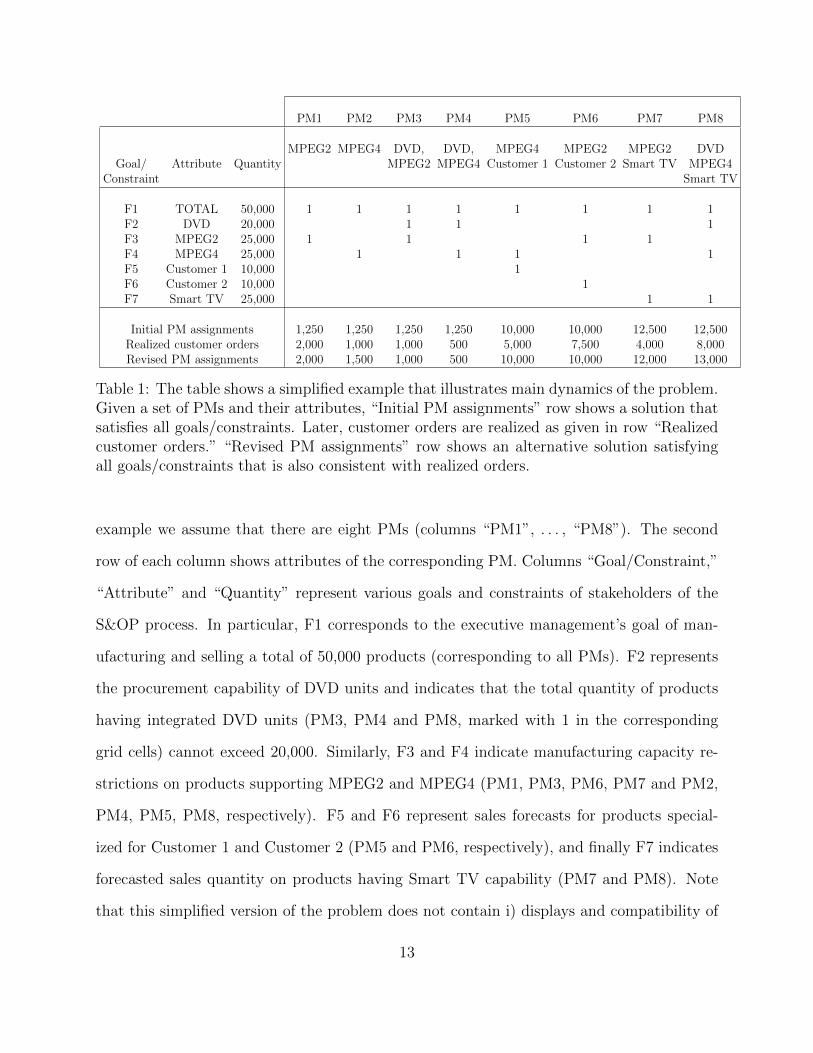
PM1 PM2 PM3 PM4 PM5 PM6 PM7 PM8
MPEG2 MPEG4 DVD, DVD, MPEG4 MPEG2 MPEG2 DVDGoal/ Attribute Quantity MPEG2 MPEG4 Customer 1 Customer 2 Smart TV MPEG4
Constraint Smart TV
F1 TOTAL 50,000 1 1 1 1 1 1 1 1F2 DVD 20,000 1 1 1F3 MPEG2 25,000 1 1 1 1F4 MPEG4 25,000 1 1 1 1F5 Customer 1 10,000 1F6 Customer 2 10,000 1F7 Smart TV 25,000 1 1
Initial PM assignments 1,250 1,250 1,250 1,250 10,000 10,000 12,500 12,500Realized customer orders 2,000 1,000 1,000 500 5,000 7,500 4,000 8,000Revised PM assignments 2,000 1,500 1,000 500 10,000 10,000 12,000 13,000
Table 1: The table shows a simplified example that illustrates main dynamics of the problem.Given a set of PMs and their attributes, “Initial PM assignments” row shows a solution thatsatisfies all goals/constraints. Later, customer orders are realized as given in row “Realizedcustomer orders.” “Revised PM assignments” row shows an alternative solution satisfyingall goals/constraints that is also consistent with realized orders.
example we assume that there are eight PMs (columns “PM1”, . . . , “PM8”). The second
row of each column shows attributes of the corresponding PM. Columns “Goal/Constraint,”
“Attribute” and “Quantity” represent various goals and constraints of stakeholders of the
S&OP process. In particular, F1 corresponds to the executive management’s goal of man-
ufacturing and selling a total of 50,000 products (corresponding to all PMs). F2 represents
the procurement capability of DVD units and indicates that the total quantity of products
having integrated DVD units (PM3, PM4 and PM8, marked with 1 in the corresponding
grid cells) cannot exceed 20,000. Similarly, F3 and F4 indicate manufacturing capacity re-
strictions on products supporting MPEG2 and MPEG4 (PM1, PM3, PM6, PM7 and PM2,
PM4, PM5, PM8, respectively). F5 and F6 represent sales forecasts for products special-
ized for Customer 1 and Customer 2 (PM5 and PM6, respectively), and finally F7 indicates
forecasted sales quantity on products having Smart TV capability (PM7 and PM8). Note
that this simplified version of the problem does not contain i) displays and compatibility of
13
displays with PMs, ii) the multi-period nature of the problem, iii) R&D inputs such as new
product introduction and engineering changes, iv) BOM, current inventory levels and sched-
uled receipts of upstream materials. However, it demonstrates that goals and constraints of
the various stakeholders partially overlap with the others.
As discussed in earlier sections, different people prepare inputs of the S&OP process at
different levels of detail, and there can be inconsistencies between them. As an example
assume that sales forecast for Smart TVs (F7) were 35,000. This would create an impossi-
ble situation because sales forecasts for Customers 1 and 2 (F5 and F6, respectively) imply
that the total sales of PM5 and PM6 is at least 20,000. Furthermore, since only PM7 and
PM8 have Smart TV capability, F5–F7 would imply that the total number of forecasted
product sales of PM5–PM8 would be at least 55,000. However, since PM5 and PM8 support
MPEG4, their total manufacturing quantity is bound by 25,000. Similarly, since PM6 and
PM7 support MPEG2, their production quantity is limited to at most 25,000. Hence, total
production quantity of PM5–PM8 is at most 50,000, meaning that forecasted sales would be
inconsistent with the manufacturing capacity. While this particular example demonstrates
an under-capacity problem, in practice we have observed that sales forecasts are often in-
consistent among themselves and realized sales.
Assume that there are no realized customer orders when the S&OP process takes place.
The row “Initial PM assignments” represents a feasible assignment of PM quantities that
meets all sales forecasts, satisfies capacity and procurement constraints, and ensures that
total assigned quantity is in alignment with the goal set by executive management. Assigned
PM quantities represent the consensus plan. ERP system uses these quantities to calculate
material requirements at lower levels via the MRP process. Note that PM assignments are
based on the information available at the time, and may need to be revised in case of changes
in market conditions or supply disruptions. As new customer orders materialize during the
month, no action is needed as long as all realized customer order quantities do not exceed
14
assigned PM quantities. Assume that “Realized customer orders” row represents actual
customer orders received within the month. Since the realized customer order quantity for
PM1 (2,000) exceeds its initial assignment (1,250), assignment of PM1 needs to be increased
to at least 2,000. Since this change affects goals and constraints that PM1 participates in (F1
and F3), other PM assignments also need to be adjusted. “Revised PM assignments” row
shows a revised assignment of PMs that are in alignment with original goals/constraints and
realized customer orders. Note that without such an adjustment, MRP would overestimate
lower level materials’ requirements, resulting in accumulation of unnecessary inventory. We
will further discuss this issue in Benefits section.
Implementation
Before our study planning experts were manually executing the S&OP process using spread-
sheets. They were using several interlinked spreadsheets to investigate the plan from vari-
ous perspectives including sales, manufacturing, procurement and R&D. Data used in these
spreadsheets were manually downloaded from several tables on the ERP. Planners were man-
ually making PM assignments on spreadsheets and uploading results back to the ERP. This
process was time consuming and prone to errors at various levels. Furthermore, the large
amount of data involved made it difficult for planners to investigate and analyze inconsis-
tencies and identify a least costly/most profitable operations plan. To this end, Vestel had
made various attempts to automate the process by implementing spreadsheet macros and
heuristic procedures in the ERP system. However, these approaches proved to be insufficent
for a company that produces over 9.5 million TV units in over 5,000 different models annu-
ally, and procures approximately 20,000 different materials because they did not provide the
required flexibility, speed and solution quality.
Our study started in December 2010 with the goal of developing a decision support
15
system to support Vestel’s S&OP process. In the analysis and design phase, together with
all stakeholders of the S&OP process, we identified main system requirements as follows:
• Rapidly generate high-quality plans,
• Determine inconsistencies between sales forecasts, realized customer orders, supply
constraints, R&D plans and managerial goals,
• Choose among alternative plans that can satisfy given goals and constraints to increase
operational efficiency and reduce costs,
• Work with Vestel’s ERP software bidirectionally in an integrated manner,
• Perform scenario analysis on forecasts, procurement capability, production capacity,
• Revise the plan automatically to align with realized customer orders,
• Store plans and compare previous plans within themselves and with realized orders,
and facilitate analysis of differences between forecasts and realized customer orders,
• Serve as the “single source of truth” regarding the S&OP process, and eliminate the
need of multiple spreadsheets.
.
After an initial investigation of the problem and the required functionality, we chose to
build a decision support system (DSS) based on mathematical programming as the solution
direction. Our reasons for choosing an optimization-based approach instead of heuristics or
metaheuristics can be summarized as follows:
• Our investigation revealed that the problem structure is suitable for the development
of a mixed-integer programming model based on linear programming formulations used
in aggregate planning problems (see e.g., Pochet and Wolsey [2006]).
• If a linear or mixed-integer programming problem is infeasible, an irreducible infeasible
subsystem (IIS) of constraints can be calculated [Gleeson and Ryan, 1990, Guieu and
Chinneck, 1999]. Such a subset is infeasible by itself, but if any constraint is removed
from the subset, the remaining set of constraints is feasible. Thus, an IIS provides a
16
precise “reason of infeasibility” of the formulation, and can be used to identify conflicts
between various inputs of the S&OP process.
• Planning horizon in S&OP process is at least 4 months, during which Vestel produces
and sells over 3 million TV units and procures all related materials. Therefore, so-
lution quality has a significant impact on operations costs, customer satisfaction and
profitability.
Given the requirements that became clear during the analysis and design phase, we
carried out our study in three phases:
1. Designing the optimization model
2. Developing a DSS based on the optimization model
3. Expanding the usage of the DSS within Vestel, and enabling stakeholders of the S&OP
process to benefit from the system directly
In the first stage we formulated the planning problem in the S&OP process as an optimiza-
tion model given in the Appendix. Our model minimizes procurement and production costs
while satisfying customer orders and sales forecasts, and meeting operational constraints.
In the second stage we developed a DSS based on the optimization model on ICRON Ad-
vanced Planning and Scheduling system [ICRON Technologies, 2013]. ICRON provides an
object-oriented and visual algorithm modeling environment. It also has extensive support for
database and ERP systems integration and interfaces to several mixed-integer programming
solvers such as GLPK, Cbc, CPLEX and Gurobi. Main functionalities and use cases of our
DSS can be summarized as follows:
• Our DSS downloads up-to-date data about realized customer orders, current inventory
levels and scheduled receipts of critical materials, PM definitions, BOM and so on from
the ERP software.
• It validates input data and reports data problems via a number of validation reports.
It also allows the user to investigate input data and make changes before running
17
optimization.
• Once the user initiates optimization, our DSS constructs and solves the optimization
model in memory.
• If the model is infeasible, it performs infeasibility analysis by computing an IIS. It then
identifies the business objects (such as PMs, displays, sales forecasts) that are associ-
ated with the constraints and variables in the IIS. Thus, it automatically translates a
mathematical description of infeasibilities to a business description of inconsistencies.
It reports such inconsistencies in the graphical user interface (GUI) in a manner that
allows the user to rapidly resolve the infeasibility by directly interacting with the ob-
jects taking place in the inconsistency. As an example, assume that an infeasibility is
caused by the shortage of a display within its procurement lead time. In this case our
DSS lists the display along with all customer orders and sales forecasts that require
the display in a window dedicated to infeasibility analysis. The user can then resolve
the infeasibility by increasing the supply (after aligning with Procurement) or decreas-
ing the demand (after aligning with Sales & Marketing). The user can also manually
enable or disable some constraints.
• The user can also instruct our DSS to automatically relax some constraints to resolve
infeasibility. When the user executes this functionality, our DSS first converts demand
constraints to soft constraints by adding an auxiliary variable to each customer order
and sales forecast. These variables represent the quantity of the corresponding demand
item that cannot be satisfied, under the given constraints. Our DSS, then, solves an
auxiliary optimization model whose objective function minimizes the sum of unsatisfied
demand quantity variables subject to constraints in the original model. An optimal
solution of this auxiliary model represents minimum-unsatisfaction solution, and the
demand items whose unsatisfaction variable takes nonzero values indicate the reason
of infeasibility. We then fix each demand item’s unsatisfaction variable to its current
18
level, switch back to the original objective function and re-solve the problem. The
user can identify the demand items that are affected by the infeasibility in the original
model, and also can evaluate the plan that will be generated once infeasibilities are
resolved.
Note that this functionality complements the IIS detection functionality. Users regu-
larly use IIS detection to identify root causes of infeasibility. However, since the number
of constraints that can take place in an IIS can be relatively large and since there can
be multiple IIS sets associated with an infeasible model, the automated infeasibility
resolution functionality is also needed. We have observed that over time users have
gotten more and more comfortable with interpreting IIS sets from a business point of
view. They now often prefer to use IIS detection functionality so that they have an
active role in infeasibility resolution and have more control over the system.
• Once an optimal solution is found, our DSS reports the solution in various reports,
pivot tables, etc., so that users can easily understand and interpret the solution.
• It also allows users to manually add, remove or modify constraints. We have integrated
these use cases into a pivot table that allows the users to dynamically filter and group
PMs with respect to their product attributes. Each cell in the pivot table represents
a subset of PMs to be produced in a particular month sharing similar attributes. The
user can see the current result of the optimization model associated with that subset
and month, and can add a new constraint (6) to change it in the next optimization
run.
• It also stores results of the optimization in database for future reference, and updates
the ERP system as needed.
Our DSS keeps the optimization model and its solution “alive” in computer memory. This
capability allows our DSS to reflect any changes that the user makes to goals and constraints
immediately to the optimization model instead of building and solving the model from scratch
19
each time the user triggers optimization. Specifically, when the user executes optimization
for the first time our DSS builds the mathematical model in memory. It communicates the
resulting model to the solver component, which solves the optimization problem and returns
an optimal solution along with additional information such as optimal basis. Our DSS stores
the mathematical model and its optimal basis in memory, and reflects it in the GUI. If the
user makes a change to the model, our DSS changes the corresponding mathematical model
objects incrementally. For instance, if the user creates a new constraint, our DSS adds a new
constraint to the mathematical model after calculating its variable coefficients and right-
hand-side value. Note that this approach is significantly faster than re-building the model
from scratch on each optimization request since it saves on model generation time and also
allows the solver to utilize its warm start capabilities. As a result, this re-optimization
capability enables scenario analysis within a few seconds and significantly enhances usability
of the system.
User tests for our DSS started in June 2011. We identified three test phases together
with users:
1. Data accuracy tests: Users compared data seen on ICRON with up-to-date data on
the ERP software and made necessary corrections as needed. At this stage data qual-
ity on the ERP improved significantly, and various checks for data consistency were
implemented. In particular, during this phase we observed that purchase orders for
various components on ERP were not being updated promptly to reflect changes on
inbound ship schedules. Vestel updated relevant business processes to solve this issue.
This phase took approximately six weeks, until mid-July 2011.
2. Model accuracy tests: We generated small-sized data sets together with the users, and
executed the DSS over these data sets to check results of the optimization model.
We specifically analyzed extreme scenarios (such as no demand, very high demand,
no materials procurement capability, etc.), and made necessary corrections until the
20
system successfully produced correct and explicable results for these situations. This
phase was executed in parallel with the first phase, and allowed identification and
resolution of various “corner cases” before they appeared on real data.
3. Parallel usage test: After the problems encountered in the first two stages were fixed,
S&OP planners thoroughly tested the DSS in parallel with their manual planning
process using spreadsheets. During these tests, planners checked the plan that our DSS
generated on the same data with the manually generated plan, and confirmed that our
DSS produces high quality plans and is able to explicitly consider some criteria that
were not included in manual planning. This phase started in the beginning of July 2011
and took approximately six weeks. Our main challenge in this phase was expectation
management of planners. In particular, planners initially expected our DSS to generate
a very similar plan to their manually generated plan. After several discussions, they
started focusing on evaluating the plan generated by our DSS independently, and
eventually gained trust by observing that our DSS consistently generated high quality
plans.
At the end of the second phase of our study, our DSS became operational for use of S&OP
planners in August 2011.
In the third phase of our study, we designed web-based reports so that a large number of
users in various departments can easily reach the up-to-date plan. These reports take up-to-
date plan directly from ICRON, and allow comparing the current plan with previously saved
plans and realized customer orders. The entire system became operational in November
2011, and Vestel has been using our DSS on a daily basis since then.
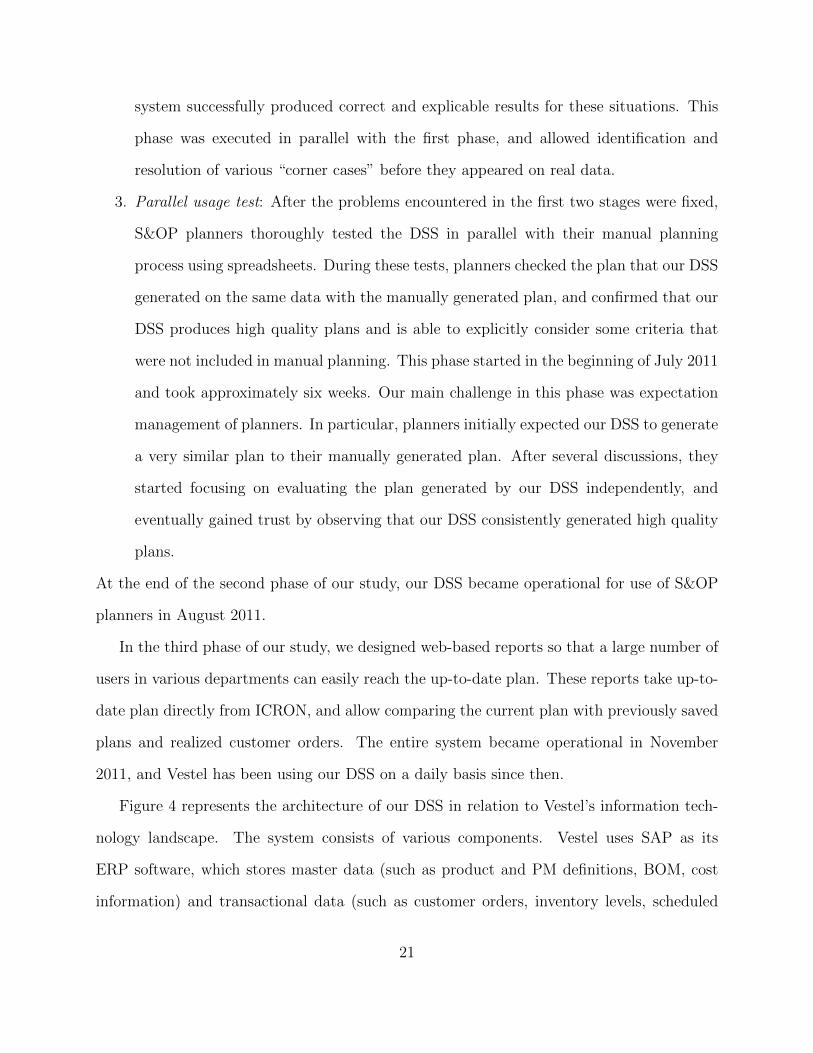
Figure 4 represents the architecture of our DSS in relation to Vestel’s information tech-
nology landscape. The system consists of various components. Vestel uses SAP as its
ERP software, which stores master data (such as product and PM definitions, BOM, cost
information) and transactional data (such as customer orders, inventory levels, scheduled
21
ICRON S&OP Environment
Execution Module Web Module Planning Module
Other DepartmentsS&OP Planners
Database Environment
Planning
Database
Integration Module
ERP
Figure 4: The figure shows main components and users of our DSS in relation to Vestel’sinformation technology (IT) architecture.
22
receipts). Planning Database, which is a Microsoft SQL Server database, stores required
planning data that is not available on the ERP along with scenarios and plans generated in
planning sessions. Integration Module, which is implemented in ICRON, transfers data be-
tween the ERP and Planning Database, and ensures data consistency via several validation
checks. Planning Module, which is also implemented in ICRON, is responsible for planning
and scenario analysis. Execution Module, also implemented in ICRON, is responsible for
tracking realization of customer orders, inventory levels and scheduled material receipts, and
adjusting PM assignments of the current plan as needed. We implemented these modules,
which are primarily used by S&OP planners, during the second phase of our study. Finally
Web Module, which is an ASP.NET application, provides web-based reporting functionality
and is responsible for disseminating up-to-date plan to other departments. This module was
implemented during the last phase of our study.
Benefits
We have observed various benefits of our DSS since it became operational in August 2011.
We will first discuss tangible benefits measured throughout years 2012 and 2013, followed
by intangible benefits.
Tangible Gains
Decrease in planning time: While new PMs are introduced continuously and some PMs
become obsolete due to changes in product portfolio, the number of PMs that are active
in planning sessions is approximately 700. The total number of active processes is approx-
imately 5000 since each PM has a number of alternative compatible displays. The time
horizon of S&OP process at Vestel is at least four months. Since S&OP planners were man-
ually generating the plan prior to our study, it was taking them at least two days to analyze
23
inconsistencies and calculate PM assignments after obtaining inputs from all functions. Af-
ter the implementation of our DSS, this time has decreased to 3 hours. Our DSS spends
approximately 30 minutes of this time while reading data from the ERP, and 3-4 minutes on
constructing and solving the optimization model for the first time. Planners use the remain-
ing time to define and analyze scenarios. Since our DSS stores optimization model and its
optimal solution in memory for efficient re-optimization, solution of each scenario takes a few
seconds. Automatic infeasibility analysis and infeasibility relaxation functionalities execute
under one minute in case our DSS identifies an optimization model as infeasible. Therefore,
most of the time is used for defining and analyzing alternative scenarios.
Increase in efficiency of the S&OP process: Prior to our study S&OP meetings with
the participation of all functions and the executive management could only be made once
per month. After our DSS became operational, Vestel has increased the frequency of S&OP
meetings to weekly, and on-demand when a major change in supply or demand conditions
occurs. Furthermore, since rapid scenario analysis and inconsistency detection became pos-
sible, it is now possible to execute our DSS during the S&OP meeting to investigate ad-hoc
scenarios. Thus, the overall effectiveness of the S&OP process has improved significantly.
Improvement in planning accuracy: Discrepancy between the initial PM assignments
made and the actual production has decreased by 20% once our DSS became operational
compared to manually made PM assignments since i) our DSS makes better use of available
information on existing customer orders and supply state compared to manual planning, and
ii) our DSS generates an optimal solution, which is communicated to Sales & Marketing to
guide sales efforts. Recall that our DSS revises PM assignments automatically as needed.
As a combination of these factors, the gap between planned and realized operations has
significantly reduced. Furthermore, our DSS has replaced empirical rules used by planners
with an optimization model that provides a consistent solution quality.
Decrease in inventory level: As discussed in Planning Materials section, our DSS trans-
24
fers assigned PM quantities to the ERP system to derive MRP and other relevant processes.
Before our study planners were manually adjusting PM assignments with respect to realized
customer orders biweekly. Hence, MRP was running with up-to-date data only once every
two weeks and producing correct results in terms of long-term materials requirement. This
was causing some issues in MRP results as we will describe on our illustrative example given
in Table 1. Assume that the row “Initial PM assignments” represents initial assignments
with no customer orders yet realized. MRP calculates requirements of upstream materials by
using only PM assignments, and total requirement quantity that drives MRP calculations is
50,000 (sum of all PM quantities). Assume that some customer orders have materialized dur-
ing the month as given in “Realized customer orders” row before PM assignments are revised
on ERP. Since PM1 has an assignment of 1,250 but 2,000 realized customer orders, MRP
calculates requirements based on 2,000. For other PMs assigned quantity drives calculations
since realized order quantity is less than the assigned quantity (reflecting the anticipation
of more customer orders in the future). Thus, total requirement quantity that drives MRP
calculations is 50,750 even though there is no corresponding change in sales forecasts or
management goals. The excess quantity disappears once PM assignments are updated in
alignment with realized customer orders as given in row “Revised PM assignments.”
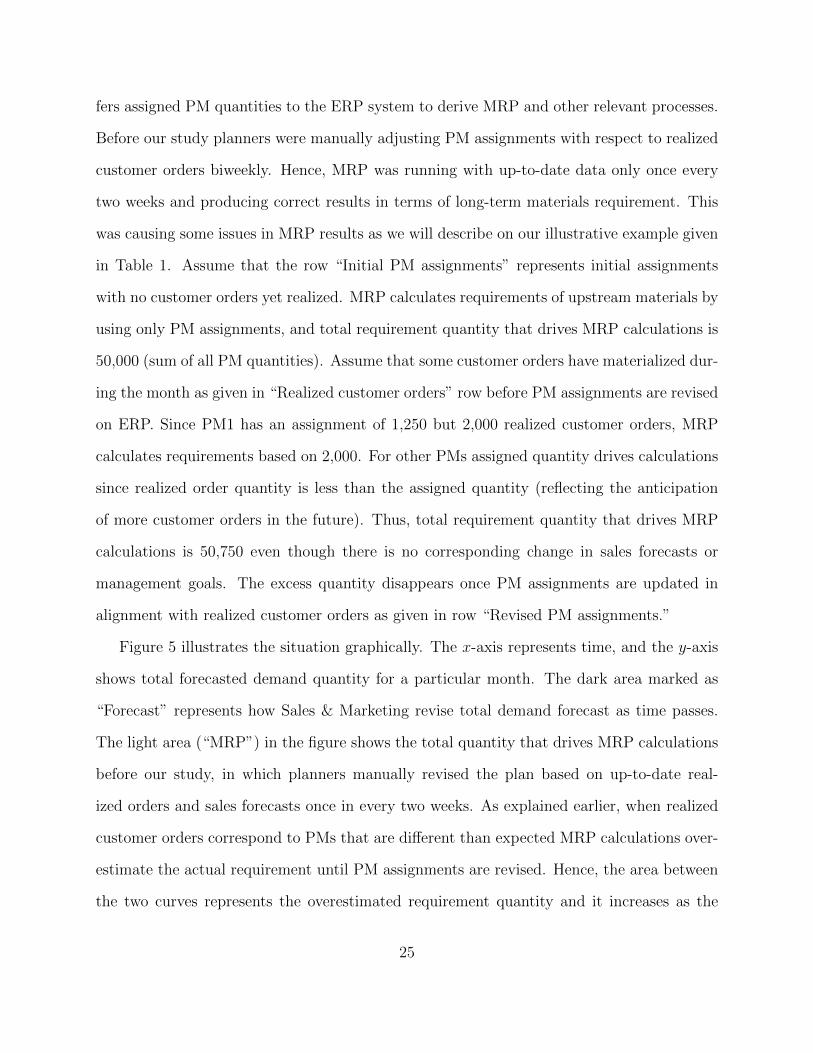
Figure 5 illustrates the situation graphically. The x-axis represents time, and the y-axis
shows total forecasted demand quantity for a particular month. The dark area marked as
“Forecast” represents how Sales & Marketing revise total demand forecast as time passes.
The light area (“MRP”) in the figure shows the total quantity that drives MRP calculations
before our study, in which planners manually revised the plan based on up-to-date real-
ized orders and sales forecasts once in every two weeks. As explained earlier, when realized
customer orders correspond to PMs that are different than expected MRP calculations over-
estimate the actual requirement until PM assignments are revised. Hence, the area between
the two curves represents the overestimated requirement quantity and it increases as the
25
620,000
600,000
t+1 t+2
Weeks
Quantity
t+3 t+4 t+5 t+6 t+7 t+8 t+9 t+10
640,000
680,000
700,000
720,000
740,000
780,000Forecast
MRP
(Before our DSS)
Figure 5: The figure illustrates how total forecast evolves over time (dark area), and howbiweekly PM adjustment cycle used before our DSS became operational caused MRP tooverestimate material requirements (light area). The Execution Module in our DSS auto-matically revises PM assignments to ensure that the two curves overlap on a daily basis.
synchronization time increases. Our system’s Execution Module has reduced the synchro-
nization time from two weeks to one day since it adjusts PM assignments based on realized
customer orders every day, and ensures that the two curves overlap daily. Improving synchro-
nization time has resulted in approximately 5% decrease in inventory levels of components
having long lead times.
Intangible Gains
Reduction in MRP nervousness: As illustrated in Figure 5, the total quantity driving
MRP calculations had a saw-like pattern before our study with a cycle length of two weeks.
This pattern was causing radical changes in calculated requirement and timing of upstream
materials. Thus, it was creating nervousness in the MRP results, and required working with
high safety stocks. Nervousness in the materials requirement plan was also affecting pro-
26
curement plan, and hence Vestel’s upstream supply chain. Our system’s Execution Module
has eliminated the root cause of this nervousness.
Since our model simultaneously considers Vestel’s sales, procurement and manufacturing
operations, effect of changes in one part of the system may propagate to other systems due
to our model’s holistic approach. We note that increased frequency of planning may result in
frequent changes to PM assignments, thus potentially contributing to“planning nervousness.”
To mitigate this effect we initially incorporated a term to our model’s objective function that
penalizes changes from previously released PM assignments in our DSS’s Execution Module.
However, planners challenged this approach during testing phase since i) the additional term
caused the model to deviate from cost-optimal solutions, ii) it reduced the system’s ability to
react rapidly to changes in supply and demand conditions, iii) it created differences between
PM assignments of Planning Module and Execution Module that were not easy to interpret.
Thus, we took a different approach. After several joint sessions with representatives of Sales
& Marketing, Manufacturing and Procurement functions, the need for differentiation between
PM assignments and firm commitments became clear. Firm commitments were identified
as customer orders (Sales & Marketing), production orders (Manufacturing), and purchase
orders (Procurement). Furthermore, all functions agreed to interpret PM assignments as
temporary calculated values that are needed to ensure consistency of the overall plan, rather
than committed decisions. This interpretation also complies with the fact that absolute
values of PM assignments are not directly used in operational decisions. We modified our
DSS so that it downloads up-to-date information about firm commitments from the ERP,
treats them as “frozen,” and optimizes PM assignments in alignment with firm commitments.
In practice this approach has successfully created a good balance between adaptability and
stability of the plan.
Increase in data visibility and correctness: Before our study the S&OP process was
based on data kept in several ERP tables, spreadsheet files and pivot reports in different
27
places. These were manually updated and were not integrated, and it was not possible
to ensure that analyses were made on up-to-date data. Our DSS has become the single
source of truth regarding the S&OP process, and now it is possible to present up-to-date
consolidated views of data to all stakeholders in a unified and consistent form. The increased
data visibility, combined with improvements in data correctness obtained by automated
validation algorithms has enabled a structure that allows guidance of sales efforts, indicates
procurement problems before they appear and facilitates analysis of deviations between sales
forecasts and realized customer orders.
Providing a basis for further studies: Up-to-date information about long-term oper-
ational plan and sales forecasts has become available electronically since our DSS became
operational. Availability of this information has enabled automation of other processes
that require this data. In particular, Vestel’s management identified the capable-to-promise
(CTP) process as the next highest priority. Vestel’s CTP process is very important in cus-
tomer satisfaction because the main output of the process is promised delivery dates before
customers finalize their orders. Existing customer orders and forecasted sales need to be
analyzed with respect to their capacity and material requirements in order to calculate a
reliable delivery date. After our DSS for the S&OP process, we developed a system for the
CTP process that has become operational recently. Thus, our DSS described in this paper
has provided a solid basis for further studies to improve Vestel’s operations and supply chain
performance.
Conclusion
Operating in TV manufacturing industry, which is highly competitive and has a high rate
of change, Vestel is in a unique location where it is geographically close to Europe (where
majority of its customers are located), but is quite far away from Far East (where majority
28
of its suppliers are located). While Vestel uses its proximity to Europe as a competitive
advantage to satisfy customer demand on short notice, it has to manage long lead times in
material procurement and exploit flexibility in manufacturing processes to decrease costs.
The rate of technological advances in end products as well as upstream components make it
difficult to generate a realistic long-term plan. To this end Vestel’s S&OP process is critical
for its operational efficiency. In this study we investigated the S&OP process in detail and
designed an optimization model that captures dynamics of Vestel’s S&OP process. We
built a decision support system around our optimization model, which has replaced manual
planning. Our system has become an integral part of Vestel’s S&OP process, and the process
itself has improved by making better use of our system. Our DSS has been in continuous
use since 2011 and in addition to benefits that can directly be attributed to it, it also has
enabled development of systems for related processes to improve Vestel’s competitiveness.
Acknowledgments. This research was partially supported by Bogazici University Re-
search Fund Grant No: 6540 and TUBITAK TEYDEB grant no 3100682. We would like to
thank Caglar Cakır Tunc (CMA Consulting), Z. Melis Teksan, Noyan Ekici, Ugur Sonmez
(ICRON Technologies), Seref Hamarat, Bora Pilavcı, Engin Ergor (Vestel Electronics) for
their valuable contributions to the implementation project.
Appendix
Mathematical Model
Table 2 shows the symbols used in our mathematical model along with their brief descrip-
tions. We model each PM, display and upstream material as a part (set I). Each part has
an associated set of processes, where we model each production and procurement option
of a part as a different process (sets J and Ji). In particular, since each product can be
29
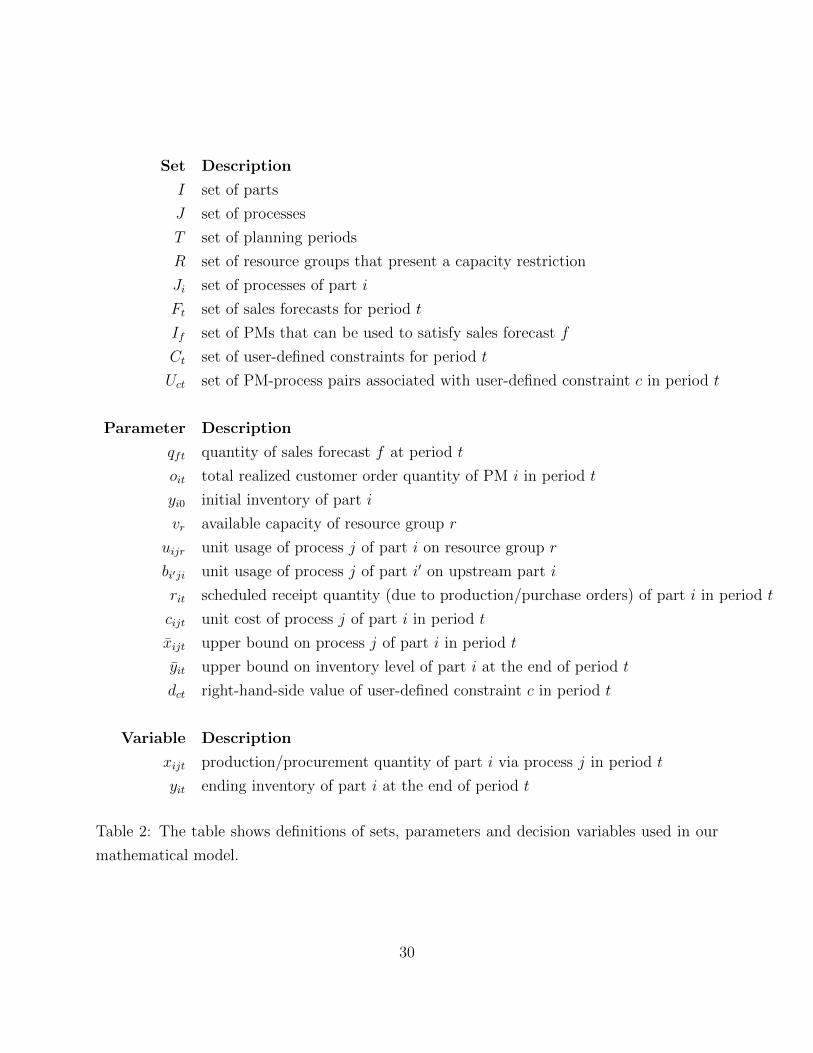
Set Description
I set of parts
J set of processes
T set of planning periods
R set of resource groups that present a capacity restriction
Ji set of processes of part i
Ft set of sales forecasts for period t
If set of PMs that can be used to satisfy sales forecast f
Ct set of user-defined constraints for period t
Uct set of PM-process pairs associated with user-defined constraint c in period t
Parameter Description
qft quantity of sales forecast f at period t
oit total realized customer order quantity of PM i in period t
yi0 initial inventory of part i
vr available capacity of resource group r
uijr unit usage of process j of part i on resource group r
bi′ji unit usage of process j of part i′ on upstream part i
rit scheduled receipt quantity (due to production/purchase orders) of part i in period t
cijt unit cost of process j of part i in period t
xijt upper bound on process j of part i in period t
yit upper bound on inventory level of part i at the end of period t
dct right-hand-side value of user-defined constraint c in period t
Variable Description
xijt production/procurement quantity of part i via process j in period t
yit ending inventory of part i at the end of period t
Table 2: The table shows definitions of sets, parameters and decision variables used in our
mathematical model.
30
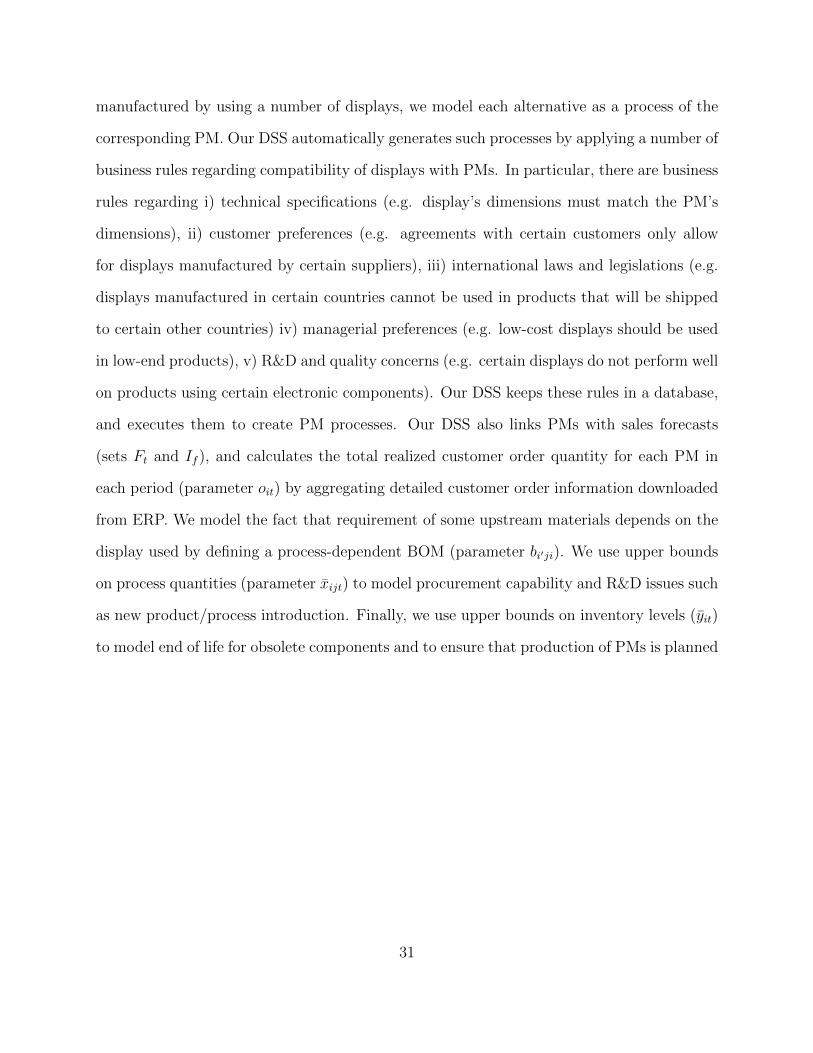
manufactured by using a number of displays, we model each alternative as a process of the
corresponding PM. Our DSS automatically generates such processes by applying a number of
business rules regarding compatibility of displays with PMs. In particular, there are business
rules regarding i) technical specifications (e.g. display’s dimensions must match the PM’s
dimensions), ii) customer preferences (e.g. agreements with certain customers only allow
for displays manufactured by certain suppliers), iii) international laws and legislations (e.g.
displays manufactured in certain countries cannot be used in products that will be shipped
to certain other countries) iv) managerial preferences (e.g. low-cost displays should be used
in low-end products), v) R&D and quality concerns (e.g. certain displays do not perform well
on products using certain electronic components). Our DSS keeps these rules in a database,
and executes them to create PM processes. Our DSS also links PMs with sales forecasts
(sets Ft and If ), and calculates the total realized customer order quantity for each PM in
each period (parameter oit) by aggregating detailed customer order information downloaded
from ERP. We model the fact that requirement of some upstream materials depends on the
display used by defining a process-dependent BOM (parameter bi′ji). We use upper bounds
on process quantities (parameter xijt) to model procurement capability and R&D issues such
as new product/process introduction. Finally, we use upper bounds on inventory levels (yit)
to model end of life for obsolete components and to ensure that production of PMs is planned
31
only to satisfy customer orders and sales forecasts, but not to inventory.
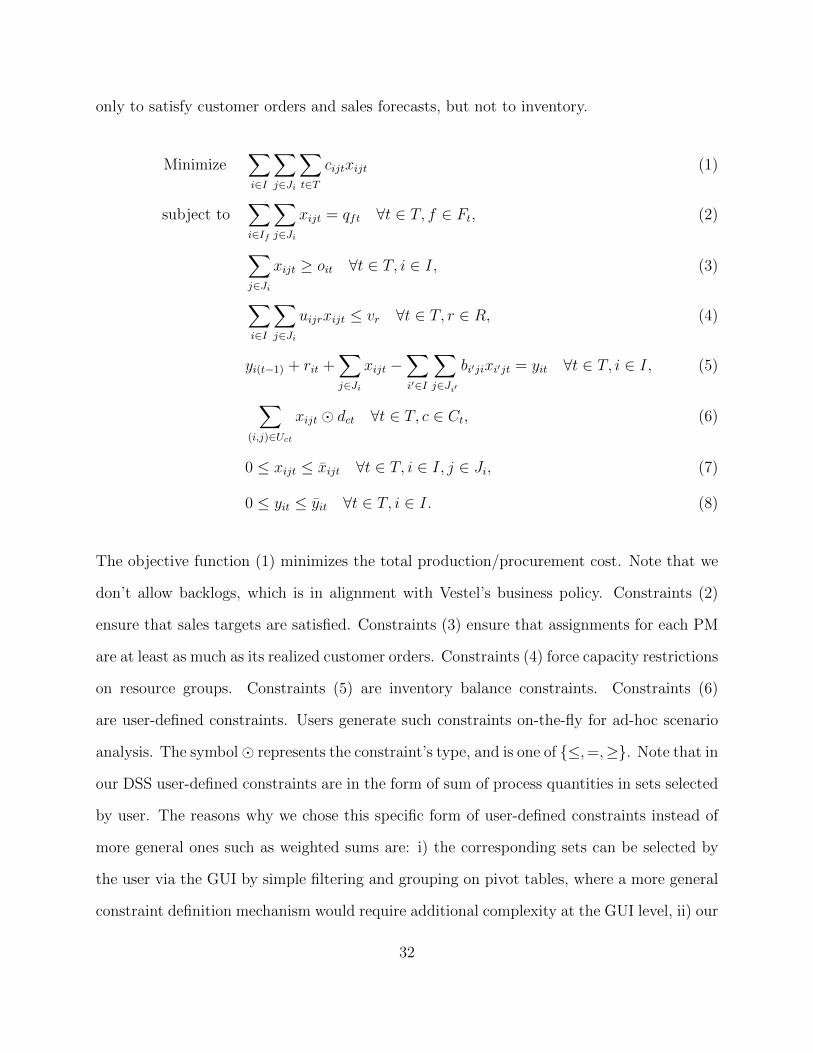
Minimize∑i∈I
∑j∈Ji
∑t∈T
cijtxijt (1)
subject to∑i∈If
∑j∈Ji
xijt = qft ∀t ∈ T, f ∈ Ft, (2)
∑j∈Ji
xijt ≥ oit ∀t ∈ T, i ∈ I, (3)
∑i∈I
∑j∈Ji
uijrxijt ≤ vr ∀t ∈ T, r ∈ R, (4)
yi(t−1) + rit +∑j∈Ji
xijt −∑i′∈I
∑j∈Ji′
bi′jixi′jt = yit ∀t ∈ T, i ∈ I, (5)
∑(i,j)∈Uct
xijt � dct ∀t ∈ T, c ∈ Ct, (6)
0 ≤ xijt ≤ xijt ∀t ∈ T, i ∈ I, j ∈ Ji, (7)
0 ≤ yit ≤ yit ∀t ∈ T, i ∈ I. (8)
The objective function (1) minimizes the total production/procurement cost. Note that we
don’t allow backlogs, which is in alignment with Vestel’s business policy. Constraints (2)
ensure that sales targets are satisfied. Constraints (3) ensure that assignments for each PM
are at least as much as its realized customer orders. Constraints (4) force capacity restrictions
on resource groups. Constraints (5) are inventory balance constraints. Constraints (6)
are user-defined constraints. Users generate such constraints on-the-fly for ad-hoc scenario
analysis. The symbol� represents the constraint’s type, and is one of {≤,=,≥}. Note that in
our DSS user-defined constraints are in the form of sum of process quantities in sets selected
by user. The reasons why we chose this specific form of user-defined constraints instead of
more general ones such as weighted sums are: i) the corresponding sets can be selected by
the user via the GUI by simple filtering and grouping on pivot tables, where a more general
constraint definition mechanism would require additional complexity at the GUI level, ii) our
32
observation that most constraints needed for ad-hoc scenario analysis at Vestel can be written
as sum of a set of process quantities. Finally, constraints (7)–(8) enforce non-negativity and
upper bound restrictions on variables. Note that since Vestel’s monthly production and
procurement quantities are on the order of several hundred thousands, solving the problem
as a linear programming problem and then rounding quantities to integral values does not
introduce a significant error. Hence, we do not impose integrality restrictions in our DSS.
We note that bucket-based modeling of time in our model and inventory balance equations
(5) are similar to linear programming formulations used in aggregate production planning
problems (see e.g., Pochet and Wolsey [2006]). Our approach extends basic models in two
aspects: i) modeling of alternative processes, possibly with different BOMs, and ii) Vestel-
specific constraints (2)–(4), (6)–(8).
Business Implications of Our Mathematical Model
We next discuss how our model handles some of Vestel’s challenges described in earlier
sections. As discussed in Introduction, in addition to long term agreements with its suppliers,
Vestel also employs opportunistic purchasing of input materials, especially displays. We
model input materials as parts, which have their own “buy” processes. Hence, optimal
values for x-variables corresponding to buy processes answer time-to-buy and quantity-to-
buy questions. Furthermore, the rit parameter corresponding to input materials represents
the existing purchase order quantity, which our model treats as fixed. Planners can use our
DSS to create dummy purchase orders to perform what-if analysis on the values of the r-
parameters, and investigate the impact of material purchase opportunities. Note that some
large suppliers in the high tech sector sometimes offer complex procurement schemes to
manufacturers. Those schemes could involve non-linear discounts based on total volume or
purchase quantity of a set of components aggregated across multiple periods. Even though
modeling such schemes is not within the scope of our study, we note that Vestel uses our
33
DSS to analyze long-term procurement requirements by extending the planning horizon to
at least 12 months while making annual contracts with its suppliers.
Our model contains x-parameters that provide an upper bound on x-variables. Our
DSS reads R&D project timings regarding new product/material introduction or phase-out
as input, and uses the project timing information to calculate values of x-parameters of
parts/processes subject to engineering changes. In particular, if a new product is planned to
be introduced at time t, our DSS sets the x-parameters of the corresponding part’s processes
before t to zero. We also handle end-of-life planning of existing products/materials in a
similar fashion.
Our DSS also allows planners to simulate what-if scenarios on R&D project timings.
Thus, planners can propose target timings for R&D projects using our DSS. Another use of
x-parameters is in regard to material procurement capability and lead times. Since Vestel
allows late changes to customer orders, it is possible that changes in customer orders affect
material requirements within procurement lead time. In this case, our DSS calculates the
additional procurement need since our model treats realized customer order quantities as
fixed due to Constraints (3), and since the x-variables represent the time/quantity-to-buy
decisions. If an x-variable for a buy material takes nonzero value within the correspond-
ing material’s lead time, expedited procurement is needed. If additional procurement is
not possible within the material’s lead time, then the planner can re-execute the model
after setting the corresponding x-parameter to zero, and create an alternative plan (if the
model is feasible) or identify which particular demand items are affected by investigating the
corresponding IIS (if the model is infeasible).
Note that our model does not contain any terms for setup minimization. Reasons for
this are: i) Vestel’s manufacturing environment is highly optimized to minimize setup in
alignment with their business strategy of accepting orders of small batch sizes (recall that
batch size of 66% of orders are for 500 or fewer units, where annual production quantity is
34
over 9.5 million TV units), and ii) setup times and costs are insignificant in relation to the
monthly time buckets used in planning. Finally, we note that since our model’s parameters
are set so that: i) manufacturing costs decrease over time (due to continuous process im-
provements, this assumption holds in real life), ii) while prices of input materials such as
displays fluctuate in the short term, input material costs decrease over time throughout the
planning horizon, and iii) backlogs are not allowed; our model plans production and procure-
ment as late as possible to satisfy demand/forecast on time. Therefore, we do not explicitly
model inventory holding costs. Our DSS contains reports that show material requirements,
proposed purchasing timings/quantities and projected inventory levels in the GUI to aid
planners in inventory planning.
References
R. Affonso, F. Marcotte, and B. Grabot. Sales and operations planning: the supply chain
pillar. Production Planning & Control, 19(2):132–141, 2008.
S. Chang and J. Chung. Optimization models for production planning in LG Display. In-
terfaces, 43(6):518–529, 2013.
C-H. Chen-Ritzo, T. Ervolina, T. P. Harrison, and B. Gupta. Sales and operations plan-
ning in systems with order configuration uncertainty. European Journal of Operational
Research, 205(3):604–614, 2010.
C. T. Conlon. A dynamic model of costs and margins in the LCD TV
industry. Unpublished manuscript, Columbia University, 2012. URL
http://www.columbia.edu/∼cc3264/conlonjmp.pdf. Accessed 25/01/2014.
Y. Feng, S. D’Amours, and R. Beauregard. The value of sales and operations planning in ori-
ented strand board industry with make-to-order manufacturing system: Cross functional
35
integration under deterministic demand and spot market recourse. International Journal
of Production Economics, 115(1):189–209, 2008.
J. Gleeson and J. Ryan. Identifying minimally infeasible subsytem of inequalities. ORSA
Journal on Computing, 2(4):61–64, 1990.
O. Guieu and J. W. Chinneck. Analyzing infeasible mixed-integer and integer linear pro-
grams. INFORMS Journal on Computing, 11:63–77, 1999.
ICRON Technologies. ICRON 3.0 Technical Documentation, 2013.
R. Oliva and N. Watson. Cross-functional alignment in supply chain planning: A case study
of sales and operations planning. Journal of Operations Management, 29:434–448, 2011.
Y. Pochet and L.A. Wolsey. Production Planning by Mixed Integer Programming. Springer
Series in Operations Research and Financial Engineering. Springer, 2006.
D.H. Sheldon. World Class Sales & Operations Planning: A Guide to Successful Implemen-
tation and Robust Execution. J. Ross Pub., 2006. ISBN 9781932159530.
A.M.T. Thome, L.F. Scavarda, N.S. Fernandez, and A. J. Scavarda. Sales and operations
planning: A research synthesis. International Journal of Production Economics, 138(1):
1–13, 2012.
Vestel Electronics. Vestel Elektronik Annual Report 2013, 2013. URL
http://www.vestelinvestorrelations.com/en/ assets/pdf/AnnualReport 2013.pdf.
Accessed 27/08/2014.
T.F. Wallace. Sales & Operations Planning: The “How-to” Handbook. T. F. Wallace, 2004.
ISBN 9780967488448.
36