maternal and child health services title v block grant
TRANSCRIPT

Maternal and ChildHealth Services Title V
Block Grant
FY 2016 Application/ FY 2014 Annual Report
Illinois Created on 6/19/20156:44:02 AM

Table Of Contents
I. General Requirements I.A. Letter of Transmittal 1 I.B. Face Sheet 1 I.C. Assurances and Certifications 1 I.D. Table of Contents 1 I.E. Application/Annual Report Executive Summary 1II. Components of the Application/Annual Report II.A. Overview of the State 2 II.B. Five Year Needs Assessment Summary 5 II.B.1. Process 5 II.B.2. Findings 8 II.B.2.a. MCH Population Needs 8 II.B.2.b Title V Program Capacity 13 II.B.2.b.i. Organizational Structure 16 II.B.2.b.ii. Agency Capacity 16 II.B.2.b.iii. MCH Workforce Development and Capacity 17 II.B.2.c. Partnerships, Collaboration, and Coordination 19 II.C. State Selected Priorities 20 II.D. Linkage of State Selected Priorities with National Performance and Outcome Measures 23 II.E. Linkage of State Selected Priorities with State Performance and Outcome Measures 27 II.F. Five Year State Action Plan 28 II.F.1 State Action Plan and Strategies by MCH Population Domain 28 Women/Maternal Health 30 Perinatal/Infant Health 42 Child Health 66 Adolescent Health 88 Children with Special Health Care Needs 100 Cross-cutting/Life course 124 Other Programmatic Activities 130 II.F.2. MCH Workforce Development and Capacity 138 II.F.3. Family Consumer Partnership 138 II.F.4. Health Reform 143 II.F.5. Emerging Issues 144 II.F.6. Public Input 145 II.F.7. Technical Assistance 146III. Budget Narrative III.A. Expenditures 148 III.B. Budget 148IV. Title V-Medicaid IAA/MOU Title V-Medicaid IAA/MOU 149V. Supporting Documents Supporting Documents 150VI. Appendix Form 2 MCH Budget/Expenditure Details 152 Form 3a Budget and Expenditure Details by Types of Individuals Served 155

Form 3b Budget and Expenditure Details by Types of Services 158 Form 4 Number and Percentage of Newborns and Other Screened Cases Confirmed and Treated 161 Form 5a Unduplicated Count of Individuals Served Under Title V 167 Form 6 Deliveries and Infants Served by Title V and Entitled to Benefits Under Title XIX 169 Form 7 State MCH Toll-Free Telephone Line and Other Appropriate Methods Data 172 Form 8 State MCH and CSHCN Directors Contact Information 174 Form 9 List of MCH Priority Needs 176 Form 10a National Outcome Measures (NOMs) 178 Form 10a National Performance Measures (NPMs) 189 Form 10b State Performance/Outcome Measures Detail Sheets 191 Form 10c Evidence-Based or Informed Strategy Measures (ESMs) Detail Sheets 192 Form 10d National Performance Measures (NPMs) (Reporting Year 2014 & 2015) 193 Form 10d State Performance Measures (SPMs) (Reporting Year 2014 & 2015) 211 Form 11 Other State Data 221 State Action Plan Table 222
I. General Requirements
I.A. Letter of Transmittal
The Face Sheet (Form SF424) is submitted electronically in the HRSA Electronic Handbooks (EHBs).I.B. Face Sheet
I.C. Assurances and CertificationsThe State certifies assurances and certifications, as specified in Appendix C of the 2015 Title V Application/Annual Report Guidance, are maintained on file in the States’ MCH program central office, and will be able to provide them at HRSA’s request.
I.D. Table of ContentsThis report follows the outline of the Table of Contents provided in the "GUIDANCE AND FORMS FOR THE TITLE V APPLICATION/ANNUAL REPORT," OMB NO: 0915-0172; published January 2015; expires December 31, 2017.
I.E. Application/Annual Report Executive Summary
Page 1 of 222

II. Components of the Application/Annual Report
II.A. Overview of the State
Page 2 of 222

Page 3 of 222

Page 4 of 222

II.B. Five Year Needs Assessment Summary
II.B.1. Process
Page 5 of 222

Page 6 of 222

Page 7 of 222

II.B.2. Findings
II.B.2.a. MCH Population Needs
Page 8 of 222

Page 9 of 222

Page 10 of 222

Page 11 of 222

Page 12 of 222

II.B.2.b Title V Program Capacity
Page 13 of 222

Page 14 of 222

Page 15 of 222

II.B.2.b.i. Organizational Structure
II.B.2.b.ii. Agency Capacity
Page 16 of 222

II.B.2.b.iii. MCH Workforce Development and Capacity
Page 17 of 222

Page 18 of 222

II.B.2.c. Partnerships, Collaboration, and Coordination
Page 19 of 222

II.C. State Selected Priorities
Priority Need Priority Need Type (New, Replaced or Continued Priority Need for this five-year reporting period)
Rationale if priority need does not have a corresponding State or National Performance/Outcome Measure
1 . Assure accessibility, availability and quality of preventive and primary care for all women, particularly for women of reproductive age
Replaced
2 . Support healthy pregnancies and improve birth outcomes
Continued
3 . Support expanded access to and integration of early childhood services and systems
New
4 . Facilitate the integration of services within patient-centered medical homes for all children, particularly for children with special healthcare needs
Continued
5 . Empower adolescents to adopt healthy behaviors
New
6 . Assure appropriate transition planning and services for adolescents and young adults, including youth with special health care needs
Replaced
7 . Assure that equity is the foundation of all MCH decision-making; eliminate disparities in MCH outcomes
New
8 . Support expanded access to and integration of mental health services and systems for the MCH population.
Continued
9 . Partner with consumers, families and communities in decision-making across MCH programs, systems and policies
New The need for consumer, family, and consumer engagement repeatedly emerged during the 2015 needs assessment. Illinois Title V wants to ensure that such groups are viewed as partners at all-levels of decision-making -- spanning from interactions occurring during healthcare services up to the state-level program/policy planning process.
10 . Strengthen the MCH capacity for data collection, linkage, analysis, and dissemination; Improve MCH data systems and infrastructure
Continued High-quality data and sound science should be the foundation for public health decision-making. Illinois Title V has historically had many challenges related to data capacity and infrastructure. While many large gains have occurred during the last several years, there is still much room for improvement. Continuing this priority will keep the development of data capacity and infrastructure as a major focus for Title V in the coming years.
Page 20 of 222

Page 21 of 222

Page 22 of 222

II.D. Linkage of State Selected Priorities with National Performance and Outcome Measures
2016 2017 2018 2019 2020Annual Objective 63 64 65.5 67 68.5
NPM 1-Percent of women with a past year preventive medical visit
2016 2017 2018 2019 2020Annual Objective 80.4 81.9 83.5 85.1 86.8
NPM 3-Percent of very low birth weight (VLBW) infants born in a hospital with a Level III+ Neonatal Intensive Care Unit(NICU)
Page 23 of 222

2016 2017 2018 2019 2020Annual Objective 36.3 38.3 40.4 42.5 44.7
NPM 6-Percent of children, ages 10 through 71 months, receiving a developmental screening using a parent-completedscreening tool
2016 2017 2018 2019 2020Annual Objective 89.5 90.3 91.2 92.1 93.1
NPM 10-Percent of adolescents, ages 12 through 17, with a preventive medical visit in the past year.
2016 2017 2018 2019 2020Annual Objective 47.2 48.1 49 50 51
NPM 11-Percent of children with and without special health care needs having a medical home
2016 2017 2018 2019 2020Annual Objective 46.2 47.1 48 48.9 49.8
NPM 12-Percent of adolescents with and without special health care needs who received services necessary to maketransitions to adult health care
2016 2017 2018 2019 2020Annual Objective 49.4 51.3 53.2 55.1 57Annual Objective 81.6 82.4 83.2 84 84.8
NPM 13-A) Percent of women who had a dental visit during pregnancy and B) Percent of children, ages 1 through 17who had a preventive dental visit in the past year
2016 2017 2018 2019 2020Annual Objective 6.8 6.5 6.2 5.9 5.6Annual Objective 20.4 19.8 19.2 18.6 17.9
NPM 14-A) Percent of women who smoke during pregnancy and B) Percent of children who live in households wheresomeone smokes
Page 24 of 222

Page 25 of 222

Page 26 of 222

II.E. Linkage of State Selected Priorities with State Performance and Outcome Measures
Page 27 of 222

II.F.1 State Action Plan and Strategies by MCH Population Domain
Women/Maternal HealthState Action Plan Table
Page 28 of 222

Page 29 of 222

State Priority Needs
Objectives Strategies National Outcome Measures National Performance Measures ESMs SPMs
Assure accessibility, availability and quality of preventive and primary care for all women, particularly for women of reproductive age
By 2020,improve thepercent ofwomen with apast-yearpreventivemedical visit by10% (2020 obj =68.5%)
Identify and promoteeducationalmessages thatimprove the use ofpreventive healthservices amongselected targetedpopulations.Increase availabilityof adjustable-heightexamination tablesto ensure womenwith disabilities canobtain routinescreening andpreventive care.Integratepreconception/inter-conception care intoroutine primary carefor women ofreproductive age toinclude screeningand follow-up forrisk factors, such assmoking,management ofchronic disease andcontraception.Increase awarenessof the impact onbirth spacingthrough familyplanning educationand improvedaccess to highly-effectivecontraceptivemethods, such asLARC.
Rate of severe maternal morbidity per 10,000 delivery hospitalizationsMaternal mortality rate per 100,000 live birthsPercent of low birth weight deliveries (<2,500 grams)Percent of very low birth weight deliveries (<1,500 grams)Percent of moderately low birth weight deliveries (1,500-2,499 grams)Percent of preterm births (<37 weeks)Percent of early preterm births (<34 weeks)Percent of late preterm births (34-36 weeks)Percent of early term births (37, 38 weeks)Perinatal mortality rate per 1,000 live births plus fetal deathsInfant mortality rate per 1,000 live birthsNeonatal mortality rate per 1,000 live birthsPost neonatal mortality rate per 1,000 live birthsPreterm-related mortality rate per 100,000 live births
Percent of women with a past year preventive medical visit
Women/Maternal Health - Plan for the Application Year
Page 30 of 222

Page 31 of 222

Page 32 of 222

Page 33 of 222

Women/Maternal Health - Annual Report
NPM 1 - Percent of women with a past year preventive medical visit
2016 2017 2018 2019 2020Annual Objective 63 64 65.5 67 68.5
Annual Objectives
Page 34 of 222

Page 35 of 222

Page 36 of 222

Page 37 of 222

Page 38 of 222

Page 39 of 222

Page 40 of 222

Page 41 of 222

Perinatal/Infant HealthState Priority Needs
Objectives Strategies National Outcome Measures
Support healthy pregnancies and improve birth outcomes
By 2020,increase thepercent of verylow birth weightbabies born in aLevel III+perinatal hospitalby at least 10%(2020 obj. =86.8%). By2020, increasethe percent ofpregnant womenwho receiveddental servicesduringpregnancy by atleast 20% (2020obj. = 57.0%).By 2020,decrease thepercent ofwomen whosmoke duringpregnancy by atleast 15% (2020obj. = 5.6%).
An error has occurred while processing HtmlTextBox 'htmlTextBox9':An error occurred while parsing EntityName. Line 1, position 493.
Perinatal mortality rate per 1,000 live births plus fetal deathsInfant mortality rate per 1,000 live birthsNeonatal mortality rate per 1,000 live birthsPreterm-related mortality rate per 100,000 live births
State Action Plan Table
Perinatal/Infant Health - Plan for the Application Year
Page 42 of 222

National Performance Measures ESMs SPMs
Percent of very low birth weight (VLBW) infants born in a hospital with a Level III+ Neonatal Intensive Care Unit (NICU)
Page 43 of 222

Page 44 of 222

Page 45 of 222

Page 46 of 222

Page 47 of 222

Perinatal/Infant Health - Annual ReportPage 48 of 222

Page 49 of 222

2016 2017 2018 2019 2020Annual Objective 80.4 81.9 83.5 85.1 86.8
Annual Objectives
NPM 3 - Percent of very low birth weight (VLBW) infants born in a hospital with a Level III+ Neonatal Intensive Care Unit (NICU)
Page 50 of 222

Page 51 of 222

Page 52 of 222

Page 53 of 222
Page 54 of 222

Page 55 of 222

Page 56 of 222

Page 57 of 222
Page 58 of 222

Page 59 of 222

Page 60 of 222

Page 61 of 222

State Priority Needs
Objectives Strategies National Outcome Measures National Performance Measures ESMs SPMs
Support expanded access to and integration of early childhood services and systems
By 2020,increase thepercent ofchildren under 5years old whoreceived adevelopmentalscreening usinga parent-completed toolby at least 30%(2020 obj. =44.7%)
Expand HealthyFamilies, maintainFamily Literacy,increase parenteducation, improveknowledge of earlybrain and childdevelopment,support earlyliteracy. Increasewell-child screeningcompletion andfollow-up throughtraining for healthand early childhoodprofessionals. Offerchild care providerstechnical assistanceto improve quality,phase in qualityrating system,ensure sufficientmonitoring of healthand safety, andimprove infant-toddler care.
Percent of children meeting the criteria developed for school readiness (DEVELOPMENTAL)Percent of children in excellent or very good health
Percent of children, ages 10 through 71 months, receiving a developmental screening using a parent-completed screening tool
Child HealthState Action Plan Table
Page 62 of 222

Page 63 of 222

Facilitate the integration of services within patient-centered medical homes for all children, particularly for children with special healthcare needs
By 2020,increase thepercent ofchildren under 5years old whoreceived adevelopmentalscreening usinga parent-completed toolby at least 30%(2020 obj. =44.7%) By 2020,increase thepercent ofchildren withoutspecialhealthcareneeds receivingcare in a medicalhome by at least10% (2020 obj.= 63.9%) By2020, increasethe percent ofchildren withspecialhealthcareneeds receivingcare in a medicalhome by at least10% (2020 obj.= 51.0%) By2020, increasethe percent ofchildren ages 1-17 who receivedat least onepreventivedental visit in thelast year by atleast 5% (2020obj. = 84.8%).By 2020,decrease thepercent of
Collaborate withICAAP and HFS tocontinue to promotedevelopment ofmedical homes forall children,especially forCYSHCN, throughwebsite links withthe AAP NationalMedical Homewebsite forresources forpractices. Improveasthmaidentification andsupport services,including educationof families, referralof children withasthma toappropriate healthcare and socialservice agencies,and carecoordination.Identifyopportunities to linkchildren's medicalhomes to dentalhomes and supportintegration of care.See other strategiesfor this priorityunder "CSHCN"domain.
Percent of children meeting the criteria developed for school readiness (DEVELOPMENTAL)Percent of children in excellent or very good health
Percent of children, ages 10 through 71 months, receiving a developmental screening using a parent-completed screening tool
Page 64 of 222

Page 65 of 222

children exposedto environmentaltobacco smokein the home byat least 15%(2020 obj. =17.9%).
Child Health - Plan for the Application Year
Page 66 of 222

Page 67 of 222

Child Health - Annual Report
2016 2017 2018 2019 2020Annual Objective 36.3 38.3 40.4 42.5 44.7
Annual Objectives
NPM 6 - Percent of children, ages 10 through 71 months, receiving a developmental screening using a parent-completed screening tool
Page 68 of 222

Page 69 of 222
Page 70 of 222

Page 71 of 222

Page 72 of 222

Page 73 of 222

Page 74 of 222

Page 75 of 222

Page 76 of 222

Page 77 of 222
Page 78 of 222

Page 79 of 222

Page 80 of 222

Page 81 of 222
Page 82 of 222

Page 83 of 222
Adolescent HealthState Action Plan Table
Page 84 of 222

Page 85 of 222

State Priority Needs
Objectives Strategies National Outcome Measures National Performance Measures ESMs SPMs
Empower adolescents to adopt healthy behaviors
By 2020,increase thepercent ofadolescents witha past-yearpreventivemedical visit byat least 5%(2020 obj. =93.1%)
Promote adoption ofschool-basedprograms that aimto preventsubstance use,violence, and otherrisky behaviors.Expand support forand coordination ofschool-based healthcenters. Promotehealthy sexualchoices andbehaviors foradolescents throughprimary preventionand healtheducationprograms. Supportpregnant andparenting teens toprevent subsequentpregnancies andencourageachievement ofeducational goals.Work with school-based healthcenters to assurethat adolescents arereceivingappropriate riskscreenings andeducation onhealthy lifestyles.
Adolescent mortality rate ages 10 through 19 per 100,000Adolescent motor vehicle mortality rate, ages 15 through 19 per 100,000 Adolescent suicide rate, ages 15 through 19 per 100,000Percent of children with a mental/behavioral condition who receive treatment or counselingPercent of children in excellent or very good healthPercent of children and adolescents who are overweight or obese (BMI at or above the 85th percentile)Percent of children 6 months through 17 years who are vaccinated annually against seasonal influenzaPercent of adolescents, ages 13 through 17, who have received at least one dose of the HPV vaccinePercent of adolescents, ages 13 through 17, who have received at least one dose of the Tdap vaccinePercent of adolescents, ages 13 through 17, who have received at least one dose of the meningococcal conjugate vaccine
Percent of adolescents, ages 12 through 17, with a preventive medical visit in the past year.
Page 86 of 222

Page 87 of 222

Adolescent Health - Plan for the Application Year
Assure appropriate transition planning and services for adolescents and young adults, including youth with special health care needs
Page 88 of 222

Page 89 of 222

Adolescent Health - Annual Report
2016 2017 2018 2019 2020Annual Objective 89.5 90.3 91.2 92.1 93.1
Annual Objectives
NPM 10 - Percent of adolescents, ages 12 through 17, with a preventive medical visit in the past year.
Page 90 of 222

Page 91 of 222

Page 92 of 222

Page 93 of 222

Children with Special Health Care NeedsState Action Plan Table
Page 94 of 222

Page 95 of 222

State Priority Needs
Objectives Strategies National Outcome Measures National Performance Measures ESMs SPMs
Facilitate the integration of services within patient-centered medical homes for all children, particularly for children with special healthcare needs
By 2020,increase thepercent ofchildren withspecialhealthcareneeds receivingcare in a medicalhome by at least10% (2020 obj. =51.0%)
Collaborate withICAAP and HFS tocontinue to promotedevelopment ofmedical homes forall children,especially forCYSHCN, throughwebsite links withthe AAP NationalMedical Homewebsite forresources forpractices. AssistMedical Homeproviders to connectfamilies tocommunityresources throughDSCC regionaloffice staffs. Workwith F2F, FamilyAdvisory Counciland DSCC carecoordinators todevelop and/orreviewcommunication toolsre: medical home forfamilies. UtilizeDSCC website topost informationabout the benefits ofhaving a medicalhome. Post items onFaceBook page topromote medicalhomes and initiateconversations aboutwhat makes a goodmedical home.
Percent of children with special health care needs (CSHCN) receiving care in a well-functioning systemPercent of children in excellent or very good healthPercent of children ages 19 through 35 months, who have received the 4:3:1:3(4):3:1:4 series of routine vaccinationsPercent of children 6 months through 17 years who are vaccinated annually against seasonal influenzaPercent of adolescents, ages 13 through 17, who have received at least one dose of the HPV vaccinePercent of adolescents, ages 13 through 17, who have received at least one dose of the Tdap vaccinePercent of adolescents, ages 13 through 17, who have received at least one dose of the meningococcal conjugate vaccine
Percent of children with and without special health care needs having a medical home
Page 96 of 222

Page 97 of 222

Assure appropriate transition planning and services for adolescents and young adults, including youth with special health care needs
By 2020,increase thepercent of youthwith specialhealthcareneeds whoreceivedcomprehensivetransitionplanningservices by atleast 10% (2020obj. = 49.8%)
Continue to co-sponsor the annualTransitionConference,includingparticipation on theplanning committeeand supportingDSCC youth andtheir families toattend. MaintainTransition Tips andTools materials thatsupport transitionplanning on DSCCwebsite. Posttransitionopportunities onFaceBook. Providetraining updates onTransition to DSCCcare coordinators.Providepresentations onTransition tocommunity groups.Continuecoordination/collaboration efforts withEarly Intervention,Home Visiting, localhealth departments,provider groups,HFS, MedicaidMCOs, F2F, andother communitygroups to addresssystem barriers.Continue ActionLearningCollaborative teamefforts to implementthe NationalStandards forSystems of Care forCYSHCN.
Percent of children with special health care needs (CSHCN) receiving care in a well-functioning systemPercent of children in excellent or very good health
Percent of adolescents with and without special health care needs who received services necessary to make transitions to adult health care
Page 98 of 222

Page 99 of 222

Children with Special Health Care Needs - Plan for the Application Year
Page 100 of 222

Page 101 of 222

Children with Special Health Care Needs - Annual Report
2016 2017 2018 2019 2020Annual Objective 47.2 48.1 49 50 51
Annual Objectives
NPM 11 - Percent of children with and without special health care needs having a medical home
2016 2017 2018 2019 2020Annual Objective 46.2 47.1 48 48.9 49.8
Annual Objectives
NPM 12 - Percent of adolescents with and without special health care needs who received services necessary to make transitions toadult health care
Page 102 of 222

Page 103 of 222

Page 104 of 222

Page 105 of 222

Page 106 of 222

Page 107 of 222

Page 108 of 222

Page 109 of 222

Cross-Cutting/Life CourseState Action Plan Table
Page 110 of 222

Page 111 of 222
State Priority Needs
Objectives Strategies National Outcome Measures National Performance Measures ESMs SPMs
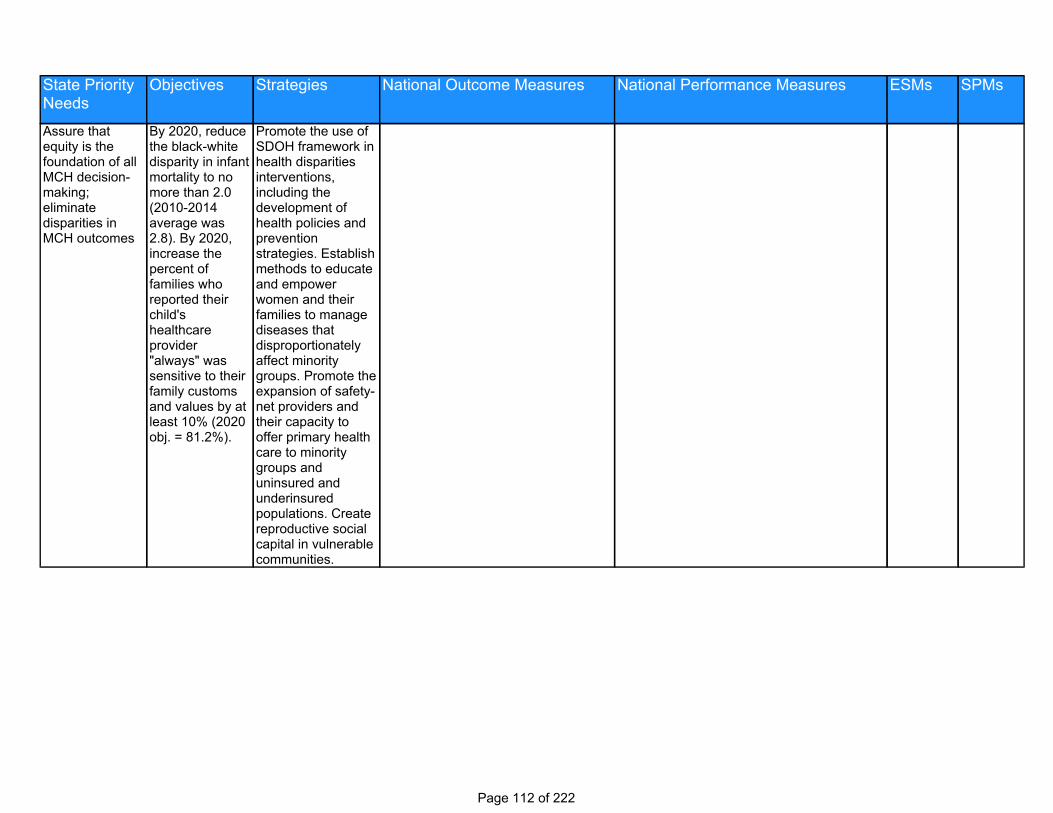
Assure that equity is the foundation of all MCH decision-making; eliminate disparities in MCH outcomes
By 2020, reducethe black-whitedisparity in infantmortality to nomore than 2.0(2010-2014average was2.8). By 2020,increase thepercent offamilies whoreported theirchild'shealthcareprovider"always" wassensitive to theirfamily customsand values by atleast 10% (2020obj. = 81.2%).
Promote the use ofSDOH framework inhealth disparitiesinterventions,including thedevelopment ofhealth policies andpreventionstrategies. Establishmethods to educateand empowerwomen and theirfamilies to managediseases thatdisproportionatelyaffect minoritygroups. Promote theexpansion of safety-net providers andtheir capacity tooffer primary healthcare to minoritygroups anduninsured andunderinsuredpopulations. Createreproductive socialcapital in vulnerablecommunities.
Page 112 of 222

Page 113 of 222

Partner with consumers, families and communities in decision-making across MCH programs, systems and policies
By 2020,increase thepercent ofchildrenreceiving family-centered care byat least 10%(2020 obj. =74.4%) By 2016,develop a stateperformancemeasure and 5-yearperformanceobjectivesrelated to thispriority.
Enhancecoordination andintegration of familysupport services.Educate providersto encourage familypartnership indecision makingand family-centeredcare within pediatricmedical homes.Invest in communitybuilding and urbanrenewal. Strengthenfather involvement,especially in African-American families.Support theimplementation andmaintenance ofFamily Councilscontaining a cross-representation ofconsumers fromeach of the State'sgeographic regionsand the MCHdomains.
Page 114 of 222

Page 115 of 222

Strengthen the MCH capacity for data collection, linkage, analysis, and dissemination; Improve MCH data systems and infrastructure
By 2016,implement arequestprocess/systemto organize dataand analysisrequests. By2017, completethe linkage ofbirth and infantdeath certificatesto allow fordetailed analysisof infantmortality. By2016, develop astateperformancemeasure and 5-yearperformanceobjectivesrelated to thispriority.
Support andfacilitate datalinkages acrossadministrative,programmatic, andsurveillancedatabases. Increasestaff capacity fordata management,analysis andtranslation throughtraining andworkforcedevelopment.Implement astandardized datarequest system tomanage andorganize internaland external datarequests. Forgepartnerships withother divisions,offices,departments, andorganizations thatwill increase theavailability ofrelevant and timelyMCH data for Title Vstaff.
Page 116 of 222

Page 117 of 222

Support expanded access to and integration of mental health services and systems for the MCH population.
By 2016,develop a stateperformancemeasure and 5-yearperformanceobjectivesrelated to thispriority.
Encourage andsupport routinepsychosocialassessment inhealthcare and inMCH services.Support the creationand distribution ofscreening tools toidentify individualsin need of servicesand the capacity toreceive suchservices. Improvescreening forperinatal depressionduring well-woman,prenatal, and well-child care. Requiredcontracted providersto receive trainingon trauma-informedcare andMotivationalInterviewing.
Page 118 of 222

Page 119 of 222

By 2020,increase thepercent ofpregnancywomen whoreceive dentalservices duringpregnancy by atleast 20% (2020obj. = 57.0%).By 2020,increase thepercent ofchildren ages 1-17 who receivedat least onepreventivedental visit in thepast year by atleast 5% (2020obj. = 84.8%).
See also priorityaction plans foradverse birthoutcome priority("perinatal health")and medical homefor children ("childhealth"). Developand implement CMEtraining to educateobstetricians,dentists, and otherwell-womanproviders on theassociation of poormaternal oral healthand preterm/lowbirth weight andearly childhoodcaries. Identifyopportunities to linkchildren's medicalhomes to dentalhomes and supportintegration of care.
Percent of children ages 1 through 17 who have decayed teeth or cavities in the past 12 monthsPercent of children in excellent or very good health
A) Percent of women who had a dental visit during pregnancy and B) Percent of children, ages 1 through 17 who had a preventive dental visit in the past year
Page 120 of 222

Page 121 of 222

By 2020,decrease thepercent ofwomen whosmoke duringpregnancy by atleast 15% (2020obj. = 5.6%). By2020, decreasethe percent ofchildren exposedto environmentaltobacco smokein the home byat least 15%(2020 obj. =17.9%).
Identify local andregional risk factorsfor prenatal tobaccothrough analysis ofbirth outcomes data.Create andimplement local andregional preventionstrategies aimed atpreventing adversebirth outcomesbased on riskidentification. Linkback to priorities onreducing adversebirth outcomes(Perinatal/Infanthealth domain) andmedical home forchildren (ChildHealth/CSHCNdomains).
Rate of severe maternal morbidity per 10,000 delivery hospitalizationsMaternal mortality rate per 100,000 live birthsPercent of low birth weight deliveries (<2,500 grams)Percent of very low birth weight deliveries (<1,500 grams)Percent of moderately low birth weight deliveries (1,500-2,499 grams)Percent of preterm births (<37 weeks)Percent of early preterm births (<34 weeks)Percent of late preterm births (34-36 weeks)Percent of early term births (37, 38 weeks)Perinatal mortality rate per 1,000 live births plus fetal deathsInfant mortality rate per 1,000 live birthsNeonatal mortality rate per 1,000 live birthsPost neonatal mortality rate per 1,000 live birthsPreterm-related mortality rate per 100,000 live birthsSleep-related Sudden Unexpected Infant Death (SUID) rate per 100,000 live birthsPercent of children in excellent or very good health
A) Percent of women who smoke during pregnancy and B) Percent of children who live in households where someone smokes
Page 122 of 222

Page 123 of 222

Cross-Cutting/Life Course - Plan for the Application Year
Cross-Cutting/Life Course - Annual Report
Page 124 of 222

Page 125 of 222

2016 2017 2018 2019 2020Annual Objective 49.4 51.3 53.2 55.1 57Annual Objective 81.6 82.4 83.2 84 84.8
Annual Objectives
NPM 13 - A) Percent of women who had a dental visit during pregnancy and B) Percent of children, ages 1 through 17 who had apreventive dental visit in the past year
2016 2017 2018 2019 2020Annual Objective 6.8 6.5 6.2 5.9 5.6Annual Objective 20.4 19.8 19.2 18.6 17.9
Annual Objectives
NPM 14 - A) Percent of women who smoke during pregnancy and B) Percent of children who live in households where someone smokes
Page 126 of 222

Page 127 of 222

Page 128 of 222

Page 129 of 222

Other Programmatic Activities
Page 130 of 222

Page 131 of 222
Page 132 of 222

Page 133 of 222

Page 134 of 222

Page 135 of 222

Page 136 of 222

Page 137 of 222

II.F.2 MCH Workforce Development and Capacity
II.F.3. Family Consumer Partnership
Page 138 of 222
Page 139 of 222

Page 140 of 222

Page 141 of 222

Page 142 of 222
II.F.4. Health Reform
Page 143 of 222
II.F.5. Emerging Issues
Page 144 of 222

II.F.6. Public Input
Page 145 of 222

II.F.7. Technical Assistance
Page 146 of 222

III. Budget Narrative
2012 2013 2014
Budgeted Expended Budgeted Expended Budgeted Expended
$21,700,000
$0
$27,261,867
$0
$234,159,608
$8,000,000
$291,121,475
$416,111,558
$707,233,033
$21,700,000
$0
$27,261,867
$0
$234,159,608
$8,000,000
$416,111,558
$291,121,475
$707,233,033
Federal Allocation
Unobligated Balance
State Funds
Local Funds
Other Funds
Program Funds
SubTotal
Other Federal Funds
Total
$21,700,000
$0
$27,260,000
$0
$234,159,600
$7,760,000
$290,879,600
$416,111,558
$706,991,158
$20,161,097
$0
$27,260,000
$0
$234,159,600
$7,760,000
$416,111,558
$289,340,697
$705,452,255
$21,700,000
$0
$27,260,000
$0
$234,159,600
$7,760,000
$290,879,600
$423,189,908
$714,069,508
$0
$18,734,500
$0
$0
$0
$0
$0
$18,734,500
$0
$18,734,500
Federal Allocation
Unobligated Balance
State Funds
Local Funds
Other Funds
Program Funds
SubTotal
Other Federal Funds
Total
$20,911,675
$0
$27,260,000
$0
$234,159,600
$6,392,507
$288,723,782
$409,665,976
$698,389,758
2015 2016
Budgeted Expended Budgeted Expended
Page 147 of 222

III.A. Expenditures
III.B. Budget
Page 148 of 222

IV. Title V-Medicaid IAA/MOU
The Title V-Medicaid IAA/MOU is uploaded as a PDF file to this section - Title V IGA with attachment (final) - signed by HFSand DPH.pdf
Page 149 of 222

V. Supporting Documents
The following supporting documents have been provided to supplement the narrative discussion.
Supporting Document #01 - IL Title V 2015 Databook FINAL.pdf
Page 150 of 222

Page 151 of 222
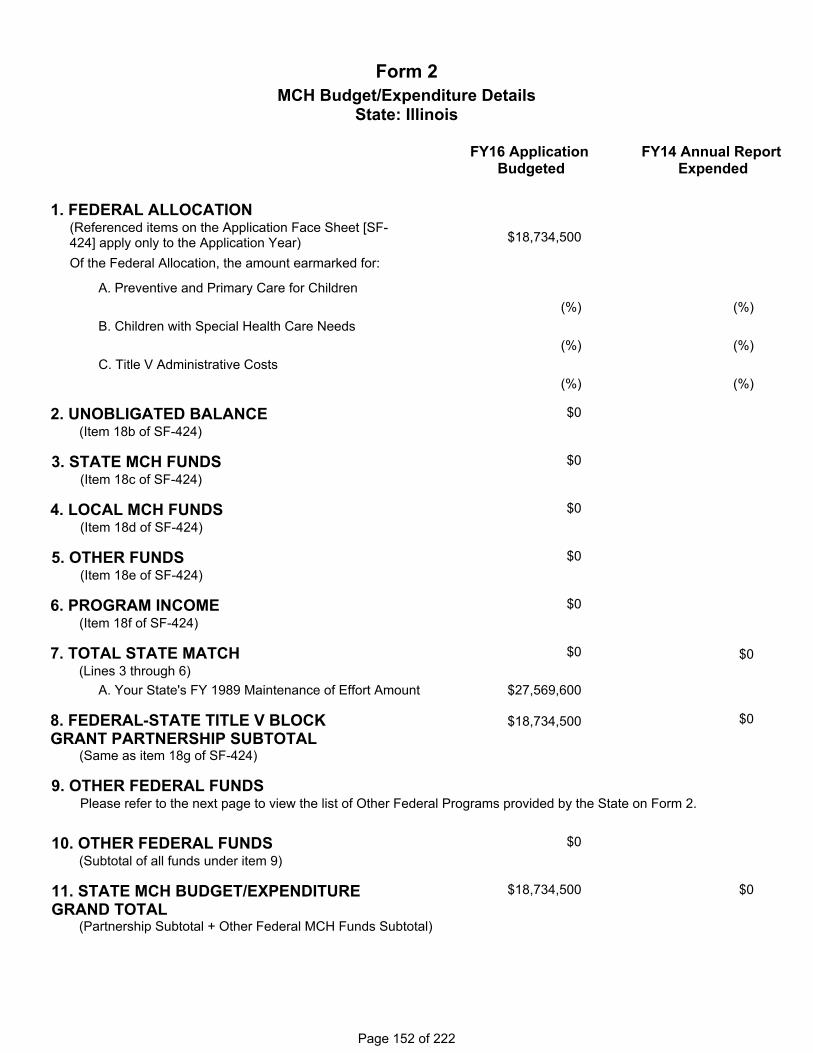
Form 2MCH Budget/Expenditure Details
State: Illinois
FY16 ApplicationBudgeted
FY14 Annual ReportExpended
1. FEDERAL ALLOCATION(Referenced items on the Application Face Sheet [SF-424] apply only to the Application Year) Of the Federal Allocation, the amount earmarked for:
A. Preventive and Primary Care for Children
B. Children with Special Health Care Needs
C. Title V Administrative Costs
2. UNOBLIGATED BALANCE(Item 18b of SF-424)
(Item 18c of SF-424)3. STATE MCH FUNDS
4. LOCAL MCH FUNDS(Item 18d of SF-424)
(Item 18e of SF-424)5. OTHER FUNDS
6. PROGRAM INCOME(Item 18f of SF-424)
(Lines 3 through 6)7. TOTAL STATE MATCH
A. Your State's FY 1989 Maintenance of Effort Amount
8. FEDERAL-STATE TITLE V BLOCKGRANT PARTNERSHIP SUBTOTAL
(Same as item 18g of SF-424)
$18,734,500
$0
$0
$0
$0
$0
$0
$18,734,500
$0
$0
9. OTHER FEDERAL FUNDS
10. OTHER FEDERAL FUNDS(Subtotal of all funds under item 9)
(Partnership Subtotal + Other Federal MCH Funds Subtotal)
11. STATE MCH BUDGET/EXPENDITUREGRAND TOTAL
$18,734,500 $0
$27,569,600
$0
(%)
(%)
(%)
(%)
(%)
(%)
Please refer to the next page to view the list of Other Federal Programs provided by the State on Form 2.
Page 152 of 222

9. OTHER FEDERAL FUNDSNo Other Federal Programs were provided by the State on Form 2 Line 9.
FY14 Annual Report Budgeted
1. FEDERAL ALLOCATION $21,700,000
A. Preventive and Primary Care for Children $8,000,000
B. Children with Special Health Care Needs $6,510,000
C. Title V Administrative Costs $800,000
2. UNOBLIGATED BALANCE $0
3. STATE MCH FUNDS $27,260,000
4. LOCAL MCH FUNDS $0
5. OTHER FUNDS $234,159,600
6. PROGRAM INCOME $7,760,000
7. TOTAL STATE MATCH $269,179,600
Page 153 of 222

NoneForm Notes For Form 2:
Data Alerts for Form 2:
The value in Line 1, Federal Allocation, Annual Report Expended is greater or less than 10% of the Annual Report Budgeted. Please correct or add a field level note indicating the reason for the discrepancy.
1 .
The value in Line 1A, Preventive And Primary Care Expended, Annual Report Expended is greater or less than 10% of the Annual Report Budgeted. Please correct or add a field level note indicating the reason for the discrepancy.
2 .
The value in Line 1B, Children with Special Health Care Needs, Annual Report Expended is greater or less than 10% of the Annual Report Budgeted. Please correct or add a field level note indicating the reason for the discrepancy.
3 .
The value in Line 1C, Title V Administrative Costs, Annual Report Expended is greater or less than 10% of the Annual Report Budgeted. Please add a field level note indicating the reason for the discrepancy.
4 .
The value in Line 3, State MCH Funds, Annual Report Expended is greater or less than 10% of the Annual Report Budgeted. Please add a field level note indicating the reason for the discrepancy.
5 .
The value in Line 5, Other Funds, Annual Report Expended is greater or less than 10% of the Annual Report Budgeted. Please add a field level note indicating the reason for the discrepancy.
6 .
The value in Line 6, Program Income, Annual Report Expended is greater or less than 10% of the Annual Report Budgeted. Please add a field level note indicating the reason for the discrepancy.
7 .
The value in Line 7, Total State Match, Annual Report Expended is less than State’s 1989 Maintenance of Effort Amount. Please add a field level note indicating the reason for the discrepancy.
8 .
Page 154 of 222

State: IllinoisBudget and Expenditure Details by Types of Individuals Served
Form 3a
I. TYPES OF INDIVIDUALS SERVED
1. Pregnant Women
FY14 AnnualReport Expended
FY16 ApplicationBudgeted
4. CSHCN
3. Children 1-22 years
2. Infants < 1 year
IA. Federal MCH Block Grant
5. All Others
$0 $0Federal Total of Individuals Served
Non Federal Total of Individuals Served $0$0
IB. Non Federal MCH Block Grant
2. Infants < 1 year
3. Children 1-22 years
4. CSHCN
1. Pregnant Women
5. All Others
$0 $0Federal State MCH Block Grant Partnership Total
Page 155 of 222

Form Notes for Form 3a:
None
Data Alert for Form 3a:
None
Page 156 of 222

Page 157 of 222

Form 3bBudget and Expenditure Details by Types of Services
State: Illinois
FY16 ApplicationBudgeted
FY14 AnnualReport Expended
I. TYPES OF SERVICESIIA. Federal MCH BlockGrant
A. Preventive and Primary Care Services for allPregnant Women, Mothers, and Infants up to AgeOne
B. Preventive and Primary Care Services forChildren
C. Services for CSHCN
1. Direct Services
2. Enabling Services
3. Public Health Services and Systems
4. Select the types of Federally-supported "Direct Services", as reported in II.A.1. Provide thetotal amount of Federal MCH Block Grant funds expended for each type of reported service
Hospital Charges (Includes Inpatient and OutpatientServices)
Physician/Office Services
Pharmacy
Dental Care (Does Not Include OrthodonticServices)
Durable Medical Equipment and Supplies
Laboratory Services
$0Direct Services Total
Federal Total
Page 158 of 222
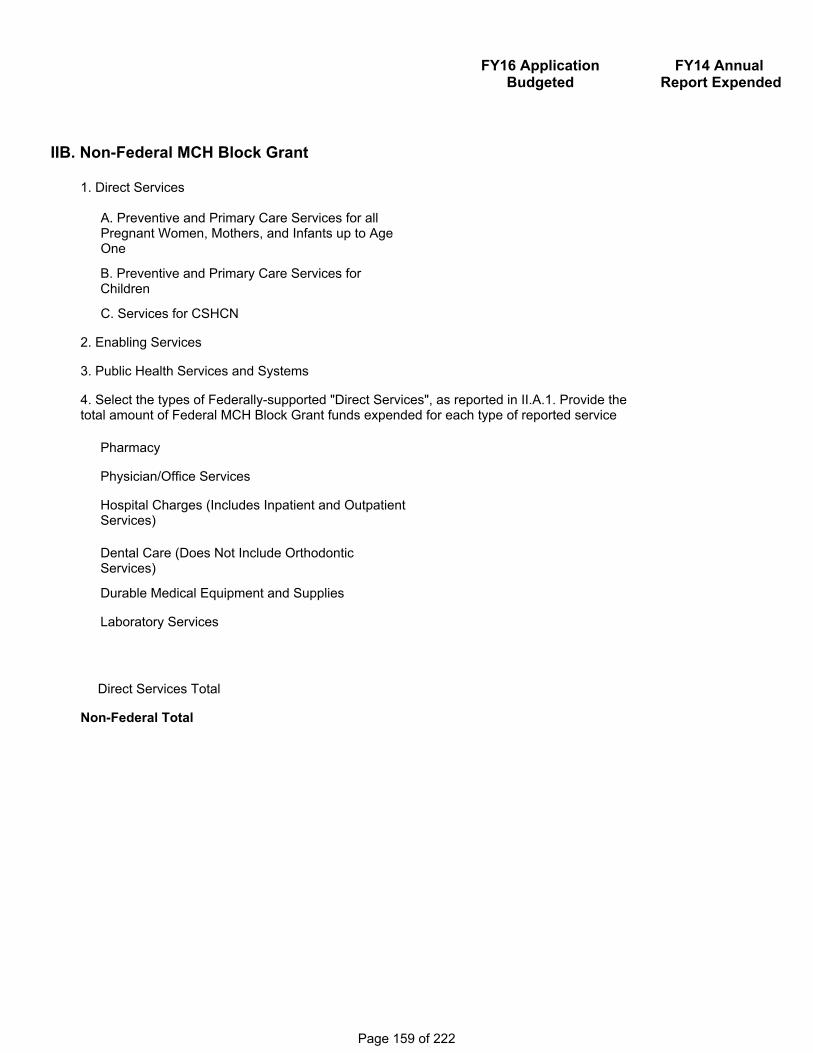
IIB. Non-Federal MCH Block Grant
Non-Federal Total
Direct Services Total
Laboratory Services
Durable Medical Equipment and Supplies
Dental Care (Does Not Include OrthodonticServices)
Pharmacy
Physician/Office Services
Hospital Charges (Includes Inpatient and OutpatientServices)
4. Select the types of Federally-supported "Direct Services", as reported in II.A.1. Provide thetotal amount of Federal MCH Block Grant funds expended for each type of reported service
3. Public Health Services and Systems
2. Enabling Services
1. Direct Services
C. Services for CSHCN
B. Preventive and Primary Care Services forChildren
A. Preventive and Primary Care Services for allPregnant Women, Mothers, and Infants up to AgeOne
FY16 ApplicationBudgeted
FY14 AnnualReport Expended
Page 159 of 222

Form Notes for Form 3b:
None
Field Level Notes for Form 3b:
Page 160 of 222

Form 4
State: IllinoisNumber and Percentage of Newborns and Others Screened, Cases Confirmed and Treated
Total Births by Occurrence 154,803
1a. Core RUSP Conditions
Program Name (A)Number Receiving at Least One Screen
(B)Number Presumptive Positive Screens
(C)Number Confirmed Cases
(D)Number Referred for Treatment
Propionic acidemia 153,233 55 0 0
Methylmalonic acidemia (methylmalonyl-CoA mutase)
153,233 54 1 1
Methylmalonic acidemia (cobalamin disorders)
153,233 54 1 1
3-Methylcrotonyl-CoA carboxylase deficiency
153,233 100 4 4
3-Hydroxy-3-methyglutaric aciduria 153,233 100 0 0
Holocarboxylase synthase deficiency 153,233 0 0 0
ß-Ketothiolase deficiency 153,233 3 2 2
Glutaric acidemia type I 153,233 69 0 0
Carnitine uptake defect/carnitine transport defect
153,233 338 2 2
Medium-chain acyl-CoA dehydrogenase deficiency
153,233 83 5 5
Very long-chain acyl-CoA dehydrogenase deficiency
153,233 53 4 4
Long-chain L-3 hydroxyacyl-CoA dehydrogenase deficiency
153,233 11 0 0
Trifunctional protein deficiency 153,233 10 0 0
Argininosuccinic aciduria 153,233 62 3 3
Page 161 of 222

Citrullinemia, type I 153,233 62 0 0
Maple syrup urine disease 153,233 33 1 1
Homocystinuria 153,233 138 0 0
Classic phenylketonuria 153,233 72 11 11
Tyrosinemia, type I 153,233 211 0 0
Primary congenital hypothyroidism 153,233 225 105 105
Congenital adrenal hyperplasia 153,233 405 9 9
S,S disease (Sickle cell anemia) 153,233 67 47 47
S, βeta-thalassemia 153,233 7 3 3
S,C disease 153,233 34 24 24
Biotinidase deficiency 153,233 9 1 1
Cystic fibrosis 153,233 679 41 41
Severe combined immunodeficiences 153,233 889 3 3
Classic galactosemia 153,233 277 18 18
Isovaleric acidemia 153,233 65 0 0
Program Name (A)Number Receiving at Least One Screen
(B)Number Presumptive Positive Screens
(C)Number Confirmed Cases
(D)Number Referred for Treatment
Methylmalonic acidemia with homocystinuria
153,233 54 0 0
Malonic acidemia 153,233 20 0 0
1b. Secondary RUSP Conditions
Page 162 of 222

Isobutyrylglycinuria 153,233 0 0 0
2-Methylbutyrylglycinuria 153,233 0 0 0
3-Methylglutaconic aciduria 153,233 0 0 0
2-Methyl-3-hydroxybutyric aciduria 153,233 0 0 0
Short-chain acyl-CoA dehydrogenase deficiency
153,233 190 11 11
Medium/short-chain L-3-hydroxyacl-CoA dehydrogenase deficiency
153,233 17 0 0
Glutaric acidemia type II 153,233 5 1 1
Medium-chain ketoacyl-CoA thiolase deficiency
153,233 5 0 0
2,4 Dienoyl-CoA reductase deficiency 153,233 14 0 0
Carnitine palmitoyltransferase type I deficiency
153,233 24 0 0
Carnitine acylcarnitine translocase deficiency
153,233 91 0 0
Carnitine palmitoyltransferase type II deficiency
153,233 90 0 0
Argininemia 153,233 12 0 0
Citrullinemia, type II 153,233 0 0 0
Hypermethioninemia 153,233 0 0 0
Benign hyperphenylalaninemia 153,233 0 0 0
Biopterin defect in cofactor biosynthesis
153,233 0 0 0
Biopterin defect in cofactor regeneration
153,233 0 0 0
Tyrosinemia, type II 153,233 0 0 0
Tyrosinemia, type III 153,233 0 0 0
Page 163 of 222

Various other hemoglobinopathies 153,233 43 16 16
Galactoepimerase deficiency 153,233 0 2 2
Galactokinase deficiency 153,233 0 0 0
T-cell related lymphocyte deficiencies 153,233 0 7 7
Program Name (A)Number Receiving at Least One Screen
(B)Number Presumptive Positive Screens
(C)Number Confirmed Cases
(D)Number Referred for Treatment
Newborn Hearing 149,912 5,086 152 152
2. Other Newborn Screening Tests
3. Screening Programs for Older Children & Women
4. Long-Term Follow-Up
For those newborns diagnosed through blood spot screening, they are followed annually through fifteen years of age with staff ofthe Newborn Screening Program contacting the pediatric sub-specialist to verify compliance with treatment and to monitor growthand developmental milestones. If needed, cases are referred to a local public health nurse to provide family assistance. Currentlyno screening data or reports of diagnosed cases of newborns with a critical congenital heart defect are reported to the NewbornScreening Program, however families of all newborns with such a diagnosis are reported to the birth defects registry, whichprovides periodic follow-up by a public health nurse, through two years of age. All newborns identified with a hearing loss arereferred to early intervention services and to the state Children with Special Health Care Needs Program which provide ongoingfollow-up services.
Program Name (A)Number Receiving at Least One Screen
(B)Number Presumptive Positive Screens
(C)Number Confirmed Cases
(D)Number Referred for Treatment
Page 164 of 222

NoneForm Notes for Form 4:
Field Level Notes for Form 4:
Page 165 of 222
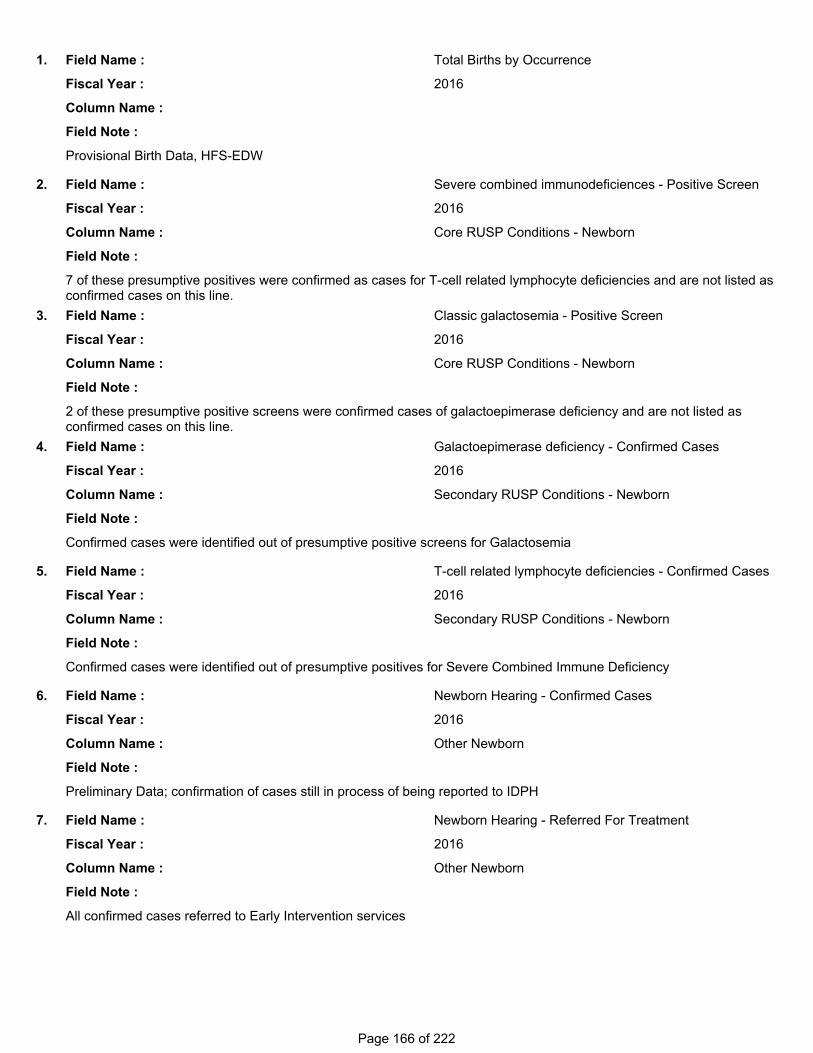
Field Name : Total Births by Occurrence
Fiscal Year : 2016
Column Name :
Field Note :
Provisional Birth Data, HFS-EDW
1.
Field Name : Severe combined immunodeficiences - Positive Screen
Fiscal Year : 2016
Column Name : Core RUSP Conditions - Newborn
Field Note :
7 of these presumptive positives were confirmed as cases for T-cell related lymphocyte deficiencies and are not listed as confirmed cases on this line.
2.
Field Name : Classic galactosemia - Positive Screen
Fiscal Year : 2016
Column Name : Core RUSP Conditions - Newborn
Field Note :
2 of these presumptive positive screens were confirmed cases of galactoepimerase deficiency and are not listed as confirmed cases on this line.
3.
Field Name : Galactoepimerase deficiency - Confirmed Cases
Fiscal Year : 2016
Column Name : Secondary RUSP Conditions - Newborn
Field Note :
Confirmed cases were identified out of presumptive positive screens for Galactosemia
4.
Field Name : T-cell related lymphocyte deficiencies - Confirmed Cases
Fiscal Year : 2016
Column Name : Secondary RUSP Conditions - Newborn
Field Note :
Confirmed cases were identified out of presumptive positives for Severe Combined Immune Deficiency
5.
Field Name : Newborn Hearing - Confirmed Cases
Fiscal Year : 2016
Column Name : Other Newborn
Field Note :
Preliminary Data; confirmation of cases still in process of being reported to IDPH
6.
Field Name : Newborn Hearing - Referred For Treatment
Fiscal Year : 2016
Column Name : Other Newborn
Field Note :
All confirmed cases referred to Early Intervention services
7.
Page 166 of 222

State: IllinoisUnduplicated Count of Individuals Served under Title V
Form 5a
Primary Source of Coverage
Types of Individuals Served (A)
Title V Total Served
(B)Title XIX %
(C)Title XXI %
(D)Private/Other %
(E)None %
(F)Unknown %
1. Pregnant Women
2. Infants <1 year of Age
3. Children 1 to 22 Years of Age
4. Children with Special Health Care Needs
5. Others
Total
Reporting Year 2014
Page 167 of 222

Form Notes for Form 5a:None
Field Level Notes for Form 5a:
An error has occurred while processing Report 'Form5b':An error occurred while invoking data retrieval method.------------- InnerException -------------Exception has been thrown by the target of an invocation.------------- InnerException -------------Object reference not set to an instance of an object.
Page 168 of 222
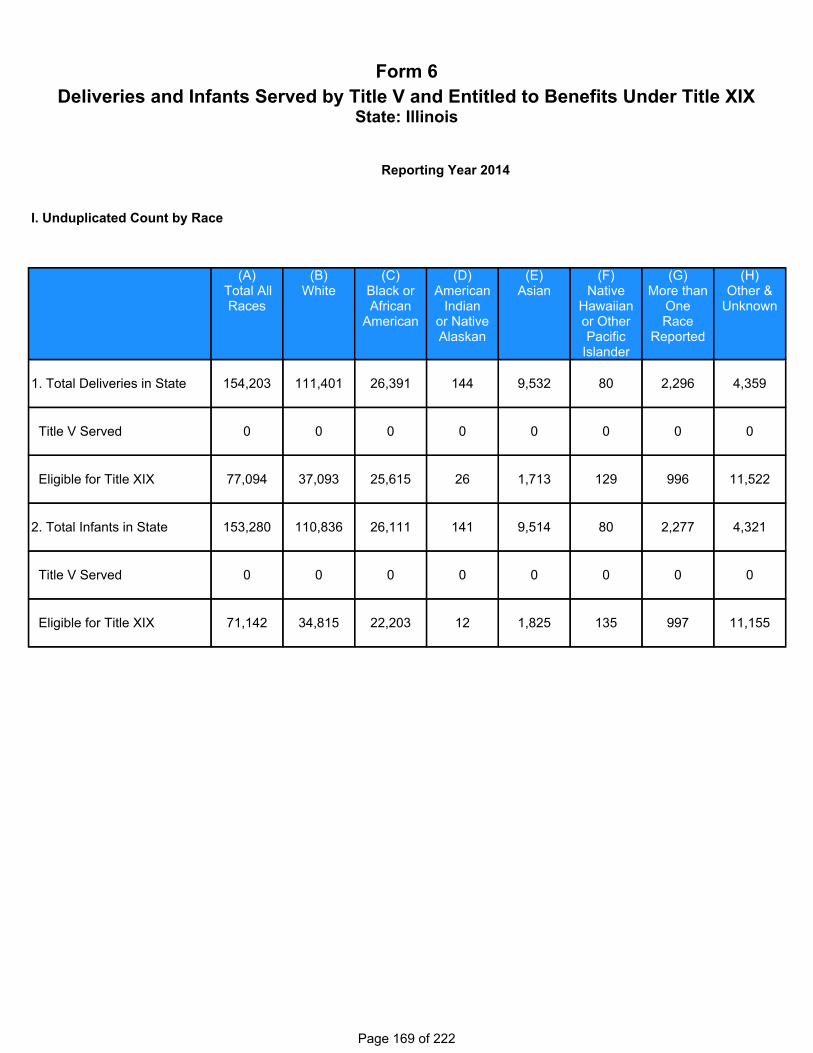
State: IllinoisDeliveries and Infants Served by Title V and Entitled to Benefits Under Title XIX
Form 6
I. Unduplicated Count by Race
(A)Total All Races
(B)White
(C)Black or African
American
(D)American
Indianor Native Alaskan
(E)Asian
(F)Native
Hawaiianor Other Pacific
Islander
(G)More than
OneRace
Reported
(H)Other &
Unknown
1. Total Deliveries in State 154,203 111,401 26,391 144 9,532 80 2,296 4,359
Title V Served 0 0 0 0 0 0 0 0
Eligible for Title XIX 77,094 37,093 25,615 26 1,713 129 996 11,522
2. Total Infants in State 153,280 110,836 26,111 141 9,514 80 2,277 4,321
Title V Served 0 0 0 0 0 0 0 0
Eligible for Title XIX 71,142 34,815 22,203 12 1,825 135 997 11,155
Reporting Year 2014
Page 169 of 222

(A)Total Not
Hispanic or Latino
(B)Total Hispanic
or Latino
(C)Ethnicity Not
Reported
(D)Total All
Ethnicities
1. Total Deliveries in State 119,312 33,682 1,209 154,203
Title V Served 0 0 0 0
Eligible for Title XIX 54,833 15,142 7,119 77,094
2. Total Infants in State 118,601 33,488 1,191 153,280
Title V Served 0 0 0 0
Eligible for Title XIX 49,907 14,898 6,337 71,142
II. Unduplicated Count by Ethnicity
Page 170 of 222

Form Notes for Form 6:
None
Field Level Notes for Form 6:
Field Name : 1. Total Deliveries in State
Fiscal Year : 2016
Column Name : Total All Races
Field Note :
Deliveries = 2014 birth data (provisional) + 2013 fetal death data (final)2014 fetal death data not yet available, so 2013 used as estimateIncludes only IL occurrences to IL residents
1.
Field Name : 2. Total Infants in State
Fiscal Year : 2016
Column Name : Total All Races
Field Note :
Deliveries = 2014 birth data (provisional) Includes only IL occurrences to IL residents
2.
Page 171 of 222

Form 7
State: IllinoisState MCH Toll-Free Telephone Line and Other Appropriate Methods Data
Application Year2016
2. State MCH Toll-Free "Hotline" Name
3. Name of Contact Person for State MCH"Hotline"
4. Contact Person's Telephone Number
(888) 522-1282
Women's Health Line
Donna Lindemulder
(217) 524-0851
(888) 522-1282
Women's Health Line
Donna Lindemulder
(217) 524-0851
A. State MCH Toll-Free Telephone Lines
Reporting Year2014
1. State MCH Toll-Free "Hotline" TelephoneNumber
4,5725. Number of Calls Received on the State MCH"Hotline"
5. State Title V Social Media Websites http//www.facebook.com/dscc.uic.edu
CSHCN Facebook
1. Other Toll-Free "Hotline" Names
37,624
www.dscc.uic.edu
14,481
CSCHN - DSCC Hotline
http://www.dscc.uic.edu
CSHCN- DSCC Hotline
4. Number of Hits to the State Title V ProgramWebsite
3. State Title V Program Website Address
2. Number of Calls on Other Toll-Free "Hotlines"
B. Other Appropriate Methods
2,3676. Number of Hits to the State Title V Program SocialMedia Websites
Page 172 of 222

NoneForm Notes for Form 7:
Page 173 of 222

Form 8State MCH and CSHCN Directors Contact Information
State: Illinois
1. Title V Maternal and Child Health (MCH) Director
City / State / Zip Code
Name
Application Year 2016
Address 2
Address 1
Title
2. Title V Children with Special Health Care Needs(CSHCN) Director
Telephone
Telephone
Title
Address 1
Address 2
Name
City / State / Zip Code
City / State / Zip Code
Name
Address 2
Address 1
Title
Telephone
3. State Family or Youth Leader (Optional)
Page 174 of 222

Form Notes for Form 8:None
Page 175 of 222

State: IllinoisList of MCH Priority Needs
Form 9
Application Year 2016
Priority Need Priority Need Type (New, Replaced or Continued Priority Need for this five-year reporting period)
Rationale if priority need does not have a corresponding State or National Performance/Outcome Measure
1 . Assure accessibility, availability and quality of preventive and primary care for all women, particularly for women of reproductive age
Replaced
2 . Support healthy pregnancies and improve birth outcomes
Continued
3 . Support expanded access to and integration of early childhood services and systems
New
4 . Facilitate the integration of services within patient-centered medical homes for all children, particularly for children with special healthcare needs
Continued
5 . Empower adolescents to adopt healthy behaviors
New
6 . Assure appropriate transition planning and services for adolescents and young adults, including youth with special health care needs
Replaced
7 . Assure that equity is the foundation of all MCH decision-making; eliminate disparities in MCH outcomes
New
8 . Support expanded access to and integration of mental health services and systems for the MCH population.
Continued
9 . Partner with consumers, families and communities in decision-making across MCH programs, systems and policies
New The need for consumer, family, and consumer engagement repeatedly emerged during the 2015 needs assessment. Illinois Title V wants to ensure that such groups are viewed as partners at all-levels of decision-making -- spanning from interactions occurring during healthcare services up to the state-level program/policy planning process.
10 . Strengthen the MCH capacity for data collection, linkage, analysis, and dissemination; Improve MCH data systems and infrastructure
Continued High-quality data and sound science should be the foundation for public health decision-making. Illinois Title V has historically had many challenges related to data capacity and infrastructure. While many large gains have occurred during the last several years, there is still much room for improvement. Continuing this priority will keep the development of data capacity and infrastructure as a major focus for Title V in the coming years.
Page 176 of 222

Form Notes for Form 9:None
Field Name: Priority Need 1 Field Note: Replaces 2010 priority #5 (medical home for women)
Field Name: Priority Need 2 Field Note: Continues 2010 priority #6
Field Name: Priority Need 4 Field Note: Continues the essence of 2010 priority #4, with slight changes to wording and framing.
Field Name: Priority Need 6 Field Note: Replaces 2010 priority #10. This new framing of the priority expands the focus for transition planning/services to all youth,not only those with special healthcare needs.
Field Name: Priority Need 8 Field Note: Continues the essence of 2010 priority #8, with slight changes to wording and framing.
Field Name: Priority Need 10 Field Note: Continues 2010 priority #1
Field Level Notes for Form 9:
Page 177 of 222

Form 10aNational Outcome Measures
State: Illinois
NOM-1 Percent of pregnant women who receive prenatal care beginning in the first trimester
Data Alerts :
NOM-1 Notes: None
None
Form Notes for Form 10a:NPM 1: 2013 = 62.0%, stable 2009-20135-Year Target Setting Method (5yr-TSM): 10% improvement
NPM 3: 2014 = 78.9%, stable 2010-20145yr-TSM: 10% improvement
NPM 6: 2011/12 = 34.4%, 63% improvement 2007-2011/125yr-TSM: 30% improvement
NPM 10: 2011/12 = 88.7%, 4% improvement 2007-2011/125yr-TSM: 5% improvement
NPM 11 for CSHCN: 2011/12 = 46.4%, stable 2007-2011/125yr-TSM: 10% improvement
NPM 12 for CSHCN: 2009/2010 = 45.3%, stable 2005/6 - 2009/105yr-TSM: 10% improvement
NPM 13A: 2011 = 47.5%, 23% improvement 2007-20115yr-TSM: 20% improvement
NPM 13B: 2011/12 = 80.8%, stable 2007-2011/125yr-TSM: 5% improvement
NPM 14A: 2013 = 7.0%, 11% improvement 2010-20135yr-TSM: 15% improvement
NPM 14B: 2011/12 = 21.0%, 10% improvement 2007-2011/125yr-TSM: 15% improvement
Page 178 of 222

NOM-2 Rate of severe maternal morbidity per 10,000 delivery hospitalizations
Data Alerts :
NOM-2 Notes: None
None
NOM-3 Maternal mortality rate per 100,000 live births
Data Alerts :
NOM-3 Notes: None
None
NOM-4.1 Percent of low birth weight deliveries (<2,500 grams)
Data Alerts :
NOM-4.1 Notes: None
None
NOM-4.2 Percent of very low birth weight deliveries (<1,500 grams)
Data Alerts :
NOM-4.2 Notes: None
None
Page 179 of 222

NOM-4.3 Percent of moderately low birth weight deliveries (1,500-2,499 grams)
Data Alerts :
NOM-4.3 Notes: None
None
NOM-5.1 Percent of preterm births (<37 weeks)
Data Alerts :
NOM-5.1 Notes: None
None
NOM-5.2 Percent of early preterm births (<34 weeks)
Data Alerts :
NOM-5.2 Notes: None
None
NOM-5.3 Percent of late preterm births (34-36 weeks)
Data Alerts :
NOM-5.3 Notes: None
None
Page 180 of 222

NOM-6 Percent of early term births (37, 38 weeks)
Data Alerts :
NOM-6 Notes: None
None
NOM-7 Percent of non-medically indicated early elective deliveries
Data Alerts :
NOM-7 Notes: None
None
NOM-8 Perinatal mortality rate per 1,000 live births plus fetal deaths
Data Alerts :
NOM-8 Notes: None
None
NOM-9.1 Infant mortality rate per 1,000 live births
Data Alerts :
NOM-9.1 Notes: None
None
Page 181 of 222

NOM-9.2 Neonatal mortality rate per 1,000 live births
Data Alerts :
NOM-9.2 Notes: None
None
NOM-9.3 Post neonatal mortality rate per 1,000 live births
Data Alerts :
NOM-9.3 Notes: None
None
NOM-9.4 Preterm-related mortality rate per 100,000 live births
Data Alerts :
NOM-9.4 Notes: None
None
NOM-9.5 Sleep-related Sudden Unexpected Infant Death (SUID) rate per 100,000 live births
Data Alerts :
NOM-9.5 Notes: None
None
Page 182 of 222

NOM-10 The percent of infants born with fetal alcohol exposure in the last 3 months of pregnancy
Data Alerts :
NOM-10 Notes: None
None
NOM-11 The rate of infants born with neonatal abstinence syndrome per 1,000 delivery hospitalizations
Data Alerts :
NOM-11 Notes: None
None
NOM-12 Percent of eligible newborns screened for heritable disorders with on time physician notification for out of range screens who are followed up in a timely manner. (DEVELOPMENTAL)
Data Alerts :
None
NOM-13 Percent of children meeting the criteria developed for school readiness (DEVELOPMENTAL)
Data Alerts :
None
NOM-14 Percent of children ages 1 through 17 who have decayed teeth or cavities in the past 12 months
Data Alerts :
NOM-14 Notes: None
None
Page 183 of 222

NOM-15 Child Mortality rate, ages 1 through 9 per 100,000
Data Alerts :
NOM-15 Notes: None
None
NOM-16.1 Adolescent mortality rate ages 10 through 19 per 100,000
Data Alerts :
NOM-16.1 Notes: None
None
NOM-16.2 Adolescent motor vehicle mortality rate, ages 15 through 19 per 100,000
Data Alerts :
NOM-16.2 Notes: None
None
NOM-16.3 Adolescent suicide rate, ages 15 through 19 per 100,000
Data Alerts :
NOM-16.3 Notes: None
None
Page 184 of 222

NOM-17.1 Percent of children with special health care needs
Data Alerts :
NOM-17.1 Notes: None
None
NOM-17.2 Percent of children with special health care needs (CSHCN) receiving care in a well-functioning system
Data Alerts :
NOM-17.2 Notes: None
None
NOM-17.3 Percent of children diagnosed with an autism spectrum disorder
Data Alerts :
NOM-17.3 Notes: None
None
NOM-17.4 Percent of children diagnosed with Attention Deficit Disorder/Attention Deficit Hyperactivity Disorder (ADD/ADHD)
Data Alerts :
NOM-17.4 Notes: None
None
Page 185 of 222

NOM-18 Percent of children with a mental/behavioral condition who receive treatment or counseling
Data Alerts :
NOM-18 Notes: None
None
NOM-19 Percent of children in excellent or very good health
Data Alerts :
NOM-19 Notes: None
None
NOM-20 Percent of children and adolescents who are overweight or obese (BMI at or above the 85th percentile)
Data Alerts :
NOM-20 Notes: None
None
NOM-21 Percent of children without health insurance
Data Alerts :
NOM-21 Notes: None
None
Page 186 of 222
NOM-22.1 Percent of children ages 19 through 35 months, who have received the 4:3:1:3(4):3:1:4 series of routine vaccinations
Data Alerts :
NOM-22.1 Notes: None
None
NOM-22.2 Percent of children 6 months through 17 years who are vaccinated annually against seasonal influenza
Data Alerts :
NOM-22.2 Notes: None
None
NOM-22.3 Percent of adolescents, ages 13 through 17, who have received at least one dose of the HPV vaccine
Data Alerts :
NOM-22.3 Notes: None
None
NOM-22.4 Percent of adolescents, ages 13 through 17, who have received at least one dose of the Tdap vaccine
Data Alerts :
NOM-22.4 Notes: None
None
Page 187 of 222

NOM-22.5 Percent of adolescents, ages 13 through 17, who have received at least one dose of the meningococcal conjugate vaccine
Data Alerts :
NOM-22.5 Notes: None
None
Page 188 of 222

State: IllinoisNational Performance Measures
Form 10a
2016 2017 2018 2019 2020Annual Objective 63 64 65.5 67 68.5
NPM 1-Percent of women with a past year preventive medical visit
2016 2017 2018 2019 2020Annual Objective 80.4 81.9 83.5 85.1 86.8
NPM 3-Percent of very low birth weight (VLBW) infants born in a hospital with a Level III+ Neonatal Intensive CareUnit (NICU)
2016 2017 2018 2019 2020Annual Objective 36.3 38.3 40.4 42.5 44.7
NPM 6-Percent of children, ages 10 through 71 months, receiving a developmental screening using a parent-completed screening tool
2016 2017 2018 2019 2020Annual Objective 89.5 90.3 91.2 92.1 93.1
NPM 10-Percent of adolescents, ages 12 through 17, with a preventive medical visit in the past year.
2016 2017 2018 2019 2020Annual Objective 47.2 48.1 49 50 51
NPM 11-Percent of children with and without special health care needs having a medical home
Page 189 of 222

2016 2017 2018 2019 2020Annual Objective 46.2 47.1 48 48.9 49.8
NPM 12-Percent of adolescents with and without special health care needs who received services necessary tomake transitions to adult health care
2016 2017 2018 2019 2020Annual Objective 49.4 51.3 53.2 55.1 57Annual Objective 81.6 82.4 83.2 84 84.8
NPM 13-A) Percent of women who had a dental visit during pregnancy and B) Percent of children, ages 1 through17 who had a preventive dental visit in the past year
2016 2017 2018 2019 2020Annual Objective 6.8 6.5 6.2 5.9 5.6Annual Objective 20.4 19.8 19.2 18.6 17.9
NPM 14-A) Percent of women who smoke during pregnancy and B) Percent of children who live in householdswhere someone smokes
Page 190 of 222

Form 10bState Performance/Outcome Measure Detail Sheet
State: Illinois
States are not required to create SOMs/SPMs until the FY 2017 Application/FY 2015 Annual Report.
Page 191 of 222

State: IllinoisEvidence-Based or Informed Strategy Measure Detail Sheet
Form 10c
States are not required to create ESMs until the FY 2017 Application/FY 2015 Annual Report.
Page 192 of 222

Form 10dNational Performance Measures (Reporting Year 2014 & 2015)
State: Illinois
2011 2012 2013 2014 2015Annual Objective 99.0 99.0 99.0 99.0 99.0
Annual Indicator 98.6 98.7 98.8 98.1
Numerator 1,766 1,604 2,071 9,724
Denominator 1,791 1,625 2,096 9,916
Data Source IDPH, Genetics IDPH, Genetics IDPH, Genetics IDPH, Genetics
Provisional Or Final ?
Final
NPM 01 - The percent of screen positive newborns who received timely follow up to definitive diagnosis and clinical management for condition(s) mandated by their State-sponsored newborn screening programs.
Data Alerts:
None
Form Notes for Form 10d:None
Page 193 of 222

2011 2012 2013 2014 2015Annual Objective 60.5 71.1 71.1 71.1 72.0
Annual Indicator 71.1 71.1 71.1 71.1
Numerator
Denominator
Data Source CSHCN SLAITS Survey
CSHCN SLAITS Survey
CSHCN SLAITS Survey
CSHCN SLAITS Survey
Provisional Or Final ?
Final
NPM 02 - The percent of children with special health care needs age 0 to 18 years whose families partner in decision making at all levels and are satisfied with the services they receive. (CSHCN survey)
Data Alerts:
None
Page 194 of 222

2011 2012 2013 2014 2015Annual Objective 45.5 44.5 44.5 44.5 45.0
Annual Indicator 44.5 44.5 44.5 44.5
Numerator
Denominator
Data Source CSHCN SLAITS Survey
CSHCN SLAITS Survey
CSHCN SLAITS Survey
CSHCN SLAITS Survey
Provisional Or Final ?
Final
NPM 03 - The percent of children with special health care needs age 0 to 18 who receive coordinated, ongoing, comprehensive care within a medical home. (CSHCN Survey)
Data Alerts:
None
Page 195 of 222

2011 2012 2013 2014 2015Annual Objective 59.7 62.5 62.5 62.5 62.5
Annual Indicator 62.1 62.1 62.1 62.1
Numerator
Denominator
Data Source CSHCN SLAITS Survey
CSHCN SLAITS Survey
CSHCN SLAITS Survey
CSHCN SLAITS Survey
Provisional Or Final ?
Final
NPM 04 - The percent of children with special health care needs age 0 to 18 whose families have adequate private and/or public insurance to pay for the services they need. (CSHCN Survey)
Data Alerts:
None
Page 196 of 222

2011 2012 2013 2014 2015Annual Objective 90.0 64.6 64.6 64.6 64.6
Annual Indicator 64.6 64.6 64.6 64.6
Numerator
Denominator
Data Source CSHCN SLAITS Survey
CSHCN SLAITS Survey
CSHCN SLAITS Survey
CSHCN SLAITS Survey
Provisional Or Final ?
Final
NPM 05 - Percent of children with special health care needs age 0 to 18 whose families report the community-based service systems are organized so they can use them easily. (CSHCN Survey)
Data Alerts:
None
Page 197 of 222

2011 2012 2013 2014 2015Annual Objective 44.5 45.3 45.3 45.3 45.3
Annual Indicator 44.2 45.3 45.3 45.3
Numerator
Denominator
Data Source CSHCN SLAITS Survey
CSHCN SLAITS Survey
CSHCN SLAITS Survey
CSHCN SLAITS Survey
Provisional Or Final ?
Final
NPM 06 - The percentage of youth with special health care needs who received the services necessary to make transitions to all aspects of adult life, including adult health care, work, and independence.
Data Alerts:
None
Page 198 of 222

2011 2012 2013 2014 2015Annual Objective 82.0 82.0 82.0 78.0 78.0
Annual Indicator 77.9 78.7 74.0 75.8
Numerator
Denominator
Data Source National Immunization Survey
National Immunization Survey
National Immunization Survey
National Immunization Survey
Provisional Or Final ?
Final
NPM 07 - Percent of 19 to 35 month olds who have received full schedule of age appropriate immunizations against Measles, Mumps, Rubella, Polio, Diphtheria, Tetanus, Pertussis, Haemophilus Influenza, and Hepatitis B.
Data Alerts:
None
Page 199 of 222

2011 2012 2013 2014 2015Annual Objective 19.0 19.0 15.0 11.0 11.0
Annual Indicator 15.2 13.5 11.4 10.1
Numerator 4,037 3,520 2,927 2,577
Denominator 265,206 260,596 256,134 256,134
Data Source provisional birth data, DHFS-EDW
provisional birth data, DHFS-EDW
provisional birth data, DHFS-EDW
provisional birth data, DHFS-EDW
Provisional Or Final ?
Provisional
NPM 08 - The rate of birth (per 1,000) for teenagers aged 15 through 17 years.
Data Alerts:
None
Page 200 of 222
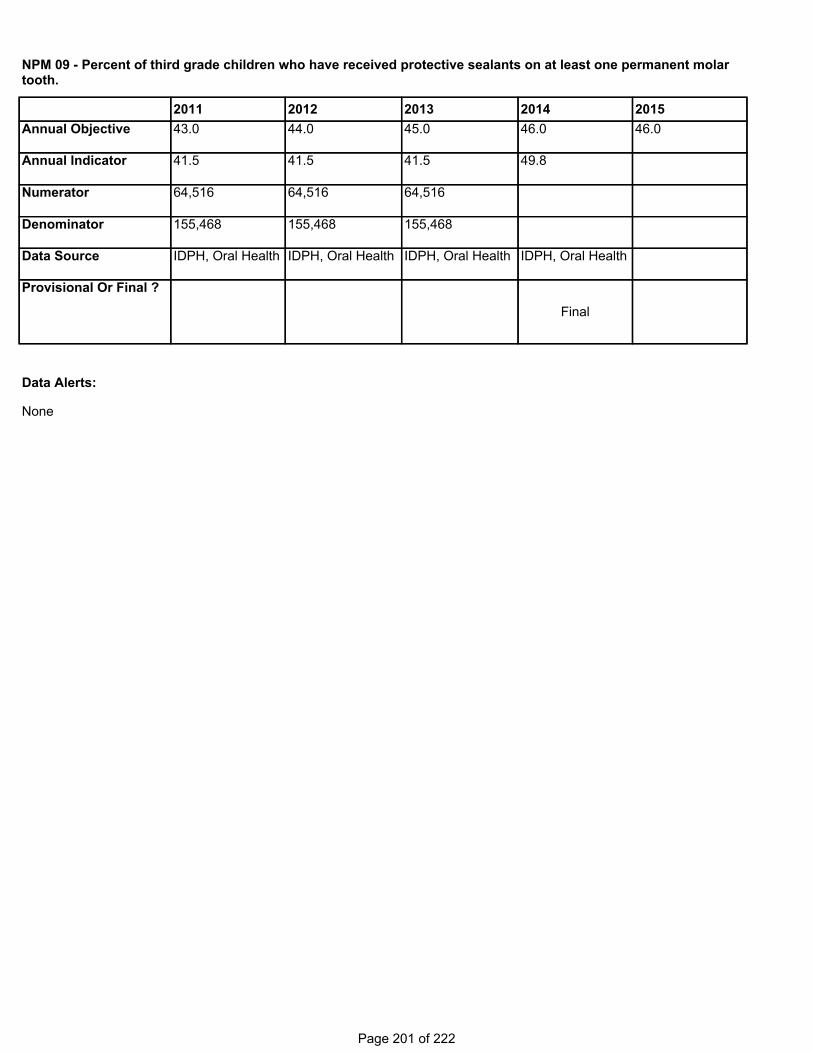
2011 2012 2013 2014 2015Annual Objective 43.0 44.0 45.0 46.0 46.0
Annual Indicator 41.5 41.5 41.5 49.8
Numerator 64,516 64,516 64,516
Denominator 155,468 155,468 155,468
Data Source IDPH, Oral Health IDPH, Oral Health IDPH, Oral Health IDPH, Oral Health
Provisional Or Final ?
Final
NPM 09 - Percent of third grade children who have received protective sealants on at least one permanent molar tooth.
Data Alerts:
None
Page 201 of 222

2011 2012 2013 2014 2015Annual Objective 1.7 1.7 1.4 1.3 1.2
Annual Indicator 1.3 1.3 1.0 1.0
Numerator 34 34 26 26
Denominator 2,574,430 2,574,430 2,499,834 2,499,834
Data Source IDPH - Vital Records
IDPH - Vital Records
provisional death files - DHFS-EDW
provisional death files - DHFS-EDW
Provisional Or Final ?
Provisional
NPM 10 - The rate of deaths to children aged 14 years and younger caused by motor vehicle crashes per 100,000 children.
Data Alerts:
None
Page 202 of 222

2011 2012 2013 2014 2015Annual Objective 29.0 27.0 28.0 50.0 50.0
Annual Indicator 44.5 49.8 48.8 47.0
Numerator
Denominator
Data Source National Immunization Survey
National Immunization Survey
National Immunization Survey
National Immunization Survey
Provisional Or Final ?
Final
NPM 11 - The percent of mothers who breastfeed their infants at 6 months of age.
Data Alerts:
None
Page 203 of 222

2011 2012 2013 2014 2015Annual Objective 99.0 99.0 99.0 99.0 99.0
Annual Indicator 99.2 99.1 98.8 98.9
Numerator 156,049 154,005 149,187 149,912
Denominator 157,343 155,345 150,996 151,655
Data Source IDPH, Vision and Hearing
IDPH, Vision and Hearing
IDPH, Vision and Hearing
IDPH, Vision and Hearing
Provisional Or Final ?
Final
NPM 12 - Percentage of newborns who have been screened for hearing before hospital discharge.
Data Alerts:
None
Page 204 of 222
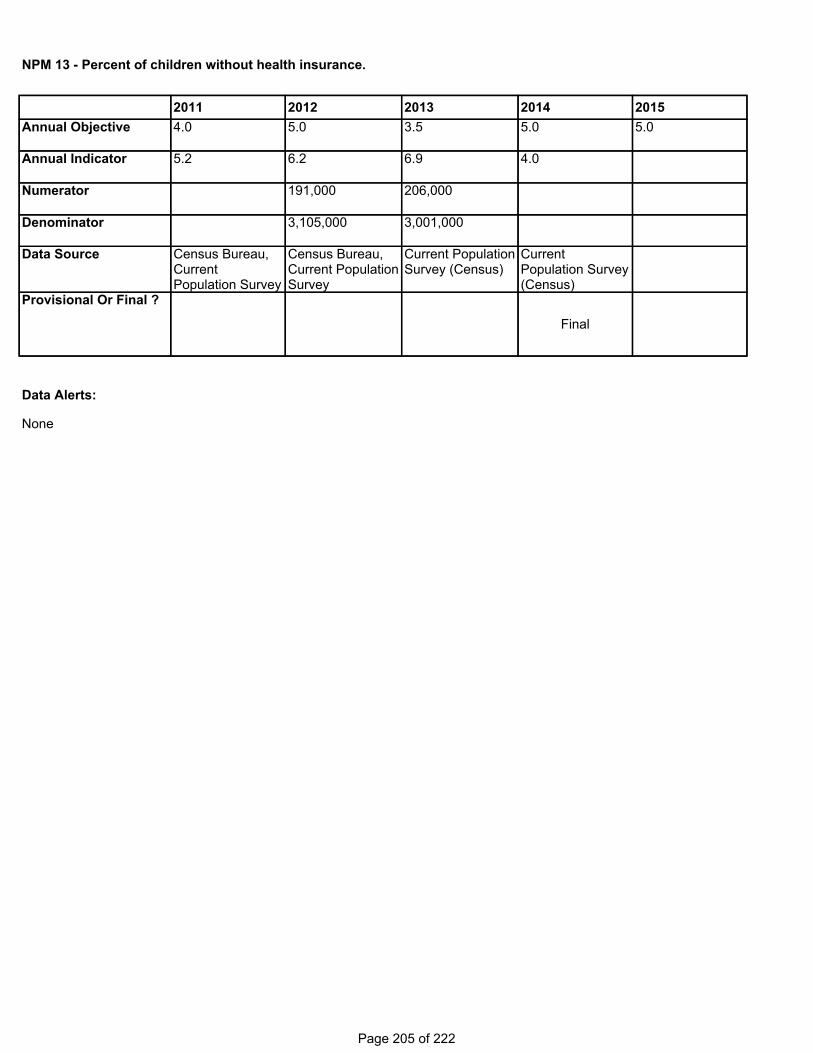
2011 2012 2013 2014 2015Annual Objective 4.0 5.0 3.5 5.0 5.0
Annual Indicator 5.2 6.2 6.9 4.0
Numerator 191,000 206,000
Denominator 3,105,000 3,001,000
Data Source Census Bureau, Current Population Survey
Census Bureau, Current Population Survey
Current Population Survey (Census)
Current Population Survey (Census)
Provisional Or Final ?
Final
NPM 13 - Percent of children without health insurance.
Data Alerts:
None
Page 205 of 222

2011 2012 2013 2014 2015Annual Objective 29.0 29.5 29.5 29.0 29.0
Annual Indicator 30.4 30.4 30.4 30.4
Numerator 40,575 40,575 40,575 40,575
Denominator 133,471 133,471 133,471 133,471
Data Source PedNSS PedNSS PedNSS PedNSS
Provisional Or Final ?
Provisional
NPM 14 - Percentage of children, ages 2 to 5 years, receiving WIC services with a Body Mass Index (BMI) at or above the 85th percentile.
Data Alerts:
None
Page 206 of 222

2011 2012 2013 2014 2015Annual Objective 9.5 9.0 9.0 8.5 8.5
Annual Indicator 9.2 9.2 8.9 10.1
Numerator 14,830 14,830 13,663 15,245
Denominator 161,764 161,764 153,759 151,665
Data Source IDPH, PRAMS IDPH, PRAMS IDPH, PRAMS IDPH, PRAMS
Provisional Or Final ?
Final
NPM 15 - Percentage of women who smoke in the last three months of pregnancy.
Data Alerts:
None
Page 207 of 222

2011 2012 2013 2014 2015Annual Objective 6.0 7.0 5.8 5.8 5.8
Annual Indicator 6.2 7.9 3.9 6.3
Numerator 57 73 34 55
Denominator 922,092 922,092 877,192 877,192
Data Source IDPH, Vital Records
IDPH, Vital Records
provisional death records, DHFS-EDW
provisional death records, DHFS-EDW
Provisional Or Final ?
Provisional
NPM 16 - The rate (per 100,000) of suicide deaths among youths aged 15 through 19.
Data Alerts:
None
Page 208 of 222

2011 2012 2013 2014 2015Annual Objective 83.0 83.0 83.0 83.0 83.0
Annual Indicator 88.9 87.3 79.1 78.9
Numerator 2,142 2,055 1,631 1,634
Denominator 2,410 2,355 2,062 2,071
Data Source provisional birth data, DHFS-EDW
provisional birth data, DHFS-EDW
provisional birth data, DHFS-EDW
provisional birth data, DHFS-EDW
Provisional Or Final ?
Provisional
NPM 17 - Percent of very low birth weight infants delivered at facilities for high-risk deliveries and neonates.
Data Alerts:
None
Page 209 of 222

2011 2012 2013 2014 2015Annual Objective 87.0 87.0 87.0 83.0 84.0
Annual Indicator 82.8 82.9 82.9 82.3
Numerator 124,676 121,499 115,491 121,460
Denominator 150,534 146,511 139,279 147,525
Data Source provisional birth data, DHFS-EDW
provisional birth data, DHFS-EDW
provisional birth data, DHFS-EDW
provisional birth data, DHFS-EDW
Provisional Or Final ?
Provisional
NPM 18 - Percent of infants born to pregnant women receiving prenatal care beginning in the first trimester.
Data Alerts:
None
Page 210 of 222

State: IllinoisState Performance Measures (Reporting Year 2014 & 2015)
Form 10d
2011 2012 2013 2014 2015Annual Objective 34.0 23.0 27.0 24.0 0.2
Annual Indicator
Numerator 20 15 18 20
Denominator 1 1 1 1
Data Source Staff Report Staff Report Staff Report Staff Report
Provisional Or Final ?
Final
SPM 1 - Title V data capacity and usage
Data Alerts:
None
Page 211 of 222

2011 2012 2013 2014 2015Annual Objective 9.0 10.0 11.0 12.0 13.0
Annual Indicator
Numerator 8 8 0 7
Denominator 15 15 15 15
Data Source Survey Survey Staff Report Staff Report
Provisional Or Final ?
Final
SPM 2 - Integrate MCH services and improve linkage of clients to these services
A value of zero has been entered for the numerator for year 2013 SPM# 2. Please review your data to ensure this is correct
1 .
Data Alerts:
Page 212 of 222
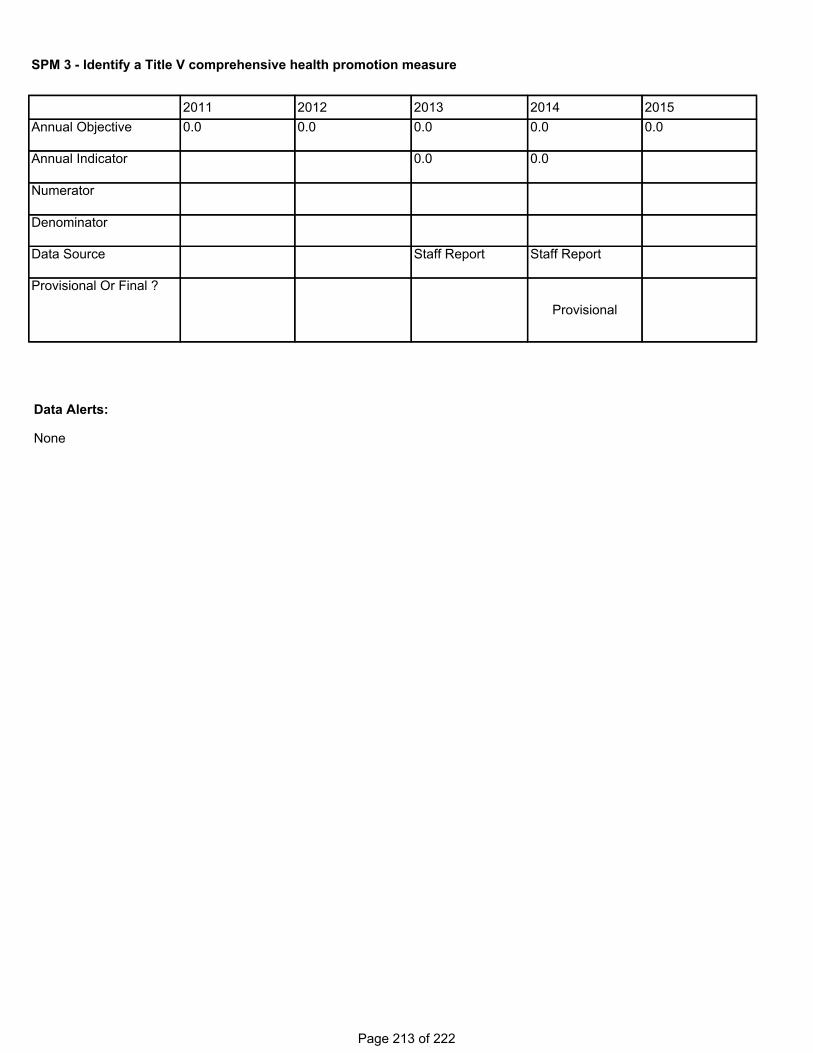
2011 2012 2013 2014 2015Annual Objective 0.0 0.0 0.0 0.0 0.0
Annual Indicator 0.0 0.0
Numerator
Denominator
Data Source Staff Report Staff Report
Provisional Or Final ?
Provisional
SPM 3 - Identify a Title V comprehensive health promotion measure
Data Alerts:
None
Page 213 of 222

2011 2012 2013 2014 2015Annual Objective 65.0 69.0 70.0 70.0 71.0
Annual Indicator 71.2 68.2 69.1 68.6
Numerator 272,659 257,258 239,812 217,222
Denominator 383,171 377,062 347,234 316,460
Data Source IDHFS EIS Rpt. IDHFS EIS Rpt. IDHFS EIS Rpt. IDHFS EIS Rpt.
Provisional Or Final ?
Provisional
SPM 4 - Percent of Medicaid children ages 3-6 receiving at least one well-child visit in the last year
Data Alerts:
None
Page 214 of 222

2011 2012 2013 2014 2015Annual Objective 88.0 89.0 90.0 90.0 90.0
Annual Indicator 78.8 83.9 79.6 80.4
Numerator 1,790,684 1,868,478
Denominator 2,271,540 2,226,974
Data Source IL-BRFSS IL-BRFSS IL-BRFSS IL-BRFSS
Provisional Or Final ?
Provisional
SPM 5 - Percent of women of reproductive age who have a primary medical care provider
Data Alerts:
None
Page 215 of 222

2011 2012 2013 2014 2015Annual Objective 41.0 41.0 41.0 41.0 41.0
Annual Indicator 44.2 44.2 42.5 42.0
Numerator 71,100 71,100 65,962 62,915
Denominator 160,698 160,698 155,246 149,951
Data Source PRAMS PRAMS PRAMS PRAMS
Provisional Or Final ?
Provisional
SPM 6 - Percent of live births resulting from unintended pregnancies
Data Alerts:
None
Page 216 of 222

2011 2012 2013 2014 2015Annual Objective 95.0 95.0 95.0 52.0 52.0
Annual Indicator 46.3 48.8 50.5 51.5
Numerator 697,930 759,190 798,269 796,490
Denominator 1,507,472 1,554,421 1,581,522 1,547,301
Data Source IDHFS CMS 416 Report
IDHFS CMS 416 Report
IDHFS CMS 416 Report
IDHFS CMS 416 Report
Provisional Or Final ?
Provisional
SPM 7 - Percent of Medicaid children receiving preventive dental services during last year
Data Alerts:
None
Page 217 of 222

2011 2012 2013 2014 2015Annual Objective 88.5 77.0 79.0 79.0 79.0
Annual Indicator 74.0 74.0 76.3 76.9
Numerator 118,038 118,038 116,456 116,594
Denominator 159,502 159,502 152,717 151,707
Data Source PRAMS PRAMS PRAMS PRAMS
Provisional Or Final ?
Provisional
SPM 8 - Percent of women whose prenatal care provider discussed perinatal depression
Data Alerts:
None
Page 218 of 222

2011 2012 2013 2014 2015Annual Objective 67.5 51.0 52.3 52.0 54.0
Annual Indicator 48.5 48.5 49.9 49.9
Numerator
Denominator
Data Source YRBS - CDC YRBS - CDC YRBS - CDC YRBS - CDC
Provisional Or Final ?
Provisional
SPM 9 - Percent of youth participating in regular physical activity during the week
Data Alerts:
None
Page 219 of 222

2011 2012 2013 2014 2015Annual Objective 90.7 90.8 85.0 86.0 87.0
Annual Indicator 87.8 83.4 65.4 69.1
Numerator 879 746 608 327
Denominator 1,001 894 929 473
Data Source Record Review DSCC Youth 14-21 (50% Sample)
Record Review DSCC Youth 14-21 (50% Sample)
Record Review DSCC Youth 14-21 (50% Sample)
Record Review DSCC Youth 14-21
Provisional Or Final ?
Final
SPM 10 - Percent of youth with special healthcare needs receiving comprehensive transition planning services
Data Alerts:
None
Page 220 of 222

Form 11Other State Data
State: Illinois
While the Maternal and Child Health Bureau (MCHB) will populate the data elements on this form for the States, the data are not available for the FY 2016 application and FY 2014 annual report.
Page 221 of 222

State: Illinois
State Action Plan Table
Please click the link below to download a PDF of the State Action Plan Table.
State Action Plan Table
Page 222 of 222