material total mass loss in vacuum obtained from various
TRANSCRIPT

NASA/TM-2000--209897
Material Total Mass Loss in Vacuum Obtained from
Various Outgassing Systems
John Scialdone, Peggy Isaac, Carroll Clatterbuck, and Ronald Hunkeler
National Aeronautics and Space AdministrationGoddard Space Flight Center
Greenbelt, Maryland 20771
July 2000
The NASA STI Program Office ... in Profile
Since its founding, NASA has been dedicated to
the advancement of aeronautics and spacescience. The NASA Scientific and Technical
Information (STI) Program Office plays a keypart in helping NASA maintain this importantrole.
The NASA STI Program Office is operated byLangley Research Center, the lead center forNASA's scientific and technical information. The
NASA STI Program Office provides access tothe NASA STI Database, the largest collection of
aeronautical and space science STI in the world.The Program Office is also NASA's institutional
mechanism for disseminating the results of itsresearch and development activities. These
results are published by NASA in the NASA STIReport Series, which includes the following
report types:
• TECHNICAL PUBLICATION. Reports ofcompleted research or a major significant
phase of research that present the results ofNASA programs and include extensive data or
theoretical analysis. Includes compilations ofsignificant scientific and technical data and
information deemed to be of continuingreference value. NASA's counterpart of
peer-reviewed formal professional papers but
has less stringent limitations on manuscriptlength and extent of graphic presentations.
TECHNICAL MEMORANDUM. Scientific
and technical findings that are preliminary or
of specialized interest, e.g., quick releasereports, working papers, and bibliographiesthat contain minimal annotation. Does not
contain extensive analysis.
CONTRACTOR REPORT. Scientific and
technical findings by NASA-sponsoredcontractors and grantees.
• CONFERENCE PUBLICATION. Collected
papers from scientific and technical
conferences, symposia, seminars, or other
meetings sponsored or cosponsored by NASA.
• SPECIAL PUBLICATION. Scientific, techni-cal, or historical information from NASA
programs, projects, and mission, often con-
cerned with subjects having substantial publicinterest.
TECHNICAL TRANSLATION.
English-language translations of foreign scien-tific and technical material pertinent to NASA'smission.
Specialized services that complement the STIProgram Office's diverse offerings include creat-ing custom thesauri, building customized data-
bases, organizing and publishing research results...even providing videos.
For more information about the NASA STI Pro-
gram Office, see the following:
• Access the NASA STI Program Home Page athttp://www.sti.nasa.gov/STI-homepage.html
• E-mail your question via the Internet to
Fax your question to the NASA Access HelpDesk at (301) 621-0134
Telephone the NASA Access Help Desk at(301) 621-0390
Write to:
NASA Access Help DeskNASA Center for AeroSpace Information7121 Standard Drive
Hanover, MD 21076-1320
NASA/TM-2000-209897
Material Total Mass Loss in Vacuum Obtained from
Various Outgassing Systems
John Scialdone, Peggy Isaac, Carroll Clatterbuck, and Ronald Hunkeler
NASA's Goddard Space Flight Center
Greenbelt, MD 20771
National Aeronautics and Space AdministrationGoddard Space Flight CenterGreenbelt, Maryland 20771
July 2000
Available from:
NASA Center for AeroSpace Information7121 Standard Drive
Hanover, MD 21076-1320Price Code: A17
National Technical Information Service
5285 Port Royal Road
Springfield, VA 22161Price Code: A10
ABSTRACT
Several instruments including the Cahn Microbalance, the Knudsen Cell, the micro-CVCM, and the vacuum Thermo-
gravimetric Analyzer (TGA) were used in the testing of a graphite/epoxy (GR/EP) composite that is proposed for use as a
rigidizing element of an inflatable deployment system. This GR/EP will be cured in situ. The purpose of this testing is to
estimate the gaseous production resulting from the curing of the GR/EP composite, to predict the resulting pressure, and to
calculate the required venting. Every test was conducted under vacuum at 125 degrees C for 24 hours. Upon comparison of
the results, the ASTM E-595 was noted to have given readings that were consistently lower than those obtained using theother instruments, which otherwise provided similar results. The GR/EP was tested using several different geometric arrange-ments.
This paper describes the analysis evaluating the molecular and continuum flow of the outgassing products issuing from the
exit port of the ASTM E-595 system. The effective flow conductance provided by the physical dimensions of the vent
passage of the ASTM E-595 system and that of the material sample were investigated, among other factors, to explain the
reduced amount of outgassing released during the 24-hour test period.
°°.
111


1.0 INTRODUCTION
Materials selected for space applications must maintain
structural and chemical integrity when exposed to the
environmental conditions of space. They should have low
outgassing rates at normal operating temperatures and the
outgassing should consist of a minimum of materials
condensable at the temperatures of nearby surfaces.
The observation of distant sources of radiation or the
measurement of the space medium is affected minimally
with the spacecrafts having low outgassing. In addition,
voltage breakdowns and undesirable heat transfer regimes
at certain critical regions of the spacecraft are minimized by
limiting material outgassing. The requirement on
condensables reflects the potentially degrading effect of
materials deposits on radiating surfaces and on elements of
optical instruments. Deposits may change the thermal
properties of a surface and attenuate, reflect, and disperse
the incoming radiations to be measured.
Materials with the desirable characteristics have been
screened by a test developed in [1 ] and used at various
organizations including Goddard Space Flight Center
(GSFC), European Space Research Organization (ESRO),
and Jet Propulsion Lab (JPL). The test, described by [1-3],
consists of maintaining samples of about 200 mg of the
materials under consideration at a temperature of 398 K
(125°C) for 24 hours in a vacuum of about 10-6torr. The
sample mass loss and the amount of that mass which
condenses on a collector plate held at 298 K (25°C) and
located near the sample are used as some of the criteria forthe selection of these materials for space use. The test
temperatures were purposely designed to be extreme; these
temperatures can only be encountered in exceptionalapplications. The pressure of 10.6 torr is sufficiently low to
prevent collisions between molecules leaving a surface. In
general, the material is considered acceptable if the totalmass loss (TML) is less than 1% and the volatile condens-
able mass (VCM) is less than 0.1% of the initial samplemass. The criteria arise from the observation that certain
materials show mechanical and physical degradation when
they have lost 3 to 5% of their mass. For others, such as
elastomers, a 1% TML is usually detrimental to their
mechanical properties. A more definite interpretation can be
given to the 0.1% VCM criteria. The 0.1% condensate of a
1-kg material would cover 100m 2of surface with a uniform
10 .6g/cm 2 layer corresponding to about 20 monolayers andto a thickness of about 10 .6cm.
Material coatings of these dimensions can be detrimental
for optical and thermal applications. Regardless of these
considerations, the selection criteria appear to provide
sufficient protection against the use of objectionable
materials. However, the test and its selection criteria do not
provide direct data that a designer requires to ensure against
contamination and the performance of certain systems. The
designer must know the materials' outgassing rates as a
function of temperature, time, and surface area and the
condensation of this outgassing at temperatures other than
298 K (25°C). With this data, the designer can select the
materials to use and can estimate the pressure versus time in
compartments and the deposits and contamination which
may occur on critical surfaces [4-6].
The criteria and the testing methods employed to qualify a
material for space application have worked well and
continue to do so. A targe number of materials have been
tested according to those criteria. Goddard Space Flight
Center provides a website with the outgassing data for
various materials [7]. ESTEC, located in the Netherlands,
also reports data on materials outgassing according to the
ASTM E-595 [8]. Other important characteristics of
materials, such as flammability, toxicity, and thermo-optical
properties are reported in other documents. This paperdiscusses the use of the TML and CVCM obtained from the
ASTM E-595 tests for purposes other than general material
selection for space applications. These standard test data
have been used to get results about distribution, amount of
contaminant deposits, and other data at temperatures and
pressures other than those of the ASTM E-595 test.
The TML and CVCM have been employed to obtain the
outgassing activation energy, the vapor pressures, and the
outgassing rates of that material at different temperatures
and as a function of time. These extrapolations have been
used to compensate for the absence of difficult and expen-sive tests to obtain kinetic data on the materials. The
purpose of this paper is to ward against the indiscriminate
use of those data. As an example, the author was recently
requested to estimate the gaseous release from a graphite/
epoxy composite (see fig. 1) when heated at 121°C in a
vacuum and to indicate the vent(s) needed to prevent
excessive pressures within the confined volume containingthe material. The available data on the material for the
calculations were the TML from the E-595 test at 125°C.
Figure 1. Graphite/Epoxy Weave Sample

No data were available on the rate, the temperature, and the
length of time during which the major release of gas
occurred. The TML from the many standard tests carriedout on this material at 125°C for the 24 hours at 10_ torr
averaged about 1.8%. The author employed that value for
the requested evaluation. Meanwhile, a fully operational
Cahn microbalance that includes a residual gas analyzer and
a quartz crystal microbalance became available at the
author's laboratory. That facility was employed to test the
composite material. The facility, which shows the real-timemass loss and the rate of mass loss as a function of time and
temperature as seen in fig. 2, indicated that at 121°C for 24
hours, the %TML was in excess of 13% (see fig. 3). It also
indicated that practically all of the mass loss occurred early
in the test and lasted for about 23 minutes. This TML result
confirmed by many tests of the same material, indicated a
much larger production of gas than that obtained using theE-595 result. As a consequence, a study was initiated to
verily and compare the TML results given by the ASTM E-
595 facility, the Cahn Microbalance, the Vacuum TGA, andthe Knudsen Cell.
The analysis that follows is an attempt to obtain a better
understanding of the parameters affecting the micro-CVCM
tests. The analysis points to some of the reasons for the
different results obtained for the same materials by different
instruments. Most importantly, it gives some insight on the
utilization of the test results for the use of the designer.
Figure 2. Cahn/QCM/RGA Outgassing Facility

T
Figure 3. Graphite/Epoxy Outgassing Test
2.0 EXPERIMENTAL
Material tests according to the E-595 method are carried out
by placing chips or thin slices of the material with thick-nesses of less than 3.1 mm (1/8 in) in a 10xl2x6-mm
container (fig. 4). This container boat is placed inside a
receptacle within a temperature controlling heated copper
bar. The receptacle has a venting port facing a collector. For
the test, the copper bar and the materials under test are heldat 125°C and the collector at 25°C. The assembly is located
within a vacuum chamber providing pressures of about 10 .6torr. The TML and CVCM are measured after the 24-hour
test. Other facilities not of the E-595 design can providedirect measurements of the TML and CVCM for a 125°C/
25°C, 24-hour test. These facilities provide results that are
not affected nor controlled by the fixture design. Those
used here are a Vacuum Thermogravimetric Analyzer
(TGA), a Cahn microbalance, and a Knudsen cell. The TGA
provides an isothermal change of the mass of a small
sample of material and records it as a function of time. The
Knudsen cell holds a sample of material at a desired
temperature. A collector surface facing the cell exit collects
the mass lost from the sample at a desired temperature. The
TML is obtained by measuring the weight of the sample
before and after the test and then subtracting the final
weight from the initial weight. The Cahn microbalance
records the mass loss of the sample and the rate of change
at the chosen temperature as a function of time. These three
facilities were employed to obtain the TMLs of the samplematerials at 125°C or at 12 I°C for 24 hours in vacuum and
to compare the results.

NOMENCLATURE
A - SAMPLE BOATB - HEATER BARC - SAMPLE COMPARTMENTD - COVER PLATEE - HEATER ELEMENTF - SEPARATOR PLATEG - COLLECTOR DISKH - RETAINING NUT
I - COOING PLATEJ - COOLING COIL
ASPECIMENCOMPARTMENT
COPPER HEATER BAR
SEPARATOR PLATE
}
/
/
f
I
/
II
II
II
II
II
ill "--
_11 II
iii II
)VERPLATE
M
t<.- 12 mm --),
SAMPLE BOAT
ABOAT = 0.72 cm 2
_ 4 D. 0.31 = 0.2cm 2ATUBE - _"
I A = 6.3 mm diaM = 16 mm dia
IL = 8mm
J = 12.7mmK = 1.6 mm
ATUBE ° A BOAT
= 0.15 cm 2
Figure 4. Micro-CVCM Apparatus

The results of the many tests done on the same material usingthree different facilities are shown in Table 1. The TML test
results obtained with the E-595 averaged 1.67% with the
exception of one test. The Cahn system results averaged
15.86% for a 6.45 cm 2(lin 2) sample. Staking samples of the
material resulted in smaller average TMLs: five-staked
samples produced an average TML of 5.9%; four-staked
samples produced an average of 7.23%; three-staked samples
produced an average of 8.6%; a single sheet of material
fitting the E-595 boat produced a 18.63% average TML. Theresults obtained from the Knudsen cell indicated a 16.94%
average for a 6.45 cm 2( l in 2) sample and a 6.1% TML for a
single test consisting of 6 sheets. The TGA indicated a 15.7%
TML for a single 1.5 cm diameter sample and 11.8% for a
stack of three of the same samples. The table shows the
temperature, the initial mass mo, the mass loss Am for the 24-hour tests, and the resulting TMLs. A small symbol shows
the sample arrangement.
The samples used in these tests came from the same batch ofmaterials, but it may have been possible that some differ-
ences may have existed among them due to the non- unifor-
mity of the epoxy coatings on the graphite filaments. With
regards to the sizes and dimensions, those for the E-595 werein accord with the recommendations in the standard for the
E-595 tests. For the Cahn and Knudsen tests, the samples
were 1 in 2 (6.45 cm2). They were made of stacked layers of
the same dimensions. The samples for the TGA tests were of
round shapes made to fit the small instrument pan.
Table 1: Test Results of Mass Losses & TMLs of Graphite/Epoxy Weave
Test
Average:
Cahn Microbalance
Average (1 cm 2 ):
Knudsen Cell
Average (lcm2):
Vacuum TGA
I T (oc) l A (cm 2) I mo (rag)
125 121.77
125 118.90
125 145.14
125 140.25
125 149.34
125 266.73
157.02
Am (mg)
I ME
(percent) Sample Confi_quration
2.90 2.38 II/
1 .g7 1.65 III
2.63 1.81 ///
2.16 1.54 III
2.16 1.44 /11
3.25 1.22 /11
1.672.51
121.0 6.45
121.9 6.45
122.5 6.45
125.0
125.0
126.4 6.45
125.0
125.0
125.0
125.0
125.0
125 6.45
125 6.45
125
243.00 32.58 13.40
240.70 40.70 16.90
240.90 39.54 16.40
254.00 14.97 5.89
126.90
230.80
243.80
256.00
103.36
38.10
39.40
9.70
38.80
41.39
24.47
7.47
7.10
6.26
37.89238.85
7.64
16.80
16.98
9.56
7.23
18.63
15.90
15.86
251.20 41.03 16.33
257.70 44.90 17.42
218.50 13.32 6.10
254.45 42.96 16.87
1.53 I 16.9053.53
2.66 15.70
6.34 11.86
I-1ElIS]
i : 5 pieces 0.95cm x 0.95cm
I=_1: 3 pieces 0.95cm x 0.95cm
[]III : 3 pieces 2.54cm x 0.83cm
----__: 3 Pieces 0.95cm x 0.95cm
I,=1 : 4 pieces 0.95cm x 0.95cm
: 1 piece 0.95cm x 0.95cm
I/I : 1 piece 0.95cm x 0.95cm
E3[]IIIIII
0=
3.0 ANALYSIS
Table 1 shows the average test results from the Cahn Micro-
balance, the Knudsen Cell, and the TGA, and compares them
to the average TML result of 1.67% from the E-595 test. The
average results from the Cahn Microbalance, the Knudsen
Cell, and the TGA are 9.49, 10.10, and 8.25% higher,
respectively, that those of the ASTM E-595. This indicatesthat the results from the non-E-595 facilities were on the
average about 9.28% higher than those of the E-595. The
justification for the difference could be found on the sample-
exposed area and the mass released during the 24 hours. In
the case of the E-595, the sample is within a boat and the
outgassing leaves the cavity via a tubular passage. The flow
must proceed through a series of passages from the boat and
through the tube. The second consideration must be the
nature of the flow, either molecular or viscous flow. The
molecular density created in the cavity by the outgassing ofthe E-595 test dictates the nature of the flow. The mass flow
from the other facilities is not restricted by the geometry or
by the gas mean free path conditions above the sample. The
samples are in an environment where the pressure is less than10 .6 torr and the flow of escaping gas is molecular. In both
types of testing facilities, the quantity of released gas is
affected by the staking and the percentages by the sample
masses as shown by the results produced by the restrictions
among layers.
On the basis of the above, two flow analyses have been
considered for the E-595 system. First, the flow may bemolecular. If so, the flow conductance is either a series
conductance made up of the boat passage area and the tubular
passage or the conductance is that of the tubular passage
alone. Alternatively, the assumption that the flow is a viscous
flow controlled by the tubular passage or by the boat open
area. These altematives have been compared to the losses
indicated by the other facilities operating in the molecular
region without area restrictions. The ratios of the mass losses
from the two systems, E-595 and the others, are then com-
pared to the TML ratios obtained from the tests.
In the systems other than the micro-CVCM, the outgassedmolecules leave the surface of the sample according to thecosine distribution law. The mass loss in a time t from the
material at temperature T is given according to the kinetic
theory as 1
m = -4PvAt(1)
where p (g/cm 3) is the mass density of the molecules moving
with velocity v=(3kT/mm)m where k (erg/K) is Boltzman's
constant, T is the surface temperature in K and m m(g/molec)
is the molecular mass [9-10]. The outgassing area A (cm 2) is
the exposed surface of the sample.
The outgassing releasing area for the sample in the E-595
m = pvAet (2)
will be an equivalent area A t resulting from the effectiveconductance of the passages. The mass loss for the cotinuum
flow when the flow when sufficient gas is released is
For viscous conditions in the cavity, the tubular passage may
control the flow. Its diameter d is 0.63 cm, providing an area0.31 cm 2, and the length L is 1.27 cm. The open area of the
boat is 0.72 cm 2, larger than that of the tube. A discharge
coefficient can be applied to the tube passage. For an orifice,
the discharge coefficient for viscous flow can be assumed to
be 0.6. For the pipe, the Clausing factor _ for molecular flow
is approximately 4/3 D/L=0.66. The effective area A ewithct_---0.6can be taken as 0.6x0.3 l=0.20cm 2. A possibility that
the effective area for the flow out of the cavity is a series
combination of the boat opening area and the tubular passage
can be considered. In that case, the equivalent area of the exit
is 0.31 cm 2, which modified by the Clausing factor or
discharge coefficient, becomes A u_=0.2. The boat's equiva-
lent area Ahoy,is 0.72 cm 2 and the series combination of the
two can indicate an equivalent A =Atu_AboJAt,_+A_a =0.157cm 2. Another alternative for the viscous flow is that the
effective area is simply the open area of the boat (0.72 cm2).
In the following, the assumption has been made that for the
micro-CVCM, the equivalent area A is 0.15 cm 2and the
flow is viscous. These assumptions have been verified by the
calculations comparing mass losses and TML. The mass loss
m 2from the open systems tests will be expressed by the
molecular flow leaving the exposed area A 2 of the sample
during the time t2as 1
= _ pvA2 t2 (3)
and the TML when the initial mass of the sample is m2o by
TML2 = rn 2 = _.1/gvAzt 2 (4)m2o 4 m2o
The results of the two types of tests have been compared as
follows: for the same outgassing rates (pv) released by the
same material samples at the same temperature, the masses
are equal when 1
aet I = --4A2t 2 (5)
The TML_ and TML 2are equal when
Aett=_.l AzI 2 (6)
m_o 4 mzo
and the ratio of the TMLs is given by
TML l 4Aet t m2o
TML2 Azt2 mlo
(7)
Using the value of 0.15 cm 2 for A°, the ratio of the test times
based on the TML value is
t, _ 1 A 2 m,,, _ _ m,,, _ 1.66Az ml(___L (8)
t 2 4 A, mzo 0.6 m2o m2o
where the subscript I refers to the micro-CVCM and 2 to the
open systems.
As an application, one may want to know when the mass
losses are the same. For example, for testing a sample with an
exposed surface A2=6.45 cm 2 (lin 2) on the Cahn Micro-
balance for t2=24 hours, the same mass loss will be produced
with the micro-CVCM when t,=l.66x6.45x24=256.9 hours
and the TML will be the same when from equation 8,
tl=l.66A2tz(mJm2o)=256.9(mJmzo). Note that the times for
the two tests to produce the same mass are nearly the same if
A2=0.72 (the area of the boat). Then for tz=24 hours,
h=l.66x0.72x24 hours and if one makes the mz0=l.2m_0 the
test times and the TML will be the same since (TML)_/
(TML)2 =4Ae/A(t_/t2)(mz0/m_0)=4x0.15/0.72x 1x 1.2= 1.
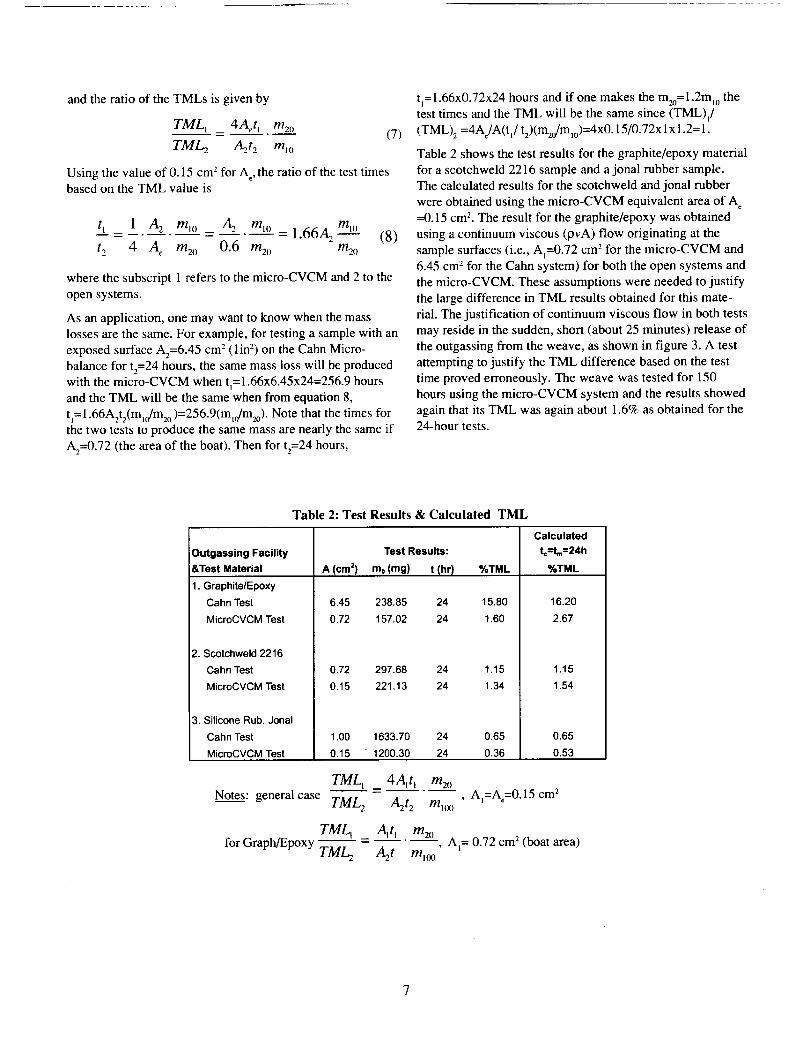
Table 2 shows the test results for the graphite/epoxy material
for a scotchweld 2216 sample and a jonal rubber sample.
The calculated results for the scotchweld and jonal rubber
were obtained using the micro-CVCM equivalent area of A
=0.15 cm 2. The result for the graphite/epoxy was obtained
using a continuum viscous (pvA) flow originating at the
sample surfaces (i.e., A_=0.72 cm 2 for the micro-CVCM and
6.45 cm 2 for the Cahn system) for both the open systems and
the micro-CVCM. These assumptions were needed to justify
the large difference in TML results obtained for this mate-
rial. The justification of continuum viscous flow in both tests
may reside in the sudden, short (about 25 minutes) release of
the outgassing from the weave, as shown in figure 3. A test
attempting to justify the TML difference based on the test
time proved erroneously. The weave was tested for 150
hours using the micro-CVCM system and the results showed
again that its TML was again about 1.6% as obtained for the
24-hour tests.
Table 2: Test Results & Calculated TML
Outgassing Facility
&Test Material
1. Graphite/Epoxy
Cahn Test
MicroCVCM Test
2. Scotchweld 2216
Cahn Test
MicroCVCM Test
3. Silicone Rub. Jonal
Cahn Test
MicroCVCM Test
Test Results:
A (cm 2) mo (rag) t {hr)
6.45 238.85 24
0.72 157.02 24
0.72 297.68 24
0.15 221.13 24
1.00 1633.70 24
0.15 "1200.30 24
Calculated
t_=tm=24h
%TML %TML
15.80 16.20
1.60 2.67
1.15 1.15
1.34 1.54
0.65 0.65
0.36 0.53
Notes: general case
TML1 _ 4A_tL m2o
TM_ A2t 2 m,,_), AI=Ao=0.15 cm 2
TM I-a Al t , m2o
forGraph/Epoxy -TML2 - A2 t mloo• AI= 0.72 cm 2 (boat area)
4.0 CONCLUSIONS
The micro-CVCM test has been appropriate and effective for
the selection of acceptable materials for space applications. It
has protected against excessive outgassing and deterioration
of materials when they are exposed to vacuum, excessive
temperatures, and radiation in the space environment. It has
provided indications on material stability and on its volatility.
Those test results, however, should not be used to quantify
the outgassing and its condensable content or to perform
estimates with regard to pressure conditions in and about a
system. These conclusions have been conf'trmed by tests on
several sample materials showing the difference in the results
for the TML and the mass losses obtained using the micro-
CVCM in comparison with those from the other facilities.
They show that the micro-CVCM results can be considerablyless than those from the other tests.
The difference in results has been attributed to the narrow
exhaust passage and the variable flow, either viscous or
molecular, that may exist within the micro-CVCM samplecavity.
The equivalent exhaust vent area resulting from the series
combination of the boat vent area and the tubular passage of
the cavity has been calculated to provide an effective area for
the outgassing of about 0.15 to 0.20 cm 2. This is the effec-
tive, limiting outgassing surface area of the sample.
Simple relationships have been proposed for the equivalence
of the results of the micro-CVCM and those of the open
systems. The equivalence for the mass losses and the total
mass loss percentages (%TML) have been based on a set of
considerations. First, the effective exposed outgassing area of
the sample in the micro-CVCM is 0.15 cmL Next, the flux of
outgassing per unit of area (fly) is the same since the sample
materials and their testing temperatures are the same. In
addition, the flow out of the micro-CVCM system is viscous
due to the small dimensions of the cavity and the resulting
small molecular mean free path offered to a reasonable
outgassing quantity. Last, the flow leaving the high vacuumexposed surface of the samples in the open tests is molecular
and the molecules leave according to the cosine distribution.
An exception to the consideration of the flow being molecu-
lar in an open system has been found for the case of the
graphite/weave outgassing. In that case, the sudden and largeloss of mass of the material in a few minutes has indicated a
condition of continuous viscous flow for both the open and
the micro-CVCM systems.
In general, the equivalence for the mass losses for the two
methods of tests should occur when 0.15h=l/4A2t 2 and the
equivalence for the TML when 0.15tt/m_0=l/4m20(A2t2). Inthese equations, the subscript 1 refers to the micro-CVCM
and 2 to the others and ml0 and m:0 refer to the initial masses
of the samples. The dimensional units are the same and the
outgassing fluxes (pv) in the equations have been cancelled
out based on the considerations given above. The difference
in the results obtained using the equations and those obtained
by the Cahn Microbalance and the micro-CVCM wereindicated.
5.0 REFERENCES
1. Muraca, R. E and J. S. Whittick, September 1967,
"Polymers for Spacecraft Applications," SRI Project ASD-5046, Stanford Research Institute.
2. Dauphin, J. G., et al., 1962, "Some Contamination
Problems in European TD Satellite," Paper No. 53, NASA
SP-298, Proceedings Space Simulation Symposium, NewYork.
3. Park, J. J., et al., 1973, "Outgassing Tests in Support of a
Proposed ASTM Specification," Paper No. 33, NASA SP-
336 Proceedings Space Simulation Symposium, Los
Angeles.
4. Scialdone, J. J., 1974, "Environment of a Spacecraft
Produced by Its Own Outgassing," International Confer-
ence on Evaluation of Space Environment on Materials,
Centre National d'Etude Spatials, Toulouse.
5. Scialdone, J. J., August 1996, "Some Sources of Contami-
nants in the Shuttle Bay," SPIE Prceedings, The Intern.
Society for Optical Eng., Paper No. 208, Vol. 2864,Denver.
6. Scialdone, J. J., August 1976, "An Equivant Energy for
the Outgassing of Space Materials," NASA TN D-8294.
7. Walter, N. A. and Scialdone, J. J., 1997, "Outggassing
Data for Spacecraft Materials," NASA Ref. Publ. 1124,Rev. 4.
8. Zwaal, A., October 1996, "Verification of Baking Effi-
ciency Using MicroVCM Test Data," Proceedings NASA
Conference, Publication No. 3341, p. 25, Baltimore.
9. Dushman, S. and J. M. Lafferty, 1962, Scientific Founda-
tion of Vacuum Techniques, J. Wiley & Sons, Inc., NewYork.
10. Santeler, D. J., et. AI., 1966, Vacuum Technology and
Space Simulation, NASA SP-105.

REPORT DOCUMENTATION PAGE Form ApprovedOMB No. 0704-0188
Public reportingburden for this collection of information is estimated to average 1hour per response, includingthe time for reviewinginstructions,searchingexisting data sources,gathering and maintaining the data needed, and completing and reviewing the collectionof information. Send comments regardingthis burdenestimate or any other aspect of thiscollection of information, includingsuggestionsfor reducingthis burden, to Washington HeadquartersServices, Directorate for InformationOperationsand Reports, 1215 JeffersonDavis Highway, Suite 1204, Arlington, VA 22202-4302, and to the Office of Management and Budget,Paperwork ReductionProject (0704-0188), Washington, DC 20503.
1. AGENCY USE ONLY (Leaveb/ank) 2t_P__p(_lT_ I_ATE 3. REp_,_R_r TyPF_ ._I_D DATES qOVEREDJuly ,_laaJu i ecnnlcal wlemoranaum
4. TITLE AND SUBIHLE 5. FUNDING NUMBERS
Material Total Mass Loss in Vacuum Obtained from Various Outgassing
Systems
6. AUTHOR(S)
John Scialdone, Peggy Isaac, Carroll Clatterbuck, and Ronald Hunkeler
7. PERFORMINGORGANIZATIONNAME(S)ANDADDRESS(ES)
Goddard Space Right Center
Greenbelt, Maryland 20771
9. SPONSORING / MONITORING AGENCY NAME(S) AND ADDRESS (ES)
National Aeronautics and Space Administration
Washington, DC 20546-0001
11. SUPPLEMENTARY NOTES
Code 541
8. PEFORMING ORGANIZATIONREPORT NUMBER
2000-03654-0
10. SPONSORING / MONITORING
AGENCY REPORT NUMBER
TM-2000-209897
12a. DISTRIBUTION / AVAILABILITY STATEMENT 12b. DISTRIBUTION CODE
Unclassified-Unlimited
Subject Category: 18
Report available from the NASA Center for AeroSpace Information,
7121 Standard Drive, Hanover, MD 21076-1320. (301 ) 621-0390.
13. ABSTRAChT (Maxim(Jm 200 words)
_ieveral instruments including the Cahn Microbalance, the Knudsen Cell, the micro-CVCM,
and the vacuum Thermogravimetric Analyzer (TGA) were used in the testing of a graphite/epoxy (GR/
EP) composite that is proposed for use as a rigidizing element of an inflatable deployment system.
This GR/EP will be cured in situ. The purpose of this testing is to estimate the gaseous production
resulting from the curing of the GR/EP composite, to predict the resulting pressure, and to calculate
the required venting. Every test was conducted under vacuum at 125 degrees C for 24 hours. Upon
comparison of the results, the ASTM E-595 was noted to have given readings that were consistently
lower than those obtained using the other instruments, which otherwise provided similar results. The
GR/EP was tested using several different geometric arrangements.
This paper describes the analysis evaluating the molecular and continuum flow of the outgas-
sing products issuing from the exit port of the ASTM E-595 system. The effective flow conductance
provided by the physical dimensions of the vent passage of the ASTM E-595 system and that of the
material sample among other factors were investigated to explain the reduced amount of outgassingreleased durinp the 24-hour test neriod.
14. SUBJECT TERMS
micro-CVCM, Thermogravimetric Analyzer (TGA), graphite/epoxy, ASTM
E-595, outgassing, total mass loss (TML), Knudsen cell, Cahn microbalance
17. SECURITY CLASSIFICATION !18. SECURITY CLASSiRCATIONOF REPORT OF THIS PAGE
Unclassified Unclassified
NSN 7540-01-280-5500
19. SECURITY CLASSIFICATIONOF ABSTRACT
Unclassified
15. NUMBER OF PAGES
9
16. PRICE CODE
20. LIMITATION OF ABSTRACI'
UL
Standard Form 298 (Rev. 2-89)Prescribed by ANSI Std. Z39.18298 -102
