masters graduation project physics of the built ...akash/maartje/files/measurements of icu... ·...
TRANSCRIPT

Masters Graduation Project
Physics of the Built Environment Architecture
Eindhoven University of Technology
ICU Environment Design TU/e, Arup and UMCG
Measurements of ICU Environment
Maartje van Roosmalen
Student number: S050304
Supervised by: Prof. P.G.S. Rutten (TU Eindhoven) Prof. Jan Westra (TU Eindhoven) Prof. B. Molenaar (TU Eindhoven) ir. J.Wiedenhoff MBA (Arup Amsterdam)


Measurement of ICU Environment
31 May 2010
Abstract
Measurements of the physical ICU environment between June 2009 and May 2010 indicate:
that the maximum average weighted sound level recommended is exceeded by up to 45% and maximum peak weighted sound levels are exceeded by up to 111% for 80-90% of the time, and the average sound level is exceeded 100% of the time.
that the illuminance level reaches Summer peaks that are 3 times as high as the minimum required value on emergency work planes, and 1.5 times in Winter,
that the luminance contrast exceeds the maximum ratio of 1:10 about 90% of the day and 10% of the Night.
that average radiant & ambient temperatures exceed the maximum recommended 24oC 80% of Summer and 20% of Winter daytime, that peak temperatures exceed the maximum recommended temperature by up to 50%, during Summer and Winter days, and that the CO2-level never exceeds maximum values,
that air velocity peaks exceeds the maximum recommended value by up to 200% in Winter and 250% in Summer, and the Summer average exceeds it 40-60% of time,
that minimum relative humidity levels are hardly ever reached in Winter, as they can reach 66% lower than the minimum recommended 30% relative humidity.
Simulations of an improved ICU lighting design indicate that similar light performance can be achieved on work panes while reducing the amount of light falling on the patients’ face.
Nomenclature
An overview of the meaning of the symbols and words used in this report:
BIS1: BISpectral Index (measure for the sleep pattern)
CHIC: Chirurgic Intensive Care
DF: Daylight Factor
ICU: Intensive Care Unit
ICB: Intensive and Respiratory Care (Intensive Care Beademing)
THIC: Thorax Intensive Care
UMCG: Universitair Medisch Centrum Groningen
Declaration
I hereby declare that I do not know of any other research which has been done like this, i.e. measuring the effect of multiple aspects of the environment on patients’ sleep patterns. To my knowledge everything in this document is based on true measurements of our research or of other research, and the latter has been referred to in the list of literature.
Acknowledgements
I would hereby like to thank everybody who contributed to this project and helped me complete this project with pleasure. Starting with my supervisors at Eindhoven University of Technology (TU/e), Prof. Paul Rutten, Prof. Bas Molenaar and Prof. Jan Westra, and my supervisors at Arup Amsterdam, ir. Jaap Wiedenhoff (MBA), Salome Galjaard, Mark van Piggelen, and Michael Davies, and the contact people at the UMCG, Drs. Olga Peters Polman (contact person for this research) and Prof. Jaap Tulleken (intensivist), for taking care of the measurements of the patients’ sleep pattern. My special thanks to Dr. Akash Kumar from the faculty Electrical Engineering at Eindhoven University of Technology, who wrote me all the scripts needed to fully automate the measurements and to automatically analyze the overload of data. Many thanks to the people of TU/e who helped me figure out how exactly I could do the measurements, and who spent many days preparing the mock-up and getting everything working, i.e. Geertjan Maas (preparing the mock-up), Wout van Bommel (measurement equipment advice), Jan Diepens (lighting mock-up advice) and Marielle Aarts (evaluation of lighting design). I would also like to thank statistics department employees of the TU/e who advised me on statistical analyses methods, and Bruel&Kjaer employees, who provided the sound measurement tool details to enable us to automate the measurements. Last but not least, are my thanks to ir. Harry Linskens, from Fontys Hogeschool Eindhoven audiology department, and Oliver Atack, Andy Officer, and Seb Jouan from Arup Acoustics for the acoustic tool, which was of great use for this research.
1 More information about BIS in phase 1 of this research.

Measurement of ICU Environment
31 May 2010
Functional Arrangements
This project is confidential. Maartje van Roosmalen is in charge of this project. She arranges meetings, informs the hospital, Arup, TU/e and other collaborators about things related to the project, and keeps everybody updated. She does all background research and other research related to this project. She designs the mock-up, gets it built, collects all data and analyzes all data. Within the TU/e Prof. Paul Rutten, Prof. Bas Molenaar, and Prof. Jan Westra are supervisors of this project. Within Arup Salome Galjaard is direct supervisor of this project and ir. Jaap Wiedenhoff is overall supervisor of this project.
Drs. Olga Peters Polman is contact person in the hospital and she provides Maartje van Roosmalen with patient related measurement data that the hospital collects, such as BIS data, data on heartbeat, blood pressure, etc. and patient personal information that is needed for the analysis. Maartje keeps track of what is happening and she does intermediate analyses of data to calculate how many patients are needed to provide sufficient data for statistical analyses and to check if everything is measured properly. Since nobody is available 24 hours a day 7 days a week, but there is always 1 doctor available (out of a group of 8 doctors per ICU), the entire doctors group will be instructed by Drs. Olga Peters Polman about how to couple and decouple the mock-up and how to start and stop measurements and when to shift the mock-up to the next ICU.
Reflection
As hospitals function 24 hours and medical staff are busy, it took our collaborators in the hospital about a year longer than expected to get the measurements of the patients’ sleep pattern prepared, which significantly delayed the entire measurement process. Therefore, sleep pattern data was available only for a few incomplete 24-hour cycles. This made it impossible to link the environment to the sleep pattern. Also, waiting for sleep pattern data for a year made it impossible to measure the environment of the other two ICUs. However, it gave me the time to do elaborate literature research on hospital design, to provide me with sufficient background knowledge about hospital design in general and about the effect of the ICU design on the patients’ sleep pattern in specific, which will be of great use for others and for myself in designing qualitatively better hospitals. Besides, the collaboration with Arup, the hospital and TU/e strengthened my management skills.

Measurement of ICU Environment
31 May 2010
SUMMARY
Phase 1 – Literature Research
Pharmacological assistance alone cannot achieve the desired quantity and quality of sleep in ICUs, not to mention its detrimental side effects. ICU environments can enhance the healing process if relatively simple stress-reducing sleep improving elements are incorporated into their physical design. Environmental interventions have been developed to reduce noise and disruptive staff patient interactions at night, to improve lighting and offer privacy, to provide positive distractions such as contact with nature and to assimilate color, or to maintain the daily light-dark cycle. They’ve shown favorable results. Focus, however, has been on the acoustic environment, ignoring the rest of the physical environment.
Phase 2 – Measurements & Analysis
11 months continuous measurements of the physical ICU environment indicate the following. Maximum average day and night sound levels of respectively 35dB and 30dB are always exceeded. Maximum peak sound levels of 45dB are exceeded 90% of the time during the day and 80% of the time during the night.
Illuminance levels in patients’ eyes are about twice as high in Summer as compared to Winter. Night time illuminance levels are near 0lux, though night time peaks exceed average daily levels. The maximum luminance contrast of 1:10 is exceeded about 90% of the daytime and 10% of the nighttime. The visual environment has the largest variation over a 24-hour period among all environmental variables. Therefore, the ICU visual environment is likely to be an important cause for patients’ sleep disruption.
As the temperature increases, the relative humidity decreases. The ambient and radiant temperature follow a similar pattern over the day, averaging around 24oC with peaks up to 35oC in the Summer afternoon. The relative humidity is on average 50% in Summer and 20% in Winter, and decreases in Winter up to as low as 10%. As 40% of the time in Winter the relative humidity decreases to below 20% and is always below 30%, Winter values do not comply with the recommendations, and air should be humidified in the Winter. The air velocity is on average around 0.1m/s in Winter and 0.2m/s in Summer over the entire day, with peaks reaching in the afternoon up to 0.6m/s in Winter and up to 0.9m/s in the Summer. The air velocity exceeds the maximum comfort level of 0.2m/s only 15% of the time in the Winter, and 60% of time in Summer. The CO2-level in the Winter is about 50ppm higher than in the Summer, and on average varies around 425ppm. Peaks reach up to 650ppm, thus never exceeding the maximum allowed 1000ppm.
Phase 3 - Design
Healing ICU designs are usually bigger than 5m by 6m and provide direct views outside for patients, visitors and staff through window and bed orientation, while not significantly reducing the volume-to-wall-ratio. To reduce staff disruption while allowing flexible visiting hours for increased social support, visitors should approach ICUs from the building perimeter. This perimeter zone functions as buffer zone between the fluctuating weather outside and the constant ICU environment. This way the distance between nurse stations, whether centralized or decentralized, and related facilities at the building core is reduced. The horseshoe layout provides short walking distance, proper visibility of patients by staff, and direct views outside for patients, visitors and staff. Separation of staff and visitors allows for space to move the bed that is positioned in the middle of a rectangular space with the bed length in the direction of the room width. A foldable couch and a desk are on the perimeter side, and medical facilities hidden if not used in the cupboard at the head side of the bed. Partially glazed walls between nurse stations, patient rooms and visitor’s perimeter allow cross vision and daylight transmission. Light shelves at the South deepen daylight penetration while reducing solar transmission near the façade, thus reducing glare. General artificial lighting with translucent covers reduce glare. Careful positioning of task lighting with cut-off angles, that focus light, prevents direct light in patients’ eyes. Emergency lighting, usually positioned horizontally, should be rotated 45O in the beam above the patient’s head. This prevents direct light in the patient’s face and blockage of light by doctors on each side of the bed, while focusing all light directly on the patient’s body.

Measurement of ICU Environment
31 May 2010

Measurement of ICU Environment
Page 1 31 May 2010
Contents Page
1 Introduction 2
1.1 What? 2
1.2 Why? 2
1.3 Who? 3
1.4 Where? 4
1.5 When? 5
1.6 How? 6
2 Analytic Approach 13
2.1 Observations 13
2.2 Pilot-test 24
3 Measurements 39
3.1 Tools 39
3.3 Validity & Assumptions 51
3.4 Boundary Conditions & Limitations 52
4 Results 56
4.1 ICU Physical Environment Conditions 56
4.2 Sleep Pattern 70
5 Conclusion 75
6 Future Research 75
6.1 Future Research 75
6.2 Comparisons of Environment vs. Sleep Pattern 75
6.3 Variables & Relations 76
6.4 Visual Environment vs. Sleep 80
6.5 Acoustic Environment vs. Sleep 81
6.6 Thermal Environment & Indoor Air Quality vs. Sleep 83


Measurement of ICU Environment
Page 2 31 May 2010
1 Introduction This document contains the research done by Maartje van Roosmalen - Master student of the department Physics of the Built Environment and of the department Architecture at Eindhoven University of Technology and intern at Arup Amsterdam - in collaboration with the University Medical Centre Groningen (UMCG), on effects of the environment on patients’ sleep disruption in Intensive Care Units.
The research plan is defined in 1.afstudeerplan_30102009.doc. Phase 1 of this research, which was completed as part of Master Project 3 and can be used as reference material for this research, included literature research on the effect of the environment on patients’ health and comfort and literature research on ICU guidelines. This document is phase 2 of the research, and describes the analytic analysis, the measurement set-up and the measurement results of this research. Phase 3 of this research describes the implementation of the knowledge derived from phase 1 and phase 2 into designs of healing ICUs.
This phase of the research describes the physical condition of the ICU in the UMCG quantitatively and to provide qualitative information about this and two other ICUs. The report structure follows the research strategy:
1. What, Who, Where, When & How measured?
2. Analytic Analysis of ICU Environment
3. Design Mock-up & Measurement of Environments & Sleep Patterns
4. Results & Analysis of data
5. Conclusion
6. Future Work
1.1 What?
This phase of the research is foreseen to describe the physical condition of the ICU in the UMCG quantitatively and to provide qualitative information about this and two other ICUs, and to check compliance with guidelines for hospital ICU design. All the environmental variables2 that could influence the patient sleep pattern are measured. The next stage is to analyse the relationship between the environment and patients’ sleep patterns.
A custom made mock-up is placed around the selected bed in the ICU, focussing on the near environment. The equipment used for the research cannot in any way influence the equipment used at the ICU. Since the beds can be moved any time, the mock-up should be easy to remove. This is achieved by fixing all measurement tools - that need to move up and down with the bed – to one unit clipped at the head side of the bed.
Data is collected continuously and automatically logged. Additional one-time measurements, like the pilot-study, are done shortly before the start of the measurement.
1.2 Why?
The importance of this research is described in the project proposal3. The data collected in this research is used to answer the following questions about the physical environment, and as input for future research about the relation between the environment and sleep patterns:
How can the ICU environment qualitatively & quantitatively be described? o What is the average, mean, and peak illuminance level in the patients’ eyes
during the day and the night? o How often do certain illuminance levels occur in the patients’ eyes during the
day and the night? o What is the rhythm of illuminance changes?
E.g. how often does how much change in illuminance level occur during the day and the night?
2 Which variables are measured how and when is described in the last section of this chapter. 3 1.afstudeerplan_30102009.doc

Measurement of ICU Environment
Page 3 31 May 2010
o Idem for the other variables like noise level, luminance level, etc. o Comparison
Does each of the three ICU environments satisfy the requirements given in the guidelines?
What are the differences between the environments of the three ICUs?
How do the results relate to results of other literature? What new insights does this research give?
How can the patients’ sleep patterns qualitatively & quantitatively be described? o Quantitatively: What is the total sleep time vs. total awake time? o Qualitatively: Rhythmicity: how can the patients’ sleep patterns be
visualized? o Qualitatively: What sleep stages can be identified? o Qualitatively: What is the arousal and wakeness index during the day and
the night? What is the environmental influence on the patients’ sleep patterns?
o Is there a significant correlation between a/more environmental variables and the occurrence of arousals and awakenings of the patient or the total sleep time of the patient?
1.3 Who?
We measure the sleep pattern of the patients in the measurement bed. The bed may be occupied by several different patients during the research, who are very likely to have different illnesses or other personal variables as described in the report, which influence the bio-rhythm of the patient in different ways. This information will not be taken into account directly. That means that we do not sort patients on personal variables. Since the focus of our research is the influence of the environment on the patient, we assume that if we measure for a high number of patients, the differences in personal variables of patients and therefore their possibly different reaction to the environment is not of significant influence on our results.
Each patient we measure the sleep pattern for, we measure for as many 24-h cycles as possible. The physical parameters of the internal climate in general vary over the day, but also per season. Not only the value at that moment is for that reason important for this research but mainly the variation of the different parameters during the day and night. Doing so we can on the one hand say something about the mean values of parameters over time. On the other hand it is important to relate the change of the different parameters over time to e.g. the natural circadian rhythm of human beings. The difference in illuminance between the day- and night situation for example can influence this.
Using power analysis we can calculate what the total number of patients and/or 24-hour cycles should be, if we know the standard deviation. Once we start the measurements we do not know the standard deviation of the population, but throughout the measurements we will get to know the standard deviation, and therefore throughout the measurements we can decide how many patients and/or 24-hour cycles we need, and thereby we can decide to measure for a longer time or quit early. However, as we didn’t manage to measure the minimum number of sleep cycles for the first ICU, we decided to keep the analysis of the other two ICUs to pilot-study only, and keep the measurement of these ICUs for further research.
Min. number of 24-hour cycles required per ICU is initially assumed to be 10, since we see in [Dij’08]4 [Zim’08] and [Ulr’04], which are of the latest review theses, that 10 patients is the minimum number of patients used in these articles to be accepted as a good Evidence Based Design. Assuming 1/3 of the time5 there won’t be anybody in the bed, for 3 ICUs minimally 30 24-hour cycles are required, so we initially estimate about a month of measurements per ICU. Unfortunately while we measured the ICU environment for 11 months the UMCG did not manage to measure the sleep pattern of more than 3 patients.
4 See summary in appendix 5 Based on assumptions approved by the UMCG before the start of this research. Assumptions were based on the time spent by other research to measure at least 10 patients in a hospital.

Measurement of ICU Environment
Page 4 31 May 2010
This resulted in only a few, incomplete 24-hour cycles of sleep patterns, thus insufficient for this research to analyse the effect of the environment on the sleep pattern. In future research we will include measuring the sleep pattern for healthy students who spend some nights at the ICU, to compare the sleep patterns with those of sick people, and see if the ICU has the same effect on healthy people as it has on sick people. The problem with getting sleep pattern data was not so much the lack of patients in our measurement bed. The problem had to do with the delay of 5 months by the UMCG in preparation of the tools to measure the sleep pattern, the lack of time of the responsible person in the UMCG to do sleep pattern measurements, the fact that many ICU patients cannot have a sensor on their forehead due to damage of their forehead, and the fact that many ICU patients don’t want to contribute to this research as the UMCG doesn’t provide them anything in reward. In future research we will try to solve this problem.
Since the results will be related to the experience of the patient, measurement points are chosen as close as possible to the patient. However, the researchers have to take into account that they cannot bother the patient or interfere with the work of the staff, meaning that no measurement tool, besides the BIS measurement which will be done by the UMCG itself, can be positioned on the patient or employee or such that it bothers the patient or employee, and all measurement tools should be fixed such that they can be removed all at one go whenever the hospital bed needs to be taken somewhere else. The tools can’t come along with the bed since we only got permission for measuring at the ICU and since the patient might change the bed, which makes it difficult to get the tools back to the ICU.
The hospital looks into the necessity of getting permission of patients and family to execute the research. ‘Patients and/or their families gave written consent prior to their participation, though the patients did not know what the research was about to keep them behave regularly.’ [Gaz’01]
Staff is informed by the UMCG about the research and instructed to behave as normal. They are told by Olga Peters that we are measuring the environment of the ICU, which means we do not measure the staff’s qualities, and that therefore they should behave as normal. The staff is not informed about the purpose of the research, since this might influence the results.
1.4 Where?
The research is done at the ‘Universitair Medisch Centrum Groningen’ (UMCG) in the Netherlands.
Measurements are done first in the ICB, and in future research in two other ICUs (one after another). There are 4 ICUs at the UMCG. Part of the building has had a large renovation recently, while some other ICUs will be renovated soon. The intention is to analyze the

Measurement of ICU Environment
Page 5 31 May 2010
internal climate of 3 ICUs. The choice of the ICUs depends on the expected differences in indoor climate and differences in architectural design. The ICUs chosen are the ICB (Intensive and Respiratory Care), the CHIC (Chirurgic Intensive Care), and the THIC (Thorax Intensive Care) of the UMCG. These ICUs are dealing with patients who all need different medical help, but with roughly the same requirements for environmental design, namely a healthy and comfortable environmental design. The 3 ICUs chosen are very different in layout, room height, view outside and interior design, and possibly also in their physical environment, since their time of being built6 and their purposes differ.
The comparison of the results of the environments of 3 different ICUs is done to get an average of ICUs in general, and to see how different the environments of ICUs are as compared to this average, and therefore to see how much influence the visual and spatial design have, besides the influence of the physical environment, on the sleep pattern.
At each of these ICUs the environment of the area around the one most representative – meaning the view from the bed is the most representative, since it shows all three aspects visible from any bed at the ICU, there is direct view at staff centre, entrance door of ICU, and medicine counter, and average noise level (equally far from noisiest as from most quiet place) – bed is measured. Doctors aim to increase the occupation of this bed for this research resulting in frequent change in patient in our measurement bed, to be able to get measurements of many different patients, to eliminate the influence of personal variables on the measurement results. Besides, the number of people passing by this bed has influence on the choice, and this is for the measurement bed roughly the average of the number of people passing by other beds in the ICU. The most representative bed is chosen by the UMCG. All ICUs at the UMCG use only one type of acute care bed.
1.5 When?
This study was performed between February 2009 and May 2010. The measurements took place between June 2009 and May 2010. A nonstop measure-period for the periodic measurement is preferably minimally 24 hour. This way, variations during the day can be analyzed. Besides, measuring nocturnal sleep alone is insufficient, as literature like [Gaz’01] indicates. Total sleep time in ICUs is redistributed over a 24-h period, therefore, continuous environmental measurements is done for x periods of 24-h in this research, to adequately characterize sleep-wake patterns.
To be able to recognize an average day-pattern, to be able to measure enough patients, and to eliminate or average out personal factors and weather circumstances influencing the measurement results, we measure the parameters during at least one month at each ICU.
In most buildings the internal climate will vary per season which makes it important to measure in a period which is representative of the average of the year. However, as the ICU should always comply with indoor climate requirements, it is more interesting to compare extremes, as far as weather conditions in Holland can be extreme. As our measurements span over one entire year, from May 2009 to May 2010, any differences in influences of the external climate per season are noticed.
The measurement tools and logging equipment are checked regularly by Maartje van Roosmalen. She goes to the UMCG to check this after the first, second, and fourth week of measurement. If no problems occur, Olga Peters will take over this regular check. She is instructed as far as needed about how to use the equipment, meaning how to switch it on and off and what the equipment should indicate. This is also described in a short document called ‘handleiding_meetopstelling_date.doc’ that is provided to the hospital. As the entire measurement process is automated and Maartje can see and adapt the progress online, Olga’s actions are limited to fixing internet connections. After the first ICU is measured, the data is analyzed by Maartje van Roosmalen. Olga Peters Polman transfers the mock-up to the other ICUs. After the measurements are done Maartje van Roosmalen picks up the
6 The time of being built influences the ICU design since only lately the concept of ‘healing environment’ and the concept of the visual and spatial environment influencing the healing process has been accepted and applied in ICU design.

Measurement of ICU Environment
Page 6 31 May 2010
mock-up from the UMCG to bring it back to Eindhoven University of Technology. Intermediate analyses and the final data analysis are performed by Maartje.
1.6 How?
Observation: Not all aspects of the ICU environment are taken into account in a measurement of the physical environment, where we only measure and not record anything. By observing the environment and writing down what happens, e.g. whether nurses pass by closely or check the patient regularly, for a certain period at certain times of the day and night, certain aspects like the influence of the medical staff, the patient and the visitor on the ICU climate can be analyzed from these observations related to the data of the measurements. However, since we are interested in objective measurements of the environment and the sleep pattern only, we are not interested in the influence of medical staff or visitors directly, but indirectly in what changes of the environment they cause, e.g. increase of noise level. Therefore, we do not do any observations besides the analytic description of the visual and spatial environment, which includes environmental aspects like wall color, room dimensions, etc.
Measurement: The following section describes which variables are measured using which tools during the actual measurements and during the pilot-study. Whenever a measurement starts, all the equipment is started. All data measured is logged with the (starting) time of the measurement to prevent complications with data synchronisation. The first data used for analysis is the measurement time for which all measurement tools have results. If data from any measurement tool is missing throughout the measurement, the data from other equipment during this time will not be taken into account for the analysis. The software used for data synchronization and analysis are Excel, Microsoft Access and Visual Basic. The following table contains the measurement parameters, tools, intervals and locations.
Table: Overview of measurement parameters, tools, intervals and locations 1. Variables – Lighting LUMINANCE (brightness [cd/m2]): light stream per surface area which the surface
sends (reflects) in the direction of the eye.
Why – The luminance levels of a surface is what mostly influences the lighting experience of a person. The colour of the surface highly influences the luminance level, as does the contrast between different surfaces.
What – The contrast in luminance of different surfaces the person looks at should be adapted to the preferred bio-rhythm of a person. High contrast can be used to attract attention –not to bother the patient- when a person is awake (day time), however too high contrast might hurt the eyes. A black surface next to a white surface or next to a lamp creates a strong contrast in luminance, which can be painful for the eye. Low contrast should be used at night. The luminance levels should be lower at night as compared to the day time.
Where – Luminance levels should be measured close to the eye. It is important to know at which surfaces the patient is looking.
How – Luminance meters are available on the market, but they will have to be adapted to the preferred measuring conditions in the ICU. A normal luminance meter is too big to put on a hospital bed, and it only measures in one direction. We modified an illuminance measurement cell (Hagner cell) with a cone to indicate the surface area which is taken into account. We positioned multiple of these modified Hagner cells on half a sphere to get the luminance of all areas the patient might be looking at. We calculated the length of the cone such that each -for the patient visible- surface is taken into account without any overlap or gap (see plan and section indicating angle per cone, in the report section about the measurement set-up). The average luminance of that surface is taken. We can fix the luminance

Measurement of ICU Environment
Page 7 31 May 2010
measurement tool on the top part of the bed, since whenever the patient positions his bed in a sitting position, the top part of the bed with the measurement tools fixed on it is placed under the same angle, so we roughly know horizontally at which height the patient is looking, without bothering the patient with our measurement tools. The measurement tool which is fixed on the top part of the bed should be easily removable if the bed suddenly needs to be taken away.
Pilot-study – The points with highest luminance will be measured (according to the Dutch norm ‘daglicht protocol’) during the day with no lights on, to check whether they satisfy the requirements, and to be able to provide improvement recommendations in future.
Tools:
Luminance half-sphere (light) meter made of modified Hagner sensors Light box & Laptop with Program Multilight version 1.0 (license from TU/e)
Interval:
Every second7
Constraints/ Location:
Measurement tool fixed to the head side of the bed should move up and down with
the head side of the bed.
ILLUMINANCE (verlichtingssterkte E [lux]) Why – The illuminance is a way of describing the lighting levels in a certain
plane. A certain amount of lux is required for the hospital employees to be able to do their work, while the patients might prefer a lower light intensity to be able to sleep.
What – High lighting levels are not preferred at night time and vice versa. On the other hand, good lighting levels are very important for staff to do their work well 24 hours a day.
Where – Illuminance levels should be measured close to the eye. The light that is coming from 5 different directions (except from below) and thus which is falling on different planes should be logged.
How – 5 light cells could be placed on a small cube, directed to all 4 sides and the top. This cube should be placed close to the eyes of the patient – so positioned next to the luminance tool – measuring in this way the illuminance falling in the patients’ eyes from 5 directions. We also developed a special illuminance measurement tool with a frame around it in the shape of the face area around the eyes, to be able to measure exactly the amount of lux that falls in the patients’ eyes, which is less than without the frame, since our nose blocks light partly and the position of our eyes somewhat deeper back in the head reduces the amount of light falling in the eye.
Pilot-study – See description further down ‘illuminance per armature’.
Tools:
Selfmade cubic meter and eye-shaped illuminance meter (near patient) Light box & Laptop Program Multilight version 1.0 (license from TU/e)
Interval:
Every second, because the natural light outside, the on/off of lights and the up/down of bed changes the illuminance inside.
Constraints/ Location:
Custom made measurement tools fixed to the head side of the bed should move up and down with the head.
COLOR TEMPERATURE [K] and Light Spectrum (Wavelengths) per artificial light
7 Because the natural light outside, the on/off of lights and the up/down of bed changes the luminance inside

Measurement of ICU Environment
Page 8 31 May 2010
source, Color Finishes [RGB-value] & Reflection Coefficients [-] of surfaces
Why – Literature says that warm white light makes people feel sleepy, whereas cold
white light makes people awake [thesis_K_Dijkstra.pdf]. Dr. Joan Roberts indicated in
many papers the influence of the light spectrum on the sleep pattern of patients. Besides,
according to Frank H. Mahnke, purple, blue, and green colors (light colors or surface
colors) make people relax, whereas red, orange and yellow colors activate people.
Besides, guidelines provide rules for color finishes and reflection coefficients of walls,
ceiling and floor which have to be satisfied. In this research this information will be taken
into account qualitatively, however, in future phases of this research this information will
definitely be used.
What – We measure the color temperature of the lights patients are looking at and the
color finishes and reflection coefficients of the surfaces patients are looking at.
Where – The color temperature is measured near the light source, the color finishes and
reflection coefficients are measured at 1m distance from the surface.
How – Pilot-study – We point a color temperature measurement tool at the lights
(chromameter), and a reflection and color finishes measurement tool at the surfaces.
Color RGB value can also be estimated by comparing it with a color card.
Tools:
Chromameter, a color finishes meter, and a photospectrum meter
Interval:
Once (for each light and surface) in future research phases
Constraints/ Location:
Use excel conversion sheet of Jan Diepens for RGB values conversion.
ILLUMINANCE (per armature) & background illuminance [lux]
Why – Since we put a light on/off datalogger on all light sources at the ICU, we know
which light is causing a change in the measured illuminance near the patient’s eyes.
Further, we measure the illuminance per armature one time seen from the eyes of the
patient while there is no daylight, to find the illuminance of each armature separately on
the patient’s eyes. Besides, by comparing the illuminance measured one time directly
under the armature with the illuminance the producer provides in the lamp details, we
know the decrease of illuminance of a lamp due to oldness/dirtiness. We might use all of
this in a further future phase of this research.
What – The illuminance per armature at that time (which includes oldness factors, etc.)
directly below an armature and from a position close to the patient’s eyes, and the
background illuminance.
Where – Near the light source perpendicular on the light source, and from a position
close to the eye’s of the patient.
How – Pilot-study – We keep a Hagner cell near the window and on the work plane of
the Doctor, to check the illuminance requirements according to the ‘daglicht protocol’.
Further, we measure the illuminance on the work plane with the lights on, to check for the
requirements according to ‘NEN 1891 binnenverlichting’. Further we measure with the
cubic shaped and the eye-shaped tools for each light source switched on individually from
the point of view of the patient. To find the background illuminance during the night, the
illuminance can be measured with the cubic shaped and eye-shaped tools when the lights
near the measurement bed are off. To find the background illuminance during the day,
the illuminance can be measured with the same tools when the lights near the
measurement bed are off, and when the curtains or louvers are closed, so no daylight can
come in near the measurement bed.
Tools:
Individual illuminance measurement tool
Cubic shaped and eye-shaped illuminance measurement tools

Measurement of ICU Environment
Page 9 31 May 2010
Interval:
Once during pilot-study
Constraints/ Location:
No daylight
ARTIFICIAL LIGHTING ON/OFF [-]
Why – To later relate a patient’s sleep pattern, e.g. a sudden wake up, to the switching on
or off of a light source.
What – Registration for on/off changes for artificial lighting through change in resistance of
LDRs positioned on each neighbouring armature.
Where - A certain device, connected with the datalogger, is located at all light switches of
the ICU
How – The device sends a signal to the datalogger whenever a light is switched on or off.
The number of products depends on the number of armatures and the number of inputs of a
logger. The maximum number is taken as 15 LDRs.
Pilot-study – During the pilot-study we check how high the resistance of the LDR is per
light source being on. Like this we can analyse later whether a light source was on or off.
Tools:
LDRs stuck on each armature
Interval:
Every 30 seconds
Constraints/ Location
All neighbouring light sources around the measurement bed at the ICU need to be logged
DAYLIGHT ILLUMINANCE [lux], DAYLIGHT FACTOR [-]
Why – To know the influence of daylight as compared to artificial light (ratio). By subtracting
this one time illuminance measure of the lights that are on, and by subtracting the
background illuminance in the patient’s eye, from the measured illuminance in the patient’s
eyes during the normal measurements, we find the influence of daylight on the illuminance
in the patient’s eyes. We relate this to the sleep pattern of the patient to see which light
source(s) (artificial or daylight) has influence on the patient’s sleep pattern.
What – The amount of daylight in the room.
Where – Measurement needs to be done at the same time outside (vrije veld) and inside
(near window).
How – Pilot-study – Using a ratio number that indicates the ratio between the amount of
light measured directly next to the window and the amount of light measured at the point
near the head of the patient, we can calculate the influence of daylight on the total amount
of light near the patient. This ratio number is calculated using a measurement which is done
when all the artificial light sources are switched off. We have permission from the UMCG to
play with the light switches for a while during our pilot-study if there is no patient in the bed.
To calculate the Daylight Factor, which is required to check whether the ICU fulfils the
requirements, we measure the illuminance of a Hagner measurement tool positioned right
behind the window and around the same time outside in the ‘vrije veld’, both under a cloudy
(overcast) sky.
How – The cubic-shaped illuminance sensor has one sensor which is oriented at the
window, and this sensor therefore measures the daylight component every second. This
sensor does not register the background illuminance, but it might register the artificial light
illuminance. So if we subtract the artificial light illuminance of this sensor (which we know,
since we know which light is on when and we also know from the nul-meting how much
illuminance each light source produces in that sensor) from the totally measured illuminance
every second, than we know the daylight component in the patient’s eyes every second.
Tools:

Measurement of ICU Environment
Page 10 31 May 2010
Illuminance sensor and cubic and eye shaped illuminance measurement tools
Interval:
Once for pilot-study
Constraints/ Location
Measurement needs to be done at the same time outside (vrije veld) and inside (near window)
Variables – ACOUSTICS
SOUND LEVEL (L) [dB(A)]
Why – The sound level, frequency and repetition could influence patients’ sleep patterns.
What – By measuring the average sound energy of a certain interval continuously, the data
says something about the sound levels of the day and night. By looking at for example the
L1 and L90 levels within an interval, background noise and short loud noises can be
identified. The frequency can also be identified from this data. We will not be recording
sounds, since this would require permission from patients and/or family.
Where – The equipment (one tool) can be placed relatively close to the ear of the person.
Detailed positioning of the equipment for these measurements is less important compared
to the lighting data.
How – Pilot-study – Since we are not recording the sounds, it is difficult to define
afterwards what made the sound. To get an indication of what sounds possibly happen at
the ICU, and to make an estimate to objectively define the cause of a sound, we measure
the sound level and the frequency (octave band) of each sound, meaning the sound and
rhythm of all medical equipment separately, the sound of voices, etc. individually during a
pilot-study.
How – By measuring the sound level in the actual ICU per octave band, we can try to
analyze which sound level is caused by what.
Tools:
B&K 2250 Investigator
Interval:
For a while every second during the pilot-study
Every second, since short sounds can influence the patient
Constraints/ Location
Located at head side of the bed, should move with the patient’s head
Variables – THERMAL CLIMATE
AMBIENT AIR TEMPERATURE [oC]
Why – The ambient temperature is a governing factor defining the climate around the
patient. A temperature that is out of the temperature range which is preferred for most
patients, is likely to affect the state of wellbeing, and hence recovery.
What – The temperature should be measured at the level of the patient. Since it is highly
unlikely that the temperature will vary over the length of the patient (who is mainly lying
down), and most of the body of the patient is covered with a blanket, we only take into
account the ambient temperature near the head of the patient.
Where – A measurement should be taken near the head of the patient.
How – Any suitable device with accuracy to at least 1 decimal place, and which can record
data that is logged in a separate logger and later fed to a computer can be used. The device
in question should also be able to measure relative humidity so as to avoid an accumulation
of equipment around the patient.
Tools:
Thermometer integrated in RH meter
Interval:

Measurement of ICU Environment
Page 11 31 May 2010
Every 30 seconds, the temp. & RH are not expected to change much
Constraints/ Location
Located next to the bed
RADIANT TEMPERATURE [oC]
Why – Radiant temperature is a factor that, although it has secondary effects in ambient
temperature, is also essential in defining the thermal climate experienced by the patient and
which therefore affects comfort levels. Patients with a halogen lamp directed at their face
may feel discomfort for example, even if the ambient temperature around them is otherwise
reasonable.
What – Radiant heat is the electromagnetic radiation emitted from an object due to the
object’s temperature. The heat from a halogen bulb is an example of radiant heat.
Where – The measurement should be taken as close as possible directly above the head of
the patient, as this is the area of skin that is most likely exposed to radiant heat. The rest of
the patient is mainly shielded from radiant heat by the blanket of the hospital bed. It is also
important that the measurement is taken above the patient’s head, as radiant heat is
dependent on the angle to the source. For example, the radiant heat experienced from a
halogen lamp is greatest when directly under the lamp, and reduces as one moves to either
side.
How – Thermometer located near the head of the patient.
Tools:
Thermometer
Interval:
Every 30 seconds
Constraints/ Location
Located at head side of bed
RELATIVE HUMIDITY [%]
Why – Humidity acts in combination with temperature as a principle factor for comfort. In
artificially heated interior spaces, humidity will often drop below comfortable levels, causing
discomfort and a feeling of dehydration.
What – Relative humidity is defined as the ratio of the partial pressure of the water vapour
in a vapour/air mixture8 against the vapour pressure9 of water at a prescribed temperature.
Where – Relative humidity is likely to be constant in the area surrounding the patient,
unless a humidifier is located at a certain point close to the bed. The instrument can
therefore be located anywhere in the immediate vicinity of the patient.
How – A number of measuring devices are available on the market. The measuring device
should be able to log data that can later be downloaded onto a computer. It is also
recommended that the device measures both ambient temperature and relative humidity so
as to minimise the equipment around the patient. Models starting with “HX” measure only
the Relative Humidity; models starting with “HT” also include a temperature modifier or
sensor for which the output is changeable.
Tools:
Relative Humidity meter with thermo-meter integrated
Interval:
Every 30 seconds
Constraints/ Location
Location near patient’s head
Air velocity [m/s]
8 The pressure the water vapour would exert if it alone occupied the space taken up by the vapour/air mixture. 9 The pressure at a given temperature at which water is in equilibrium between its gaseous and liquid forms.

Measurement of ICU Environment
Page 12 31 May 2010
Why – Air velocity is also an important factor in the thermal climate and comfort levels.
Warmer conditions can be made comfortable if a breeze is supplied via a fan, for example.
On the other hand, unexpected draughts can be unpleasant, especially if conditions are
considered to be cold.
What – The rate of displacement of a certain amount of air in a given direction is measured.
Where – The measurements should be carried out close to the head of the patient. This is
because the rest of the patient is likely to be covered by a blanket, and therefore will not
experience the air flow to any great extent at other parts of the body.
How – There are a number of devices available on the market. It is important that the
device is capable of measuring air flow from any direction, as there is no standard or
constant air flow perquisite.
Tools:
Air velocity meter, which can measure air flow from any direction
Interval:
Every 30 seconds
Constraints/ Location
Located at the head side of the bed
Variables – INDOOR AIR QUALITY
AIR QUALITY [-]
Why – Air quality plays an important role in health. We need a certain standard of air quality
in order to survive. But air of a lesser quality, while being enough to survive, is nevertheless
detrimental to a person’s well being.
What – The quality of air can be affected by numerous things; particle pollutants,
contaminants such as Volatile Organic Compounds (VOCs), oxygen and CO2-levels, etc. It
is standard practise to ensure a certain rate of air exchange in a building, where fresh air is
brought in from outside, in order to ensure that the air quality remains within reasonable
limits. If the air exchange rate is too low, a build up of contaminants from indoor sources
and CO2-levels from the respiration of the occupants leads to a lowering of the air quality. It
is difficult, however, to measure air contaminants such as VOC’s. Therefore, it is more
appropriate to measure levels of CO2, which is not only a factor for air quality in itself, but is
also an indicator of the likely levels of other contaminants. If for example the CO2 levels are
high, then it can be deduced that the air exchange rate is low, and therefore there is a build
up in the levels of other contaminants.
Where – Given this it is highly unlikely that the air quality will vary to a significant level in the
environment directly surrounding the patient, the measuring equipment can be placed
anywhere in the vicinity of the bed. It should be noted however, that care needs to be taken
to ensure that there is no contaminant source near to the equipment.
How – CO2 can be measured by any standard datalogger.
Tools:
CO2-level meter
Interval:
Every 30 seconds
Constraints/ Location
Located next to the bed
The following table indicates what all measurement tools are needed. Table: Overview of required measurement tools Lighting Illuminance Hagner sensors:
-cubic shape illuminance measurement tool -half sphere with cones luminance measurement tool -eye frame illuminance measurement tool -light box

Measurement of ICU Environment
Page 13 31 May 2010
-one illuminance measurement tool to measure once near the window and below each light source
Acoustics B&K 2250 (microphone + converter + recorder) + extra flashcard to record more data and an extra cable between the microphone and the recorder
Temperature + RH -RH measurement tool with integrated ambient temperature meter -Radiant temperature measurement tool
Air velocity Air velocity measurement tool Air quality CO2 measurement tool Logger Datalogger for logging all variables except for sound, lighting and BIS PC Laptop
2 Analytic Approach The analytic approach can be divided in two parts, i.e. the observations and the pilot-test.
2.1 Observations
Several important environmental parameters related to the physical and architectural design are analyzed by visiting the 3 different ICUs a few times. Based on this information a first impression of the internal climate and atmosphere can be given. Aspects with a less direct relation with the internal climate can also be mapped in this way, like the number of people at the ICU during the day, the cleaning schedule and work schedules. These aspects can later be used to analyze the cause of a certain change in internal climate such as noises occurring. However, for this design stage we are not interested in causes of changes, but in how much the variable changes and whether this level influences the sleep pattern. In future, the parameters that describe the room can also function as input for computer analyses with which the internal conditions for different moments in the year can be simulated and with which the effects of changes can be estimated.
2.1.1 Spatial Environment
Every ICU consists of a space where the patients lay in their bed, a medicine counter and the nurse station for nurses and doctors to keep an eye on the patients. Usually there are also two types of isolation rooms in every ICU; one for patients who need to be protected against the environment and one for patients we need to protect the environment from.
Room properties
The following plans show the room properties of the ICUs where measurements were done. While the THIC and ICB are open (multi-bed), the CHIC has partitions between beds, which makes it something between a multi-bed and single-bed room. The following parameters are analyzed;
Aspect Spatial Comfort THIC: Oldest ICB: Middle CHIC: Newest
• Shape of the Room • Rectangle • L-shape C-shape
• Orientation/ location of the Room
• In center of the hospital
• Quiet environment of atrium
• North-west • Average noise
level, not busy road
• West • Average noise level, not noisy square
• Interior Design • Lots of cables hanging, old stuff
• Few cables hanging, average stuff
• Cables hidden in vacuum cleaner tubes, new stuff
• Functional Relation to other spaces
• Nurse station visual connection via glass windows
• Floor area [m2[ • Distance from façade
to opposite wall [m] • Room height [m]
• Small • Little • 2800mm
• Medium • Medium • 2700mm
• Medium • Medium • 2800mm

Measurement of ICU Environment
Figure: UMCG Plan; location of ICB, CHIC and THIC and their facade

Measurement of ICU Environment
ICB The 24-bed ICB at the first floor (see previous map of UMCG) is a relatively old ICU with 2 facades, the largest towards the north and the smaller towards the west. We use bed number 4 at this ICU, as indicated at the following plan, because this bed is occupied most often, the patient faces two entrances and the nurse station, and the location is according to the hospital representative for the environmental design and happenings of all the other beds. There are no partitions other than translucent curtains between the beds. On the head side of the patient is a window, so the patient cannot look outside while medical staff and visitors can.
Figure: Plan of ICB with measurement bed indicated
Measurement of ICU Environment
Page 16 31 May 2010
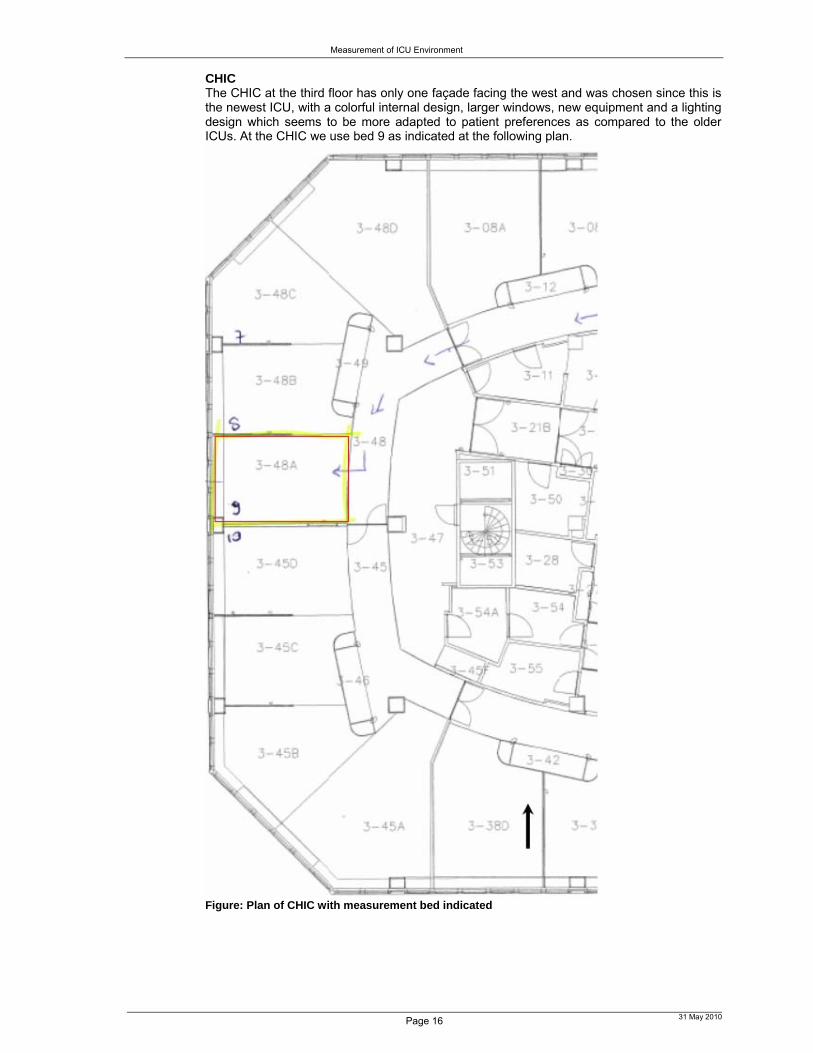
CHIC The CHIC at the third floor has only one façade facing the west and was chosen since this is the newest ICU, with a colorful internal design, larger windows, new equipment and a lighting design which seems to be more adapted to patient preferences as compared to the older ICUs. At the CHIC we use bed 9 as indicated at the following plan.
Figure: Plan of CHIC with measurement bed indicated

Measurement of ICU Environment
Page 17 31 May 2010
THIC
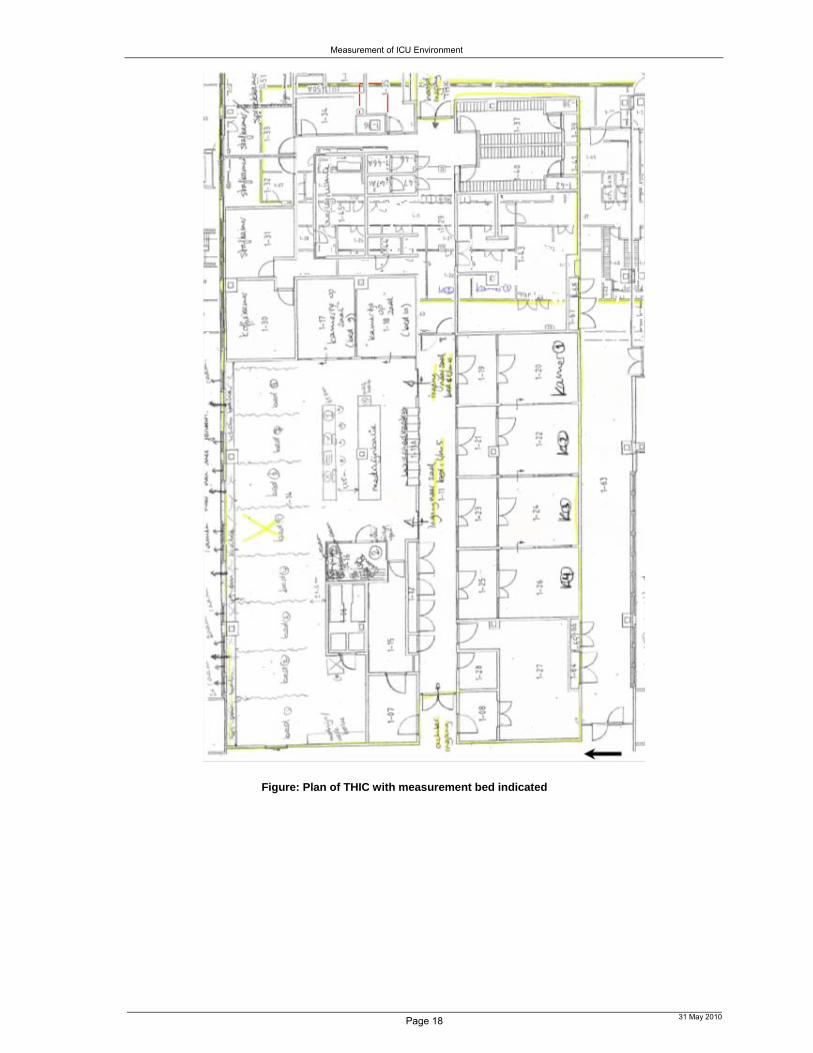
The last ICU we chose is the THIC, because it does not have any connection directly to the outside, and there are only windows on one side with a view at a large atrium with glass roof. This ICU is expected to get less solar radiation in summer and less daylight because of smaller window openings as compared to the ICB and CHIC. The equipment at the THIC and ICB is similar, however, the THIC is older and the ceiling is lower. At the THIC we use bed 5, as indicated in the following plans.
Figure: Plan of THIC with measurement bed indicated
Measurement of ICU Environment
Page 18 31 May 2010
Figure: Plan of THIC with measurement bed indicated

Measurement of ICU Environment
Page 19 31 May 2010
2.1.2 Visual Environment The visual environment and atmosphere can be qualitatively described as follows.
Aspect Visual Comfort THIC: Oldest ICB: Middle CHIC: Newest
Light
1. Daylight: 2. Location Windows 3. Orientation 4. Size 5. Distance between
windows 6. Day/ Sunlight Sun-
shading/ Obstructions/ Balcony
1. Daylight2. Daylight behind
patient 3. North (atrium) 4. Small 5. Large distance
between windows 6. Vertical rotatable
louvres
1. Daylight2. Daylight behind
patient 3. Mainly north, little
west (facing wall) 4. Medium 5. Little distance in
between 6. Vertical rotatable
louvers & external orange flexible sun-shading
1. Daylight2. Daylight behind
patient 3. West (facing
large busy square)
4. Large 5. Little distance in
between 6. Curtains
1. Artificial Light Type & Location
2. Lights above the bed facing down
3. Light above bed head 4. Light above window 5. Light above medicine
counter 6. Light above sink 7. Ambient lights
1. Artificial Light Type & Location:
2. 1 tube task light above bed
3. No 4. No 5. Large contrast of
task lighting with environment
6. Tube light 7. No
1. Artificial Light Type & Location:
2. 3 task tubes above bed
3. 1 ambient tube light facing up above bed head
4. 1 ambient tube light in diffuser frame above window
5. Task & ambient lighting above medicine counter
6. Tube light 7. 4 dimmable ambient
lights
1. Artificial Light Type & Location:
2. 2 dimmable task tube lights on side above bed
3. 1 task light facing patient body
4. 1 ambient tube light in diffuser frame above window
5. Task and ambient lighting above medicine counter
6. Warm white light 7. 2 dimmable
ambient circular lights
1. Artificial Light: 2. Task/ Ambient 3. Dimmable 4. Color temperature 5. Glare protection 6. Armature Type 7. Operation light visible
for patient
1. Artificial Light: 2. Only Task 3. No 4. Only Cold 5. Hardly 6. Tube light, metal
grid armature 7. Yes
1. Artificial Light: 2. Both 3. Yes 4. Both, merely cold 5. Little, by armature
cover 6. Tube light,
translucent cover 7. Yes
1. Artificial Light: 2. Mostly Ambient 3. Yes 4. Both, merely
warm 5. Yes: by direction
of light and armature cover
6. Different types, translucent cover
7. No View/ Aesthetics
• Colors • Few (white/greyish) -> depressing
• Few but brighter colors; yellowish/ grey ->cheering/ depressing
• Patients facing a red + orange wall -> activity, anger, excitement
• Materials • Artificial & cold • Artificial & cold • Natural & warm: Wood look-alike
• Direct View Outside • No, behind patient • Yes for staff
• No, behind patient • Yes for staff
• No, behind patient• Yes for staff
• View at • Staff center • Entrance door • Sink • Medicine counter
• Staff center • Entrance door • Medicine counter
• Red wall • Medicine counter
• Position / Visibility of Apparatus
• Everywhere • Hanging threads
• Both sides • Threads more
arranged
• Both sides • Threads covered
• Art • No • No • Yes: Cloud picture on ceiling, wood print
• Greenery • No (not inside and outside)
• No (not inside and outside)
• No (not inside and outside)

Measurement of ICU Environment
Page 20 31 May 2010
Figure: Daylight openings of respectively THIC, ICB and CHIC
Figure: Existing artificial lighting in THIC and view from bed at THIC
Figure: Existing artificial lighting in THIC

Measurement of ICU Environment
Page 21 31 May 2010
Figure: Existing artificial lighting at ICB
Figure: View from bed at ICB
Figure: Existing artificial lighting at CHIC

Measurement of ICU Environment
Page 22 31 May 2010
Figure: View from bed at CHIC
2.1.3 Acoustic Environment I spent a few days in the hospital to note all the possible causes of sound and a qualitative estimate of their influence. The following sound sources were found:
People talking
Medical Equipment
Alarms/Beeper
Aspect Acoustic Comfort THIC: Oldest ICB: Middle CHIC: Newest
• Sound level of Medical Equipment [dB(A)]
• Irritating background rouse, reasonably loud.
• Can hear the equipment from 6 beds further away
• Irritating background rouse, reasonably loud.
• Can hear the equipment from 6 beds further away
• Irritating background rouse, reasonably loud.
• Can hear the equipment from 6 beds further away
• Sound level of Alarms/ Beepers [dB(A)]
• Very loud • Very loud • Very loud
• Sound level of talking of staff & visitors [dB(A)]
• Very distracting as human ear starts listening to talks, hard to filter out,
• Very loud (much louder than expected)
• Very distracting as human ear starts listening to talks, hard to filter out,
• Very loud (much louder than expected)
• Very distracting as human ear starts listening to talks, hard to filter out,
• Very loud (much louder than expected)

Measurement of ICU Environment
Page 23 31 May 2010
2.1.4 Thermal Environment and Indoor Air Quality Besides measurements, a short analysis of the climate installations and factors of influence in a room is made.
Aspect Thermal Comfort & Indoor Air Quality
THIC: Oldest ICB: Middle CHIC: Newest
• Heating/ cooling: • Type • Measurements • Location
• Radiator • Small • Below façade
window
• Radiator • Size of 3
windows • Below façade
window
• Air Inlet and Exhaust:• Measurements • Location
• 0.5x0.5m • Both sides of bed
head, above walking area
• 0.5x0.5m • Both sides of
bed feet side, above medicine counter
• 0.5x0.5m • Both sides of bed feet side, near medicine counter
Figure: Heating by radiator at ICB
Figure: Ventilation devices of respectively THIC, ICB, and CHIC

Measurement of ICU Environment
Page 24 31 May 2010
2.2 Pilot-test
Before we can measure the (improvements of the) environment, we first need to know what to compare the values with to be able to say whether there is a peak or not, and to be able to recognize what caused this peak. These values that are there 90% of the time are called the values of the pilot-test10. While designing an improved ICU in this research simulation is used to analyze the effect of changes in the lighting design or environmental characteristics. To be sure that the results of the simulation are the same as the real situation, the results have to be validated. The daylight factor, which is derived from measurements, will therefore be compared to the daylight factor which is calculated by the software. The daylight factor can be determined by determining the ratio between the horizontal illuminance in the room and the illuminance outside. At several points in the room the illuminance therefore needs to be measured at the same time inside and outside. To be able to also say something about the lighting at the other locations in the room and at other moments of the year (with other daylight), a simulation of the different light parameters with lighting software (e.g. Radiance or DIALux) can be made in future research.
2.2.1 Visual Environment How – Analysis Method
The daylight and artificial light quality of the ICU are evaluated on the following aspects:
Daylight Quality: The daylight protocol is used for the analysis of the daylight situation. The daylight quality of a room is evaluated on the following aspects:
o Solar radiation transmission
o Daylight transmission: this indicates the minimum amount of daylight in the room and is given by the ‘Daylight Factor’;
Daylight Factor [-] (min. daylight) for a CIE overcast sky This is the ratio between the daylight illuminance – direct and
indirect – in a given point in a room coming from a CIE overcast sky and the daylight illuminance outside 11 with the same sky model.
Illuminance E; The light stream per unit of surface which is received by a surface in [lux].
External reflections, window transmission and internal reflections are taken into account, the sun is not taken into account.
Sky factor (average daylight); This is the ratio between the illuminance directly coming from daylight from a uniform sky in a point at the horizontal surface and the illuminance of a clear uniform sky. Meaning; windows without glass, no reflections, geometrical, no sun.
o Glare
o Luminance ratios; Luminance L [cd/m2];
o The – in a certain direction - radiated light stream per (on the direction projected) surface Asch and per solid angle given in [cd/m2].
o Luminance measurement of surface: 1. Surface within measurement angle 2. Distance between measurement tool and surface > 1m 3. Solid angle should remain the same 4. Average luminance over large surface
Equal out over multiple points Measure luminance tool with larger opening angle 2
degrees 5. Position of measurement tool and orientation is written down
o Luminance measurement of eye field: 1. Measure at eye height, 1.8m for standing, 1.2m for sitting 2. Glare: UGR- average luminance of eye field as compared to
luminance of light source
10 also called ‘nul-meting’ in Dutch 11 Also called ‘vrije veld’ in Dutch

Measurement of ICU Environment
Page 25 31 May 2010
o Maximum luminance armature/ bright surfaces; from critical positions
o View outside:
Obstructions
For each of the measurement points 12 for the daylight measurements, the obstruction-component is determined as follows, where A is the height of the obstruction as seen from each measurement point. Using the vertical distance between each A1, A2, etc. and eye-height (taken as 1200mm), and using the horizontal distance between the measurement point and the window, the obstruction angle can be determined.
Artificial Light (Dutch Norms NEN EN 12464 and NEN 1891):
o Illuminance [lux]
Illuminance of each light13
Too high or too low illuminance in certain points in the room: The light stream per unit of surface which is received by a surface in [lux].
o Glare
o Reflections on computer screen
Reflection; Diffuse reflection: ρdiffuse = π*L/E Reference reflection surface: ρdiffuse =(Lopp/Lref) ρref
o Uniformity of lighting; Light intensity E:
The light stream per unit of surface which is received by a surface in [lux].
What - Model
The following aspects which might have influence on the measurements/ calculations – in relation to the validity of results - are taken into account and are discussed below:
Input
Measurement tools
Measurement grid similar to calculation grid
Environmental factors
Input
Daylight
12 The measurement points for daylight and for artificial light are indicated in section 0. 13 Comparing this with the original value given by the producer of the light we see the degradation of the light.

Measurement of ICU Environment
Page 26 31 May 2010
The measurements for daylight are done according to the daylight protocol in the points indicated in the following plan of the furnished ICU. This plan indicates the view direction of the doctor while he is working on the computer and at the same time checking the face and skin color of the patient.
Figure: Measurement grid daylight
Measurement of ICU Environment
Page 27 31 May 2010
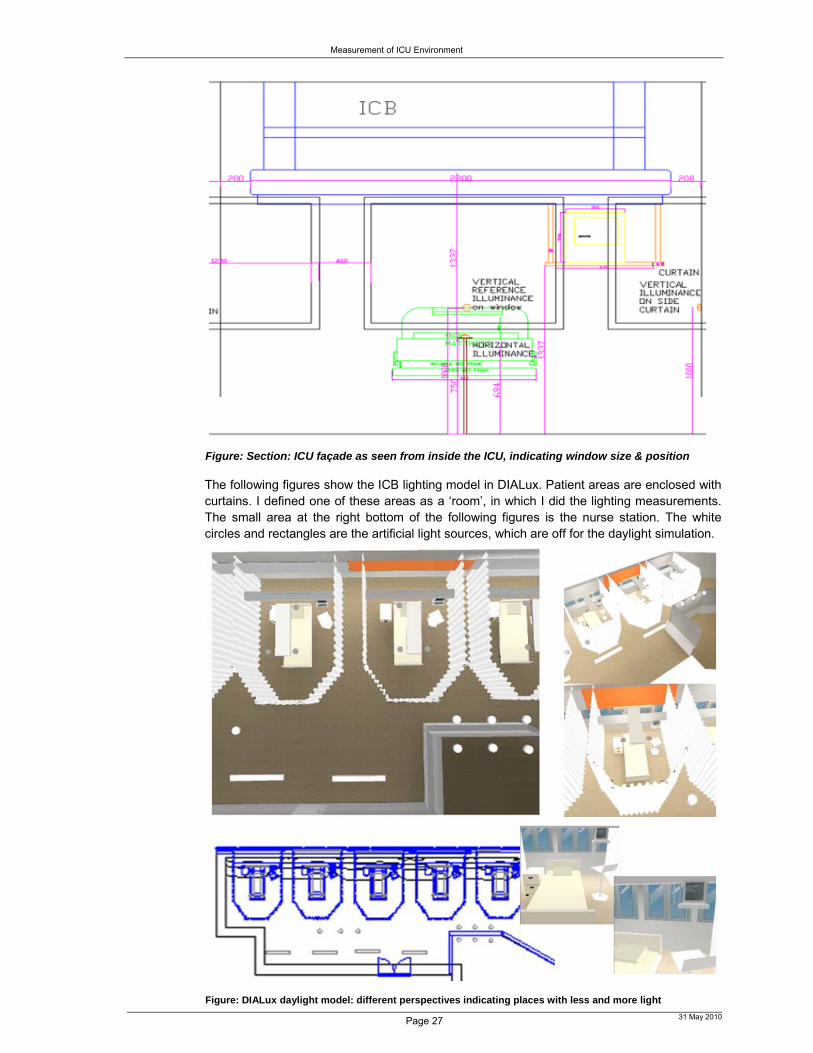
Figure: Section: ICU façade as seen from inside the ICU, indicating window size & position
The following figures show the ICB lighting model in DIALux. Patient areas are enclosed with curtains. I defined one of these areas as a ‘room’, in which I did the lighting measurements. The small area at the right bottom of the following figures is the nurse station. The white circles and rectangles are the artificial light sources, which are off for the daylight simulation.
Figure: DIALux daylight model: different perspectives indicating places with less and more light

Measurement of ICU Environment
Page 28 31 May 2010
Artificial light
The net voltage used is 230V AC. The lamps are switched on min. 30 minutes before the measurements are done, because it takes a while for the light stream to become stable. The measurements for artificial lighting are done without any daylight in the points indicated in the following plan of the furnished ICU. This plan indicates the view direction of the doctor while he’s working on the computer and concurrently checking the patient’s face and skin color.
Measurement Grid
The distance between measurement grid points, at 0.85m height, is calculated according to [figure C1 NEN1891]. The measurement points14 are indicated in the following plan [table 1, NEN1891].
Figure: Measurement grid artificial light Table: Used lighting and armatures at the ICB
14 Height of light source = 2.80-0.75=2.05m. 2.05m*1/3=0.68m<3m, so the number of measurement points is 4.2m/0.68m=6.18 so rounded up gives 7 measurement points at 4.2/7=0.6m distance in between. The first measurement point has a maximum ½*0.6m distance from the wall.

Measurement of ICU Environment
Page 29 31 May 2010
The following plan and the above table indicate which artificial light sources are applied in the design of this ICU, and lights with similar characteristics are used as input for the DIALux 3D design. The characteristics of those similar lights are given in the following table.
Figure: Plan of ICB with lighting location and type indicated Table: Characteristics of (similar) lighting and armatures used at the ICB
Code Lamp Type Height [m]
Color Rendering Index (CRI) [Ra]
Glare UGR-value [-] Code
X8 Fluorescent lamp 2.80 >90 17.5 X8 X9 Compact fluorescent
lamp 2.80 >90 17.0 X9
51 Fluorescent lamp 2.40 50-70, while master TLD is >90
19.9 51
91 FBH 2.80 >90 25 91 5G TBS 2.80 >90 no UGR table displayed 5G 2S 4-pin compact
fluorescent lamp 2.80 82 17.3 2S
S8 Compact fluorescent lamp
2.80 >90 18.9 S8
5E Fluorescent lamp 2.80 50-70, while master TLD is >90
no UGR table displayed 5E
In the following layout we see the location of the lights and the measurement bed indicated, where light no. 2, 3, 4, 5 and 7 are ambient lighting, where light 6 (+ambient lighting) is

Measurement of ICU Environment
reading light, where light 1 (+ambient lighting) is used for short term investigation, and where light 8 (+ambient lighting and investigation lighting) is used for long term investigation or emergencies.
Figure: Luminaries layout Figure: Luminaries parts list Measurement Tools
The following measurement tools are used for the daylight and artificial light analysis.
Measurements
Luxmeter Calibrated Correction eye-sensitivity Cosine-correction
Chromameter Determine color temperature of
artificial lighting [K]
Luminance-meter Small area; measure analge max.
2 degrees Average luminance area->size
angle

Measurement of ICU Environment
Page 31 31 May 2010
Figure: left; luminance measurements, right; optimal clarity shading illuminance measurement
Figure: horizontal illuminance measurement Figure: vertical ref. illuminance measurement
Figure: illuminance measurements Figure: optimal clarity shading measurement

Measurement of ICU Environment
Page 32 31 May 2010
Results - Daylight-card
Sun-shading Type: Vertical louvers (int.), automatic movable overhang (ext.).
Room Measurements lxbxh: (25,0m without, 4.2 with curtains) x (8,0m without, 4.2 with curtains) x 2,8m
Daylight Distribution
The daylight distribution at the workspace and at the wall for the different situations are given below, where the value of the y-axis is the light intensity in the room divided by the reference vertical light intensity.
‘Daylight Factor15’ on workspace ‘Daylight Factor’ on wall Sky Component16 Point 1 (distance from window 1m, height 1.20m): 14.4%17 Point 2 (distance from window 3m, height 1.20m): 5.35% Point 3 (distance from window 5m, height 1.20m): 2.66% Point 4 (distance from window 7m, height 1.20m): 1.47% Point 5 (distance from window 9m, height 1.20m): 0.83%
Illuminance [cd/m2] Ratios Sun light: Optimal sun-shading 118 : 3619 : 18020 No sun-shading 1 : 70 : 26021 Overcast sky: The way it was 1 : 1.40 :2.722 Optimal clarity shading 1 : 1 : 3.723 No clarity shading 1 : 2.70 : 4.8424
Situations
Sun-shading the way it was Optimal sun- & clarity shading No sun-shading
15 ‘Daylight Factor’ is the ratio between the light intensity in the room and the light intensity on the façade. 16 Belemmeringscomponent van obstructies voor het raam 17 I take the ((angle top window – 1.20m) – (angle point A – 1.20m))/360o*100%, so obstruction angle/360o*100%) 18 Computer screen 19 Window with sun-shading 20 Window sill, Illuminance > 4000cd/m2 21 Illuminance > 4000cd/m2 22 Movable table below pc 23 Line on window sill below clarity shading 24 Line on window sill below clarity shading

Measurement of ICU Environment
Page 33 31 May 2010
Building: UMCG25 Transmission glass: 0.72 (estimate for double glass)
Floor, room nr.: Intensive Care Sun-shading: Movable overhang (external)
Address: Hanzeplein 1 Clarity shading: Vertical louvers (internal) City: Groningen Daylight system: - Country: The Netherlands Color & reflection factor
walls: Cream, reflection factor 0.50
Orientation: north Reflection walls: Diffuse Internal length (m): 25.0 Color & reflection factor
floor: Yellow/brown, reflection factor 0.20
Internal width (m): 8.0 Reflection floor: Reflecting Internal height (m): 2.8 Color & reflection factor
ceiling: White/grey, reflection factor 0.72
Glass surface (m2): 1.1685 Reflection ceiling: Diffuse Window height (m): 0.95 Occupancy: 75% Height wall26 (m): 0.8 Function of room: Intensive care Glass type: Double glass Tasks in the room: Operation Glass color: Clear Overcast sky date: 04-06-2009 Clear sky date: 22-06-2009
View Outside/Glare
The view outside in all points is evaluated as bad, since there is a huge obstruction. The chance of glare occurring on the computer screen is small, as a consequence of the obstructions outside, the clarity shading which is almost always used, and the not too large glass surface. However, glare caused by differences in luminance are likely to happen, since the user focuses the window.
Building & Façade from outside View outside View outside with sun-shading
25 Universitair Medisch Centrum Groningen 26 Opaque wall below window

Measurement of ICU Environment
Page 34 31 May 2010
Results - Artificial light quality
Artificial Light Requirements
The results of the measurements of the artificial lighting are presented below. They need to satisfy the following requirements set by the Dutch NEN norms [NEN 1891]:
Max. luminance ratio 1:3:10
o Between the visual task (e.g. paper) and the immediate environment (e.g. the work pane), the luminance-ratio cannot be higher than 3.
o Between the visual task and the periphery (other surfaces in the room), the luminance-ratio cannot be higher than 10.
Min. lux levels:
o 100 lux general lighting, measured at floor height o 300 lux task light for reading, measured at 0.85m height o 300 lux for general short term research by doctors, measured at 0.85m height o 1000 lux for long specialized research and treatment, measured at 0.85m height o 5 lux for observation at night, measured at floor height
Glare; UGR<19
Uniformity average u0≥0,3 at floor height, u0≥0,7 in reading/detail work area
Color-appearance Index (for research and treatment): Ra>90
Illuminance [lux] (Measurements according to NEN 1891) The measured illuminances [lux] in each measurement point with only general/ambient lighting on are as follows.
Table: illuminance per measurement point for general lighting at 0.85m height 2.4 515 337 247 121 138 1601.8 557 378 241 138 136 1501.2 557 388 241 138 136 1500.6 515 377 227 139 138 143
M 0.6 1.2 1.8 2.4 3.0 3.6
Table: illuminance per measurement point for general lighting at floor height
2.4 317 269 159 156 165 1981.8 340 232 61 56 94 1561.2 343 208 18 25 77 1480.6 340 25 146 199 174 175
M 0.6 1.2 1.8 2.4 3.0 3.6
The average illuminance in the room is Eav.= 261.1lux at 0.85m height, and 170.0lux at floor height. The minimum illuminance in the room with general lighting is Emin=121lux at 0.85m height and 18lux at floor height, which does not satisfy the requirement. However, this low value is below the bed and tables. Therefore, we do not take into account the values which are below objects blocking the light (purple area). Then we see that the lowest value is 146lux. This satisfies the requirement of a minimum illuminance of 100lux measured at floor height. The uniformity index at 0.85m height is u0=Emin/Eav.= 121/261.1=0.46 and 146/170.0=0.85 at floor height (if we do not take into account the values measured below the bed), which satisfies the requirement of u0≥0.3 at floor height. If we take away the bed and redo the measurements in an empty ICU room, the design satisfies the requirement as well, as can be seen in the simulation in DIALux in the next section.
The measured illuminances [lux] in each measurement point at 0.85m height for reading light and for investigation light for short term investigations are very similar to the ones simulated and indicated in the next section. Therefore, they will not be shown again in this section.
The measured illuminances [lux] in each measurement point at 0.85m height with both general lighting and emergency lighting on are as follows.

Measurement of ICU Environment
Page 35 31 May 2010
Table: illuminance per measurement point for general & emergency lighting 2.4 743 1100 1130 880 800 8001.8 872 1400 1560 1440 1400 9301.2 878 1400 1560 1440 1400 9300.6 780 1100 1130 880 800 800
M 0.6 1.2 1.8 2.4 3.0 3.6
The average illuminance in the room is Eav.= 1089.7lux at 0.85m height. The minimum illuminance in the room with general and emergency lighting is Emin=743lux at 0.85m height, which does not satisfy the requirement. However, this low value is not in the emergency area. Therefore, we do not take into account the values which are outside the emergency area (the area above the bed). Then we see that the lowest value is 1400lux, which does satisfy the requirement of a minimum illuminance of 1000lux measured at 0.85m height.
The uniformity index in the room at 0.85m height, if we take only the area which is meant for short and long term research, which is the area above the patient’s bed and at least 0.6m from the wall and curtains, is u0=Emin/Eav.= 1400/1450=0.97, which satisfies the requirement of u0≥0.7 at 0.85m height.
Calculations in Dialux
The results from the measurements are compared with the results from DIALux, to see if the model is similar to the real ICU.
GENERAL LIGHTING
The calculated illuminances [lux] in each calculation point at floor level, with only general lighting on, are as follows.
Table: illuminance per measurement point for only general lighting at 0.85m, with u0=0.50 2.4 536 351 260 139 139 1781.8 591 397 260 151 139 1611.2 594 407 262 157 140 1540.6 546 379 249 160 140 149
M 0.6 1.2 1.8 2.4 3.0 3.6
Table: illuminance per point for general lighting at floor height, with u0=0.12
2.4 327 285 169 160 175 2051.8 352 247 70 61 100 1611.2 356 216 21 29 89 1530.6 351 34 157 202 189 186
M 0.6 1.2 1.8 2.4 3.0 3.6
The minimum illuminance in the room with general lighting is Emin= 21lux at floor height, which does not satisfy the requirement. However, this low value is below the bed and tables. Therefore, we do not take into account the values which are below objects blocking the light (purple area). Then we see that the lowest value is 153lux, which satisfies the requirement of a minimum illuminance of 100lux measured at floor height. The uniformity index in the room should be above 0.3 for general lighting, so this design does not satisfy the requirements if we calculate the uniformity index at floor height, due to the blockage of light by objects like the bed. If we look at the illuminance per point for general lighting at floor height where the objects in the room are removed, we get the following results with u0=0.72, which show that the general lighting design does satisfy the requirements.
Table: illuminance for general lighting at floor height, with u0=0.72, room objects are removed 2.4 366 374 336 295 262 2391.8 391 399 356 312 297 2631.2 391 398 360 318 293 2880.6 370 378 350 320 303 312
M 0.6 1.2 1.8 2.4 3.0 3.6

Measurement of ICU Environment
Page 36 31 May 2010
READING LIGHT
The measured illuminances [lux] in each measurement point at 0.85m height with both general lighting and reading light on are as follows, with u0 calculated as 0.53.
Table: illuminance per measurement point for both general lighting and reading lighting 2.4 544 360 308 169 159 1911.8 603 411 324 192 164 1771.2 606 421 332 200 166 1700.6 556 391 299 194 162 165
M 0.6 1.2 1.8 2.4 3.0 3.6 The minimum illuminance in the room with general lighting and reading light is Emin= 159lux, which does not satisfy the requirement. However, this low value is not in the reading area. Therefore, we do not take into account the values which are outside the reading area (purple area). Then we see that the lowest value is 308lux, which satisfies the requirement of a minimum illuminance of 300lux measured at 0.85m height. The uniformity index in the room should be above 0.7 in reading/detail work areas, so this design does not satisfy the requirements. However, if we only take into account the reading area (purple area) we get u0=308/363.9=0.85, this design does satisfy the uniformity requirements.
INVESTIGATION LIGHT
The measured illuminances [lux] in each measurement point at 0.85m height with both general lighting and investigation light on are as follows, with u0 calculated as 0.58.
Table: illuminance per measurement point for both general lighting and investigation lighting 2.4 555 577 589 458 406 3411.8 615 788 804 663 644 4131.2 618 806 815 689 651 4180.6 572 650 618 527 468 338
M 0.6 1.2 1.8 2.4 3.0 3.6
The minimum illuminance in the room with general lighting and investigation light is Emin= 338lux, which satisfies the requirement of a minimum illuminance of 300lux measured at 0.85m height. The uniformity index in the room should be above 0.7 in reading/detail work areas, so this design does not satisfy the requirements. However, if we only take into account the investigation area (purple area above the bed) with u0=644/732.5=0.88, this design does satisfy the uniformity requirements.
EMERGENCY LIGHT
The measured illuminances [lux] in each measurement point at 0.85m height with both general lighting and emergency light on are as follows, with u0 calculated as 0.59.
Table: illuminance per measurement point for both general lighting and emergency lighting 2.4 753 1061 1255 1158 968 6971.8 880 1419 1695 1606 1400 8851.2 886 1445 1703 1623 1409 9010.6 788 1171 1352 1311 1090 727
M 0.6 1.2 1.8 2.4 3.0 3.6
The minimum illuminance in the room with emergency lighting is Emin=697lux, which does not satisfy the requirement. However, this low value is not in the emergency area. Therefore, we do not take into account the values which are outside the emergency area (purple area above the bed). Then we see that the lowest value is 1400lux, which satisfies the requirement of a minimum illuminance of 1000lux measured at 0.85m height. The uniformity index in the room should be above 0.7 in reading/detail work areas, so this design does not satisfy the requirements. However, if we only take into account the emergency/investigation

Measurement of ICU Environment
area (purple area above the bed) with u0=0.91, this design does satisfy the uniformity requirements.
Comparing these two tables with the measured values we see that the difference between measurements and calculations is very little. This difference might be due to the oldness factor which is taken into account in the measurements, but not in the calculations.
Luminance [cd/m2] (Measurements according to NEN 1891)
The measured luminances [cd/m2] in each measurement point are as follows. The luminance contrast in the view direction of the doctor is Lhighest/Llowest= 40/10= 4 if we compare the work pane with the direct environment, and Lhighest/Llowest= 1500/40= 37.5 if we compare the direct environment with the overall environment. Since the highest contrast in the view direction of the occupant is 10:40:1500 = 1:4:150, and the highest contrast can maximum be 1:3:10, this does not satisfy the requirements.
Figure: Photo of view direction with high luminances 10 – 40 – 50 - 1500 cd/m2 indicated.
There are no light sources within the view direction of the doctor. However, the luminances of the light sources in the ICU that are in the eye field of the patient are indicated in the following figure. From this figure we clearly see that for the patient the luminance contrast does not satisfy the requirements.
Figure: Luminances indicated per light source in the ICU.
Glare & Color Rendering Index
The glare of the light sources and the color-appearance index can be determined from the product details in DIALux. For the in the ICU applied light sources the in section 0 indicated glare factors and color rendering indices are found. These values, besides light number 51
50cd/m2
40cd/m2
1500cd/m2
10cd/m2

Measurement of ICU Environment
Page 38 31 May 2010
positioned behind a cove and 91 is covered, therefore glare will not occur. The color rendering values do not satisfy a color rendering index (for research and treatment) Ra>90.
2.2.2 Acoustic Environment The sound level measurements done for the pilot-test to measure the acoustic comfort are:
Background: Sound production in the room without alarm, without people talking, and without this patient’s medical equipment on, this is the background sound level consisting of noise from other medical equipment at the ICU, from other departments, and from outside [dB(A)]
Peak: Average weighted sound level of a doctor’s alarm and of people talking at 1m distance [dB(A)].
The following average weighted sound levels were found:
Aspect Acoustic Comfort THIC: Oldest ICB: Middle CHIC: Newest
• Sound level of Medical Equipment27, alarms [dB(A)]
• 80 dB, sometimes >90dB
• 80 dB, sometimes >90dB
80 dB, sometimes >90dB
• Sound level of talking28
of staff & visitors [dB(A)]
• 40-60dB (normal talking at 1m distance), 70-75dB is often measured
• 40-60dB (normal talking at 1m distance), 70-75dB is often measured
• 40-60dB (normal talking at 1m distance), 70-75dB is often measured
• Background sound level (no talking and no alarms within radius of 1m around the bed) [dB(A)]
• >20dB(A) • >20dB(A) • >20dB(A)
2.2.3 Thermal Environment The measurements done for the pilot-test for the thermal environment are:
The radiant temperature near the patient’s head [oC]
The ambient air temperature near the patient’s head [oC]
The air velocity near the patient’s head [m/s]
The relative humidity near the patient’s head [%]
Aspect Thermal Environment THIC: Oldest ICB: Middle CHIC: Newest
• Radiant Temperature [oC] • 23.9 • 24.5 • 22.8
• Ambient Air Temperature [oC] • 24.1 • 24.9 • 23.8 • Air velocity [m/s] • 0.25 • 0.22 • 0.21 • Relative Humidity [%] • 45 • 48 • 49
2.2.4 Indoor Air Quality The measurements done for the pilot-test for the indoor air quality are:
The CO2-level in the air near the patient’s head [-]
Aspect Indoor Air Quality THIC: Oldest ICB: Middle CHIC: Newest• CO2-level [ppm] • 415 • 420 • 412
2.2.5 Spatial Environment All information related to the spatial environment is derived by analytic approach.
27 Equipment_sound_level.pdf 28 http://en.wikipedia.org/wiki/Sound

Measurement of ICU Environment
Page 39 31 May 2010
3 Measurements This chapter starts with a description of the measurement tools for the measurement of the environment, followed by a description of the application of these tools in a mock-up and a description of the validity of the measurements, and ends with a description of the boundary conditions and limitations of these measurements.
3.1 Tools
3.1.1 Tools Design The following paragraphs give a more detailed description of each environmental parameter and relate this description to the design of a measurement tool. It also provides proposals for integration of each measurement tool in a mock-up.
VISUAL ENVIRONMENT
The purpose of the light measurement is to determine how much and how the patient in the bed at the ICU experiences the light and how this experience varies with time. This variation in lighting is caused by the variation of the amount of daylight that enters the room and by switching artificial light sources on and off. Besides that the amount of light can vary with obstructions, reflections and for example the opening or closing of privacy curtains around the bed of the patient. Except for the weather all lighting variations are caused by user-behavior; for example the fact that the hospital employees switch off the lights in the night, and they can therefore be changed to create an optimized ICU design.
For further phases of this research it is important to know what causes the variation in the measured illuminance and luminance. Is this for example caused by variations in the amount of daylight or by the switching on or off of artificial lighting? It is also preferable to know how big the impact of artificial light is as compared to daylight. By measuring the illuminance of the different types of armatures at night (without daylight having influence on the measurement), the influence of artificial light can be determined. By logging the switching on and off of lights during the measurement the influence of artificial light can be determined ‘exactly’. The influence of daylight can be determined by simultaneous to the measurement also measuring the amount of daylight directly near the window. Using a ratio number which indicates what the ratio is between the amount of light which is measured directly behind the window and the amount of light measured at the measurement-point in the room, the influence of the amount of daylight can be calculated. This ratio number is determined by a measurement when all artificial lighting is switched off. If the measured illuminance at a certain moment is not equal to sum of the calculated daylight- and artificial light than we can assume that the difference is caused by obstructions (e.g. by closing privacy curtains).
The amount of light and the light variation in the patients’ eyes can be determined by designing a measurement tool that follows the patients’ head as far as possible, without disturbing the patient, and measuring all view directions that are possible from the position of the patients’ head. The position of the head of the patient lying/sitting in the bed is between 0 to 90o as compared to the horizontal, as the head side of the bed can move up. For that reason both the horizontal and vertical illuminance are measured synchronously.

Measurement of ICU Environment
Page 40 31 May 2010
Figure: Calculation of daylight factor
Illuminance [lux] Measurement Tool Design
To measure the horizontal and vertical illuminance in all directions except from below, a cubic shaped measurement tool made of hanger cells is designed. The shape of patients’ faces influences the amount of daylight falling in the patients’ eyes, as the nose for example blocks light. Therefore, a custom made eye-shaped illuminance measurement tool is designed as well. The illuminance tools have in total 7 sensors, and the luminance measurement tool described below has 9 sensors. All data from the total 16 Hagner sensors goes to the light-box with 16 plug-ins and from there converted to the laptop.
Figure: Set-up measurement equipment for measuring the illuminance by eye-shaped framed sensors (middle picture) and by a cubic with sensors at five sides (right picture), including a light box (left picture) to convert all the data.
Luminance [cd/m2] Measurement Tool Design
Besides the illuminance the luminance is an often used parameter to express the quality of the lighting design. The amount of light, the illuminance, influences the luminance of surfaces in the room, which influences the experience of the room by the users, so both illuminance and luminance level and changes should be measured. The variation over time and the luminance contrast in the eye field are likely to be important causes for patients to wake up. For the luminance all surfaces visible from the patients’ head position should be measured, where none of the sensors can obstruct each-other. Sleep disturbance caused by luminance contrasts or too high luminance can be measured and quantified in many ways, for example using a luminance meter, which records the differences in luminance of the surface it is

Measurement of ICU Environment
Page 41 31 May 2010
oriented at, or using an illuminance sensor with a tube on top, which records the average luminance of the area of the surface that it is oriented at.
We need to measure when a luminance contrast occurs in the eyefield of the patient. However, it doesn’t matter where in the eyefield it occurred, it only matters whether the patient woke up because of that or not. Besides, since we are planning to logg the on and off of light sources, which provides us with time data of when each light switch is on or off, we can relate this to the increase in luminance contrast and to the arousal. Therefore it is not needed to record all the luminances of each small part of the room. It is enough if we know the average luminance of each area, as long as we can capture every part of the room the patient might be looking at. Therefore, whether we use a luminance meter or an illuminance sensor with a tube, we need to have multiple positioned at different angles to be able to cover the whole area the patient might be looking at. To reduce the number of these measurement tools, we position them all together on the top part of the bed such that they can move up and down with the movement of the bed. Since a luminance meter is much bigger than illuminance sensors with a tube, and we do not want to disturb the patient or the employees with big measurement devices (as they might also influence the behaviour of the patient), and since we only need the average luminance, we decided to use the illuminance sensor with a tube on top, positioned at different angles on half a sphere at the top part of the bed, as shown in the next figure. The cylinder length and position of this custom made tool is based on the plan and ICU room height, as can be seen in the following figures. These requirements resulted in the following half spherical design which covers the luminance of all surfaces visible from the patients’ eyes.
Figure: Illuminance sensors with tubes on top to measure the average luminance of surfaces Figure: Sensor numbers in mock-up seen from the top Table: Sensor numbers in mock-up related to output addresses N11 = 356
N21 = 358
N31 = 363
N41 = 365
N51 = 922
N61 = 926
N71 = 1296
N81 = 1943 = eye left
N12 = 357
N22 = 362
N32 = 369
N42 = 921
N52 = 923
N62 = 927
N72 = 1297
N82 = eye right
Just as for the illuminance measurement tools, as the bed head goes up/down, this tool follows these movements, so it is very unlikely that the patient will look 90o up as compared to the bed surfaces, most of the time the patient will look straight or at most at a vertical angle of 40o. However, it is very likely that the patient will face to the left or right side, since it is very easy to turn your head horizontally. Therefore we positioned more sensors horizontally than vertically. Using the polar illuminance diagram of the light with armature it can also be determined whether the lighting can cause glare for the patient in bed and if the light is directed sufficiently to the task of the employees at the ICU. However, in this research we are only interested in measured data of patients’ outcomes. The lighting is logged29 on a laptop directly, after being converted by the light box. The laptop needs to store the data for lighting continuously, and can therefore not go of (the settings are changed to make sure it won’t go of). The hard disk space of the laptop is sufficient to store all this data.
29 Further information about light measurements and logging can be found in handleiding_meetopstelling_date.doc
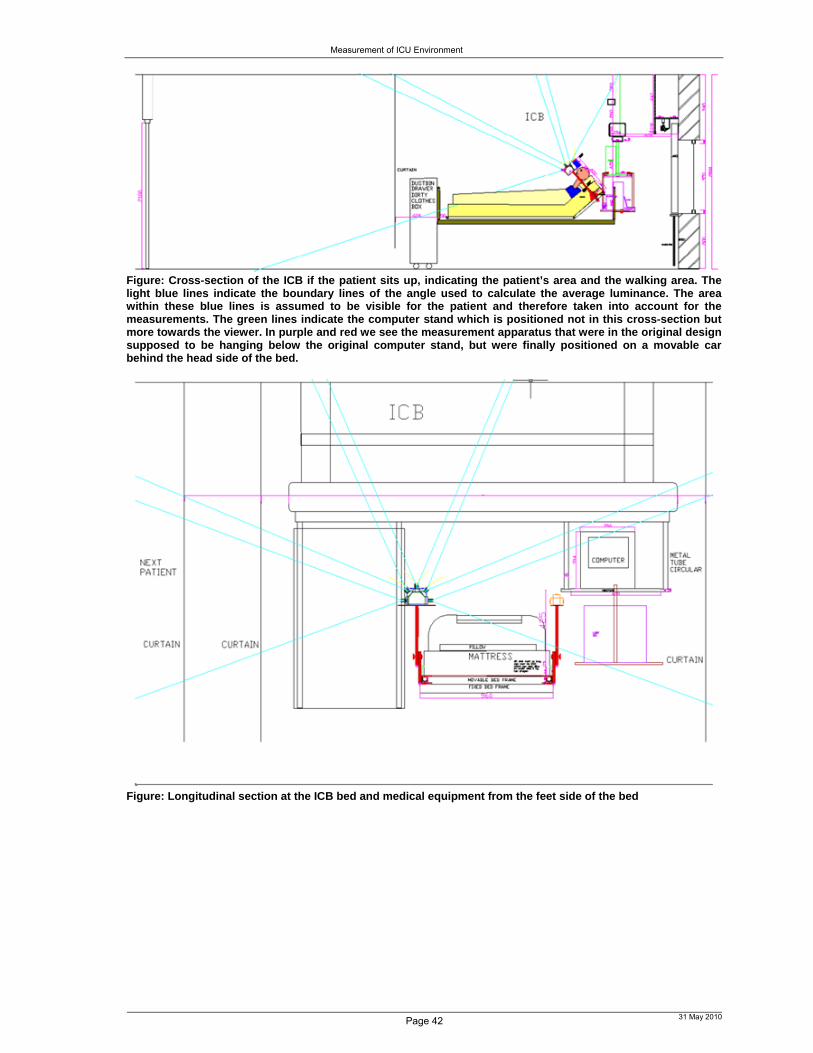
Measurement of ICU Environment
Page 42 31 May 2010
Figure: Cross-section of the ICB if the patient sits up, indicating the patient’s area and the walking area. The light blue lines indicate the boundary lines of the angle used to calculate the average luminance. The area within these blue lines is assumed to be visible for the patient and therefore taken into account for the measurements. The green lines indicate the computer stand which is positioned not in this cross-section but more towards the viewer. In purple and red we see the measurement apparatus that were in the original design supposed to be hanging below the original computer stand, but were finally positioned on a movable car behind the head side of the bed.
Figure: Longitudinal section at the ICB bed and medical equipment from the feet side of the bed
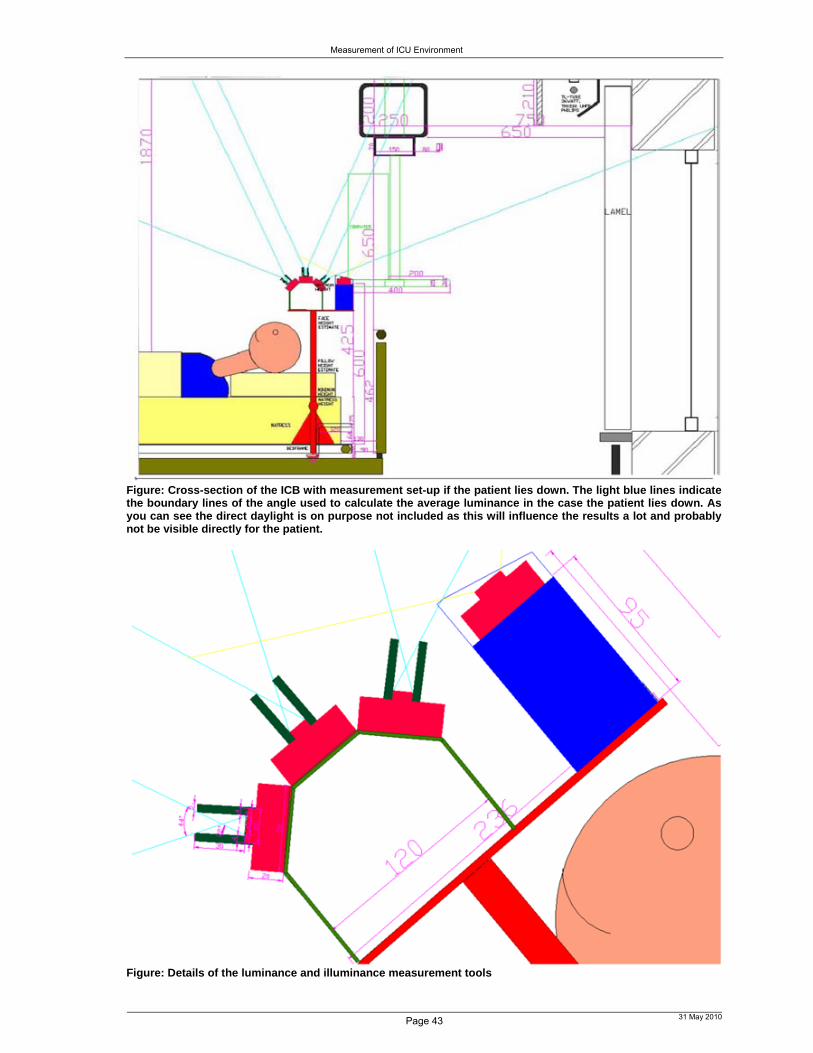
Measurement of ICU Environment
Page 43 31 May 2010
Figure: Cross-section of the ICB with measurement set-up if the patient lies down. The light blue lines indicate the boundary lines of the angle used to calculate the average luminance in the case the patient lies down. As you can see the direct daylight is on purpose not included as this will influence the results a lot and probably not be visible directly for the patient.
Figure: Details of the luminance and illuminance measurement tools

Measurement of ICU Environment
Figure: Plan of ICB with the lines indicating the angle between which the average luminance will be calculated, so these are the blue lines of the previous sections indicated in the plan. We see that horizontally five average luminances will be measured which can be compared for contrast.
ACOUSTIC ENVIRONMENT
Sound at the ICU is caused by human beings, apparatus, and background noises including those of installations. As described the sound level is not always a measure for the disturbance of sound. Also relatively soft sounds can be experienced as disturbing. For that reason sound is a very subjective term. To get a better idea of the amount of sound and the variation and cause of that over the day, the sound level and the frequency of the sound in the ICU will be measured all day and night. To be able to analyze the causes of certain sound peaks the sound level and octave bands of the most common sounds at the ICU are recorded during the pilot-study. The sound level of medical equipment of the ICU is measured during the pilot-study in a separate technical equipment room.
For sound levels that vary heavily over time a ratio number should be applied. L10 for example is the level that in 10% of the cases is exceeded; this level is used in traffic where the sound level varies heavily during the day. L90 is the sound level that for 90% of the time is exceeded, and this is used for background noise. In other words, L90 indicates what happens 90% of the time around us.
Figure: Expected sounds at the ICU Figure: Microphone
The interval time between the measurements needs to be sufficiently short, in this case taken as per second, as rhythmic sounds occur every 3 seconds, such that rhythmic sounds of apparatus can be subtracted from the results to get the sound level caused by people. The sound will be measured by a microphone near the head of the patient, not close to the apparatus, and the audio files can be saved at a computer.
SOUND PEOPLE SOUND APPARATUS BACKGROUND

Measurement of ICU Environment
Page 45 31 May 2010
Continuous Environmental Sound Level Recording
Environmental noise is assessed by the B&K 2250 portable integrating/logging sound level meter, which is accurate to within 0.5dB (factory manual). A microphone is secured to the head of the bed and positioned so that the microphone is within 10cm of the patient’s head. This technique allows the microphone to move up and down in harmony with the patient’s head30 in an attempt to measure the noise that the patient experiences. Environmental noise is continuously recorded in decibels dB(A). The decibel A scale is a frequency weighting method that simulates the reception characteristics of the human ear [Mey’94]. The sound level meter decibel range is set between 30 and 100 dB(A), based on prior studies assessing ICU noise levels [Aar’96], [Ben’77], [Ber’95], [Gaz’01]. The output of the sound meter is logged synchronously with the BIS measurement, to assess the effect of noise on arousals from sleep. Noise data for the entire study period are logged and stored at 1-s intervals. Our approach is similar to the approach of [Gaz’01], who measured the influences of only sound on the sleep architecture of ICU patients, and did not select on personal variables. The sound level is logged31 every second in the external card of the measurement equipment. This external card can be connected to a pc to get the data.
THERMAL ENVIRONMENT
Air Temperature
The air temperature is measured by a thermometer 32 . The measurement error for air temperature is 0-3◦C.
Average radiant temperature
To measure the average radiant temperature elements 33 that sense long wave infrared radiation are used, i.e. the black sphere. To be able to measure as close as possible near the patient’s head without disturbing the patient we used one of the smallest versions.
Relative Humidity (RH)
The standard and most trustworthy way to determine the RH is the determination of the wet- and dry-bulb temperature using a psychrometer34. This includes two identical glass-tube thermometers of which one is surrounded by a sock made wet with distilled water. By application of an inbuilt ventilator the air is measured with an air velocity of 1m/s. The wet thermometer will cool down because of evaporation until the wet-bulb temperature (the lowest readable value) is reached. The RH is determined using the mollier-diagram, or directly read from the measurement tool.
30 As in: up and down movement of the bed 31 Further information about sound measurements and logging can be found in handleiding_meetopstelling_date.doc 32 Other ways to measure the air temperature are: change of electric resistance, e.g. using thermistors, metalresistances, or through generation of thermo-emk’s (thermocouples), or through pressure- or volume-changes of vapour and/or liquid and change of shape (bimetal). In [Yan’04] for example, thermocouples were used to measure air temperature and surface temperature of the room enclosures. 33 If you put them at different directions you can measure the radiant asymmetry according to Fanger’s criteria. The radiant asymmetry can also be derived from measurement values of the globe-temperature, the air temperature and air speed (see ISO 7726). 34 Another trustworthy method is the one for which a mirror is cooled down – using a Peltier element – until the dew point temperature is reached. This moment is characterized because an on the mirror directed light beam is scattered because condensation on the mirror starts. Other RH-measurement-tools use the following mechanisms: Expansion of materials, like hair, silk, cellofaan, cotton; instruments using this principle have to be calibrated frequently, especially
when they have been exposed to a higher RH-value. Temperature change in a heated salt-solution (lithiumchloride). It has to be taken into account that the applied heating-elements
keep force because else the LiCi drops of. Impedance change of hygroscopic materials. Bi-plastic elements, existing of a spiral-shape metal-spring with on it damped hygroscopic plastic mass. The spring bends on the
same way as a bimetal spiral.

Measurement of ICU Environment
Page 46 31 May 2010
Figure: The Psychrometer of Assman & Hygrometer
Air Velocity
The air velocity35 and velocity fluctuations around the occupant are measured using omni-directional low-velocity hot-sphere anemometers. The measurement range of the sensors is 0.05–5 m/s and the repeatability is 0:01 m/s or 2% of the readings.
Figure: Measurement tools measuring the thermal comfort
INDOOR AIR QUALITY
The CO2-measurement36 represents the indoor air quality. There are no modifications to the measurement tools of the thermal environment and of the indoor air quality.
DATALOGGER
Two data logger systems (Grant, 2020 2F8 16 channel) were used to store the data. One to store the data from the following (ID1815):
Ambient temperature and relative humidity (every 30 seconds)
Radiant temperature (every 30 seconds)
Air velocity (every 30 seconds)
CO2-level (every 30 seconds)
and one to store the data from the 15 LDRs that are each stuck to a light source to measure whether the light is on or off.
The first datalogger (ID1815) will be placed behind the bed. The wires will go through two tubes to each side of the bed. The second datalogger will be positioned on top of the false ceiling, since the 6m long wires from the datalogger to the LDR have to be stuck on the ceiling. At places where there is a rail for curtain around the bed, the wire will be taken over
35 To define the boundary conditions for CFD simulation, the following parameters were also measured: wall temperatures, airflow rate, supply parameters (including the discharge velocity, temperature and concentration at the inlet) and return parameters (temperature and concentration). 36 A picture of this tool is included in the next section.

Measurement of ICU Environment
the false ceiling. These LDRs indicate the resistance, which changes when the lamp is on or off or dimmed, and they therefore indicate whether the light source is on or off or dimmed.
The dataloggers have an internal memory of 15616kB, out of which 245kB are always used, so about 15371kB can be used for data storage.
For the second datalogger, we can store 3 weeks of data for 6 channels if we measure every 10 seconds. So if we measure every minute, we can measure for 6 times 3 weeks. We will have 15 LDRs so 15 channels, that means we can measure for 21 days / 2.5 = 8.4 days if we measure every 10 seconds. We want to measure every 30 seconds, so we can measure for 8.4 times 3 = 25.2 days. To be sure all the data will be stored, we copy the logged data from the datalogger to an external hard disk or laptop every 20 days.
For the first datalogger, we want to measure 6 channels every 30 seconds, so we can measure for 3 times 3 weeks so for 9 weeks before we need to copy the logged data to the laptop. Of course we will copy the data somewhat early.
Software for the datalogger is Squirrelview. We keep the datalogger connected to a laptop with a serial cable. We download the data and after that we export the data to asci characters. We name the file with the data, e.g. 090512 meaning 12 may 2009. After we exported the file (as a text file) to a local harddisk, we delete the file, and then we can start logging again. We can open the file with .00 in textpad.
3.1.2 Tools The mock-up consists of the following measurement tools: MEASUREMENT TOOLS
Figure below: Ambient Air temperature & Relative Humidity meter
Figure above: Radiant-temperature meter
Figure: Illuminance measurement tools
Figure: Luminance measurement tools Figure: CO2-meter

Measurement of ICU Environment
CONVERT DATA
SAVE DATA
3.1.3 Mock-up Constraints For each of the environmental parameters mentioned in the previous section a measurement tool was found or designed. These measurement tools need to be integrated in a mock-up which can be positioned near the bed. The following constraints had to be taken into account when designing the mock-up:
Bed should be easy to take away
Attach all measurement tools to one frame which can easily be detached
All cables in 1 or 2 flexible vacuum cleaner tubes
For reanimation, top part of bed is detached for staff to reach the patient.
No tools or cables attached to top part of the bed, nor between bed and window
Elastic cable pulls measurement tools + frame up when detached from bed
Figure: Laptop to logg lighting data and back-up other data
Figure: Light box converts signals from lightcells to laptop, so this light box should always be fixed to the laptop
Figure: Converter box for air-velocity
Figure: (External card in) sound meter loggs data
Figure: 2 dataloggers (1 to logg lamp on/off (ID 1816, serial port, 1F8), and 1 (ID 1815, usb, 2F8) to logg CO2, air-velocity, ambient air temperature, relative humidity and radiant temperature)
Figure: Microphone Figure: LDR & accu

Measurement of ICU Environment
Page 49 31 May 2010
Floor should be easy to clean
Hang measurement tools on frame above the bed, similar to medical equipment, or in a movable car behind the head side of the bed
Everything has to be cleaned with 70% alcohol
Frame material metal (easy to clean, thin, strong)
Tools or frame cannot cause dangerous situations
No sharp corners in frame or tools
Patient and staff should be able to behave as normal
Nothing can be attached to or bothering the patient or staff
Light measurement tools should follow patient’s head movements
Position light measurement tools on top part of bed frame, such that:
They don’t block light for the patient
They don’t interfere with work area of staff
On top corners an in height adaptable frame with 1 or 2 measurement tools
CO2-meter, ambient temperature meter, data logger & laptop don’t need to be near bed
Located under existing computer frame, not near heat producing equipment
Sound level meter and radiant temperature meter should be near patient’s head
Located on frame just above head side of the bed
Different beams and computer frames & mock-up cannot cause power failure
Figure: Mock-up Constraints
3.1.4 Mock-up Design The following pictures and measures indicate the looks of the three ICUs and the important measures.

Measurement of ICU Environment
Page 50 31 May 2010
Figure: Mock-up Design: white vacuum cleaner tube through which all the cables of the
measurement tools go to the dataloggers
3.1.5 Mock-up The car with equipment is located at the head side behind the bed. The following equipment should be in the car:
Figure: Equipment in car

Measurement of ICU Environment
Figure: Frame – on each side – in which the mock-up can be placed. Mock-up (height of equipment can be changed). The indicated part is positioned under the mattress of the measurement bed.
Figure: Mock-up in the UMCG indicating the orientation of the measurement equipment.
3.2.1 Connections, Datalogger & Calibration & Activities Pictures of connections between measurement tools, a description of the datalogger settings, the calibration and the description of activities that are required to be done during the year measurements are done to properly do the measurements are attached in the appendix.
3.3 Validity & Assumptions
To achieve valid measurement results:
The fact that people know that there are measurements about aspects which they can influence, e.g. the lighting and the sound production in a room, can change the behavior of these people. If medical staff got information about the fact that the amount of light in the room is measured and that with that the variation between the amount of light during the day and during the night is relevant, they can on purpose or not on purpose choose to leave less lights on during the night. Of course the medical staff should know that there are measurements being taken, however, this information will be kept to the purpose of the research only and the staff will be told to behave as normal as possible.
We believe our results are valid for several reasons:
First, our technique of simultaneously monitoring the entire physical environment, excluded the possibility of missing an environmental influence and therefore drawing wrong conclusions, so it allowed for the objective measurement of effects of environmental

Measurement of ICU Environment
Page 52 31 May 2010
Second, as we measured the sleep pattern as well as other indicators of health, namely blood pressure, heart beat and oxygen saturation, the validity of the in other literature indicated sleep pattern as indicator of patients’ health can be verified using these other indicators of health.
Finally, it cannot be argued that our ICUs are environmentally different than other ICUs as the levels recorded in our ICUs appear to be comparable to those in other publications [Mey’94] [Kah’98] [Gaz’01].
3.4 Boundary Conditions & Limitations
My study design has some boundary conditions and limitations:
The environmental influences will also vary per location per ICU, but the attempt has been made to eliminate this influence since the UMCG has tried to find the most representative location at each ICU.
It is difficult to know how to conduct research in terms of how to select the patients or how long to work with each group. Compared to many research topics, conducting rigorous scientific research in healthcare buildings can be difficult because it is done in a complex real setting, not a laboratory, so it becomes quite a challenge to control or standardize factors or variables that might affect the findings. We don’t take into account non-environmental and non-personal variables, such as food rhythm, as this is not our purpose, though the food-schedule will influence the biorhythm of the patient, for example since the activity level goes down right after eating dinner.
A complexity of this research is that we cannot talk about ‘THE patient’ at the ICU. This stakeholder is very divers in non-environmental factors like age, sex, illness, medication, the clothing and activity type, the duration of stay at the ICU and the state of the patient at the ICU, all these factors can influence the health and comfort, which is indicated by a different sleep pattern, and recovery process of that patient. In some research patients are selected by personal characteristics and medicines, like in [Gaz’01]. Patients were excluded if, prior to the initiation of the study, they were receiving continuous heavy sedation, were stuporous or comatose, and/or had a previous history of dementia. Heavy sedation was defined as the inability to arouse the patient or inability of the patient to follow verbal commands. Heavy sedation was a criterion for exclusion based upon the inability to classify the patients’ level of consciousness as sleep versus wakefulness. Patients with a diagnosis of dementia were excluded because of the known abnormal EEG patterns described in demented patients, which make it difficult to accurately determine sleep versus wakefulness by EEG criteria even in non-critically ill demented patients [Bix’79]. [Gaz’01] As all ICU patients are under heavy sedation, it doesn’t make sense to select patients on level of sedation. Besides, though normally the level of sedation influences the ability to arouse and thereby the sleep pattern, the BIS level is not affected by the level of sedation. These non-environmental variables vary per person and are not linked to the building design. The type of patient can influence the parameters as well. The care requirements per patients differ. It is often important but difficult to control for variability across different patients, for example, in illness severity or acuity level, as there might always be some personal influence which you cannot determine like that. An example of these personal influences on health and comfort requirements is the influence of ambient temperature, relative humidity and material usage at the ICU depend on the illness of the patient. Patients with rheumatoid arthritis seem to recover faster in a warm and dry internal climate with a temperature of 32oC and 35% relative humidity [ASH’07]. Patients with head wounds, or patients who have undergone an operation on their head can get a heatstroke caused by a disruption in the heat regulation in the center of the brain. For these patients it is important that they can release heat via radiation or evaporation, and therefore, they prefer to stay in a colder room with a lower relative humidity [ASH’07].

Measurement of ICU Environment
Page 53 31 May 2010
For now we only include environmental factors, since we are interested in evaluating disorders of sleep and wake in a heterogeneous population of patients, and since we think personal factors only influence quantitatively and not qualitatively. This means that we do not exclude any patients.
o There might be advantages to selecting patient diagnostic groups where the numbers are large and for whom treatment is rather consistent rather than extremely varied, making it easier to control for factors, for example measuring per department like the type of Intensive Care Unit where all patients have undergone the same kind of operation or all car accidents for example. Our research will therefore be bound to the patient groups per ICU type.
o We do get certain personal information from the UMCG, namely the age, sex, illness, type and amount of (pain) medication over time, the Hospital Acquired Infections, and the duration of stay at the ICU. In a further stage it can be decided to include these factors in the research.
Using this information, we can compare the results for the personal information. To be able to do this, we aim for a randomized controlled group for certain personal parameters, meaning a balance of male and female, and a balance of patients in different age groups. As we cannot influence whether a male or female will be in our measurement bed, this will be determined after measurements are done by analyzing the measurements of roughly as many male as female.
However, we do not sort on illness, since these will be too different for different patients. Besides, sorting on illness and taking into account the effects of each illness goes into too much medical detail, which is not in our scope. Since we register the illness, further research can be done, using our results.
Many other studies also did not control for underlying disease. ‘We did not control for underlying disease state as we were interested in evaluating disorders of sleep and wake in a heterogeneous population of ICU patients. We excluded patients under heavy sedation in this study because we thought it would be difficult to classify a given patient’s level of consciousness as wakefulness versus sleep. Also, sedatives themselves can affect sleep and/or the EEG potentially confounding our results’ [Nic’94].
o Checking the effect of the difference in certain personal information, like male, female and age groups, we might be able to conclude that independent of these personal factors, from our results the environment seems to either negatively or positively influence the sleep pattern of the average patient, where the average patient is defined as the average results of the randomized controlled group. The following tables indicate the information the UMCG will provide us. The first table indicates the patient details, and the second table indicates the indicators per patient which change over time.

Measurement of ICU Environment
Page 54 31 May 2010
Table: Patient Details
Table: Indicators of health and comfort per patient over time
Where:
HF = Heart Frequency, meaning the number of heart beats per minute
ABP = Blood Pressure, systolic = higher pressure, diastolic = lower pressure, mean = average pressure (e.g. 120/80 (70) is higher pressure 120, lower 80, average blood pressure 70.
Saturation = Oxygen saturation [%]
Pulse = Heart Frequency, not measured via heart film but counted via pulse
Since we do not take into account all personal factors explicitly, meaning we do not sort patients on all personal factors (i.e. not for illness) and compare these, we cannot be completely sure that certain results are due to the influence of certain environmental factors in the way we conclude from our measurements and analysis - since e.g. an illness might make a patient more or less sleepy - and we cannot generalize our results to all ICU patient populations, since we might not have measured for every type of ICU patient possible.
If a certain set of data indicates that a certain influence occurs repeatedly, and this is a significant relation, we may assume that this environmental factor influences the sleep pattern of the patient.
o If in a further research stage we change this environmental factor to improve the ICU, and from analysis we see the expected change, we may assume that this environmental factor influences, even though this environmental factor will be the only environmental influence but might not be the only personal influence.
We only measure physics, no observations of patient health and comfort (so only observations of the environmental design), since we are only interested in objectively measured data and not in subjective observations. Besides, the expense is not justified, given that it is expected to provide little information and affects the privacy of the patients.
o So for sound we only measure dB level, we do not record the actual sounds, and for light we only measure intensities and contrasts, we do not record the actual views of for example a doctor passing by.

Measurement of ICU Environment
Page 55 31 May 2010
This means that we need to know the individual influence of many things, e.g. the sound level of an alarm, the background sound level, the illuminance of certain lights, etc. before we start measuring. This data is measured in the pilot-test.
o We do not measure particles or micro-organisms for air quality nor air flow directions (CFD), because it is too complicated and time consuming, and assumed to have little effect on short-term health and comfort.
Controlling for factors can be especially difficult when researching large-scale environmental aspects such as the effects of room dimensions or the presence versus absence of windows. These types of architectural design conditions cannot be varied easily or inexpensively, and only rarely can be assigned randomly to patients. So it is often very challenging to do the more rigorous types of controlled experiments, which are often related to architecture. Therefore, architecture will not be included in the measurements explicitly, but implicitly by doing measurements in three ICUs each with a completely different architecture, where the measurements in the other two ICUs will be completed in future research. By comparing results between ICUs indirect conclusions upon influences of architecture on health and comfort can be drawn. Architecture is also included in the literature research documented in phase 1.
o However, there are still many environmental properties which can be rather easily varied and even randomly assigned, such as types of art on the wall, room colour, whether or not the patient can control their room lighting, or whether the ceiling is sound reflecting or sound absorbing. Since the influence of types of art, window views, greenery and the difference between single-patient and multi-patient bedrooms have already been explicitly measured by Ulrich, and the influence of the physical environment has only been studied for factors individually, our research is limited to the influence of all physical variables.

Measurement of ICU Environment
Page 56 31 May 2010
4 Results This chapter describes the ICB physical environment and sleep patterns.
4.1 ICU Physical Environment Conditions
4.1.1 Visual Environment The following figures are a summary of the analysis of the lighting over the Summer vs. Winter in the ICB at the UMCG, indicating the average, minimum and maximum illuminance and luminance over a 24-hour period. The lighting was measured per second for the Summer of 2009 and the Winter of 2009/2010 in periods of 24 hours. The ICB was during this period maintained under a light-dark cycle. There is a significant difference between day-time versus night-time (average, minimum and maximum) illuminance levels in the area with a diameter of 1m around the patient’s head. The light was dimmed to an average illuminance of <10lux during the night from 22:30 pm to 08:30 am, while the average illuminance was maintained at a higher level (50-250lux in Summer, 20-120lux during Winter) during the daytime. The average illuminance peaks in Summer from 12:00 to 18:00, while in Winter it peaks only between 12:00 and 14:00.
Due to late sunrise in Winter, between 7:00-9:00 in the morning the illuminance level increases rapidly, due to switching on of lights, and the daylight level decreases around 16:00 due to early sunset. This daylight level decrease is compensated by lights being switched on around 17:00, as can be seen from the sudden increase in illuminance levels, resulting in a constant illuminance level after 17:00. In Summer, however, we see a gradual increase and decrease of illuminance due to increase and decrease of daylight level.
Daytime illuminance peaks in the patients’ eyes reach 2500lux in Summer, and 1000lux in Winter. In Summer peaks occur till 22:00 as there is still daylight around that time, whereas in Winter peaks stop at 16:00 when the sun sets. The maximum illuminance significantly increases from 12:00 to 18:00, and the maximum luminance significantly increases from 12:00 to 16:00. This is likely due to either increase in daylight where overcast sky changes to clear sky, or due to switching on lights during this time of the day.
Figure: Average, minimum and maximum illuminance of Summer continuous measurements over a 24-hour period at the ICB
Figure: Average, minimum and maximum illuminance of Summer continuous measurements over a 24-hour period at the ICB (zoom)
0
500
1000
1500
2000
2500
3000
3500
0:00 2:00 4:00 6:00 8:00 10:00 12:00 14:00 16:00 18:00 20:00 22:00
Illuminan
ce [lux]
Time of the Day [hours]
Average Illuminance [lux]Minimum Illuminance [lux]Maximum Illuminance [lux]
0
50
100
150
200
250
300
0:00 2:00 4:00 6:00 8:00 10:00 12:00 14:00 16:00 18:00 20:00 22:00
Illuminan
ce [lux]
Time of the Day [hours]
Average Illuminance [lux]Minimum Illuminance [lux]Maximum Illuminance [lux]

Measurement of ICU Environment
Page 57 31 May 2010
Figure: Average, minimum & maximum illuminance of Winter continuous measurements indicated over a 24-hour period at the ICB
Figure: Average, minimum & maximum illuminance of Winter continuous measurements over a 24-hour period at the ICB (zoom)
The average luminance ranges from 20 to 150cd/m2 during the Summer days and from 0-50cd/m2 during Winter days, is <10cd/m2 during the night, and follows illuminance graphs.
4.1.2 Acoustic Environment There is little variation in the average weighted sound level between day and night and Summer and Winter. The average weighted sound level is on average 48dB during the night and 51dB during the day. As the average level as given by guidelines is 35dB(A) for the day and 30dB(A) for the night, the sound level exceeds these levels. The peak average 37 weighted sound levels are around 74dB during the night and 76dB during the day. Since the peak sound level according to guidelines during the night is 45dB(A), the ICB exceeds this level. Sudden sound level increases, e.g. in the middle of the night, often indicate that a new patient enters the ICU, shift changes or that something is wrong with neighbouring patients.
Figure: Average, minimum & maximum sound level of 1 year continuous measurements indicated over a 24-hour period at the ICB
37 Where average refers to average of all octave bands
0
200
400
600
800
1000
1200
1400
1600
1800
0:00 2:00 4:00 6:00 8:00 10:00 12:00 14:00 16:00 18:00 20:00 22:00
Illuminan
ce [lux]
Time of the Day [hours]
Average Illuminance
Minimum Illuminance
Maximum Illuminance
0
20
40
60
80
100
120
140
0:00 2:00 4:00 6:00 8:00 10:00 12:00 14:00 16:00 18:00 20:00 22:00
Illuminan
ce [lux]
Time of the Day [hours]
Average Illuminance
Minimum Illuminance
Maximum Illuminance
0
10
20
30
40
50
60
70
80
90
100
0:00 2:00 4:00 6:00 8:00 10:00 12:00 14:00 16:00 18:00 20:00 22:00
Average
Weighted Sound Level
[dB]
Time of the Day [hours]
Average Sound Level
Minimum Sound Level
Maximum Sound Level

Measurement of ICU Environment
Page 58 31 May 2010
4.1.3 Thermal Environment & Indoor Air Quality The radiant temperature and ambient 38 temperature curves are similar, though ambient temperature peaks reach 32oC in Summer, while radiant temperature peaks reach much higher up to 36oC in Summer. In Winter, ambient temperature peaks are slightly higher (28oC) than radiant temperature peaks (27oC), as the cold glazing reduces radiant temperatures in Winter. Temperatures fluctuate a little more and are higher in Summer and slightly higher during the day (25oC Summer, 23oC Winter) than during the night (23oC Summer, 22.5oC Winter). Minimum temperature is 21oC. Note the different y-axis scale.
Figure: Average, minimum & maximum radiant temperature in Summer continuous measurements over a 24-hour period at the ICB
Figure: Average, minimum & maximum radiant temperature in Winter continuous measurements over a 24-hour period at the ICB
The relative humidity decreases as the temperature increases, thus resulting in the above figures. There is a large difference between Summer (50%) and Winter (22%) average relative humidities. Relative humidities range in Summer from 40% to 60% and in Winter from 10% to 35%. Relative humidities of 10% are bad for health, as the dry air can cause pain in eyes and nose, and it can cause electric shocks if metal is touched. Relative humidity can reach this low in Winter cause the air is heated without humidifying it. As temperatures fluctuate more in Summer, so does the relative humidity.
38 See ambient temperature graphs in Appendix
20
22
24
26
28
30
32
34
36
38
0:00 2:00 4:00 6:00 8:00 10:00 12:00 14:00 16:00 18:00 20:00 22:00
Rad
iant Temperature [oC]
Time of the Day [hours]
Average Radiant Temperature
Minimum Radiant Temperature
Maximum Radiant Temperature
20
21
22
23
24
25
26
27
28
0:00 2:00 4:00 6:00 8:00 10:00 12:00 14:00 16:00 18:00 20:00 22:00
Rad
iant Temperature [oC]
Time of the Day [hours]
Average Radiant Temperature
Minimum Radiant Temperature
Maximum Radiant Temperature
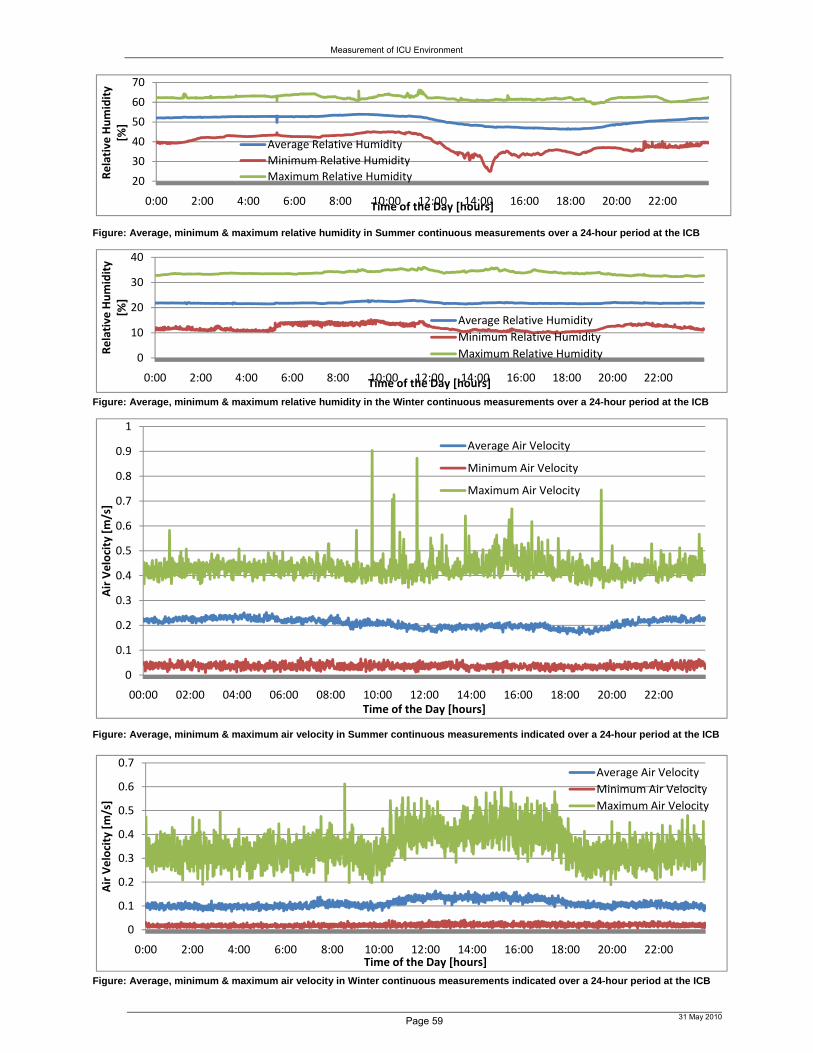
Measurement of ICU Environment
Page 59 31 May 2010
Figure: Average, minimum & maximum relative humidity in Summer continuous measurements over a 24-hour period at the ICB
Figure: Average, minimum & maximum relative humidity in the Winter continuous measurements over a 24-hour period at the ICB
Figure: Average, minimum & maximum air velocity in Summer continuous measurements indicated over a 24-hour period at the ICB
Figure: Average, minimum & maximum air velocity in Winter continuous measurements indicated over a 24-hour period at the ICB
20
30
40
50
60
70
0:00 2:00 4:00 6:00 8:00 10:00 12:00 14:00 16:00 18:00 20:00 22:00
Relative
Humidity
[%]
Time of the Day [hours]
Average Relative Humidity
Minimum Relative Humidity
Maximum Relative Humidity
0
10
20
30
40
0:00 2:00 4:00 6:00 8:00 10:00 12:00 14:00 16:00 18:00 20:00 22:00
Relative Humidity
[%]
Time of the Day [hours]
Average Relative Humidity
Minimum Relative Humidity
Maximum Relative Humidity
0
0.1
0.2
0.3
0.4
0.5
0.6
0.7
0.8
0.9
1
00:00 02:00 04:00 06:00 08:00 10:00 12:00 14:00 16:00 18:00 20:00 22:00
Air Velocity [m/s]
Time of the Day [hours]
Average Air Velocity
Minimum Air Velocity
Maximum Air Velocity
0
0.1
0.2
0.3
0.4
0.5
0.6
0.7
0:00 2:00 4:00 6:00 8:00 10:00 12:00 14:00 16:00 18:00 20:00 22:00
Air Velocity [m/s]
Time of the Day [hours]
Average Air Velocity
Minimum Air Velocity
Maximum Air Velocity
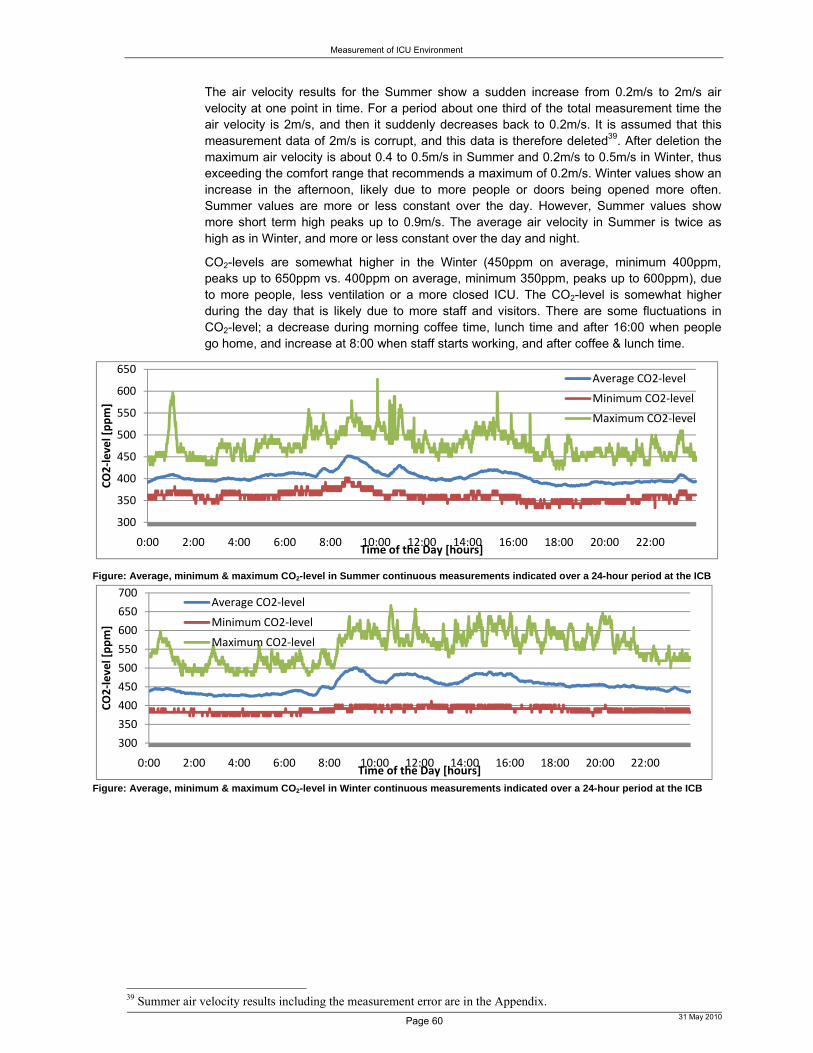
Measurement of ICU Environment
Page 60 31 May 2010
The air velocity results for the Summer show a sudden increase from 0.2m/s to 2m/s air velocity at one point in time. For a period about one third of the total measurement time the air velocity is 2m/s, and then it suddenly decreases back to 0.2m/s. It is assumed that this measurement data of 2m/s is corrupt, and this data is therefore deleted39. After deletion the maximum air velocity is about 0.4 to 0.5m/s in Summer and 0.2m/s to 0.5m/s in Winter, thus exceeding the comfort range that recommends a maximum of 0.2m/s. Winter values show an increase in the afternoon, likely due to more people or doors being opened more often. Summer values are more or less constant over the day. However, Summer values show more short term high peaks up to 0.9m/s. The average air velocity in Summer is twice as high as in Winter, and more or less constant over the day and night.
CO2-levels are somewhat higher in the Winter (450ppm on average, minimum 400ppm, peaks up to 650ppm vs. 400ppm on average, minimum 350ppm, peaks up to 600ppm), due to more people, less ventilation or a more closed ICU. The CO2-level is somewhat higher during the day that is likely due to more staff and visitors. There are some fluctuations in CO2-level; a decrease during morning coffee time, lunch time and after 16:00 when people go home, and increase at 8:00 when staff starts working, and after coffee & lunch time.
Figure: Average, minimum & maximum CO2-level in Summer continuous measurements indicated over a 24-hour period at the ICB
Figure: Average, minimum & maximum CO2-level in Winter continuous measurements indicated over a 24-hour period at the ICB
39 Summer air velocity results including the measurement error are in the Appendix.
300
350
400
450
500
550
600
650
0:00 2:00 4:00 6:00 8:00 10:00 12:00 14:00 16:00 18:00 20:00 22:00
CO2‐level [ppm]
Time of the Day [hours]
Average CO2‐level
Minimum CO2‐level
Maximum CO2‐level
300
350
400
450
500
550
600
650
700
0:00 2:00 4:00 6:00 8:00 10:00 12:00 14:00 16:00 18:00 20:00 22:00
CO2‐level [ppm]
Time of the Day [hours]
Average CO2‐level
Minimum CO2‐level
Maximum CO2‐level
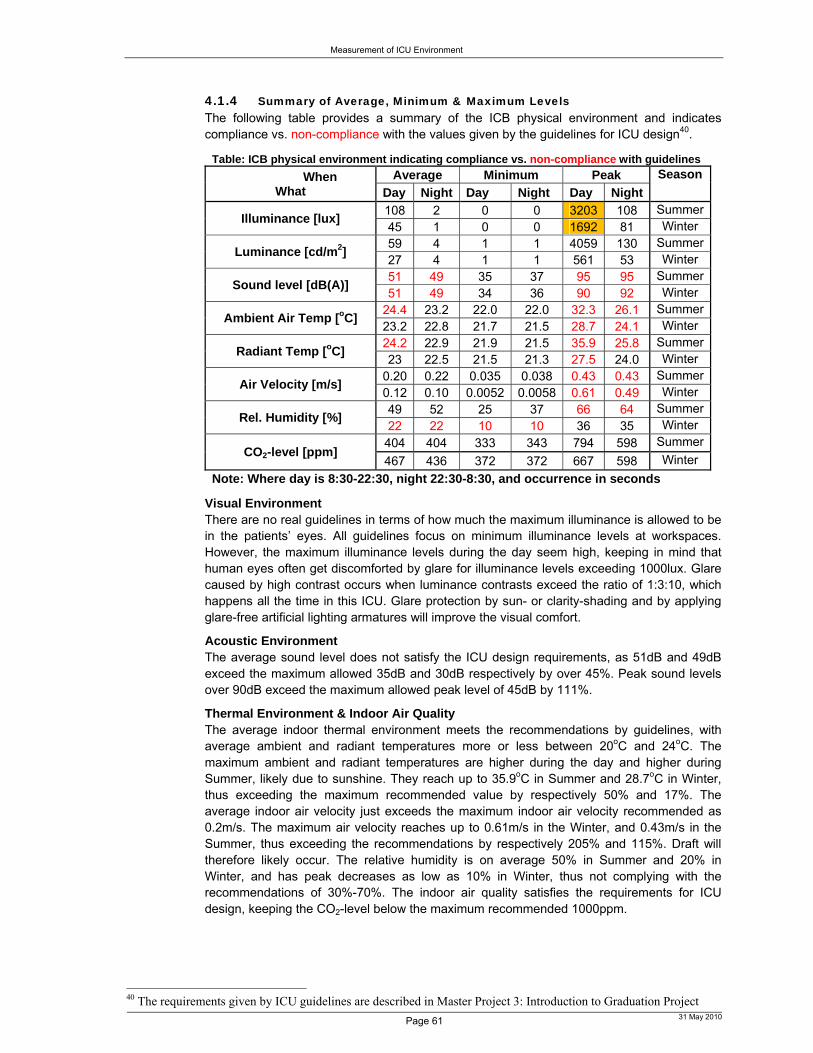
Measurement of ICU Environment
Page 61 31 May 2010
4.1.4 Summary of Average, Minimum & Maximum Levels The following table provides a summary of the ICB physical environment and indicates compliance vs. non-compliance with the values given by the guidelines for ICU design40.
Table: ICB physical environment indicating compliance vs. non-compliance with guidelines
When What
Average Minimum Peak Season
Day Night Day Night Day Night
Illuminance [lux] 108 2 0 0 3203 108 Summer45 1 0 0 1692 81 Winter
Luminance [cd/m2] 59 4 1 1 4059 130 Summer27 4 1 1 561 53 Winter
Sound level [dB(A)] 51 49 35 37 95 95 Summer51 49 34 36 90 92 Winter
Ambient Air Temp [oC] 24.4 23.2 22.0 22.0 32.3 26.1 Summer23.2 22.8 21.7 21.5 28.7 24.1 Winter
Radiant Temp [oC] 24.2 22.9 21.9 21.5 35.9 25.8 Summer23 22.5 21.5 21.3 27.5 24.0 Winter
Air Velocity [m/s] 0.20 0.22 0.035 0.038 0.43 0.43 Summer0.12 0.10 0.0052 0.0058 0.61 0.49 Winter
Rel. Humidity [%] 49 52 25 37 66 64 Summer22 22 10 10 36 35 Winter
CO2-level [ppm] 404 404 333 343 794 598 Summer
467 436 372 372 667 598 Winter
Note: Where day is 8:30-22:30, night 22:30-8:30, and occurrence in seconds
Visual Environment There are no real guidelines in terms of how much the maximum illuminance is allowed to be in the patients’ eyes. All guidelines focus on minimum illuminance levels at workspaces. However, the maximum illuminance levels during the day seem high, keeping in mind that human eyes often get discomforted by glare for illuminance levels exceeding 1000lux. Glare caused by high contrast occurs when luminance contrasts exceed the ratio of 1:3:10, which happens all the time in this ICU. Glare protection by sun- or clarity-shading and by applying glare-free artificial lighting armatures will improve the visual comfort.
Acoustic Environment The average sound level does not satisfy the ICU design requirements, as 51dB and 49dB exceed the maximum allowed 35dB and 30dB respectively by over 45%. Peak sound levels over 90dB exceed the maximum allowed peak level of 45dB by 111%.
Thermal Environment & Indoor Air Quality The average indoor thermal environment meets the recommendations by guidelines, with average ambient and radiant temperatures more or less between 20oC and 24oC. The maximum ambient and radiant temperatures are higher during the day and higher during Summer, likely due to sunshine. They reach up to 35.9oC in Summer and 28.7oC in Winter, thus exceeding the maximum recommended value by respectively 50% and 17%. The average indoor air velocity just exceeds the maximum indoor air velocity recommended as 0.2m/s. The maximum air velocity reaches up to 0.61m/s in the Winter, and 0.43m/s in the Summer, thus exceeding the recommendations by respectively 205% and 115%. Draft will therefore likely occur. The relative humidity is on average 50% in Summer and 20% in Winter, and has peak decreases as low as 10% in Winter, thus not complying with the recommendations of 30%-70%. The indoor air quality satisfies the requirements for ICU design, keeping the CO2-level below the maximum recommended 1000ppm.
40 The requirements given by ICU guidelines are described in Master Project 3: Introduction to Graduation Project

Measurement of ICU Environment
Page 62 31 May 2010
4.1.5 Summary of Occurrence Distribution Illuminance [lux]
The following graph indicates the sum of the occurrence count of certain ranges of levels at a certain time of the day for all days measured in the Summer, expressed in percentage of the total number of days measured. For example, if a lux level between 100 and 150lux occurs 4000times (so 4000 seconds measured) between 11:00 and 12:00 o’clock of all days measured, and the total measurement time is 1 hour times all days measured, e.g. 300 days, then the percentage indicated in the graph is 4000/(3600*300). This graph indicates that during the day around 30% of all days measured the illuminance level in the patient’s eyes is between 25 and 50lux, and around 40% of the time the illuminance level is between 0-25lux.
Figure: Illuminance range levels occurrence percentage per hour in Summer
More interesting is how often maximum levels are exceeded within a certain hour of the day using cumulative41 count expressed in percentage of the total number of days measured. Higher illuminance levels are exceeded somewhat more often in the afternoon than in the morning. About 5% of the time between 14:00 and 16:00 o’clock the illuminance level in the patient’s eyes exceeds 800lux. Comparing this with the requirement of minimum 500lux on a desk, 800lux in the eyes of a resting patient seems too high. During the night illuminance levels hardly ever exceed 25lux. So lights aren’t often on in the night.
Figure: Cumulative occurrence percentage of illuminance level exceeding per hour (Summer)
Figure: Cumulative occurrence percentage of illuminance level exceeding per hour (Winter) 41 Meaning that an illuminance level of 300lux is counted once in each of the following categories; >200lux, >150lux, >100lux, >75lux, >50lux, >25lux, >0lux.
0%
20%
40%
60%
80%
100%
00 02 04 06 08 10 12 14 16 18 20 22
Occurence
Percentage
[%]
Time [hours]
0‐25lux25‐50lux50‐75lux75‐100lux100‐150lux150‐200lux200‐400lux400‐600lux600‐800lux>800lux
0%
20%
40%
60%
80%
100%
00 02 04 06 08 10 12 14 16 18 20 22
Illuminan
ce Occurence
Percentage [%]
Time [hours]
>0 lux
>25 lux
>50 lux
>75 lux
>100 lux
>150 lux
>200 lux
>400 lux
>600 lux
>800 lux
0%
20%
40%
60%
80%
100%
00 02 04 06 08 10 12 14 16 18 20 22
Illuminan
ce Occurence
Percentage [%]
Time [hours]
>0 lux
>10 lux
>20 lux
>30 lux
>40 lux
>50 lux
>75 lux
>100 lux
>200 lux
>400 lux

Measurement of ICU Environment
Page 63 31 May 2010
Note the different lux ranges between the Summer and Winter graph above. The Summer graph shows more of a curve, meaning that higher values are exceeded during noon, with decreasing values being exceeded towards morning or eve, whereas the Winter graph shows more or less constant values being exceeded over the day. The difference between occurrence of certain values being exceeded is about 5-10% more occurrence during the Summer than during the Winter. The occurrence of exceeding of values between 25-75lux decreases after 18:00 to 0% in the Summer, while it stays constant around 40% for the Winter. So Summer eves values exceed only 25lux, while Winter eves exceed 50lux.
The following graphs indicate the cumulative occurrence count of exceeding certain illuminance changes per second at a certain time of the day in the Summer vs. the Winter, expressed in percentage of the total number of days measured. The Summer graph shows changes starting only at 12:00 and ending around 18:00, while the Winter graph shows changes starting at 10:00 and ending at 16:00. The occurrence of illuminance changes exceeding 25lux/sec in the Summer or 10lux/sec in the Winter is very small, varying between 0-2.5% over the time of the day. Sudden high illuminance changes, i.e. over 100lux/sec, do occur rarely during the day, about 0.5% during Summer noon hours and only 0.1% at noon for the Winter, but hardly ever occur at night.
Figure: Cumulative occurrence percentage of illuminance change per second exceeding per
hour (Summer)
Figure: Cumulative occurrence percentage of illuminance change per second exceeding per
hour (Winter)
Illuminance changes per 5 seconds occur somewhat more often than per second, i.e. exceeding 100lux/5sec occurs about 2% of the time during the same afternoon hours as the change per second occurred only 0.5% of the time during Summer. Exceeding 100lux/5sec occurs about 1% of the time at noon, where non is from 12:00 to 15:00 as compared to the noon from 13:00 to 14:00 that was exceeded 0.1% of the time for a change per second. Besides the scale change the graphs are similar.
0.0%
0.5%
1.0%
1.5%
2.0%
2.5%
00 02 04 06 08 10 12 14 16 18 20 22
ΔIlluminan
ce/sec Occurence
Percentage [%]
Time [hours]
>0 Δlux/sec
>25 Δlux/sec
>50 Δlux/sec
>75 Δlux/sec
>100 Δlux/sec
>150 Δlux/sec
>200 Δlux/sec
>400 Δlux/sec
>600 Δlux/sec
>800 Δlux/sec
0.0%
0.5%
1.0%
1.5%
2.0%
2.5%
00 02 04 06 08 10 12 14 16 18 20 22
ΔIlluminan
ce/sec Occurence
Percentage [%]
Time [hours]
>0 Δlux/sec
>10 Δlux/sec
>20 Δlux/sec
>30 Δlux/sec
>40 Δlux/sec
>50 Δlux/sec
>75 Δlux/sec
>100 Δlux/sec
>200 Δlux/sec
>400 Δlux/sec
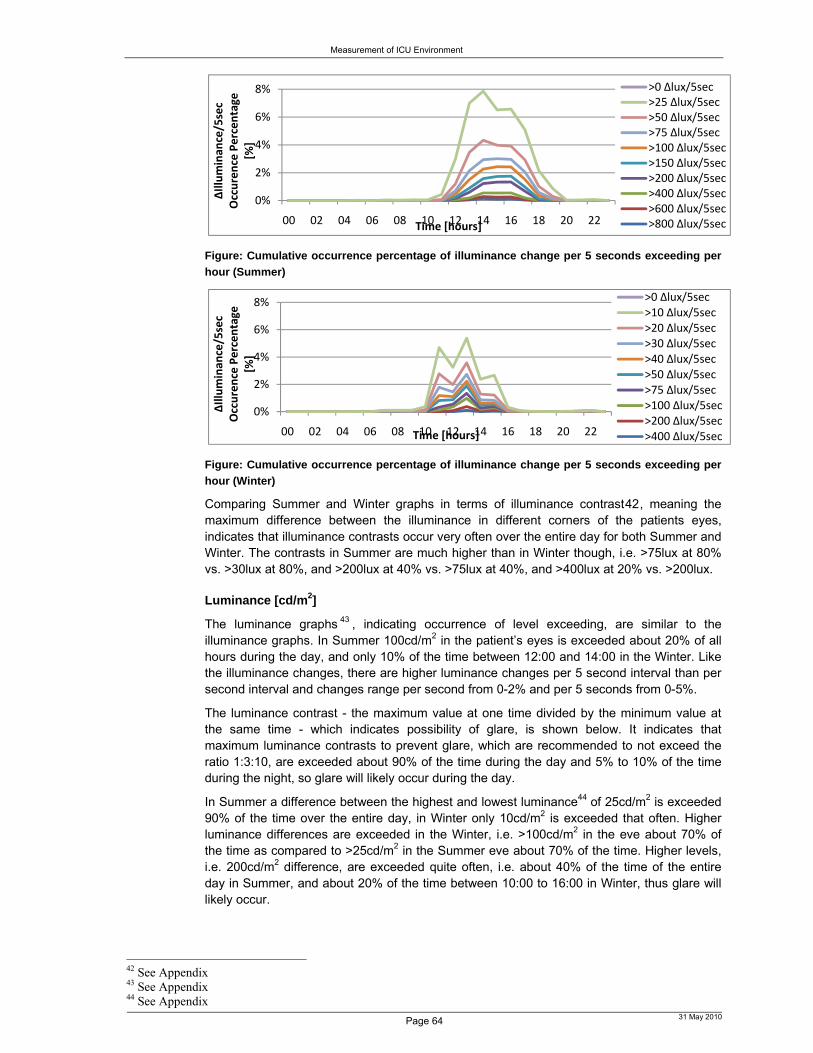
Measurement of ICU Environment
Page 64 31 May 2010
Figure: Cumulative occurrence percentage of illuminance change per 5 seconds exceeding per
hour (Summer)
Figure: Cumulative occurrence percentage of illuminance change per 5 seconds exceeding per
hour (Winter)
Comparing Summer and Winter graphs in terms of illuminance contrast42, meaning the maximum difference between the illuminance in different corners of the patients eyes, indicates that illuminance contrasts occur very often over the entire day for both Summer and Winter. The contrasts in Summer are much higher than in Winter though, i.e. >75lux at 80% vs. >30lux at 80%, and >200lux at 40% vs. >75lux at 40%, and >400lux at 20% vs. >200lux.
Luminance [cd/m2]
The luminance graphs 43 , indicating occurrence of level exceeding, are similar to the illuminance graphs. In Summer 100cd/m2 in the patient’s eyes is exceeded about 20% of all hours during the day, and only 10% of the time between 12:00 and 14:00 in the Winter. Like the illuminance changes, there are higher luminance changes per 5 second interval than per second interval and changes range per second from 0-2% and per 5 seconds from 0-5%.
The luminance contrast - the maximum value at one time divided by the minimum value at the same time - which indicates possibility of glare, is shown below. It indicates that maximum luminance contrasts to prevent glare, which are recommended to not exceed the ratio 1:3:10, are exceeded about 90% of the time during the day and 5% to 10% of the time during the night, so glare will likely occur during the day.
In Summer a difference between the highest and lowest luminance44 of 25cd/m2 is exceeded 90% of the time over the entire day, in Winter only 10cd/m2 is exceeded that often. Higher luminance differences are exceeded in the Winter, i.e. >100cd/m2 in the eve about 70% of the time as compared to >25cd/m2 in the Summer eve about 70% of the time. Higher levels, i.e. 200cd/m2 difference, are exceeded quite often, i.e. about 40% of the time of the entire day in Summer, and about 20% of the time between 10:00 to 16:00 in Winter, thus glare will likely occur.
42 See Appendix 43 See Appendix 44 See Appendix
0%
2%
4%
6%
8%
00 02 04 06 08 10 12 14 16 18 20 22ΔIlluminan
ce/5sec
Occurence Percentage
[%]
Time [hours]
>0 Δlux/5sec>25 Δlux/5sec>50 Δlux/5sec>75 Δlux/5sec>100 Δlux/5sec>150 Δlux/5sec>200 Δlux/5sec>400 Δlux/5sec>600 Δlux/5sec>800 Δlux/5sec
0%
2%
4%
6%
8%
00 02 04 06 08 10 12 14 16 18 20 22
ΔIlluminan
ce/5sec
Occurence Percentage
[%]
Time [hours]
>0 Δlux/5sec>10 Δlux/5sec>20 Δlux/5sec>30 Δlux/5sec>40 Δlux/5sec>50 Δlux/5sec>75 Δlux/5sec>100 Δlux/5sec>200 Δlux/5sec>400 Δlux/5sec
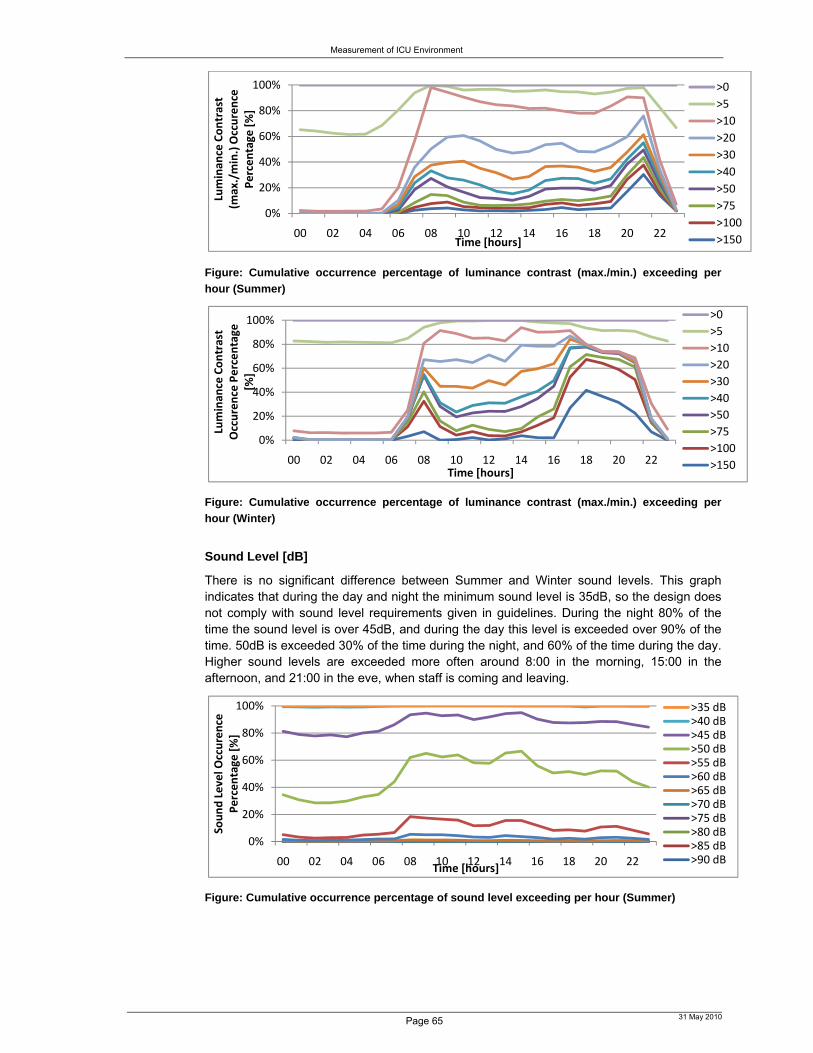
Measurement of ICU Environment
Page 65 31 May 2010
Figure: Cumulative occurrence percentage of luminance contrast (max./min.) exceeding per
hour (Summer)
Figure: Cumulative occurrence percentage of luminance contrast (max./min.) exceeding per
hour (Winter)
Sound Level [dB]
There is no significant difference between Summer and Winter sound levels. This graph indicates that during the day and night the minimum sound level is 35dB, so the design does not comply with sound level requirements given in guidelines. During the night 80% of the time the sound level is over 45dB, and during the day this level is exceeded over 90% of the time. 50dB is exceeded 30% of the time during the night, and 60% of the time during the day. Higher sound levels are exceeded more often around 8:00 in the morning, 15:00 in the afternoon, and 21:00 in the eve, when staff is coming and leaving.
Figure: Cumulative occurrence percentage of sound level exceeding per hour (Summer)
0%
20%
40%
60%
80%
100%
00 02 04 06 08 10 12 14 16 18 20 22Luminan
ce Contrast
(max./min.) Occurence
Percentage
[%]
Time [hours]
>0
>5
>10
>20
>30
>40
>50
>75
>100
>150
0%
20%
40%
60%
80%
100%
00 02 04 06 08 10 12 14 16 18 20 22
Luminan
ce Contrast
Occurence Percentage
[%
]
Time [hours]
>0
>5
>10
>20
>30
>40
>50
>75
>100
>150
0%
20%
40%
60%
80%
100%
00 02 04 06 08 10 12 14 16 18 20 22
Sound Level O
ccurence
Percentage [%]
Time [hours]
>35 dB>40 dB>45 dB>50 dB>55 dB>60 dB>65 dB>70 dB>75 dB>80 dB>85 dB>90 dB

Measurement of ICU Environment
Page 66 31 May 2010
Ambient & Radiant Temperature [oC]
The radiant and ambient temperature curves are very similar. In Summer the temperature doesn’t get below 22oC, in Winter it does rarely during the night, which is not too bad as night temperatures are usually preferred to be somewhat cooler for sleeping than daytime temperatures. During the Summer days 26oC temperatures are exceeded 30% of the time for the entire afternoon. In Winter temperatures hardly exceed 24oC, while in Summer they exceed 24oC almost all the time. In Summer 28oC temperatures are exceeded about 20% of the time in the afternoon. This is quite hot for staff, visitors and patients.
Figure: Cumulative occurrence percentage of ambient temperature exceeding per hour
(Summer)
Figure: Cumulative occurrence percentage of ambient temperature level exceeding per hour
(Winter)
Relative Humidity [%]
The relative humidity is very different if we compare Summer and Winter, and also if we compare day and night times. Summer night time relative humidities exceed 50% 60 to 80% of the time, while Winter relative humidities exceed 20% 60 to 70% of the time. So Winter relative humidities are much lower. Summer relative humidities, however, exceed 50% only 40% of the time in the afternoon, as the temperature increases in the afternoon the relative humidity decreases. Relative humidities in the Winter afternoon on the contrary are rather stable, as afternoon temperatures in Winter don’t increase too much.
0%
20%
40%
60%
80%
100%
00 02 04 06 08 10 12 14 16 18 20 22
Ambient & Rad
iant
Temperature
Occurence
Percentage [%]
Time [hours]
>20 C>22 C>24 C>26 C>28 C>30 C>32 C>34 C>36 C>38 C
0%
20%
40%
60%
80%
100%
00 02 04 06 08 10 12 14 16 18 20 22
Ambient & Rad
iant
Temperature
Occurence
Percentage [%]
Time [hours]
>20 C>22 C>24 C>26 C>28 C>30 C>32 C>34 C>36 C>38 C

Measurement of ICU Environment
Page 67 31 May 2010
Figure: Cumulative occurrence percentage of relative humidity exceeding per hour (Summer)
Figure: Cumulative occurrence percentage of relative humidity exceeding per hour (Winter)
Air Velocity [m/s]
Figure: Cumulative occurrence percentage of air velocity exceeding per hour (Summer)
Figure: Cumulative occurrence percentage of air velocity exceeding per hour (Winter)
Air velocities exceed 0.2m/s 40% to 60% of the time during the entire day in Summer, and 10% to 20% during the entire day in Winter. As the maximum air velocity according to guidelines is 0.2m/s to prevent draft, draft will likely occur often in Summer. In Summer and Winter air velocity changes per 30 seconds45 exceed 0.1m/s about 20% of the time during the entire day and night, but they hardly ever exceed 0.2m/s. This indicates that large changes in air velocity either occur gradually, or that they are measurement errors.
45 See graphs in Appendix
0%
20%
40%
60%
80%
100%
00 02 04 06 08 10 12 14 16 18 20 22Relative Humidity
Occurence
Percentage
[%]
Time [hours]
>0%>10%>20%>30%>40%>50%>60%>70%>80%>90%
0%
20%
40%
60%
80%
100%
00 02 04 06 08 10 12 14 16 18 20 22
Relative Humidity
Occurence
Percentage
[%]
Time [hours]
>0%>10%>20%>30%>40%>50%>60%>70%>80%>90%
0%
20%
40%
60%
80%
100%
00 02 04 06 08 10 12 14 16 18 20 22
Air Velocity Occurence
Percentage
[%]
Time [hours]
>0 m/s>0.2 m/s>0.4 m/s>0.6 m/s>0.8 m/s>1.0 m/s>1.2 m/s>1.4 m/s>1.6 m/s>1.8 m/s
0%
20%
40%
60%
80%
100%
00 02 04 06 08 10 12 14 16 18 20 22
Air Velocity
Occurence
Percentage [%]
Time [hours]
>0 m/s>0.2 m/s>0.4 m/s>0.6 m/s>0.8 m/s>1.0 m/s>1.2 m/s>1.4 m/s>1.6 m/s>1.8 m/s

Measurement of ICU Environment
Page 68 31 May 2010
CO2-level [ppm]
Figure: Cumulative occurrence percentage of CO2-level exceeding per hour (Summer)
Figure: Cumulative occurrence percentage of CO2-level exceeding per hour (Winter)
CO2-levels exceed higher levels more often during the day than in the night and more often in Winter than Summer, as during the day there are more people at the ICU. The difference between Summer and Winter might be explained by the ICU being more closed during the cold Winter, though ICUs should normally always be closed. In Summer 400ppm is exceeded about 60% of the time, whereas in Winter about 60% of the time 450ppm is exceeded.
4.1.6 Summary of Relative Peaks The following graph shows the distribution of the variation of the normalized average environmental variables for the Summer. As there is a large difference between lighting levels during the day and night the normalized values during the day show high peaks that are out of range as compared to the other environmental variables.
Figure: Normalized variation in average of environmental variable (Summer)
The following zoom of the previous figure shows that the relative peaks of all other environmental variables except for lighting are roughly equally high, so lighting changes the most. When the temperature is low in the morning the relative humidity is high, and when the temperature is high in the afternoon due to solar heat gain, the relative humidity decreases.
0%
20%
40%
60%
80%
100%
00 02 04 06 08 10 12 14 16 18 20 22CO2‐level O
ccurence
Percentage
[%]
Time [hours]
>300 ppm>350 ppm>375 ppm>400 ppm>450 ppm>500 ppm>550 ppm>600 ppm>650 ppm>700 ppm
0%
20%
40%
60%
80%
100%
00 02 04 06 08 10 12 14 16 18 20 22
CO2‐level
Occurence
Percentage [%]
Time [hours]
>300 ppm>350 ppm>375 ppm>400 ppm>450 ppm>500 ppm>550 ppm>600 ppm>650 ppm>700 ppm
0
1
2
3
4
5
6
0:00 2:00 4:00 6:00 8:00 10:00 12:00 14:00 16:00 18:00 20:00 22:00
Norm
alized Variation in
Average
of En
vironmental
Variable
Time of the Day [hours]
Ambient Temperature Radiant TemperatureAir VelocityCO2‐levelRelative HumiditySound LevelLuminanceIlluminance

Measurement of ICU Environment
Page 69 31 May 2010
Figure: Normalized variation in average of environmental variable (zoom) (Summer)
The following graphs show the variation distribution of the normalized average environmental variables for the Winter. Note the difference in y-axis scale, indicating that in the Winter the lighting peaks a little less than in Summer. In Winter the lighting jumps at 8:00, 17:00 and 22:00 as lights are switched on, whereas in Summer gradual increase occurs due to daylight increase. The air velocity in the Winter diverts more from the average than in Summer, while all other environmental variables divert a little less from the average than in Summer.
Figure: Normalized variation in average of environmental variable (Winter)
Figure: Normalized variation in average of environmental variable (zoom) (Winter)
The following sections show the average, minimum and maximum variation distributed over a 24-hour period for each environmental variable. These values are measured per second continuously over 11 months of 24-hour periods in the ICB at the UMCG.
0.8
0.85
0.9
0.95
1
1.05
1.1
1.15
1.2
0:00 2:00 4:00 6:00 8:00 10:00 12:00 14:00 16:00 18:00 20:00 22:00
Norm
alized Variation in
Average
of En
vironmen
tal
Variable
Time of the Day [hours]
Ambient Temperature Radiant TemperatureAir Velocity
CO2‐level
Relative HumiditySound Level
Luminance
Illuminance
0
1
2
3
4
5
0:00 2:00 4:00 6:00 8:00 10:00 12:00 14:00 16:00 18:00 20:00 22:00
Norm
alized Variation in
Average
of En
vironmental
Variable
Time of the Day [hours]
Radiant TemperatureAir Velocity
CO2‐level
Sound Level
Luminance
Illuminance
Relative HumidityAmbient Temperature
0.7
0.8
0.9
1
1.1
1.2
1.3
1.4
0:00 2:00 4:00 6:00 8:00 10:00 12:00 14:00 16:00 18:00 20:00 22:00
Norm
alized Variation in
Average
of En
vironmental V
ariable
Time of the Day [hours]
Radiant TemperatureAir Velocity
CO2‐level
Sound Level
Luminance
Illuminance
Relative HumidityAmbient Temperature

Measurement of ICU Environment
Page 70 31 May 2010
4.2 Sleep Pattern
4.2.1 Analysis Method & Assumptions In the analysis of the patients’ sleep patterns I compare the BIS46 data, which is used to analyse the sleep pattern, with the average sleep pattern of healthy human beings below.
Figure: Typical examples of changes in the BISpectral Index during one sleep cycle. [Sle’99] Table: BIS Values per Sleep Stage. [Sle’99] Note: Values are mean ± SD, data are from 28 sleep stage transitions in five subjects.
After a latency of 10–20 min, the subject descended through light sleep to slow-wave sleep for approximately 60 min. This was followed by a return to light sleep and a short period of REM sleep. The cycle then repeated. Sleep spindles (light sleep, sleep stage 2) started to seem in the EEG at BIS levels of 75–90. Slow-wave sleep (sleep stage ¾) was associated with BIS levels in the range of 20–70. The BIS value dropped very low. The minimal BIS in all cases was <47 and was in the 20s in three subjects. REM sleep occurred with the BIS in the range of 75–92. Each time the subject awoke briefly (arousal), the BIS abruptly increased to >90 (usually >96). The American Sleep Disorder Association describes an arousal as a 3 to 15 second during increase in BIS level, and an awakening as a more than 15 second during increase in BIS level. The BIS decreased significantly with increased sleep depth. [Sle’99]
The following table indicates how often arousals and awakenings occur in healthy human beings, what sleep stages occur how often, and what is their total sleep time for comparison with the sleep data of ICU patients.
Table: Mean Total ASDA Arousals, Arousal Index, Awakenings, Total Sleep Time and Sleep stages per age group
Age Arousal
Index AI
TST
[hours]
Sleep
Efficiency [%]
Total #
Arousal
(3-15
sec.)
BIS>90
(usually
96)
Awakenings
per hour
(>15 sec.
Duration) =
BIS=98
Awakenings
per hour
(>2 min.
Duration) =
BIS=98
Stage 1
[%]
Stage 2 [%]
=
BIS 75-90
Stage 3/4
[%] =
BIS 20-70
Stage REM
[%] =
BIS 75-92
M F M F - - M F M F M F M F M F
Aver
age
11+/-4
per
hour
21 (ASDA) 4 (Recht-
schaffen
and Kales)
18-30 10.8+/-
4.6
7.5-8 91-99 94-
98
83+/-33 22.9 0-6 0-2 2-6 41-51 46-
58
6-26 11-25 22-
34
21-
29
30-45 16.8+/-
6.2
6 40m-7
20m
85-99 90-
99
116+/-
44
29.8 1-7 0-5 3-
11
2-8 45-66 45-
63
2-18 4-21 19-
27
21-
31
46 Which is described in further detail in the literature research of phase 1 of this project, completed during master project 3 ‘Introduction to the Graduation Project’.

Measurement of ICU Environment
Page 71 31 May 2010
45-60 16.5+/-
5.6
6 40m-7
20m
88-96 86-
100
109+/-
22
34.7 4-7 3-7 4-
12
3-7 52-72 51-
65
0-12 5-17 17-
25
19-
25
60+ 21.9+/-
6.8
5-6/24 +
after-noon
nap (1
hour)
57-97 73-
96
130+/-
42
42 4-10 3-
12
6-
14
4-
12
38-72 44-
64
0-3 0-18 11-
27
15-
25
Note: ASDA = American Sleep Disorders Association, AI = arousal index, TST = total sleep time, REM = rapid eye movement sleep
In this research I had to make a few assumptions regarding the analysis of the BIS data, as, as described in phase 1 and above, certain BIS values can have multiple interpretations in terms of sleep or wakeness.
Awake: BIS≥89 Asleep: BIS<89 Arousal definition: If BIS≥92 for >3 seconds and <15 seconds, where the BIS before
that was <90 Awakening definition: If BIS>92 for >15 seconds, where the BIS before that was <89
4.2.2 Summary of Sleep Patterns The following table gives a summary of the occurrence of certain BIS levels – which are related to depth of sleep and sleep type – in percentage of the total time measured.
Table: BIS occurrence in percentage [%] of total sleep time and arousal and awakening occurrence
Day Night Day Night slow-wave sleep
BIS 49-69 0.046 0.042 BIS 0-10 0 0
Light sleep BIS 72-90 0.041 0.039
BIS 10-20
0 0.017
REM-sleep BIS 77-89 0.032 0.024
BIS 20-30
0 0.16
Asleep BIS 0-89; Total Sleep Time 16 23
BIS 30-40
3.9 7.6
Awake BIS 89-100; Total Awake Time 84 77
BIS 40-50
5.3 7.8
Arousal BIS > 92 for 3-15 seconds, after
BIS<89 17 times
BIS 50-60
2.5 1.9
Awakening BIS > 92 for >15 seconds, after BIS<89 72 times
BIS 60-70
1.8 1.9
Note: Where day is from 8:30 - 22:30 and night is from 22:30 -
8:30 Where occurrence is in seconds
BIS 70-80
1.0 1.6
BIS 80-90
2.7 2.1
BIS 90-100
83 77

Measurement of ICU Environment
Page 72 31 May 2010
Figure: Sleep Pattern of 3 ICB patients
The above figure shows that patient C slept most of the time, while patient A was more or less always awake. Patient B seems to have a somewhat more normal pattern, with regular fluctuations between wakeness and sleep periods. However, since there is too little sleep pattern data, no conclusions can be derived from this data.
Figure: BIS level variation of patient B over the night (1:00-9:00) of November 6th 2009
The above graph47 shows the sleep pattern of patient B over a night. Sleep spindles seem to occur regularly, with longer wakeness periods in between than for healthy human beings.
4.2.3 Sleep Quality & Quantity48 The following schematic representation49 of the sleep architecture and sleep distribution of patients indicates difference in sleep quantity and quality of patients at the ICB.
47 For a more elaborate explanation of the sleep pattern over this night for this particular patient, see Appendix. 48 The descriptive list of relations in the appendix (that can be filled in in future research once sufficient sleep pattern data is collected), describes the sleep pattern and significance of relation with environmental variables, patient gender or age, duration of stay at the ICU and for different ICUs. 49 The white period without time indication for patient A and B indicates that there is no BIS data for that time.
0
10
20
30
40
50
60
70
80
90
100
0:00 2:00 4:00 6:00 8:00 10:00 12:00 14:00 16:00 18:00 20:00 22:00
BIS [‐]
Time of the Day [hours]
Patient A Average
Patient A Minimum
Patient A Maximum
Patient B
Patient C
0
10
20
30
40
50
60
70
80
90
100
0101010101020202020303030304040404050505050606060606070707070808080809
BIS [‐]
Time of the Day [hours]

Measurement of ICU Environment
Page 73 31 May 2010
Figure: Schematic representation of the sleep architecture and sleep distribution of 3 patients at the ICB over a 24-
hour period, where black means period of sleep and white means period of wakeness.
Comparing this with the schematic representation of the sleep architecture as measured for ICU patients by [Gaz’01], we see different sleep patterns. In [Gaz’01] most patients have many short sleep periods, while our patient A ‘sleeps’ more or less the entire period without interruptions, while our patient C seems to be awake the entire period.
00 01 02 03 04 05 06 07
Patient A
00 01 02 03 04 05 06 07 08
Patient B
00 01 02 03 04 05 06 07 08
Patient C Day 1
00 01 02 03 04 05 06 07 08
Patient C Day 2
00 01 02 03 04 05 06 07 08
Patient C Day 3
00 01 02 03 04 05 06 07 08
Patient C Day 4
00 01 02 02 03 04 05 06 07
Patient C Day 5

Measurement of ICU Environment
Page 74 31 May 2010
Figure: Schematic representation of the sleep architecture and sleep distribution of patients at the ICU. [Gaz’01]

Measurement of ICU Environment
Page 75 31 May 2010
5 Conclusion The indoor ICU physical environment is not as constant as expected from ICU design requirements, and it does not always comply with requirements and recommendations. Largest differences between day and night and between Summer and Winter are in the visual environment and thermal environment.
Future research is required to determine the effect of this environment on the health and comfort of the ICU occupants.
6 Future Research 6.1 Future Research
Future research can include the following three options;
Miniscule gyrometer stuck on patient’s head, to measure the direction of the patient’s head to increase accuracy of measurement results
Spectrummeter near illuminance meters to measure the light spectrum, as research indicates that blue lights and red lights have different impact on waking people up.
Measure more BIS data synchronuous with environmental data, to compare the effect of the environment on the patient’s sleep pattern.
o Measure sleep pattern of healthy volunteers who spend a night in the ICU, to see if the effect of the environment on healthy human beings is the same as on patients.
o Measure the environment and sleep pattern in multiple architecturally different ICUs, or keep varying one aspect of the architectural environment, e.g. a wall color or art object.
o As results of the above comparisons between the physical environment and patients’ sleep patterns, conclusions should be made and compared to conclusions of other literature research to see what new insight this research gave. Examples of conclusions from other literature research are given in the Appendix and a more elaborate analysis of literature research which can be used for this purpose is given in phase 1 of this research.
The last option is further described below.
6.2 Comparisons of Environment vs. Sleep Pattern
We need to analyze the following:
Compare results with requirements
Compare individual environmental results with sleep architecture of all patients in total
Compare individual environmental results with sleep architecture per patient, taking into account the determined personal details, to check whether there are differences between patients with different personal variables
Compare total environmental results (of all variables together) with sleep architecture of all patients in total
Compare individual environmental results with sleep architecture of all patients per ICU between different ICUs
Compare total environmental results with sleep architectures of all patients per ICU between different ICUs
Where sleep architecture can be divided into the following 3 parts:

Measurement of ICU Environment
Page 76 31 May 2010
Arousal with peaks in environmental variables
o Where arousal is defined as a rapid increase of BIS to >90 that occurs for 3 to 15 seconds [Sle’99].
o Where peaks are defined as everything above or below a certain range, and where peaks can be divided in peaks of 1 times for example 5dB higher, or 2 times 5dB higher, etc.
This way we can draw lines at the moments the patient arouses, which provides information about the sleep quality. More arousals than normal indicates that the environment is very disruptive, whereas less arousals than normal either indicates that the environment is not very disruptive, or that the patient has too much sedatives so that he/she won’t wake up from any influence.
Patients awakenings with peaks in environmental variables
o Where an awakening is defined as an increase in BIS to >90 for >15 seconds.
This way we can make the schematic representation of when patients are asleep and when they are awake with black thick and thin lines, as done in [Gaz’01], which indicates clearly how often a patient wakes up, so how disruptive the environment is, but also how long the patient sleeps each time and in total.
Sleep stages with peaks in environmental variables
o This way we can draw graphs of sleep stages and therefore of the sleep architecture of patients, which does not only reveal when the patient is asleep/ awake and when the patient falls asleep/wakes up, but also how deep asleep the patient is.
6.3 Variables & Relations
The following are the variables and relations that are part of the analyses of this research. Variables:
Continuous variable: are measured every second
o Illuminance, luminance
o Sound-level
o Air temperature, Radiant temperature, Relative Humidity, Air Speed
o CO2-level
o BIS index
o Amount of pain medication
o Duration of stay
Dichotomy variable: are measured not continuous, only two stages possible (sleep or awake (e.g. sleep pattern if we don’t take into account sleep stages))
o Male or female
o Day-time versus night-time sleep
Discrete variable: are measured not continuous, only in multiple stages:
o Per year the age
o Per illness
o Per type of pain medication
o Per type of HAI

Measurement of ICU Environment
Page 77 31 May 2010
o Per ICU design (we consider three ICU designs, categorized as new, middle and old)
Relations:
Correlation
o Independent effect of several variables
o Does not say anything about causality
E.g. check per person the correlation over time of an indicidual environmental variable with respect to sleep, stress, and duration of stay
Biserial relation
o Between 2 variables
Logistic regression/ multi regression
o The total effect of several variables
E.g. the total effect of an ICU environment on the sleep pattern of the patient
Correlation - Pearson
We first want to find out per person what the correlation between each environmental variable and the sleep pattern is. We will analyse this using the Pearson correlation analysis. Further, we can use the Pearson correlation analysis to analyze the correlation between each environmental variable with respectively the duration of stay (as a general measure for the recovery rate of the patient), the blood pressure, the heart beat and the pain medication (as measure for the stress, which is indirectly also a measure for the recovery rate of the patient), and the number and type of Hospital Acquired Infections (as a measure for the air quality and thermal comfort). E.g. does the CO2-level correlate to the number of Hospital Acquired Infections? Pearson’s correlation analysis and one-way analysis of variance are indicated in the analysis excel sheet as , and are used to determine the relationship of the following measured or derived variables:
Illuminance [lux] Illuminance change per time (per sec. and per 5 sec.) [lux] Average luminance [cd/m2] Average luminance change per time (per sec. and per 5 sec.) [cd/m2] Luminance contrast (largest cd/m2 – smallest cd/m2) [cd/m2] Weighted sound-level [dB(A)] Weighted sound-level change per time (per sec. and per 5 sec.) [dB(A)] Air temperature [oC] Air temperature change per time (per sec. and per 5 sec.) [oC] Radiant temperature [oC] Radiant temperature change per time (per sec. and per 5 sec.) [oC] Air velocity [m/s] Air velocity change per time (per sec. and per 5 sec.) [m/s] Relative Humidity [%] Relative Humidity change per time (per sec. and per 5 sec.) [%] CO2-level [-] CO2-level change per time (per sec. and per 5 sec.) [-]
to the following factors: Sleep pattern:
Arousal indexes (e.g. noise, nonnoise, and total) o BIS index o ΔBIS/sec. o ΔBIS/5 sec.
Total sleep time (TST) o Day-time sleep (total time and percentage of total sleep time) o Night-time sleep (total time and percentage of total sleep time)
Additional indicators:

Measurement of ICU Environment
Page 78 31 May 2010
Duration of stay Blood pressure (stress indicator) Heart beat (stress indicator) Pain medication (stress indicator) HAI
Output: Sleep vs. Wakefulness illuminance levels Check for which variables the Total Sleep Time is low:
Illuminance-specific Total Sleep Time = …. o Illuminance-specific Total Sleep Time for 0-50lux/ Total Time for 0-
50lux= …. o Illuminance-specific Total Sleep Time for 50-100lux/ Total Time for
50-100lux = …. o Illuminance-specific Total Sleep Time for 100-150lux/ Total Time
for 100-150lux = …. o Etc.
Illuminance-change-specific Arousal Index = …. o ΔIlluminance-specific Arousal Index for 0-50Δlux= …. o ΔIlluminance-specific Arousal Index for 50-100Δlux= …. o ΔIlluminance-specific Arousal Index for 100-150Δlux= …. o Etc.
Etc. Check which variable-specific Arousal Indexes are high:
Illuminance-specific Arousal Index = …. o Illuminance-specific Arousal Index for 0-50lux= …. o Illuminance-specific Arousal Index for 50-100lux= …. o Illuminance-specific Arousal Index for 100-150lux= …. o Etc.
Illuminance-change-specific Arousal Index = …. o ΔIlluminance-specific Arousal Index for 0-50Δlux= …. o ΔIlluminance-specific Arousal Index for 50-100Δlux= …. o ΔIlluminance-specific Arousal Index for 100-150Δlux= …. o Etc.
Etc. Compare total of variable-specific Arousal Indexes with Total Arousal Index, to see
how much influence the measured environment has on the sleep pattern of the patient, and to see how much influence other not measured factors (like illness, or architecture) have on the sleep pattern of the patient.
Compare variable-specific arousal index per gender, age, ICU, etc. Method: According to [Mon’04] p.40 we generally consider the correlation between two variables to be strong, if 0.8 ≤r ≤1 there is a significant relation, weak when 0 ≤ r ≤ 0.5 and moderate otherwise. Testing the hypothesis that the slope equals zero (meaning that there is no correlation between the two variables) is according to [Mon’04] p.284 equivalent to testing that the correlation coefficient ρ = 0. So we need to test
Ho: ρ = 0 H1: ρ ≠ 0 Where the computed value of the test statistic is:
t0 = r * sqrt (n – 3)/sqrt(1 – r2) if |t0| > tα/2,n-2, with α=0.05, the null hypothesis is rejected
Spearman’s correlation analysis is used to confirm the Pearson’s analysis. Only the Pearson’s correlation coefficients are reported if there is an agreement between these latter two analyses. Correlation – Student t test
To test whether our correlation results are valid for ‘all’ patient types, we will use the student’s t test to determine whether differences exist between personal variables like gender, age groups, illnesses, the type or amount of pain medication a patient gets, the HAI a patient has, and other factors like the duration of stay and the ICU design the patient is in, with respect to the sleep pattern of the patient and/or the correlations found with the Pearsons analysis.
E.g. the difference of significance of the correlation of the BIS index with the illuminance level between male and female

Measurement of ICU Environment
Page 79 31 May 2010
E.g. the difference of significance of the correlation of the BIS index with the weighted sound-level change per sec. between ages of 20-25 years old and 60-65 years old
E.g. the significance for 20-25 years old is 0.9, whereas for 60-65 years old it is only 0.6
Unpaired Student’s t tests are indicated in the analysis excel sheet as , and are utilized to determine if differences exist between:
Gender (personal factor) Age (personal factor) Illness (personal factor, but not taken into account in this research) Day/Night (factor) ICU design (factor)
with respect to the previous outcomes: Illuminance-specific Arousal Index = …. Illuminance-change-specific Arousal Index = …. Etc.
Output: Arousal Index:
o Illuminance-specific Arousal Index in ICB = …. o Illuminance-specific Arousal Index in THIC = …. o Illuminance-specific Arousal Index in CHIC = …. o Illuminance-specific Arousal Index during the Day = …. o Illuminance-specific Arousal Index during the Night = …. o Illuminance-specific Arousal Index for male = …. o Illuminance-specific Arousal Index for female = …. o Illuminance-specific Arousal Index for age 0-20 = …. o Illuminance-specific Arousal Index for age 20-40 = …. o Illuminance-specific Arousal Index for age 40-60 = …. o Illuminance-specific Arousal Index for age 60-80 = …. o Illuminance-specific Arousal Index for age >80 = …. o Etc.
Total Sleep Time: o Illuminance-specific Arousal Index in ICB = …. o Illuminance-specific Arousal Index in THIC = …. o Illuminance-specific Arousal Index in CHIC = …. o Etc.
For testing the significance of a relation according to [Mon’04] we need to test: Ho: ρ = 0 H1: ρ ≠ 0 With the computed value of the test statistic is:
o t0 = r * sqrt (n – 3)/sqrt(1 – r2) o if |t0| > tα/2,n-2, with α=0.05, the null hypothesis is rejected
If roughly the same correlation occurs for patients with different personal variables, we may assume that the environment has qualitatively the same influence on each patient. If large differences in results exist between different ICUs, while the environment and the personal variables were similar, there are other factors in the environment which cause these differences, for example architectural variables. According to literature, there is no significant difference if p>0.05, so a significant difference if p<0.05 [Gaz’01]. Further research will be required to determine these factors. Other techniques, like the Newman-Keuls comparisons (0.05) used in [Mar’05], could also be used, e.g. instead of student’s t test, but they are not needed for this research.
Logistic Regression
Last, the total effect of the different ICU environments on the sleep pattern of each ICUs patients is analyzed, to determine the total difference in sleep pattern between ICUs.
Physiological Rhythmicity

Measurement of ICU Environment
Page 80 31 May 2010
Physiological Rhythmicity can be analyzed in future research of this data for HR, PR, RR, and SpO2 using spectral analysis (periodogram) with SPSS 11.5 software (procedure Spectra), as further explained in [War’98] and in the appendix.
6.4 Visual Environment vs. Sleep
6.4.1 Environmental Illuminance vs. Sleep Disruption Is there a significant difference between sleep versus wakefulness (average, maximum,
and peak) illuminance levels in the area with a diameter of 1m around the patient’s head? Is there a significant relation between illuminance level and Total Sleep Time? Is there a
significant difference between day and night illuminance related wakefulness? In other words, do you wake up in the night because of a high illuminance and not in the day?
Is there a significant relation between illuminance and duration of stay? Percentage of illuminance arousals (due to a significant increase in illuminance). Compare
illuminance related arousal indexes for different illuminance levels, e.g. 0-50lux. Compare illuminance change specific related arousal indexes for different changes in illuminance levels, e.g. 0-50lux change.
Is there a significant difference between the ratio daytime illuminance-specific arousal index (number of arousals caused by illuminance per hour) versus the day-time total sleep arousal index (number of arousals per hour) and the ratio night-time illuminance-specific arousal index (number of arousals caused by illuminance per hour) versus the night-time total sleep arousal index (number of arousals per hour)? A significant difference, if daytime ratio > nighttime ratio, indicates that during the day
the influence of illuminance on the sleep architecture is larger than during the night. A significant difference, if daytime ratio < nighttime ratio, indicates that during the
night influence of illuminance on the sleep architecture is larger than during the day Is there a significant difference between the mean illuminance-specific arousal index
(number of arousals per hour specifically related to a significant increase in illuminance) as compared to the mean spontaneous (non-illuminance) arousal index (number of arousals per hour, independent of illuminance level) in the area with a diameter of 1m around the patient’s head? E.g. a high ratio illuminance-specific AI/non-illuminance sleep AI of e.g. 8/10,
indicates that the illuminance is an important variable influencing the sleep architecture of patients.
There is a significant difference between personal variables like gender, age, illness, type and amount of pain medication, HAI of a patient, duration of stay of patients, and the three ICUs with respect to: The illuminance specific arousal index or awakenings secondary to increase in
illuminance. The daytime illuminance levels (average, maximum, and peak) or for the night-time
illuminance levels (average, maximum, and peak) in the area with a diameter of 1m around the patient’s head,
If not, and there is also no difference between other physical environmental variables between ICUs, and there is a difference between daytime arousal indexes or night-time arousal indexes between ICUs, than the difference in arousal indexes between ICUs can be due to differences in architecture between ICUs.
The sleep versus wakefulness (average, maximum, and peak) illuminance levels in the area with a diameter of 1m around the patient’s head,
If so, this indicates that other factors influence the ability of patients to sleep, e.g.:
o Other physical environmental factors. o The differences in architecture of the ICUs
The non-illuminance sleep arousal index (number of arousals per hour) versus the illuminance-specific arousal index (number of arousals caused by illuminance per hour)?
Meaning, is there a significant difference between ratio THIC (illuminance-specific AI)/(non-illuminance sleep AI), ratio ICB (illuminance-specific AI)/(non-illuminance sleep AI), and ratio CHIC (illuminance-specific AI)/(non-illuminance sleep AI)?
o A high ratio indicates that illuminance is an important variable influencing the patient’s sleep pattern

Measurement of ICU Environment
Page 81 31 May 2010
o If in a certain ICU the illuminance level is higher while the ratio is lower as compared to another ICU, this indicates that in the first ICU the acceptance of illuminance is higher, due to other factors:
Other physical environmental factors Or differences in architecture
o The impact of the physical environment is measured, and therefore the impact of the architecture can be derived indirectly.
6.4.2 Environmental Luminance vs. Sleep Disruption The same questions need to be answered to determine the effect of environmental average luminance levels and luminance contrasts on sleep disruption.
6.4.3 Environmental View/ Aesthetics vs. Sleep Disruption If there is no difference between environmental-specific arousal indexes, personal-specific arousal indexes or duration of stay between ICUs, but there is a difference in total arousal indexes, type and amount of pain medication, blood pressure and heart beat and duration of stay of patients between ICUs, then the difference is likely to be due to differences in architecture, namely either:
Visual Environment
o e.g. color or texture (material) differences
Spatial Environment
o e.g. room height vs. Width ratio
If so, further future research will have to be done on the influence of the architecture.
6.5 Acoustic Environment vs. Sleep
The following questions need to be answered to determine the influence of the acoustic environment on the health and comfort of the patient.
The mean, mean maximum, and mean peak ICU environmental noise levels exceeded EPA recommendation during both the daytime and night-time hours.
The mean, mean maximum, and mean peak ICU environmental noise levels exceeded EPA recommendation during both the daytime and night-time hours. [Gaz’01]
There were no statistically significant differences (p>0.05) in mean (59.1 ± 6.1 dB(A)) versus 56.8 ± 4.9 dB(A)), mean maximum (68.5 ± 7.7 dB versus 64.6 ± 7.5 dB), or mean peak (85.9 ± 5.1 dB versus 82.8 ± 5.3 dB) noise levels between the day and night, respectively.
There were no statistically significant differences (p>0.05) in mean (59.1 ± 6.1 dB(A)) versus 56.8 ± 4.9 dB(A)), mean maximum (68.5 ± 7.7 dB versus 64.6 ± 7.5 dB), or mean peak (85.9 ± 5.1 dB versus 82.8 ± 5.3 dB) noise levels between the day and night, respectively. [Gaz’01]
There is no significant difference between the ratio daytime noise-specific arousal index (number of arousals caused by noise per hour) versus the day-time total sleep arousal index (number of arousals per hour) and the ratio night-time noise-specific arousal index (number of arousals caused by noise per hour) versus the night-time total sleep arousal index (number of arousals per hour).
o A significant difference, if daytime ratio > night-time ratio, indicates that during the day the influence of noise on the sleep architecture is larger than during the night.
o A significant difference, if daytime ratio < night-time ratio, indicates that during the night influence of noise on the sleep architecture is larger than during the day
There were no significant differences (p>0.05) between mean (58.9 ± 6.0 dB versus 57.1 ± 5.2 dB), mean maximum (68.3 ± 7.5 dB versus 64.9 ± 7.6 dB), and mean peak (85.6 ± 5.0 dB versus 84.9 ± 4.8 dB) noise levels during periods of sleep and wakefulness.

Measurement of ICU Environment
Page 82 31 May 2010
There were no significant differences (p>0.05) between mean (58.9 ± 6.0 dB versus 57.1 ± 5.2 dB), mean maximum (68.3 ± 7.5 dB versus 64.9 ± 7.6 dB), and mean peak (85.6 ± 5.0 dB versus 84.9 ± 4.8 dB) noise levels during periods of sleep and wakefulness. [Gaz’01]
Overall, 11.5% of the arousals from sleep for the entire population studied were secondary to environmental noise. Arousals related to environmental noise comprised an average of 11.5 ± 11.8% of the total arousals from sleep per subject.
Overall, 11.5% of the arousals from sleep for the entire population studied were secondary to environmental noise. Arousals related to environmental noise comprised an average of 11.5 ± 11.8% of the total arousals from sleep per subject. [Gaz’01]
The mean arousal index specifically related to environmental noise was 1.9 ± 2.1. This was significantly less (p<0.0001) than the mean spontaneous (non-noise) arousal index of 9.6 ± 4.9.
o E.g. a high ratio noise-specific AI/non-noise sleep AI of e.g. 8/10, indicates that the noise is an important variable influencing the sleep architecture of patients.
The mean arousal index specifically related to environmental noise was 1.9 ± 2.1. This was significantly less (p<0.0001) than the mean spontaneous (non-noise) arousal index of 9.6 ± 4.9. [Gaz’01]
Overall, environmental noise was responsible for 17% of the awakenings from sleep. Awakenings related to environmental noise comprised an average of 26.2 ± 24.8% (range 0-75%) of the total awakenings from sleep per subject.
Overall, environmental noise was responsible for 17% of the awakenings from sleep. Awakenings related to environmental noise comprised an average of 26.2 ± 24.8% (range 0-75%) of the total awakenings from sleep per subject. [Gaz’01]
There is a significant difference between personal variables like gender, age, illness, type and amount of pain medication, HAI of a patient, duration of stay of patients, and the three ICUs with respect to:
The noise specific arousal index or awakenings secondary to increase in weighted sound-level.
The daytime sound levels (average, maximum, and peak) or for the night-time sound levels (average, maximum, and peak) in the area with a diameter of 1m around the patient’s head, o If not, and there is also no difference between other physical environmental
variables between ICUs, and there is a difference between daytime arousal indexes or night-time arousal indexes between ICUs, than the difference in arousal indexes between ICUs can be due to differences in architecture between ICUs.
The sleep versus wakefulness (average, maximum, and peak) sound levels in the area with a diameter of 1m around the patient’s head,
If so, this indicates that other factors influence the ability of patients to sleep, e.g.:
o Other physical environmental factors. o The differences in architecture of the ICUs
The non-noise sleep arousal index (number of arousals per hour) versus the noise-specific arousal index (number of arousals caused by noise per hour)?
Meaning, is there a significant difference between ratio THIC (noise-specific AI)/(non-noise sleep AI), ratio ICB (noise-specific AI)/(non-noise sleep AI), and ratio CHIC (noise-specific AI)/(non-noise sleep AI)?
o A high ratio indicates that noise is an important variable influencing the patient’s sleep pattern
o If in a certain ICU the noise level is higher while the ratio is lower as compared to another ICU, this indicates that in the first ICU the acceptance of noise is higher, due to other factors:
Other physical environmental factors Or differences in architecture

Measurement of ICU Environment
Page 83 31 May 2010
o The impact of the physical environment is measured, and therefore the impact of the architecture can be derived indirectly.
There were no significant differences (p>0.05) between sexes, window status, illness, duration of stay, or age with respect to the noise specific arousal index or awakenings secondary to noise. [Gaz’01]
6.6 Thermal Environment & Indoor Air Quality vs. Sleep
The same kind of questions need to be answered to determine the influence of the thermal environment and the indoor air quality on the sleep pattern of the patient. This analysis includes;
Air Temperature vs. sleep Radiant Temperature (contrast) vs. sleep Relative Humidity vs. sleep Air Speed vs. Sleep CO2-level vs. sleep