massachusetts sentencing commission - written testimony
TRANSCRIPT

www.mass.gov/courts/court-info/trial-court/sent-commission/
Massachusetts Sentencing Commission John Adams Courthouse
One Pemberton Square
Boston, MA 02108
Telephone (617) 788-6867
Facsimile (617) 788-6885
CHAIR
Hon. John T. Lu
Associate Justice
Superior Court
MEMBERS
Daniel Bennett, Esq.
Secretary, Executive Office of
Public Safety and Security
Michael J. Callahan, Esq.
Executive Director
Massachusetts Parole Board
Edward J. Dolan
Commissioner
Massachusetts Probation Service
Mary Alice Doyle, Esq.
Deputy First Assistant District Attorney
Essex County District Attorney's Office
Peter L. Ettenberg, Esq.
Defense Attorney
Massachusetts Association of
Criminal Defense Lawyers
Hon. Kenneth J. Fiandaca
Associate Justice
Boston Municipal Court
Pamela Friedman, MSW
Chief, Victim Witness Unit
Norfolk County District Attorney's Office
Brian S. Glenny, Esq.
First Assistant District Attorney
Cape & Islands District Attorney's Office
Hon. Mary Elizabeth Heffernan
First Justice
Newton District Court
Carol Higgins O'Brien
Commissioner
Massachusetts Department of Correction
Dean A. Mazzone, Esq.
Senior Trial Counsel, Criminal Bureau
Attorney General's Office
John S. Redden, Esq.
Attorney-in-Charge
Brockton Superior Court Trial Unit
Committee for Public Counsel Services
Martin Rosenthal, Esq.
Defense Attorney
Massachusetts Association of
Criminal Defense Lawyers
Steven W. Tompkins
Sheriff
Suffolk County
MASSACHUSETTS SENTENCING COMMISSION
WRITTEN TESTIMONY
RECEIVED THROUGH NOVEMBER 24,
2015

Page: 1

Page: 2

Page: 3

Page: 4

Page: 5

Page: 6

Page: 7

Page: 8

Page: 9

1
MASSACHUSETTS SENTENCING COMMISSION
Gardner Auditorium November 18, 2015
_________________________________________
TESTIMONY OF JOHN E. BOWMAN, JR. ________________________________________
My name is John Bowman, and I am here to speak on behalf of my church, the United Parish in Brookline. I am also a volunteer lawyer working with the Jobs NOT Jails coalition through the Access to Justice Fellows Program for retired lawyers and judges created under the aegis of the Supreme Judicial Court.
The United Parish, located in Coolidge Corner, is an ecumenical church that has, since 1970, included three denominations: American Baptist, United Methodist, and the United Church of Christ. This past June the congregation unanimously adopted a resolution in opposition to mass incarceration,1 and our educational and outreach efforts around this important issue are on‐going. In June 2015 the statewide conference of the United Church of Christ also adopted a resolution opposing mass incarceration.2 Many faith‐based communities are seeking a new direction in our corrections policy.
Mass Incarceration in the United States
The United States, with only 5% of the world’s population, now has 25% of the world’s prisoners.3 This statistic may be widely known by now, but it should never cease to startle us.
1 Available at http://www.upbrookline.org/getinvolved/outreach&socialjustice/endmassincarceration.
2 Available at http://www.macucc.org/news/216thannualmeeting/resolutionspassedbyannualmeeting.
3 The Economist (June 20, 2015), p. 23. The state and federal prison population grew from 200,000 to 2.3 million. Id. See gen. Michelle Alexander, The New Jim Crow: Mass Incarceration in the Age of Colorblindness (rev. ed. 2011), and Bruce Western, et al., Punishment and Inequality in America (2006).
Page: 10

2
What should also startle us is that the rate of incarceration tilted sharply upward starting in the 1970s, after being level for half a century (see attached graph). The National Academy of Sciences calls this explosive growth in incarceration “historically unprecedented” and “internationally unique.”4 The length of prison sentences also sets the United States apart from other nations. For example, prison stays are nearly 5 times longer in the U.S. than in the United Kingdom, 9 times longer than in Germany (see attached graph). Stark racial disparities also stand out in who is incarcerated. Blacks are incarcerated at six times the rate of Whites. For Hispanics, the rate is double Whites. Today one‐third of young Black men can expect to be incarcerated.5 The Massachusetts Experience The temptation is to distinguish Massachusetts because its rate of incarceration is lower than most other states. The reality, however, is that the growth in the Massachusetts incarceration rate mirrors the growth in the national rate, as depicted in the attached graph. In 1973, for example, Massachusetts had 34 state prison inmates per 100,000 population. By 1997, the rate had peaked at 192 (more than a five‐fold increase), with the steepest increase starting in 1984 when there were 77 state prison inmates per 100,000 population. Even though the incarceration rate declined somewhat to 163 in 2013, it was still nearly five times the starting point in 1973.6 Stated differently, if Massachusetts were a separate nation its rate of incarceration would rate eighth in the world (behind the United States, Russia, Cuba, El Salvador, Thailand, Azerbaijan and Rwanda).7
4 National Academy of Sciences, The Growth of Incarceration in the United States (Feb. 2015 (slides)). Available at http://www.nationalacademies.org/DBASSE/Growth_of_Incarceration/index. 5 The Economist (June 20, 2015), p. 23. 6 These figures do not include persons incarcerated in county jails and Houses of Correction. 7 Chief Justice Ralph D. Gants, State of the Judiciary Annual Address (Oct. 20, 2015), p. 9. Available at http://www.mass.gov/courts/docs/sjc/docs/speeches/sjc‐chief‐justice‐gants‐state‐of ‐judiciary‐speech‐2015.pdf.
Page: 11

3
While the prison population was increasing, the crime rate decreased. Over a 25 year period ending in 2011‐12, the violent crime rate in Massachusetts decreased 29% and the property crime rate decreased 40%.8 Moreover, the racial disparity evident at the national level also exists in Massachusetts. For example, Chief Justice Ralph D. Gants recently pointed to disparate impact as one reason that mandatory minimum drug sentences should be repealed: in 2013 racial and ethnic minorities represented 32% of all convictions, 55% of all non‐mandatory drug distribution convictions, and 75% of mandatory minimum drug convictions.9 The attached graph paints a picture of the disparity that exists for all crimes. The First Challenge: Reexamining the Existing Sentencing Guidelines For the Sentencing Commission this backdrop presents both challenges and opportunities. The Commission’s first challenge is to reexamine the existing Sentencing Guidelines that the predecessor commission adopted in 1996. Will the Guidelines perpetuate mass incarceration due to either the data or the methodology that was used to formulate the sentencing ranges? There is reason to suspect that the answer is “yes.” After all, in the decade prior to the Guidelines the state prison incarceration rate increased from 96 in 1986 to 190 in 1995. The incarceration rate had also increased in the decade before that (see attached graph). These increases in the incarceration rate were, almost surely, reflected in the Commission’s work. 10
8 Mass. Executive Office of Public Safety & Security, Violent Crime in Massachusetts: A 25‐Year Retrospective (Annual Policy Brief, 1988‐2012) (Feb. 2014); Property Crime in Massachusetts: A 25‐Year Retrospective (Annual Policy Brief, 1987‐2011) (Oct. 2014) (both measured in offenses per 100,000 population). Available at http://www.mass.gov/eopss. 9 R. Gants, Keynote Address, Second Annual Massachusetts Criminal Justice Reform Coalition Summit (UMass‐Boston, Mar. 16, 2015), p. 7. 10 See G.L. c. 211E, sec. 3 (c), which directed the Commission to survey the “average sentences” imposed before it promulgated the Sentencing Guidelines and the prison terms “actually served,” but specified that the Commission “shall not be bound by such average sentences” and that the “sentencing range” that the Commission developed should be “consistent with the purposed of sentencing described in section two.”
Page: 12

4
Moreover, the Sentencing Commission itself was created in April 1994 by the Truth in Sentencing Act, which embodied the “get tough on crime” ethos that resulted in the mass incarceration that we know today.11 As an illustration, former President Bill Clinton recently acknowledged that the 1994 federal crime bill and other policies in that era “overshot the mark.”12
Similarly, the methodology behind the Sentencing Guidelines should be reexamined. To take one illustration, the vertical axis on the sentencing grid measures the defendant’s criminal history. Is that the best measure of what the sentence ought to be in a particular case or might it unintentionally contribute to racial disparity? Chief Justice Ralph D. Gants pointed in a different direction earlier this year: “Too often, we use criminal history as a proxy for the risk of recidivism, but it is a poor proxy because it fails to take into account the age of the defendant and the pattern of past crimes.”13
The Second Challenge: Charting a New Course
The Commission’s second challenge is to shift from looking backward to looking forward. It should use its broad authority under G.L. c. 211E to chart a course to a sentencing system that produces an outcome different from today’s mass incarceration. In connection with its charge to “recommend sentencing policies and practices” the Commission’s goal should be to reduce the incarceration rate to sensible levels that prevailed before the upward tilt of recent decades.14
To achieve such a goal the Commission should, first, devote further attention to alternatives to incarceration by making a renewed commitment to “intermediate sanctions” and utilize its authority to develop a “wider array of
11 See Mass. St. 1993, c. 432, sec. 1 (approved Jan. 12, 1994). G.L. c. 211E, which subsequently codified the Commission’s enabling act was enacted by Mass. St. 1996, c. 12.
12 W.J. Clinton, Foreword in Solutions: American Leaders Speak Out On Criminal Justice (Brennan Center for Justice, 2015).
13 R. Gants, Keynote Address, Second Annual Massachusetts Criminal Justice Reform Coalition Summit (UMass‐Boston, March 16, 2015), p. 2.
14 G.L. c. 211E, sec. 2.
Page: 13
5
criminal sanctions.”15 Indeed, chapter 211E itself seems to suggest a preference for intermediate sanctions over incarceration.16
The Commission should pay particular attention to the mounting evidence in Massachusetts that many people who are incarcerated today have an unmet need for mental health care or substance abuse treatment. Neither public safety, the prudent expenditure of taxpayer dollars, nor the humane treatment of the individuals, their families, or their communities is served by the current practice of jail and release without treatment.17 The Commission should lead the shift toward an inclusive public health and treatment paradigm and move away from a single‐minded focus on punishment.
The Commission should also devote attention to the collateral consequences of a criminal conviction. There is mounting evidence of the significance of collateral consequences, including adverse effects on the employment prospects of a criminal defendant.18 A prime example is the automatic suspension of drivers’ licenses for drug convictions for up to 5 years plus a reinstatement fee up to $500, which poses a major barrier to an ex‐prisoner who seeks to re‐enter the community.19 Far too little attention has been paid to collateral consequences and their likely adverse effect on recidivism rates and the crafting of a fair and effective sentence.20
15 G.L. c. 211E, sec. 2 (7) and (8). See also sec. 2 (9) (“make offenders accountable to the community for their criminal behavior, through community service, restitution, and a range of intermediate sanctions”).
16 See G.L. c. 211E, sec. 3 (a) (3) (B) (“Appropriate intermediate sanctions for offenders for whom imprisonment may not be necessary or appropriate” [listing illustrative alternatives]). Compare sec. 3 (a) (3) (C) (“A target sentence for offenders for whom an intermediate sanction may not be appropriate . . . .”). See
17 See G.L. c. 211E, sec. 3 (a) (3) (B) (“including but not limited to . . . substance abuse treatment”). See also sec. 3 (d) (2) (11) and (12) (mental condition and drug dependence included in “aggravating and mitigating circumstances”).
18 The Supreme Judicial Court’s recent CORI decision observed that “gainful employment is crucial to preventing recidivism” and criminal records have a deleterious effect on access to employment.” Commonwealth v.Peter Pon, 469 Mass. 296, 307 (2014).
19 See G.L. c. 90, sec. 22 (f). The Massachusetts Senate recently voted unanimously to repeal this provision, which has been in effect for 26 years, but a House vote has not been scheduled yet (S. 2014). Repeal of the driver’s license suspension is also part of S. 64/H. 1429) pending before the Joint Committee on the Judiciary.
20 See, e.g., William J. Meade, et al., Crime and Consequence: The Collateral Effects of Criminal Conduct (MCLE, 3rd ed. 2013); Michelle Alexander, The New Jim Crow (2010), ch. 4.
Page: 14

6
Where incarceration is nonetheless appropriate, the Commission should assure that judges retain “sufficient flexibility to permit individualized sentences warranted by mitigating or aggravating factors.”21 The goal is to ‘make the punishment fit the crime.’ Here again, the Commission should draw upon experience that has accumulated after the existing Sentencing Guidelines were adopted to review with care the “non‐exclusive aggravating and mitigating circumstances” that the Legislature asked the Commission to adopt.22 It should assure, among other things, that aggravating factors, which increase incarceration, are evidence‐based and do not contribute to racial disparities in sentencing.23
There are also other matters that the Commission should consider. One is converting some felonies into misdemeanors (or even civil infractions). For example, only two states (Virginia and New Jersey) specify an amount lower than the $250 threshold that is required to make larceny a felony in Massachusetts (see 2 attached charts).24 The Commission should also ascertain if it has an opportunity to emulate the U.S. Sentencing Commission, which has initiated the early release of some federal prisoners under its revised sentencing policies.
The fees assessed against persons on probation should also concern the Commission, from both the perspective of simple fairness and the offender’s likelihood of success on probation. Chief Justice Gants recently raised this issue in his Annual State of the Judiciary Address, where he noted: “For an indigent defendant convicted of one felony and sentenced to one year of supervised probation, the fees total $1,020, more if a GPS bracelet is a condition of probation because the defendant is required to pay for that too.”25
Finally, and perhaps most importantly, the Commission should review the length of sentences imposed under the current Sentencing Guidelines. Under the
21 G.L. c. 211E, sec. 2 (4).
22 G.L. c. 211E, sec. 3 (d).
23 G.L. c. 211E, sec. 2 (4) (“avoiding sentencing disparities”). See also sec. 3 (e) (par. 2) (“The Commission shall assure that the guidelines are neutral as to the race, sex, national origin, creed, religion and socio‐economic status of offenders.”).
24 G.L. c. 260, sec. 30. A bill to raise the amount to $1,300 is pending before the Legislature. S. 64/H. 1429.
25 R. Gants, Annual State of the Judiciary Address (Oct. 20, 2015), p. 9.
Page: 15

7
principle of parsimony, the length of a prison stay should not be any longer than necessary. Longer stays increase the prison population at great expense to the taxpayers but without commensurate benefit to the public safety. More importantly, long sentences disrupt the prisoner’s life, and the life of his family, without any rehabilitative benefit.
Reaffirming Opposition to Mandatory Minimum Sentences in Drug Cases
I do, however, ask that the Commission reaffirm its opposition to mandatory minimum drug sentences.26 The topic is addressed in the Questions and Answers to the Sentencing Guidelines that is posted on the Commission’s website.27 The Commission concluded that mandatory minimum drug sentences are not justifiable under current research, including a RAND study. It also noted that some mandatory minimum drug sentences are “very long” compared to other offenses. Mandatory minimum sentences for drug offenses, the Commission said, “disproportionately affect minorities.” It illustrated the disparate impact by pointing to the fact that minorities were 80% of the defendants convicted of mandatory drug crimes compared to 34% convicted of all other crimes. 28
Other leaders have recently expressed their agreement with the Commission’s conclusion. Chief Justice Gants explained why he opposes mandatory minimum sentences for drug offenses in his keynote address at a conference at UMass – Boston on March 16, 2015, and in his testimony before the Joint Committee on the Judiciary on June 9, 2015.29 On November 18, 2014, the Special Commission to Study the Commonwealth’s Criminal Justice System, which was created by the Legislature, voted in favor of repealing drug mandatory minimum sentences.30 U.S. Supreme Court Justice Anthony Kennedy has said: “I
26 Bills to repeal mandatory minimum drug sentences imposed under G.L. c. 94C are currently pending before the Legislature. See S. 64/H. 1429 and S. 86/H. 1620.
27 See Questions & Answers, Nos. 13, 14 and 15. The Commission distinguished drug offenses from firearm offenses and OUI offenses, where it felt mandatory minimum sentences were justified. Q&A, No. 14.
28 See G.L. c. 211E, sec. 3 (e) (“sentencing judge may depart from the range established by the sentencing guidelines and impose a sentence below any mandatory minimum term prescribed by statute, if the judge sets forth in writing reasons for departing”).
29 See footnotes 7 and 9, above.
30 Special Commission, Interim Report (Dec. 31, 2014), p. 30 (available on the Executive Office of Public Safety & Security website). The Special Commission was created by Mass. St. 2011, c. 68, sec. 189.
Page: 16

8
can accept neither the necessity nor the wisdom of federal mandatory minimum sentences. In all too many cases, mandatory minimum sentences are unjust.”31
Closing
The Sentencing Commission is blessed with an opportunity to make a major contribution to a much‐needed review and reform of the Massachusetts criminal sentencing system. I appreciate the opportunity to offer these comments on the Commission’s mission this morning. I would be pleased to offer additional feedback to the Commission or its staff as your work progresses.
31 Quoted in Michelle Alexander, The New Jim Crow, p. 91.
Page: 17

Page: 18

Page: 19
Page: 20

Page: 21

Page: 22
Page: 23

Page: 24

Zimbra [email protected]
LWVMA Testimony
From : LWV Mass <[email protected]> Subject : LWVMA Testimony
To : drap admin <[email protected]>
Tue, Nov 17, 2015 01:10 PM1 attachment
Dear Members of the Sentencing Commission:
The League of Women Voters of Massachusetts appreciates that you are holding a public hearing on reforming sentencing guidelines. Since the Commission proposed sentencing guidelines in 1996, we have data from 20 additional years on how mandatory minimum sentencing impacts incarcerated individuals in Massachusetts. It is time to revisit this issue, and LWVMA has urged the legislature to act on the Commission's recommendations. The annual sentencing surveys the Commission publishes are of great importance. We will be interested to see analyses of this data to determine if sentencing length has increased as it has for the pretrial population.
LWVMA testified before the Joint Committee on the Judiciary in strong support of H.162/S.786, an Act to eliminate mandatory minimum sentences related to drug offenses, on June 9, 2015. A copy of that testimony is attached, for your information.
Sincerely,
Colleen KirbyLegislative SpecialistCourts and Criminal Justice ReformLeague of Women Voters of Massachusetts
--
League of Women Voters of Massachusetts133 Portland St.Boston, MA 02114(617) 523-2999
H.1620-S.786.pdf94 KB
Page 1 of 1Zimbra
11/19/2015https://mail.jud.state.ma.us/zimbra/h/printmessage?id=896&tz=America/New_York
Page: 25

Testimony submitted to the Joint Committee on the Judiciary
In support of H.1620/S.786 - An Act to eliminate mandatory minimum sentences related to drug
offenses
Carole Pelchat, LWVMA Legislative Director
June 9, 2015
The League of Women Voters at both national and state levels opposes mandatory minimum
sentences, including for non-violent drug-related offenses. LWVUS believes alternatives to
imprisonment should be explored and utilized, taking into consideration the circumstances and nature
of the crime. LWVMA supports prison sentences for violent crimes against the person and habitual
criminals and alternative punishments for offenders who commit nonviolent crimes, first offenders,
and offenders where mitigating circumstances exist.
While much has been made of the fact that Massachusetts incarceration rates are well below the
national average, our trends are disturbing. From the state’s own prison data, we learn that as of
January of this year, 95% of males incarcerated were serving a sentence longer than 3 years, yet only
69% had committed a violent offense. Further, the Department of Corrections projects a decrease of
only 0.1 % annually in the prison population from 2015 to 2022. i
In spite of the fact that people of color (black and Latino combined) represent roughly only 16% of the
total population, i.e. about 1:6 black and Latinos to whites, the incarceration ratio is 8.1:1 blacks to
whites and 6.1:1 for Latinos to whites.ii In addition, people of color comprise on average 77% of drug
offenders sentenced to mandatory minimums, despite the fact that all races use drugs at roughly equal
levels.
Sentences for nonviolent drug crimes can be longer than sentences for violent crimes. As an
organization predominantly made up of women, we are offended that the maximum sentence for an
armed assault with intent to rape can be equal to that for a second conviction for the sale of 2
tablespoons of heroiniii.
In addition to incarceration, a minor drug offense can result in the denial of federal and state public
housing, federal and state student loans, and mandatory revocation of a driver’s license. A felony
conviction can be found by any computer literate employer and be used as a reason not to hire, which
also discourages offenders from investing in training programs.iv All of these can significantly
decrease an offender’s ability to become a productive citizen.
A 2014 public opinion poll conducted in Massachusetts spanning all party, race and age demographics,
found that support for mandatory minimum sentences for any crime has fallen to 11%. Nearly two-
thirds see illegal drug use as a health issue, not a criminal issue. We concur, and believe that treatment
is preferable, more just and more economical than incarceration.
We strongly encourage you to update our criminal justice laws to assure that non-violent crimes and
the processes by which the accused are processed do not lead to lengthy sentences for non-violent
crimes, do not annul an offender’s individual rights as a citizen and do lead to appropriate
incarceration for violent crimes.
Thank you for your consideration.
Page: 26

i http://www.mass.gov/eopss/docs/doc/research-reports/pop-trends/prisonpoptrends-2014-05042015-final.pdf ;
pg 22 ii http://www.sentencingproject.org/map/map.cfm#map
iii http://www.uumassaction.org/campaigns/prison-justice/
iv http://www.mpp.org/assets/pdfs/library/The-Collateral-Sanctions-Associated-with-Marijuana-Offenses
Page: 27

Page: 28

Page: 29
Page: 30

Page: 31

Page: 32

Page: 33

Page: 34

Page: 35

Page: 36

Page: 37
Page: 38

Page: 39

Page: 40

Page: 41

Page: 42

Page: 43

Page: 44

Page: 45

DylanHayre:TestimonyAgainstMandatory-MinimumSentencinginMassachusettsDeliveredtotheMassachusettsSentencingCommissiononNov.18,2015
1
TotheMembersoftheSentencingCommission:Today, Iamrespectfullysubmittingmytestimonytoregistermyoppositiontothecontinueduseofmandatory-minimumsentencingpracticesinourCommonwealth.These practices violate the core ethic of our prosecutorial system by bestowinguponprosecutorsalevelofcommandovercriminalproceedingsthatstandsinclearcontrasttothevaluesattheheartofourjusticesystem.Thiscontrastisdrawnmorestarkly insituations inwhich theprosecutor isnotprepared towield that levelofauthority appropriately, or does not have the wealth of experience that wouldinform his decisions within that framework of power. Moreover, mandatory-minimum sentences wholly eradicate any individual distinctions betweendefendantsand thebackgroundsandsituations that led to theirbeing involved inourjusticesystem.ThistestimonydrawsfrommytimeservingourCommonwealthasbothastudentprosecutor,andalsoasanAssistantDistrictAttorney.ThistestimonyisdrawnfromwhatIsawandwhatIlearnedonthefrontlinesofourcriminaljusticesystem,andis informed by the countless conversations I have had with colleagues from allpointswithinthatsystem.Myfirstexperiencewithmandatory-minimumsentences,or“man/mins,”wasinlawschool,when Ihad theprivilegeofservingas “Rule3:03CertifiedLegal Intern” inthe Suffolk County District Attorney’s office. I was authorized to perform the fullduties of an Assistant District Attorney so long as my supervisor was in thecourtroomwithme. This certification, combinedwithmy preparedness, and theextraordinary working relationship I had with my supervisor, allowed me toparticipate in a full rangeof experiencesduringmy time in SuffolkCounty. Afternearlysevenmonthswiththisbreadthofexperience,Icameawaywiththreecorefindings.First, I had, andwill alwayshave, deep andunwavering respect and gratitude forDistrict Attorney Dan Conley and every single Assistant District Attorney withwhomIworked.IcannotthankDAConleyenoughfortheopportunityheaffordedme.He and Imaintain a significantdisagreementon the issue at theheart of thistestimony,but that innoway lessensthetremendousgifthegavemethroughmytimeinhisoffice.ThesamegoesfortheAssistantDA’swithwhomIworkedeverysingleday.Thesearegood,smart,hardworkingpeoplewhoareworking fora fewdollarsanhouronthefrontlinesofourcriminaljusticesystem.TheSuffolkCountyADA’swere some of the best, brightest,most thoughtful people I’ve evermet – alevelofexcellencewithinthestaffthatreflectsDAConley’scommitmenttorunningatop-leveloffice.
Page: 46

DylanHayre:TestimonyAgainstMandatory-MinimumSentencinginMassachusettsDeliveredtotheMassachusettsSentencingCommissiononNov.18,2015
2
ThesecondthingIlearned,orrealized,wasthatprosecutorswieldavastmajorityofthepowerand influence throughmost stagesof a criminal case. I know therearerulesofevidenceandprocedure.However,inpracticeourcriminaljusticesystemisalmostcompletelyone-sided,especiallyforthoseatthelowestrungsofthesystem–those chargedwith crimes indistrict courtwho represent themselvesorwhoarerepresentedbyanoverworked,underpaidpublicdefender.Thatleadstomythirdfinding:thissystemisbroken,andthelackofalevelplayingfield–arealitycreatedandfortifiedbythecontinueduseofmandatory-minimumsentencing–isthereasonoursystemneedstobefixed.WhileIunderstandhowandwhy prosecutors wield so much authority throughout the course of a criminaljustice proceeding,man/mins give prosecutors a tool of leverage and a degree ofpowerthatredefinethejusticesystemasoneinwhichprosecutorsplaytheroleofjudge and jury,while depriving the actual judge and jury of their constitutionallysacredrolesinthecourt.As nationally renowned legal scholar R. Michael Cassidy writes in ProsecutorialEthics, “It is the prosecutor who determines what charges the defendant willultimately face.”1This fact must be taken in conjunction with the American BarAssociation’s “Model Rules of Professional Responsibility,” notably the idealcapturedwithinComment1onRule3.8: “aprosecutorhas the responsibilityof aminister of justice.”2This Comment, widely regarded as a central component ofprosecutorial ethics,makes clear that prosecutors are obligated to present a caseclearly, fully, and fairly, and to leave any determinations about the verdict andsentencingofthatcasetothejudgeandjury.However, evenwhen theprosecutordoesplaya role in the sentencingphaseof acriminal proceeding, Standard 3-6.1 of the ABA’s “Standards for Criminal Justice:ProsecutionFunction,”remindsus:“Theprosecutorshouldnotmaketheseverityofsentencestheindexofhisorhereffectiveness.”3Thiswarinessofaprosecutor’sroleinsentencingisallthemoreimportantincasesresolvedthroughplea-bargaining.Avastmajorityofcasesareresolvedinthisway,andthepotentialcorrosiveinfluenceofmandatory-minimumsentencingpoliciesisatitspeakinthesecases.“Thereareseveral reasons why even an innocent [sic] defendant might accept a reducedsentence and plead guilty…for example…to avoid an unduly harsh mandatorysentence.”4Ihadreadandheardmostofthesevaluesandidealsbeforeandduringmytimeasaninternandaprosecutor.Ialsosaw,firsthand,themyriadchallengeswithinour
1Cassidy,R.Michael,ProsecutorialEthics,ThomsonWest2005,p.132Cassidy,p.1423Cassidy,p.1694Cassidy,p.82
Page: 47

DylanHayre:TestimonyAgainstMandatory-MinimumSentencinginMassachusettsDeliveredtotheMassachusettsSentencingCommissiononNov.18,2015
3
justicesystemthatarecreatedbyman/mins.MostofthecasesIhandledweredrugdistribution cases, andmost of those incidences occurredwithinwhatwere thenschoolzones.Thelawregardingthesizeofschoolzoneshassincechanged,buttheidealsunderpinning theoriginal,myopic,andharsh lawsarestillprevalent inouroverallpolicy.Onemorning,Iwasresponsibleforarraigningayoungman,acoupleyearsremovedfromhigh school, fordistributingmarijuana in a “school zone.”The “distribution”chargewasonething,butthe“schoolzone”chargecarriedamandatory-minimumsentenceof2.5years.Thiswasawell-knownsentencingenhancementwithinmuchoftheSouthBostoncommunity.AsIwaswalkingintocourtthatmorning,theyoungman’smotherapproachedmeintears,andpleadedwithme.“Pleasedonot lockmysonup for two-and-a-halfyears.Please.Hewasonlya fewfeetawayfromourhome.Hehadnoidea.”Withoutamoment’shesitation,Iassuredherthathersonwillhavehisowncounseltoprotecthisrights,andsheneednotworryaboutthe“schoolzone”penalty.Iknewthat Iwasgoing todrop thecharge. Iknewthat Iwouldonlyuse theschoolzonechargeasapotentialpenalty,tobewieldedbymeifthedefendantdidnotacceptthepleaagreementtermsIwasofferingatthetime.Afewweekslater,duringapleabargain,Itoldthejudgethatwewouldbedroppingtheschoolzonechargeduetothedefendant’swillingnesstoacceptmyterms.Thiskeydecision–whether topush for amandatory2.5year sentence, oruse that asleveragetogeta lessersentenceofmychoosing–wasmadeentirelybyme. Ihadsigned up to serve our Commonwealth as a student prosecutor. However, in thatmoment,Iwasnotanintern.Iwasthejudge.Iwasnotaprosecutor.Iwasthejury.Iwasnot,byanymeans,aministerofjustice.Iwastheentirejudicialsystem.Andyet,despite theclearcontradictionbetweenmyactionsand thevaluesstatedabove, Ididnothingwrong. Ididas Iwasbeing taughtand instructed todo. IdidwhatIhadlearnedtodobywatchingpeopleIconsidered–andstillconsider–rolemodels:myfellowprosecutors.The fact that this young man was so undeserving of his potential, mandatory-minimumpunishmentwasmadeevenmoreclearafewdayslater,whenanotoriouslocaldrugdealerwasbackinourcourt.Hiscriminalrecordwaslengthy,andhehadbuiltasmallbusinessoutofdistributingmarijuanaandother,hardersubstancestoyoung adults living in the local housing projects. This time, he had been caughtdistributing in a school zone, just like the young man I’d sentenced a few daysearlier.Buthewasdifferent,ineveryconceivableway,fromthatyoungman.
Page: 48

DylanHayre:TestimonyAgainstMandatory-MinimumSentencinginMassachusettsDeliveredtotheMassachusettsSentencingCommissiononNov.18,2015
4
However,thelawsawthesetwoindividualsastheexactsameperson.Therewereno exculpatory circumstances or facts, no sense of individualistic determinationsandbackgroundsthatdifferentiatedtheseindividuals.Thelawtoldmethatbothofthem could and should be sentenced to 2.5 years in prison, unless I saw fit topreventthemfromfacingthatpunishmentbywhollyeliminatingitasanoption.Thelawforcedmetoview,asidenticalhumanbeings,ayoungboymakingamistakeandagrownmanmakingacareer.Thejudge–theofficialwhoisconstitutionallyobligatedtodeterminesentencesandpunishmentbasedonthefactsandcircumstancespresentedtohim–neverplayedaroleinmyabilityorwillingnesstodiscern,orignore,thedifferencesbetweentheseindividuals.Thejudge,withhisyearsofexperienceasanattorneyandadvocate,hadno say in the sentencing determinations of an intern with just two years of lawschoolunderhisbelt.Beyondschoolzonecases,theexistenceofmandatoryminimumsentencesonothercharges should give us pause. I saw countless examples to demonstrate thecompleteimbalanceofpowerinourcourtsthatismadepossiblebytheexistenceofmandatoryminimumsentences.Perhapsthosewhofavormandatoryminimumswouldprefer thatprosecutorsarethecentralforceinacourtroom.Perhapsthesepeoplewouldarguethatthesystemismadefairbytheconstitutionallymandatedpresenceofdefensecounsel.Icantellyou, frommyexperience, that this isnot true foronekeyreason: I,asprosecutor,had the evidence and the investigators on my side. I was obligated to shareexculpatory evidence, and I oftenwould share asmuch evidence aswas possiblewithin the confines of the office that I served. However, at the end of the day, Icontrolledtheflowofevidence.Ihadbetteraccesstoevidence,andIcouldurgethepolice to get more evidence, or clarify evidence that already existed. From themomentadefendantandtheirattorneywalkedintomycourtroom,theyknewthatIwould be the driving force on this case, whether I was an intern or an AssistantDistrictAttorney.This truth creates a chasm ofmistrust between prosecutors – those on the frontlinesofourcriminaljusticesystem–andthepeopletheyaremeanttoserve.Isworeanoath toserve theCommonwealthandallof itsresidents. Inotherwords, Iwassupposedtoserve,inanygivencase,boththevictimsandthedefendants;boththecommunity that was injured and the community that gave rise to the one thatcausedtheinjury.ThatdualrepresentationbecomesimpossiblewhenIamviewedsolelyastheadversarytothedefendant.Moreover,mandatory-minimumsentencesareentirelyineffective.Inpunishingthecrimewithoutconsidering,inanysmallway,theindividualperson,thesesentencesforcepeopletospendyearsinprisonwithoutaccesstorehabilitative,mentalhealth,
Page: 49

DylanHayre:TestimonyAgainstMandatory-MinimumSentencinginMassachusettsDeliveredtotheMassachusettsSentencingCommissiononNov.18,2015
5
or reentry programming. Recidivism is at an astronomical level, and barriers tosuccessfulcommunityreentrybyformerinmatesaremademuchsteeperandmorepermanentbynondiscretionarysentencesthatwhollyignorethecausesthatledtothoseindividuals’criminalbehaviorinthefirstplace.Right now, the public appetite for change is real, the reasons for change areabundant,andthepowerforchangeisinyourhands.In closing, please consider this: in the same way that you hope to be viewed asindividuals in your own life, so, too, do the men and women involved with ourcriminaljusticesystemhopetobeviewedasindividualswhentheystepinsidethecourtroomandarebroughtto justicebytheonlytwopartieswho,asthe idealsofour justice system make clear, should be making decisions about their fate: thejudgeandthejury.
Page: 50

Page: 51

Page: 52

Page: 53

Page: 54

Page: 55

Page: 56

Page: 57

Page: 58

Page: 59

Page: 60

Page: 61
Page: 62

Page: 63

Massachusetts Sentencing Commission Public Hearing on Sentencing
Written Testimony of Francis J. Carney, Jr., Ph.D.
Executive Director, MA Trial Court (Retired)
November 18, 2015
Chair Lu and Sentencing Commission members:
Thank you for allowing me to comment on the work of the MA Sentencing Commission. I believe that
the Commission has a great opportunity to contribute in a very significant way to the emerging
correctional reform movement. Recent public opinion surveys (Pew Foundation, MassINC) have
revealed a shift away from a reliance on “tough on crime” policies, along with a new interest in
correctional reform. And the political climate is in sync with changing public opinion. Here in MA, our
governor, SJC chief justice, and legislative leaders have joined forces to work with the Pew Foundation
to develop the data needed to identify and implement meaningful correctional reform initiatives.
At the heart of correctional reform is sentencing. The concept of “mass incarceration” has gained
prominence of late, symbolically denoting the great cost, both in financial and human terms, of strict
sentencing policies of the past few decades. I believe the MSC is in a unique position to address the
phenomenon of “mass incarceration” by developing sentencing guidelines that will promote fair and
proportional sentences and also serve as an effective tool for managing correctional populations.
A recent federal sentencing initiative illustrates the important role of sentencing guidelines in promoting
fairness in sentencing and controlling prison populations. In 2014, the U.S. Sentencing Commission
revised its sentencing guidelines, adjusting downward the penalties for certain drug offenses and
applying the revised guidelines retroactively. To date (Oct. 2015), over 17,000 federal drug offenders
have been granted reduced sentences under the retroactive provision (74% of those who applied). On
average, their sentences were reduced by 23 months, which meant that the cost savings associated with
this initiative would be substantial. The first group of these 17,000 federal inmates was released on
November 1. (U.S. Sentencing Commission, 2014 Drug Guidelines Amendment Retroactivity Data Report
(October 2015)
To me, a remarkable aspect of this initiative is the absence of a backlash against it. If this initiative had
occurred ten years ago, the public outcry would probably have been palpable. Yet, today, there is hardly
a ripple, reflecting the emerging political climate that is favorable to sentencing reform. This augers well
for the work of the MSC, which now has the opportunity to formulate sentencing guidelines that not
only reduce unwarranted sentencing disparities, but also serve as an effective tool for managing
correctional populations by identifying appropriate candidates for intermediate sanctions in lieu of
incarceration and providing a sentencing framework that can be adjusted as appropriate to
accommodate prison overcrowding.
It’s a great challenge and I wish you well in this very important work.
Page: 64

Page: 65

Page: 66

Page: 67

November 18, 2015
Members of the Sentencing Commission
Boston, MA 02133
Re: Testimony in Support of S.64 & H.1429
My name is Josh Beardsley. I am retired from McKinsey & Company’s research arm. I am a volunteer with the
Jobs NOT Jails Coalition as its research coordinator.
I thank you for the opportunity to offer testimony in support of the Act to Increase Neighborhood Safety and
Opportunity also known as the Justice Reinvestment Act. The Act, in a nutshell, proposes repeal of revocation
of driver’s license for people who commit drug offenses often unrelated to motor vehicle violation, strikes
mandatory minimum drug laws, increases the threshold amount for larceny‐related felonies, permits medical
placement of terminally ill or incapacitated inmates and, very importantly, creates a neighborhood safety and
opportunity fund that will be financed by savings from implementing these reforms [and others].
[Please note that the numbers in my testimony and the attached charts are provisional; but, we are confident
they are directionally correct and look forward to working with legislatures to produce sets behind which we
can all stand."]
In this testimony I will limit my remarks to two issues: first, the savings that can be expected by two reforms in
the JRA, repealing mandatory minimum drug sentences and raising the felony threshold from $250 to $1,300;
second, the critical importance of the trust fund.
What would savings be? To estimate potential savings we used the concept of “marginal costs” based on a
very recent Vera Institute analysis of the Cost of Jails that used data from Hampden County. In 1945 the
larceny threshold in Massachusetts was $100; simply applying the Consumer Price Index brings that number to
$1,300 in 2015. In the October 14 hearing Senator Brownsberger challenged our logic: “how do you know
they got it right in 1945,” he asked. We did not. After some reflection we thought a more appropriate
measure than CPI would be the percentage of median per capita income represented by $100. In 1945 it was
8% ($100/$1223); in 2012 per capital income was $42,693. So, the floor could be $3,500. That would put
Massachusetts #1: above Wisconsin at $2500. Senator Brownsberger’s response: “Very helpful rationale. I
like that!” Please give it some thought in your deliberations.
Page: 68

Repealing drug mandatory minimums (and, implementing recommendations in the bill) we estimate would
result in annual gross savings of $30 million. Furthermore, that figure does not include ‘thousands’ sentenced
for drug offenses who are coerced to take a plea. According to a defense attorney who has practiced for over
35 years, "on drug cases, a mandatory minimum is on the table at least half the time; without mandatory
minimums the eventual sentence could have very well been much less severe ‐ whether it was a case of
probation or incarceration.” Raising the larceny threshold could shrink the prison footprint even further and
result in another $6 million in annual savings.
Why is the trust fund so important? Our prisons and Houses of Correction release some 16,000 persons
annually – most without supervision and the great majority without access to resources that can help them re‐
integrate into their communities. These communities are in the poorest zip codes in the State, according to
the DOC, Hampden County research and Harvard University. And, too many of the releases are poor,
undereducated and underemployed! [75% of those in Hampden County are unemployed at intake; most do
not have a high school diploma and read at the 6th grade level!] The current recidivism rates are between 40‐
65% [depending on the time frame].
According to our analysis [we were conservative and selective] current reforms within the Act and others could
directly affect some 5,000 individuals among the current populations. Clearly, the recidivism numbers will only
grow if the re‐integration and employment challenges are left for another day.
The investments that need to be made across all stages of the criminal justice system have been well
understood for some time. In 2012 the DOC convened a three‐day conference and produced a remarkably
comprehensive and detailed roadmap to reduce recidivism. And yet, over the past several years, according to
the Governor’s Commission on Corrections Reform, there have been deep cuts in education, training and re‐
entry programs – both within and outside the criminal justice system.
We ask the Commission to set the precedent: move to begin to dismantle our broken criminal justice system
by recommending reforms which can reduce the system’s footprint and urge our legislators to use the savings
to fund education, training and community programs that will make it obsolete.
Thank you for your time and consideration. Josh Beardsley for the JobsNOTJails Coalition
Contact: [email protected]
Page: 69

Notes
*The scale and scope of the challenges faced are sufficiently documented as are many of the “solutions.” Over
the past several years there have been significant changes and developments in Massachusetts. And, across
the political spectrum there appears to be broad recognition of how to address many of the fundamentals –
based in large measure by studies and evidence‐based solutions in Massachusetts and around the country. One
result was Re‐thinking Re‐entry, an exceptionally remarkable document, produced after a three‐day conference
which involved most all key stakeholders, including returned citizens. In addition to identifying key steps along
the entire criminal justice system necessary to shrink the prison/jail footprint and reduce recidivism, the
document listed many of the key obstacles, not least of which are very limited financial resources and the
willingness to spend them on a marginal population.
We know that the knowledge does not exist to successfully overcome these obstacles: there are no or very little
data on returning citizens; no sufficiently concrete analyses of the state of the current reentry ecosystem and
no rigorous estimates of what it would truly cost to implement the visions and highlights articulated in the
Rethinking Reentry proposals and the vision of the Jobs NOT Jails Coalition. But, as important as facts are, they
are only a necessary condition not a sufficient one. What is also missing is a narrative sufficiently compelling
to bring all the stakeholders together to work towards a common goal and in doing so motivate
• Legislators and investors: to provide funding
• Faith‐based organization: to provide volunteers
• Service providers: to work together towards a common goal
• Individuals: to offer time, skills and knowledge
• Businesses: to provide training and employment
• Academics: to provide conceptual insights
• Community organizations: to seek funding and replicate evidence‐based solutions
• Returning citizens: to provide leadership and direction
**Michelle Alexander supplies a powerful logic for this conclusion, and is of little comfort to advocates of
piecemeal reforms, which she regards as “utterly insufficient.” She argues “Some people who might have spent
more than a decade behind bars may spend only a few years. Children who might not otherwise have ever
known their parents may have a shot at having relationships with their mother or father, and people may
receive additional support—job training or education.” However, she added, “I’m deeply concerned that many
people will mistake these reforms for the kind of cultural and institutional transformation that is necessary.”
Page: 70

The current bipartisan ferment might improve a few lives, she conceded, but repairing criminal justice requires
“a radical restructuring of our society,” potentially driven by “third parties and new political formations” rather
than by Republicans or Democrats.”
***According to the Sentencing Commission Survey, while 450 persons were incarcerated in 2013 under those
statutes, the total number of persons sentenced in 2013 for drug offenses was 4,583, of whom 2,373 were
incarcerated. Since there does not seem to be any reported data on the number of sentences on drug offenders
that were the result of pleas and the number of those pleas that were the result of prosecutors using the threat
of mandatory minimums, we have been asking experienced professionals for their best estimates. The persons
we have interviewed so far indicate that the threat of mandatory minimums is widely used by prosecutors.
For example, a former Suffolk County Assistant District Attorney said that the mandatory minimums are "the
trump card that is always used" by prosecutors to extract pleas and avoid trial, whether the outcome of the
plea bargain is probation or incarceration. It all has to do with zip codes and school zones, we are told, and
whether the prosecutors are willing to "break it down" (which we understand to mean not invoke the school
zone MM ). "In this state zip code defines race and whether you are within a school zone," the former ADA said
, "so they have a good deal of leverage...in the suburbs not so much because of obvious reasons: the school
zones do not cover the entire zip codes." According to a defense attorney who has practiced for over 35 years,
"on drug cases, a mandatory minimum is on the table at least half the time; without mandatory minimums the
eventual sentence could have very well been much less severe ‐ whether it was a case of probation or
incarceration.” To these testimonies we would add the powerful statement by U.S. Supreme Court Justice
Anthony Kennedy: “Our [prison] resources are misspent, our punishments too severe, our sentences too
loaded. I can accept neither the necessity nor the wisdom of federal mandatory minimum sentences. In all too
many cases, mandatory minimum sentences are unjust.”
Commenting on the sentencing reform bill introduced in the Senate on Thursday, the New York Times wrote “in
addition, the bill would give federal judges more power to impose sentences below the mandatory minimum in
certain cases, rather than being forced to apply a strict formula. This would shift some power away from
prosecutors, who coax plea deals in more than 97 percent of cases, often by threatening defendants with
outrageously long punishments.”
**** The estimates of the number of persons affected by reforms and potential savings include both reforms
listed in the JRA as well as others, including parole eligibility and the bail reform initiative. The crucial provision
is the establishment of a trust fund that will be funded from savings generated by all reforms that shrink the
prison and HOC populations. Please see attached slides for calculations and assumptions.
Page: 71

Selected Sources
Massachusetts data sources
• Department of Correction Research Department
• Sentencing Commission – Survey of Sentencing Practices
• Houses of Correction ‐ Hampden County research
• Office of the Commissioner of Probation
• Senator William Brownsberger statistics
• Special Legislative Commission, 2015
• Massachusetts Government
• Vera Institute: The Price of Jails
• Department of Corrections; Sentencing Commission; The Prison Policy Initiative
• Glaze and Herberman 2013; Walmsley 2013;
• Uniform Crime Reports furnished by the Massachusetts State Police Crime Reporting
Unit. Reports of the Massachusetts Department of Corrections online (and from the State
Library). The uniform crime reports include only aggravated assaults defined as follows:
“Aggravated assault—An unlawful attack by one person upon another for the purpose of
inflicting severe or aggravated bodily injury. This type of assault usually is accompanied by the
use of a weapon or by means likely to produce death or great bodily harm. Simple assaults are
excluded.”
• Massachusetts Sentencing Commission;
• The Sentencing Project
• Governor’s Commission on Corrections Reform Report (
• DOC Research Department of Mental Health Forensic Services
• Parents in Prisons, The Sentencing Project, 2012; MassINC: Crime, Costs and Consequences
• "Confronting Confinement,“ 2006; MassINC
• The Jobs NOT Jails Coalition: Towards Building a Roadmap to Help End Mass Incarceration and
Ensure Greater Racial and Economic Justice in Massachusetts, slides 29‐30
Page: 72

• Recidivism – General
• Pew Charitable Trust – The State of Recidivism
• Social Policy Research ‐ How Communities Can Reduce Recidivism
• Pell Center: Incarceration and Recidivism: Lessons from Abroad
• Recidivism – Massachusetts
• Reincarcerated: The Experiences of Men Returning to Massachusetts Prisons
• Massachusetts Recidivism Study
• Re‐entry and prison education – General
• Rand Corporation: Evaluating Effectiveness of Correctional Education
• MDRC: Prisoner Reentry
• Social Policy Research ‐ Evaluation of the Re‐Integration of Ex‐Offenders (RExO) Program:
Interim Report
• Justice Center The Council of State Governments ‐ : Justice Reinvestment Initiatives
• Annie E. Casey Foundation – Reentry Helping Former Prisoners Return to Communities
• California Proposition 47
• Harvard Magazine ‐ The Urban Jobs Crisis
• Annie E Casey Foundation – Reentry: Helping Former Prisoners Return to Communities
• Home For Good: Furniture for Life
• RAND: Serving Time or Wasting Time?: Correctional education programs improve job
prospects, reduce recidivism, and save taxpayer dollars.
• Re‐entry and prison education ‐ Massachusetts
• Massachusetts DOC ‐ Rethinking Reentry
• Middlesex County ‐ Pretrial Analysis for Middlesex County, Massachusetts Technical
Assistance Report and Addendum
• Boston ‐ Coming Home Directory
• Harvard University: Boston Reentry Study
• Urban Institute ‐ Prisoner Reentry In Massachusetts
Page: 73

The Jobs NOT Jails CoalitionTowards Building a Roadmap to Help End Mass Incarceration and
Ensure Greater Racial and Economic Justice in Massachusetts:
Selected slides
Page: 74

Slides• Growth in incarceration rate since 1965; Slow rate of change over past 7 years
• Disproportionate impact of drug charges on minorities and risk of arbitrary application make repeal of Mandatory Minimums incontrovertible
• We incarcerate too many of the most marginal and vulnerable in our society and release too many ‘to the street’ with little or no support
• Recidivism is already a significant challenge for the criminal justice system
• Number of persons potentially affected by reforms in the JRA is significant
• We have reasonable information on potential gross annual savings from reducing the footprint
• However, reforms will add significantly to existing numbers released to the street
• It is well accepted that recidivism rates can only be expected to increase until significant investments are made across all stages of the system: Rethinking Reentry provides one thoughtful and comprehensive analysis…
• Education and training programs are known to reduce recidivism and save costs
• Yet, these depressing facts continue to persist
• Larceny Threshold by state: only two states have a lower threshold than Massachusetts
• Different bases for calculating larceny thresholds yield dramatically different results
• Assumptions and Calculations
• Jobs NOT Jails Coalition: participating members
• A part of the ecosystem – from The Coming Home Directory
Page: 75

Massachusetts criminally sentenced populations and incarceration rate have more than tripled since 1980
0
2000
4000
6000
8000
10000
12000
19
65
19
67
19
69
19
71
19
73
19
75
19
77
19
79
19
81
19
83
19
85
19
87
19
89
19
91
19
93
19
95
19
97
19
99
20
01
20
03
20
05
20
07
20
09
20
11
20
13
Population/1000 and prison population
Prison population Massachusetts Population
Department of Corrections; Sentencing Commission; Rate is per 100,000 persons; Bottom numbers are prison populations and top numbers includes pretrial detainees held in jails
48
125168 151 143
1980 1990 2000 2013 2015
Prison incarceration rate per 100,000
Incarceration rate per 100,000
10132 10342 10259 10222 10418 9670
11611 10888 10732 10687 1062210632
70006333 6115 6146 5858
5022
0
5000
10000
15000
20000
25000
2008 2009 2010 2011 2013 2015
Incarcerated populations
DOC HOC/Jail HOC 3
Page: 76
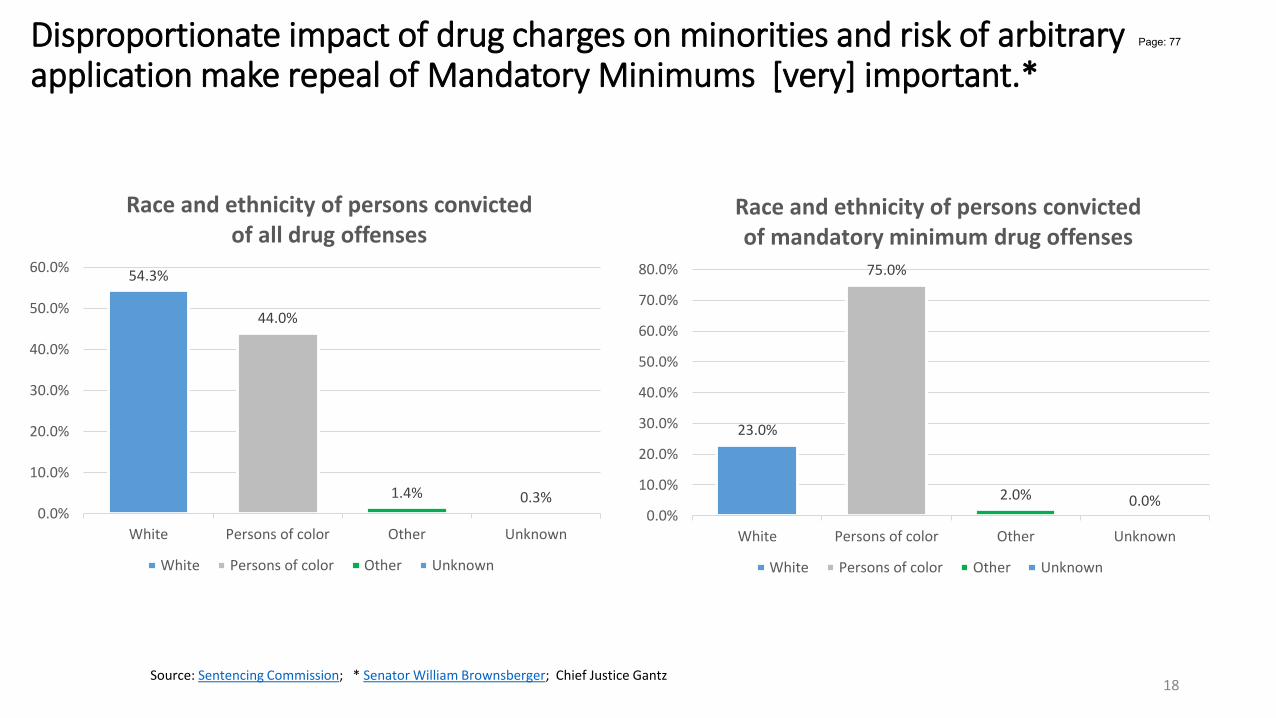
Disproportionate impact of drug charges on minorities and risk of arbitrary application make repeal of Mandatory Minimums [very] important.*
Source: Sentencing Commission; * Senator William Brownsberger; Chief Justice Gantz
54.3%
44.0%
1.4% 0.3%0.0%
10.0%
20.0%
30.0%
40.0%
50.0%
60.0%
White Persons of color Other Unknown
Race and ethnicity of persons convicted of all drug offenses
White Persons of color Other Unknown
18
23.0%
75.0%
2.0% 0.0%0.0%
10.0%
20.0%
30.0%
40.0%
50.0%
60.0%
70.0%
80.0%
White Persons of color Other Unknown
Race and ethnicity of persons convicted of mandatory minimum drug offenses
White Persons of color Other Unknown
Page: 77

We incarcerate too many of the most marginal and vulnerable in our society and release too many ‘to the street’ with little or no support
We have been incarcerating the poor; the unemployed, and underemployed; the undereducated and the afflicted and infirm. The statistics available from Hampden Countyand the DOC are shocking in their starkness:
• 31% of females and 51 % of males lacked a high school diploma or GED at intake; most are reading at a 6th grade level.
• 88% of women and 93% of men were identified as having a substance abuse problem
• 72% had personal/emotional issues
• 79% of females and 74% of males were unemployed at time of incarceration
• 63% of the female prisoners and 25% of the male prisoners have an open mental health case
• 45% of male and 37% of female prisoners upon admission have less than a 9th grade reading level
• 35% of male and 39% of female prisoners upon admission have less than a 6th grade math level.
• The DOC releases to the street approximately 3000 persons annually from our prisons, over half with no supervision.
• The HOCs release approximately 13,000, with only 15% under parole supervision
• The jails release approximately 18,000 on bail, to court and to time served.
• And, there are 86,000 persons on probation - a large number (though we do not know exactly how many) is poor and/or unemployed yet still required to pay fines of $65/month.
Sources: Hampden County Sheriff Department of Corrections Research Data 5
Page: 78

Recidivism is already a significant challenge for the criminal justice system
• DOC: • The six year recidivism rate (based on
re-arrest) for those released from the DOC is 61% (EOPSS/Pew Center for the States Results First MA data)
• The recidivism rate (based on re-incarceration) of those released from a maximum security prison is 62%; the overall DOC rate is 42%
• HOCs - Hampden County: • Three years post release, 59.7% (1136)
of offenders had been arraigned, 42.8% (814) had been convicted and 31.8% (605) had been incarcerated for a new crime. Another 8.9% (169) had been incarcerated for a technical violation of probation or parole (most in the first year).
• The total three -year re-incarceration rate for 2010 releases is 40.7%.
Poverty, intemperance,
misery, unemployment,
Crime, Sentencing, Probation, Incarceration
Released without support: housing,
education, treatment, supervision
Recidivism rate speaks for
itself: 40-65%
Sources: Department of Corrections; Hampden County Sheriff; Pew Center
6
Page: 79

JRA and other reforms should have significant impact on incarcerated populations*
231
661
125
974
0
1991
0
1864
307211
305
2687
0
500
1000
1500
2000
2500
3000
Felonies to Misdemeanors Increase in good time max Parole eligibility Repeal drug mandatoryminimums selectively
Bail reform Total
Estimated annual person years saved by reform type and incarceration population
DOC Jails and HOCs
*Assumptions: there is capacity within the ‘good time’ programs and inmates increase average good time from 4.5 days per month to 9 days per month; and, sentence reduction recommendations are applied as written in repeal of drug mandatory minimums; the felonies to misdemeanors figure only includes savings from new commitments starting in year 2. See slides 64-66 for all assumptions and calculations.
7
Page: 80
Potential gross annual savings from reducing the footprint
231
661
125
974
0
1991
0
1864
307211
305
2687
0
500
1000
1500
2000
2500
3000
Estimated annual person years saved by reform type and incarceration population
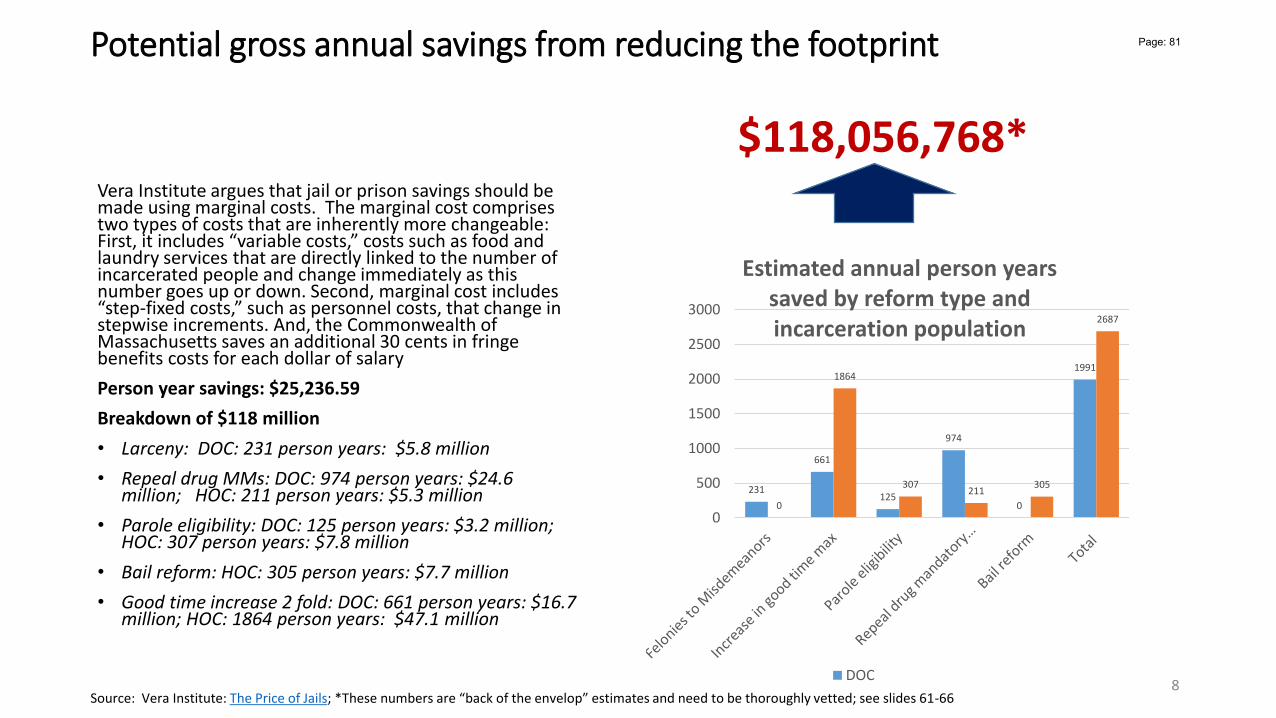
DOC
Vera Institute argues that jail or prison savings should be made using marginal costs. The marginal cost comprises two types of costs that are inherently more changeable: First, it includes “variable costs,” costs such as food and laundry services that are directly linked to the number of incarcerated people and change immediately as this number goes up or down. Second, marginal cost includes “step-fixed costs,” such as personnel costs, that change in stepwise increments. And, the Commonwealth of Massachusetts saves an additional 30 cents in fringe benefits costs for each dollar of salary
Person year savings: $25,236.59
Breakdown of $118 million
• Larceny: DOC: 231 person years: $5.8 million
• Repeal drug MMs: DOC: 974 person years: $24.6 million; HOC: 211 person years: $5.3 million
• Parole eligibility: DOC: 125 person years: $3.2 million; HOC: 307 person years: $7.8 million
• Bail reform: HOC: 305 person years: $7.7 million
• Good time increase 2 fold: DOC: 661 person years: $16.7 million; HOC: 1864 person years: $47.1 million
$118,056,768*
Source: Vera Institute: The Price of Jails; *These numbers are “back of the envelop” estimates and need to be thoroughly vetted; see slides 61-66 8
Page: 81

However, reforms will add significantly to existing numbers released to the street
The numbers already seem overwhelming
• The DOC releases to the street approximately 3,000persons annually from our prisons, over half with no supervision;
• HOCs release approximately 13,000, with only 15% paroled; and, the jails release approximately
18,000 on bail, to court and to time served;
• And, finally there are approximately 12,000added to the probation rolls annually. There are
86,000 persons on probation - a
large number (though we do not know exactly how many) is poor and/or unemployed yet still required to pay fines of $65/month.
Sources: Department of Correction; Hampden County; Department of Probation 9
Page: 82

It is well accepted that recidivism rates can only be expected to increase until significant investments are made across all stages of the system: Rethinking Reentry provides one thoughtful and comprehensive analysis…
Highlighted elements• Pre-trial
• Better diversion initiatives reduces incarceration rate; Increased diversion for drug addicts and mentally ill populations
• No mandatory minimum terms
• Standardized assessment tools used by all agencies including the courts
• Incarceration• Lower security/pre-release facilities become the majority of where inmates are housed and released from; looking more like cottages than warehouses
• Able to reduce prison spending with decreased incarceration rates and use savings to provide reentry resources post-release
• Every correctional facility will have GED and college programs for those in jail/prison; programs bring “outside classes” in; college programs are made available for returning citizens
• Employers go into institutions to recruit/prepare inmates;
• Released • Recidivism rate reduced to 15%: Significant decreases in recidivism rates, primarily attributed to improvements in housing, jobs, education, mentoring, healthcare
insurance and treatments for substance abuse, and mental health
• Mandatory post-release supervision
• Incentive supervision
• Subsidized employment outside of prison to access; jobs are subsidized at transition from prison
• Liability protection for employers
• County run halfway housing
• Returning citizens involved with volunteers providing peer support
• One common ID; statewide offender management system based in biometrics
• Restorative justice
• Way in which data/information is coordinated and shared is centralized across systems from point of assessment at the “front
Source: Department of Corrections: Rethinking Reentry10
Page: 83
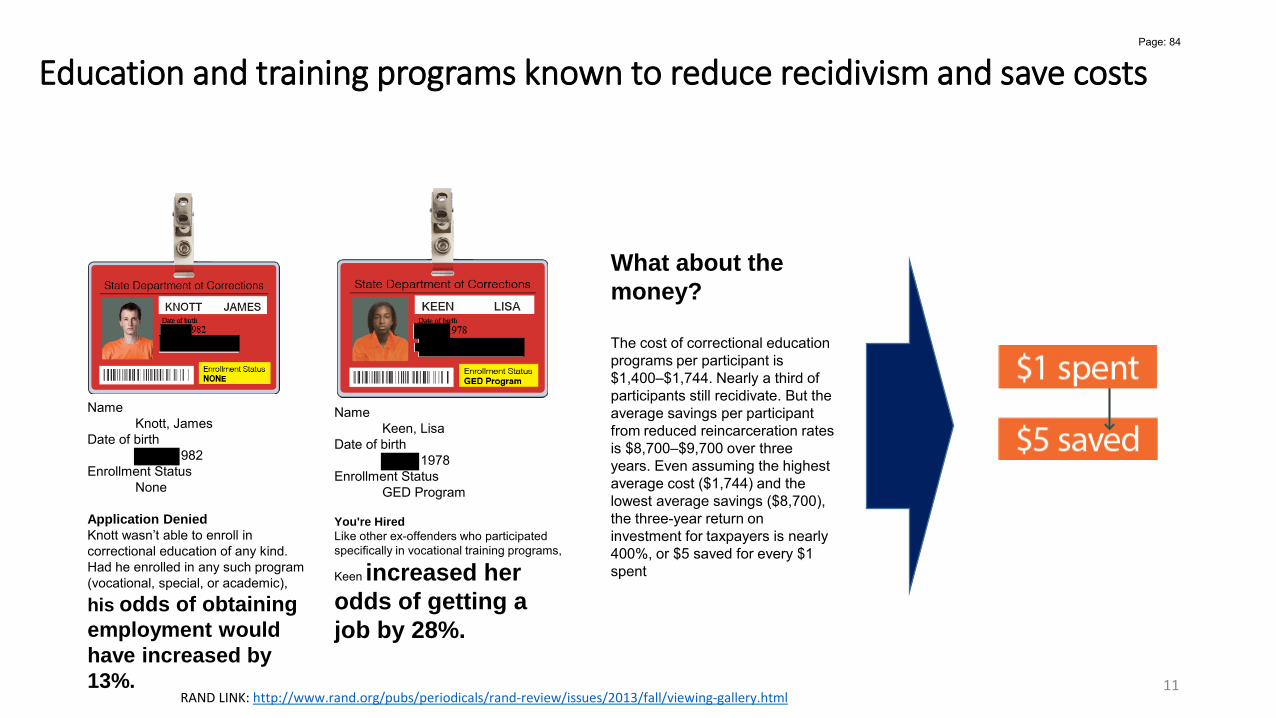
Education and training programs known to reduce recidivism and save costs
NameKeen, Lisa
Date of birth1978
Enrollment StatusGED Program
You're Hired
Like other ex-offenders who participated specifically in vocational training programs,
Keen increased her
odds of getting a
job by 28%.
NameKnott, James
Date of birth982
Enrollment StatusNone
Application Denied
Knott wasn’t able to enroll in correctional education of any kind. Had he enrolled in any such program (vocational, special, or academic),
his odds of obtaining
employment would
have increased by
13%.
What about the
money?
The cost of correctional education programs per participant is $1,400–$1,744. Nearly a third of participants still recidivate. But the average savings per participant from reduced reincarceration rates is $8,700–$9,700 over three years. Even assuming the highest average cost ($1,744) and the lowest average savings ($8,700), the three-year return on investment for taxpayers is nearly 400%, or $5 saved for every $1 spent
RAND LINK: http://www.rand.org/pubs/periodicals/rand-review/issues/2013/fall/viewing-gallery.html11
Page: 84

Yet, these depressing facts continue to persist
• In 2011, the Department of Correction (DOC) devoted 2.09% of
its budget to prison programming, including education(this figure is down from a 2.2% expenditure in 2010)
• In September 2012, there were for academic programming,
including job 4,561 prisoners on the DOC’s wait list training.
• In September 2012, there were 4,405 prisoners on the DOC’s wait list for program and re-entry services, including critical substance abuse treatment
• Approximately 80% of prisoners report substance abuse, but 473 of the approximately 1,300 prisoners at the state maximum security prison are on the DOC’s wait list for substance abuse treatment
• There have been deep cuts to state funding of prison programming and treatment. In 1990, the state allocated nearly $7 million (in today’s dollars) to prison education. By 2004, the figure had fallen by 25 per cent to
$5 million. At present, the prison education line item is eliminated entirely from the DOC budget.
HISTORICAL BUDGET LEVELS ($000)column definitions
ACCOUNT FY2013GAA
FY2014GAA
FY2015GAA
FY2015Projected
FY2016GAA
8900-0001
Department of Correction Facility Operations
541,217 547,114 561,700 568,820 570,152
8900-0002
Massachusetts Alcohol and Substance Abuse Center
5,000 5,000 5,000 5,000 5,000
8900-0010
Prison Industries and Farm Services Program
3,011 3,011 3,091 3,091 3,524
8900-0011
Prison Industries Retained Revenue
3,600 3,600 3,600 3,600 3,600
8900-0045
Reimbursement from Housing Federal Inmates Retained Revenue
1,000 1,000 1,000 914 0
8900-0050DOC Fees RR
5,000 5,000 8,600 8,600 8,600
8900-1100Re-Entry Programs
550 250 250 246 250
TOTAL 559,378 564,975 583,241 590,271 591,126Source: Special Legislative Commission, 2015
Source: Massachusetts Government
Budget Cut for Reentry Programs
12
Page: 85

Larceny Threshold by state: only two states have a lower threshold than Massachusetts
0
500
1000
1500
2000
2500
3000
0
0.2
0.4
0.6
0.8
1
1.2
New
Jer
sey
Vir
gin
iaM
assa
chu
sett
sFl
ori
da
Haw
aii
Ala
bam
aIll
ino
isK
entu
cky
Mis
sou
riN
ebra
ska
New
Mex
ico
Okl
aho
ma
Ten
nes
see
Nev
ada
Lou
isia
na
Ala
ska
Ind
ian
aW
ash
ingt
on
Ver
mo
nt
Cal
ifo
rnia
Wes
t V
irgi
nia
D.C
Mai
ne
Mar
ylan
dM
inn
eso
taM
issi
ssip
pi
New
Ham
psh
ire
New
Yo
rkN
ort
h D
ako
taO
hio
Ore
gon
Ari
zon
aA
rkan
sas
Idah
oIo
wa
Kan
sas
Mic
hig
anN
ort
hC
aro
lina
Sou
th D
ako
taW
yom
ing
Geo
rgia
Rh
od
e Is
lan
dD
elaw
are
Texa
sM
on
tan
aU
tah
Co
lora
do
Co
nn
ecti
cut
Pen
nsy
lvan
iaSo
uth
Car
olin
aW
isco
nsi
n
Page: 86

Different bases for calculating larceny thresholds yield dramatically different results
• In testimony to the Judiciary Committee we proposed that the larceny threshold be raised to $1300. We reached that figure using the Bureau of Labor Statistics inflation calculator, multiplying the threshold established in 1945 ($100) by the consumer price index between 1945 and 2015.
• Senator Brownsberger challenged us at the October 14 hearing, asking whether we thought “they got it right in 1945.” Since we had no answer, we discussed different options. One we suggested to the Senator was estimating the percentage of the median per capita personal income represented by $100 in 1945. Though it does not address the issue raised about whether $100 was the right floor in 1945, we thought a more appropriate measure than CPI could be the percentage of median per capita personal income represented by $100. In 1945 it was 8% ($100/$1223); in 2012 per capital income was $42,693. So, the threshold could be $3,500. The Senator’s response: “Very helpful rationale. I like that”
Sources: BLS CPI Inflation Calculator U.S. Department of Commerce, Bureau of Economic Analysis, Survey of Current Business
Per capita personal income
1945: $1,223
2012: $42,693
100/1223 = 8%
.08*42,693 = $3,415
Consumer price index inflation calculator
$100 in 1945 has the same buying power as $1,321.92 in 2015
Page: 87
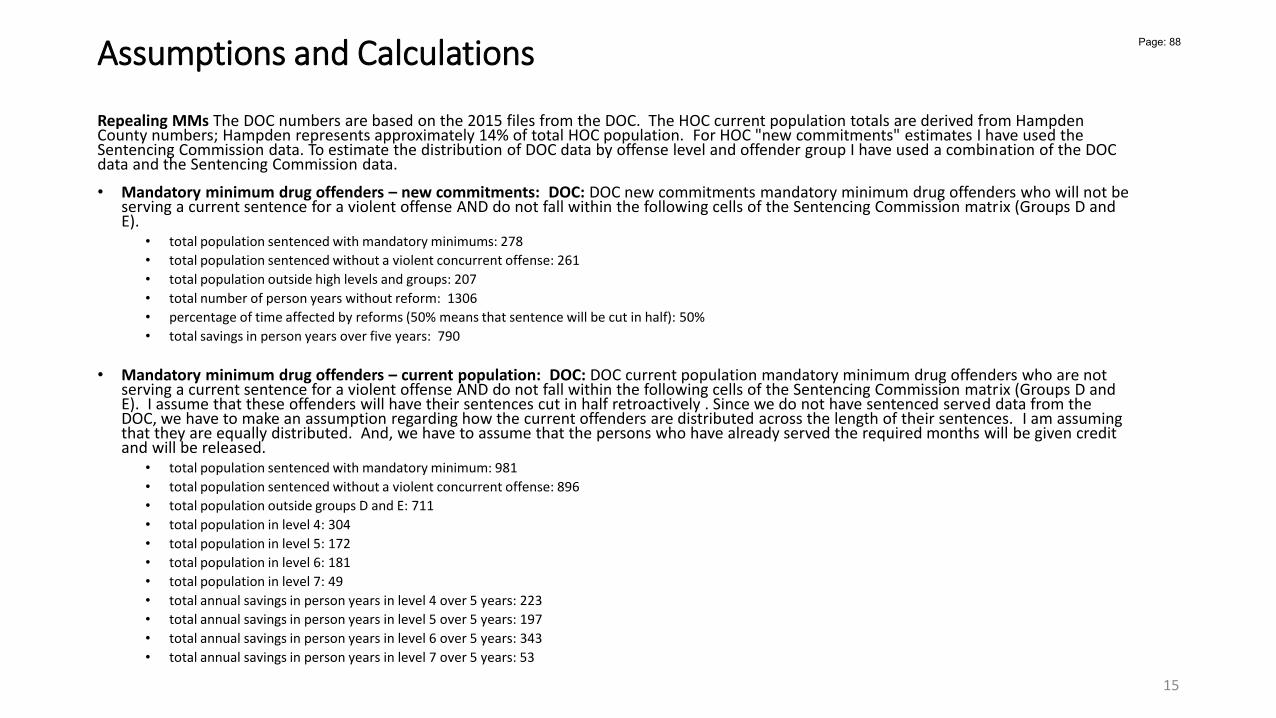
Assumptions and Calculations
Repealing MMs The DOC numbers are based on the 2015 files from the DOC. The HOC current population totals are derived from Hampden County numbers; Hampden represents approximately 14% of total HOC population. For HOC "new commitments" estimates I have used the Sentencing Commission data. To estimate the distribution of DOC data by offense level and offender group I have used a combination of the DOC data and the Sentencing Commission data.
• Mandatory minimum drug offenders – new commitments: DOC: DOC new commitments mandatory minimum drug offenders who will not be serving a current sentence for a violent offense AND do not fall within the following cells of the Sentencing Commission matrix (Groups D and E).
• total population sentenced with mandatory minimums: 278
• total population sentenced without a violent concurrent offense: 261
• total population outside high levels and groups: 207
• total number of person years without reform: 1306
• percentage of time affected by reforms (50% means that sentence will be cut in half): 50%
• total savings in person years over five years: 790
• Mandatory minimum drug offenders – current population: DOC: DOC current population mandatory minimum drug offenders who are not serving a current sentence for a violent offense AND do not fall within the following cells of the Sentencing Commission matrix (Groups D and E). I assume that these offenders will have their sentences cut in half retroactively . Since we do not have sentenced served data from the DOC, we have to make an assumption regarding how the current offenders are distributed across the length of their sentences. I am assuming that they are equally distributed. And, we have to assume that the persons who have already served the required months will be given credit and will be released.
• total population sentenced with mandatory minimum: 981
• total population sentenced without a violent concurrent offense: 896
• total population outside groups D and E: 711
• total population in level 4: 304
• total population in level 5: 172
• total population in level 6: 181
• total population in level 7: 49
• total annual savings in person years in level 4 over 5 years: 223
• total annual savings in person years in level 5 over 5 years: 197
• total annual savings in person years in level 6 over 5 years: 343
• total annual savings in person years in level 7 over 5 years: 53
15
Page: 88

• Mandatory minimum drug offenders – new commitments: HOC• total population: 180• total number of months on mandatory sentences (mean sentence length*number in offense and group level cell): 1849• total number of person years saved by reforms: 77
• Mandatory minimum drug offenders - current population: HOC• total population: 193• average number of days on mandatory sentences: 676• total number of person years saved by reforms over 1.5 years: 134
Increasing maximum good time earned per month to 20 days: While we wait for data from the DOC on actual numbers of good time days earned and wait times by institution, my calculations assume that the very most that can be expected is a doubling of the current 4.5 days per month by the non-violent, criminally sentenced. These assumptions are based on the following from the Special Commission to Study the Criminal Justice System report and the DOC
• on average non-violent criminally sentenced are released at 85% of their maximum sentences including jail credit.• there have been deep cuts to state funding of prison programming and treatment. In 1990, the state allocated nearly $7 million
(in today’s dollars) to prison education. By 2004, the figure had fallen by 25 per cent to $5 million. At present, the prisoneducation line item is eliminated entirely from the DOC budget.
Bail reform: Due to the absence of data on the pretrial population at the county level the calculation is based on three assumptions: the distribution of days in custody in Hampden county is reflective of the total Massachusetts jail population, only the those categorized as ‘bailed’ will be affected and all possible days will be credited.
• total number of persons affected: 5680• distribution by length of stay
• 60% - 10 days or less
• 15% - within 20 days
• 25% - within 40 days
Assumptions and Calculations
16
Page: 89

Changing felony level to misdemeanor level for some property offenses: There is a good deal of information we do not have,: the number of property offenders who would fall between the current floor ($250) and the suggested one ($1000+); which categoriesmay be affected (i.e., do we include only the “larceny O250” or do we include all property categories]; the LOS data and the status of the current DOC population. So, I have had to make many assumptions, please see below.
• New commitments: There is a total of 423 new commitments in the property category who are not serving a concurrent sentence for a violent offense. Based on data from the Sentencing Commission we can estimate that 50% of this total (or 211) fall within the levels 3,4, and 5 and in history groups A,B,C. Of this number we have to estimate what percentage falls under the “new” felony floor. My not particularly informed guess: 50%. So the total eligible would be 106. The mean sentence length from the Sentencing Commission for offenders in the property category at levels 3, 4, 5 and in groups A, B and C incarcerated at the DOC is approximately 50 months. For those sentenced to the HOCs for similar levels the mean sentence is 11 months.
• average annual savings [over 4.2 years starting in year two]: 159 person years.
• Current population: There is a total of 710 property offenders in the current DOC population who are not serving a concurrent sentence for a violent offense. Based on data from the Sentencing Commission we can estimate that 50% of this total (or 211) fall within the levels 3,4, and 5 and in history groups A,B,C. Of this number we have to estimate what percentage falls under the “new” felony floor. My not particularly informed guess: 50%. So the total eligible would be 178. The mean sentence length from the Sentencing Commission for offenders in the property category at levels 3, 4, 5 and in groups A, B and C incarcerated at the DOC is approximately 50 months. For those sentenced to the HOCs at similar levels and groups the mean sentence is 11 months. Since we do not have sentenced served data from the DOC, we have to make an assumption regarding how the 178 are distributed across the length of their sentences. I am assuming that they are equally distributed along all 50 months. And, we have to assume that the persons who have already served 11 months, will be given credit and released.
• average annual savings for the 40 persons who are immediately released (i.e., 1-11 months left on sentence): 16 person years • average annual savings for the 98 persons who have 12-39 months left on their sentences: 29 person years• average annual savings for the 40 persons who have 40-50 months left on their sentences: 27 person years
Parole eligibility from completing one half of sentence to one third of sentence : Total number of person years saved: good time difference times .17 (percentage released on parole) divided by 50% minus same total divided by 33%/365. Assumption: all parolees take maximum number of good time days and they represent only 17% of the offender total population.
Assumptions and Calculations
17
Page: 90

Jobs NOT Jails Coalition: participating members
• Action for Regional Equity
• ACT UP Boston
• AIDS Project Worcester
• American Civil Liberties Union of Massachusetts
• American Friends Service Committee
• Arise for Social Justice, Springfield
• Arlington Street Church (Boston)- Social Action Committee
• 10-Point Coalition
• Bangladesh Workers Solidarity Network
• Black and Pink
• Blackstonian.com
• Boston Feminist Liberation
• Boston Living Center
• Boston Coalition for Palestinian Rights
• Boston New Sanctuary Movement
• Boston Public Health Commission
• Boston Street Medics
• Boston Taxi Drivers Association
• Boston Workers’ Alliance
• Brockton Interfaith Community
• Carpenters Local 107
• Carpenters Local 108
• Catholic Campaign for Human Development
• Children’s League of Massachusetts
• Cleghorn Neighborhood Center, Fitchburg
• Coalition for Effective Public Safety
• Coalition for Social Justice, Fall River and New Bedford
• Coalition to Fund our Communities
• Committee of Friends and Relatives of Prisoners
• Committee for Public Counsel Services
• Community Labor United
• Congregation Dorshei Tzedek
• Cooperative Metropolitan Ministries
• Criminal Justice Policy Coalition
• Dismas House
• Dorchester People for Peace
• Elevate Boston Foundation, Inc
• Ending Mass Incarceration Together
• EPOCA (Ex-prisoners and Prisoners Organizing for Community Advancment)
• Essex County Community Organization (ECCO)
• Everett Community Health Partnership
• The Fact She3t
• Families for Justice as Healing
• Families Against Mandatory Minimums
• First Church in Cambridge, Missions and Social Justice Committee
• First Parish in Bedford Unitarian Universalist
• First Parish, Brookline
• First Parish Unitarian Universalist Church of Northborough
• Fitchburg Minority Coalition
• Freedom Road Socialist Organization (FRSO)
• Fresh Pond Friends Meeting
• Friends Meeting at Cambridge
• Gay and Lesbian Advocates and Defenders (GLAD)
• Green Rainbow Party
• Grove Hall Neighborhood Development Corporation
• Hampshire Franklin Central Labor Council
• Harvard Divinity School Prison Education Project
• Harvard Law – Prison Assistance Legal Project
• Hispanic Black Gay Coalition
• Lesley College – PAWS
• Lucy Stone Cooperative
• Lynn Youth Street Outreach Advocacy (LYSOA)
• Massachusetts Communities Action Network
• Massachusetts CURE
• Mass Incarceration Working Group of the First Parish Unitarian Universalist of Arlington
• MassOccupy/Brookline
• Massachusetts Jobs With Justice
• Massachusetts Law Reform Institute
• Massachusetts Organization for Addiction Recovery (MOAR)
• Massachusetts Women’s Justice Network
• Melrose Unitarian Universalist Church
• Men of Color Health Awareness (MOCHA), Springfield
• Mission and Social Justice Committee of First Church in Cambridge, UCC
• Moishe Kavod House
• Mothers for Justice and Equality18
Page: 91

…continued
• Multicultural Wellness Center
• NAACP Boston Chapter
• NAACP Youth Council, Boston Chapter
• National Association of Social Workers, Massachusetts Chapter
• National Lawyers’ Guild
• Neighbor to Neighbor
• New England Regional Council of Carpenters
• Occupy Middlesex County
• Occupy Quincy
• Occupy Winchester
• Old Cambridge Baptist Church
• Partakers
• Pioneer Valley Project
• Prison Book Program
• Prison Policy Initiative
• Progressive Massachusetts
• Prisoners’ Legal Services of Massachusetts (PLSMA)
• Real Cost of Prisons Project
• Roxbury Defenders
• Roxbury Youth Works
• SEIU Local 509
• SEIU Local 888
• SEIU Local 1199
• St. John Missionary Baptist Church
• St. Vincent de Paul Society Re-Entry Project
• Social Action Ministry of First Parish Lexington
• SPAN, Inc.
• Spontaneous Celebrations – Beantown Society
• Straight Ahead Ministries
• Survivors, Inc.
• System Change Not Climate Change
• Teen Empowerment
• Teens Leading the Way
• Temple Hillel B’nai Torah, West Roxbury
• The People’s Cafe, Brookline
• Theodore Parker Church Social Action Committee, West Roxbury
• Three Pyramids, Inc./The Minority Coalition
• Timothy Baptist Church
• Toastmasters Prison Volunteers
• Unitarian Universalist Mass Action
• Unitarian Universalist Urban Ministry
• Unitarian Universalist Church of Wakefield Transformative Justice and Violence Prevention Ministry
• UNITE HERE Local 26
• United Church of Christ, Innocence Commission Task Force
• United First Parish Church Outreach Committee, Quincy
• United for a Fair Economy
• United for Justice and Peace
• USW Local 8751
• United Teen Empowerment Center (UTEC)
• Veterans for Peace
• Women’s International League for Peace & Freedom
• Worcester Branch, NAACP
• Worcester Community Labor Coalition
• Worcester Homeless Action Committee
• Worcester Interfaith
• Worcester Unemployment Action Group
• Worcester Youth Center
• Youth Against Mass Incarceration
• Youth Jobs Coalition
19
Page: 92

• Employment
• ABCD (Action for Boston Community Development), Boston
• Asian-American Civic Association, Boston
• Boston Career Link, Boston
• Boston Center for Independent Living, Inc., Boston
• Boston Workers Alliance, Dorchester
• Cambridge Multi-Service Center, Cambridge
• Career Source, Cambridge
• Community Work Services, (CWS), Boston
• Dorchester Bay Economic Development Corporation, Dorchester
• Haley House Bakery Training Program, Roxbury
• JobNet, Boston
• Just-A-Start Corporation, Cambridge
• La Alianza Hispana, Roxbury
• Massachusetts Department of Transitional Assistance (DTA), Boston
• Massachusetts Rehabilitation Commission, (MRC), Boston
• One Stop Career Centers
• Pine Street Inn, Boston
• Project Place: Employment, Job Training, & Resource Services, Boston
• Solutions at Work, Cambridge
• Span, Inc., Boston
• Straight Ahead Ministries, Lynn
• STRIVE – Boston Employment Services, Inc., Dorchester
• The Work Place, Boston
• Urban League of Eastern Massachusetts, Roxbury
• Work Opportunity Tax Credit, U.S. Department of Labor, Boston
• Substance Abuse
• Adcare, Boston
• Alcoholics Anonymous
• Bay Cove Human Services, Boston
• Bay State Community Services, Quincy
• Boston Public Health Commission: Father Friendly Initiative, Boston
• Boston Public Health Commission: Men's Health and Recovery Program, Boston
• Boston Public Health Commission: Mom's Project , Boston
• Boston Rescue Mission, Boston
• Casa Esperanza, Inc., Roxbury
• CASPAR, Inc. Emergency Service Center, Cambridge
• Catholic Charities Archdiocese of Boston, Boston
• Entre Familia, Mattapan
• Future Hope Apprenticeship Program, Dorchester
• Helpline, MA Substance Abuse Information & Education
• Hope House, Boston
• Long Island Shelter, Boston
• Neponset Health Center, Harbor Health Services, Inc., Dorchester
• New England Center for Homeless Veterans, Boston
• New England Forensic Associates, Arlington
• Rosie's Place, Boston
• Salvation Army, Boston
• Education
• ABCD (Action for Boston Community Development), Boston
• ASA College Planning Center, Boston
• Asian-American Civic Association, Boston
• Boston Center for Independent Living, Inc., Boston
• Boston Centers for Youth & Families, Boston
• Boston Public Schools Adult Diploma Program, Roxbury
• Boston Public Schools Adult Learning Center, Roxbury
• Bunker Hill Community College, Charlestown
• Cambridge Center for Adult Education, Cambridge
• Catholic Charities Archdiocese of Boston, Boston
• Catholic Charities Archdiocese of Boston: El Centro del Cardenal, Jamaica Plain
• Catholic Charities Archdiocese of Boston: Haitian Multi-Service Center, Dorchester
• Centro Latino de Chelsea, Inc., Chelsea
• Charlestown Adult Education Program, Charlestown
• College Bound Dorchester, Dorchester
• Community Learning Center, Cambridge
• East Boston Adult Education Center, East Boston
• Jackson-Mann Community Center, Allston
• Jamaica Plain Community Center, Adult Learning Program, Boston
• Just-A-Start Corporation, Cambridge
• Literacy Volunteers of Massachusetts - Boston, Boston
• Prisoner Reentry Institute at John Jay College of Criminal Justice, New York
• Project Hope, Roxbury
• Roxbury Community College, Roxbury
• Roxbury Multi-Service Center, Boston
• Salvation Army: Boston Central Corps, Roxbury
• Somerville Center for Adult Learning Experiences (SCALE), Somerville
• Straight Ahead Ministries, Lynn
• The Dimock Center, Roxbury
• The John W. Perry Scholarships Fund, Washington
• United South End Settlements, Boston
• Urban College of Boston, Boston
• WAITT House, Inc., Roxbury
• X-CEL, Inc., Jamaica Plain
A part of the ecosystem – from The Coming Home Directory
20
Page: 93

Page: 94

Page: 95

Page: 96

Page: 97

Page: 98

Page: 99

Page: 100

Page: 101

Page: 102

Page: 103

Page: 104

Page: 105

Page: 106

Page: 107

Page: 108

Page: 109

Page: 110

Journal of Public Health VoI. 27, No. 2, pp. 143–148doi:10.1093/pubmed/fdi011 Advance Access Publication 8 April 2005
© The Author 2005, Published by Oxford University Press on behalf of Faculty of Public Health. All rights reserved.
The Resolve to Stop the Violence Project: reducing violence in the community through a jail-based initiative James Gilligan and Bandy Lee
Abstract
Background The usual modes of incarceration have notbeen found to curb violent crimes significantly. A jail-basedprogramme called the Resolve to Stop the Violence Project(RSVP) was created with the hypothesis that exposing menwith a history of serious, recent and often multiple violentcrimes to a certain specifiable set of social, cultural and psy-chological conditions would reduce the frequency and sever-ity of their violent behaviour.
Methods Court and criminal records for 1 year followingrelease were reviewed for 101 inmates who had spent 8weeks or more in the programme and for the same numberof those who had spent 8 weeks or more in regular custody.
Results Inmates who participated in RSVP had lower re-arrest rates for violent crimes (−46.3 per cent, p < 0.05) andspent less time in custody (−42.6 per cent, p < 0.05). Thedecline in violent re-arrests increased with greater lengths ofstay (−53.1 per cent, p < 0.05 for 12 weeks or more; −82.6 percent, p < 0.05 for 16 weeks or more).
Conclusions Multilevel, comprehensive prevention approachesthat: emphasize making available to violent individuals thekinds of tools they need in order to develop non-violentskills and reality-based sources of self-esteem; increase theircapacity to experience feelings of empathy and remorse;and provide opportunities to take responsibility and amendthe injuries they have inflicted on others and on the wholecommunity, may play an important role in reducing thecycle of violent crime.
Keywords: violence, violence prevention, violent offenders,restorative justice
Introduction
The United States has the highest homicide rate of any industri-alized nation, averaging, in most years, five times the rates ofother English-speaking democracies (Canada, Australia, andNew Zealand) and 10 times the rates experienced in the UnitedKingdom, the rest of western Europe and Japan. The homicideincidence, almost 11 per 100 000 citizens at its peak, hasprompted many United States governmental and non-governmental officials to declare it a public health emergency.Nevertheless, even though deaths from violent injuries causemore years of life lost before the ages of 65–70 than heart disease
and cancer combined, a National Academy of Sciences reportshowed that we spend 14–25 times as much money for heart dis-ease or cancer research alone as we do for research on violence,per year of life lost.1 While United States’ rates of violent crime,including murder and manslaughter, forcible rape, robbery andaggravated assault, fell slightly during the last few years of thetwentieth century, they are still a massive social problem.
A growing number of programmes are implemented in anattempt to curb the epidemic, although few have been compre-hensive in scope or well evaluated.2–4 One method that hasbecome more widespread than any other without much empiricalbacking is the incarceration-oriented, punitive approach. Thissimplistic solution has resulted in an escalation of prisons andpolice, as well as of capital punishment, in accordance with thecurrent socio-political climate. For the first three-quarters ofthe twentieth century, the United States’ incarceration rate injails and prisons averaged about 100 (±20) per 100 000 popula-tion, during which time the murder rate fluctuated from 4 to 10.The murder rate peaked during the years of Prohibition and theDepression of the 1930s, when it reached levels of 8–10; it thenreached record lows of 4.5–6 from 1940 to 1969, followingwhich it increased once again to epidemic levels of 8–11, until itfell to as low as 6 by the last few years of the twentieth century,only to begin rising again after 2000. During the last quarter ofthe century, however, the incarceration rate underwent a con-tinued and unprecedented escalation, from an average of 100 toalmost 700 per 100 000 population (the highest in the world,and the highest in the United States’ history) – with no observa-ble effect on the murder rate. By 1998, the murder rate finallyreached its lowest level in 30 years, not when the incarcerationrate reached the highest level in the United States’ history – it
James Gilligan, Visiting Professor of Psychiatry, Criminology, and Social Work, University of Pennsylvania, Philadelphia, Pennsylvania 19104
Bandy Lee, Assistant Clinical Professor of Law and Psychiatry, Yale University, 34 Park Street, New Haven, Connecticut 06519
The study was undertaken while both authors were on the faculty of Harvard University
Address correspondence to B. Lee E-mail: [email protected]
by guest on October 1, 2014
http://jpubhealth.oxfordjournals.org/D
ownloaded from
Page: 111

144 J O U R N A L O F P U B L I C H E A L T H
had already broken that record many times – but only when theunemployment rate reached the lowest level in 30 years, and thepercentage of relative poverty among the minority groups mostvulnerable to homicidal behaviour reached their lowest levels. Onceunemployment and relative poverty began increasing again,after 2000, the murder rate stopped declining notwithstandingthe unprecedented and constantly increasing incarceration rate.
The shocking finding is that some of the approaches intendedfor deterrence may actually stimulate violence, rather than assist incontrolling it.5 Courses of action that increase punishment andhinder reintegration of the individual into the community havebeen carried out without knowledge or regard of their effects onthe individuals involved, as well as on the community and societyat large. Both the National Academy of Sciences’ expert committee1
and other investigators, such as Zimring and Hawkins,6 state that,based on the policy’s key assumptions, the dramatic increase inincarceration should have virtually eliminated crime in the UnitedStates many years ago. Instead, bulging prisons have not corre-lated with any demonstrable dampening of crime.7 Linsky andStrauss8 found that states with the highest incarceration rates hadthe highest crime rates – a pattern that still continues, as personswho experience incarceration exhibit greater criminality oncereleased into the community.9,10 Apart from the negative effects ofincarceration on prospects of job employment and social readjust-ment, one can postulate that concentrated exposure to the moresand attitudes that condone violence will promote recidivism.
If the goal is to reduce the incidence of violence, what if timespent in jail is used for rehabilitative and restorative, ratherthan retributive but counterproductive, purposes? Decreasingrecidivism by supporting prevention contributes to the safety ofthe public and also reduces the financial burden that crimeplaces on the community, which in direct costs alone has beenestimated at US$17.6 billion nationally.11 In San Francisco,over 46 000 crimes were committed in the city between Januaryand October 1996, and direct costs to local victims were estimatedat $24.4 million. The costs of incarceration of San Franciscocounty’s 2000+ inmates, on the other hand, was nearly $51million annually, with the incarceration costs for violentoffenders exceeding $19 million yearly.12 This did not includethe astronomical costs of prosecuting violent offenders andother criminal justice expenditures. A programme aimed atreducing recidivism seemed crucial, and this paper illustratesthe implementation of a project called the Resolve to Stop theViolence Project (RSVP), which focuses on restoration and pre-vention of further violence, rather than retribution for the past.
The Resolve to Stop the Violence Project
The San Francisco County Sheriff’s Department establishedthe Resolve to Stop the Violence Project in September 1997.The programme is designed to use the jail system as a setting forworking with a vast spectrum of violent offenders, from first-time or early offenders to career criminals of heinous crimes.Inmates can be mandated to the programme by the San Francisco
Sheriff’s Department, the courts, or the Adult Probation Depart-ment at the time of booking, during incarceration, or after sen-tencing. Most sentences entail completing a probationary periodfollowing release from jail. Due to a long waiting list, not allthose who are sentenced or referred get into the programme(which created a ‘control group’ for the purposes of evaluation).
The three main components that make up RSVP include:offender accountability, victim restoration and communityinvolvement. Goals of the programme are to reduce recidivismand to promote offender accountability by: (1) taking responsi-bility for one’s actions and accepting the possibility for change;(2) identifying and analyzing the social, cultural and personalbelief systems that promote one’s violent behaviour; (3) recog-nizing that one has a choice at the critical time of violentresponse; (4) increasing awareness of the effects of one’s behav-iour and empathy for victims; and (5) preparing to take on arestorative role when back in the community. Offenderaccountability is considered to be one of the core concepts ofthe programme, for it is felt that punishment does not work oncriminal offenders who lack the capacity for guilt feelings orremorse, or even the sense of self. As long as violent offenderssee no alternatives to their own behaviour but see themselves asa victim of the correctional system, punishment will only serveas a hindrance to reform.
The Offender Accountability component begins with an in-house jail programme, which typically serves 56 inmates at anygiven time. The duration of any inmate’s participation in theprogramme depends on the length of time he resides in an all-male, 62-bed direct supervision dormitory, where the pro-gramme is located. A treatment milieu is created through anintensive, 12-hours-a-day, 6-days-a-week programme consistingof workshops, academic classes, theatrical enactments, counsel-ling sessions and communications with victims of violence.
The Victim Restoration component aids the victims of RSVPoffender participants by working collaboratively with a widerange of social organizations, including domestic violence-relatedcriminal justice and social service agencies, and through casemanagement, advocacy and referrals. These survivors are givenopportunities to restore themselves through group and individualcounselling, community theatre – sometimes with the offenders –and public speaking. Weekly presentations within the jail by vic-tims of violence who describe the suffering they have endured arean essential part of supporting victims through their healing pro-cess, as well as implementing victim-driven violence preventionby helping perpetrators build empathy for victims.
The Community Restoration component of RSVP consistsof continued weekly workshops, forums for public education,community theatre, visual arts and public awareness cam-paigns. This component also works with public and privateagencies to facilitate community meetings, public speaking inschools, law enforcement training and involvement of criminaljustice agencies. While the components were chosen after arestorative justice model involving all parties affected by anindividual’s violence, the characteristic of the programme is
by guest on October 1, 2014
http://jpubhealth.oxfordjournals.org/D
ownloaded from
Page: 112

T H E R E S O L V E T O S T O P T H E V I O L E N C E P R O J E C T 145
that it attempts to be comprehensive, recognizing that thecauses of violence are multi-factorial and cannot be solvedthrough uni-dimensional solutions.
The programme exhibited an almost instantaneous, dra-matic decrease of violent episodes in-house,13 and this studyevaluates its effectiveness in terms of violent recidivism onceparticipants are released into the community.
(A more detailed description of RSVP or consultation onhow to initiate a similar program is available through theauthors.)
Methods
Sample
Data for this analysis were drawn retrospectively from thefollowing: (1) information extrapolated from the programmepaper files; and (2) information from the City and County ofSan Francisco and State of California Criminal Justice Infor-mation Systems (i.e. Police, Court and Department of Justiceautomated records). They formed the basis of a pilot project toa 3-year longitudinal assessment of RSVP. Using the Sheriff’sDepartment RSVP paper files, inmates who went through atleast 8 weeks of RSVP between September 1997 and September1999 were selected for investigation. A control group of inmateswere selected among violent offenders who would have been eli-gible for RSVP but served their time in an ordinary jail due tolack of space in the programme, using the same inclusion andexclusion criteria. Information obtained from both court andcriminal records for the county and state were combined andcross-referenced to form a profile of re-arrest data for each sub-ject, including types of charges and dates. As the primary goalof the study was to determine RSVP’s effectiveness in reducingre-arrests for violence, inmates who were sent directly to prisonfollowing their jail term were excluded from recidivism study.Retention rates did not apply, since enrolment in RSVP is man-datory for qualifying inmates (as far as there is room), and drop-ping out was not possible unless they were released from jail.
Statistical analyses
Initial calculations involved descriptive analyses of demo-graphic factors in the computer system, including age, race andage at first arrest. Independent t-tests, and χ2 test for race, wereperformed to confirm comparability of the two groups. Inde-pendent t-tests were also performed to assess the comparabilityin prior arrest history for these groups. Outcomes for thesegroups were measured similarly, through the comparisons of:(1) violent re-arrest rates in the first post-release year; (2) over-all re-arrest rates in the first post-release year; (3) time intervalbetween release and first violent re-arrest; (4) time intervalbetween release and first re-arrest; and (5) days spent in cus-tody during the first post-release year. To assess lengths of stayand their influence on recidivism, t-tests were used for the fol-lowing: (1) violent re-arrest rates in the first year for those who
have been in RSVP or in the regular jail system for 12 weeks ormore, and (2) violent re-arrest rates in the first year for thosewho have been in RSVP or in the regular jail system for 16weeks or more. Independent t-tests were deemed appropriatein each of the above cases, as the samples compared were inde-pendent but of similar sizes, relatively large with roughly nor-mal distributions, and with similar variances (except fordivergences in the group of 16 weeks or more, in which cases equalvariances were not assumed). Log rank tests were used for daysto first violent or any arrest after release. All statistical analyseswere performed with SPSS/PC version 10.0.
Results
A total of 101 programme subjects were selected based on theabove criteria, and the same number of control subjects wererandomly chosen to match. Descriptive data for the subjectgroups appear in Table 1. Inmates in either group generally hada significant criminal history over the past year, with a mean of1.36 (SD=1.77) overall arrests and 0.56 (SD=0.88) violent arrests.The analysis results, given in Table 2, showed that inmates whoparticipated in RSVP were significantly less likely to be re-arrested on violent charges, remained longer in the communitybefore being re-arrested, and spent less time in custody duringfollow-up in comparison to inmates who did not undergo theprogramme. For a more accurate comparison, recidivism ratesfor RSVP subjects were adjusted for days in the community.
All subjects experienced a lower level of recidivism afterincarceration. The reduction in violent recidivism was muchgreater among RSVP participants at 66.7 per cent (t =4.74;p < 5 ×10⁻⁶) as opposed to 41.0 per cent among control subjects(t =2.39; p < 0.01). The reduction in overall recidivism was alsogreater among RSVP participants at 48.3 per cent (t =4.30;p < 5 ×10⁻⁵) as opposed to 34.7 per cent among control subjects(t =2.57; p < 0.01). Reductions in violent recidivism was relatedto greater lengths of participation. Control subjects who spent 8weeks or more in regular jail (n =101) as opposed to the equi-valent time in RSVP (n =101) were one and three-quarters morelikely to be re-arrested for violent charges during the first post-release year (p < 0.05). Those who spent 12 weeks or more inregular jail (n = 71) rather than equivalent RSVP participation(n =66) were over twice as likely to be re-arrested for violence(p < 0.05). Those who spent 16 weeks or more (n =61) were re-arrested five times as often compared with the equivalent RSVPgroup (n =30) (p < 0.05). Although the results for those incar-cerated for 16 weeks or longer are dramatic, the weaker statist-ical strength due to the smaller sample sizes and greatervariances should be taken into consideration.
Discussion
Do the results demonstrate effectiveness of RSVP’s approach asa means of curbing violence? It would have been best to establish
by guest on October 1, 2014
http://jpubhealth.oxfordjournals.org/D
ownloaded from
Page: 113

146 J O U R N A L O F P U B L I C H E A L T H
Table 1 Demographic and criminal characteristics of programme and control groups
*t- or χ2 test not significant. †It is possible that Hispanic inmates are included here, due to their previous categorization as ‘White’. ‡Not applicable for comparison purposes.
.........................................................Programme (n � 101)
...................................................Control (n � 101)
Variable Mean SD Mean SD Significance
Age (years) 32.0 9.20 33.4 10.2 NS*
Race Percentage Percentage Caucasian† 26.7% 31.7% NS Black 42.6% 49.5% NS Hispanic 13.9% 5.9% NS Asian or other 14.9% 12.9% NS
Mean SD Mean SD Length of stay (days) 159.1 82.0 158.6 100.4 NS Length of stay in RSVP
(days) 110.9 58.3 NA‡ NA NA
Age of first arrest (years) 23.0 6.67 24.7 9.22 NS Number of arrests in
past year 1.32 1.41 1.41 2.08 NS
Number of violent arrests in past year
0.56 0.78 0.55 0.96 NS
Table 2 Comparison of recidivism indicators after release from jail
*Significant.
....................................RSVP group
.......................................Control group
Recidivism indicators Mean SD Mean SD Difference Significance
≥8 weeks in custody (n = 101) (n = 101) T p No. of violent re-arrests (adjusted) 0.18 0.36 0.33 0.67 −46.3% −1.99 0.03* No. of re-arrests (adjusted) 0.64 0.90 0.92 1.26 −30.7% −1.82 0.05* No. of incarcerations 0.42 0.62 0.51 0.89 −17.6% −0.92 0.18 No. of days in custody 29.8 68.5 51.9 90.9 −42.6% −1.84 0.03*
F p No. of days until first violent re-arrest 333 90.0 286 124 16.4% 6.66 0.01* No. of days until first re-arrest 306 119 248 145 23.4% 4.14 0.04*
≥12 weeks in custody (n = 66) (n = 71) T p No. of violent re-arrests (adjusted) 0.16 0.38 0.34 0.79 −53.1% −1.72 0.04* No. of re-arrests (adjusted) 0.63 0.92 0.87 1.27 −27.0% −0.87 0.11 No. of incarcerations 0.41 0.60 0.46 0.86 10.9% −0.42 0.34 No. of days in custody 30.2 68.5 46.2 90.2 −28.4% −1.10 0.14
F p No. of days until first violent re-arrest 339 86.2 287 125 18.1% 7.96 0.00* No. of days until first re-arrest 301 127 247 150 21.9% 2.82 0.09
≥16 weeks in custody (n = 30) (n = 61) T p No. of violent re-arrests (adjusted) 0.06 0.22 0.33 0.72 −82.6% −2.02 0.02* No. of re-arrests (adjusted) 0.61 1.00 0.87 1.21 −30.0% −1.01 0.16 No. of incarcerations 0.35 0.54 0.52 0.91 −32.7% −0.83 0.20 No. of days in custody 16.8 33.5 53.1 95.1 −65.8% −1.91 0.03*
F p No. of days until first violent re-arrest 353 59.5 312 108 13.1% 12.28 0.00* No. of days until first re-arrest 300 123 247 152 21.5% 6.84 0.01*
by guest on October 1, 2014
http://jpubhealth.oxfordjournals.org/D
ownloaded from
Page: 114

T H E R E S O L V E T O S T O P T H E V I O L E N C E P R O J E C T 147
the answer using an experimental design, but this is difficult todo in a field setting, especially within a correctional system, andhence a retrospective study was the alternative. The initialhypothesis was that inmates who participated in RSVP wouldhave fewer violent re-arrests and spend less time in jail in theyear after re-entering society than those who did not experienceRSVP. This turned out to be the case. It is noteworthy that aprogramme of 2 months’ or more duration would produce sucha dramatic alteration of lifetime trends: under the RANDCorporation’s determination that any action that effects achange of 10 per cent or more in recidivism is very significant, a46.3 (after 8 weeks) to 82.6 (after 16 weeks) per cent differenceis substantial. As a whole, although the assignment of subjectsfor the study was not through controlled randomization, allfactors were stacked against RSVP: its subjects were of a lowerage group, of a greater racial minority constitution, longer inlengths of incarceration, lower in age of first arrest, and higher inrate of arrests for violent charges. This also applies to postulatedreasons for improvements in both groups: while the decrease inviolent recidivism in RSVP participants is considerable, it is inter-esting to note that the control group also compiled significantlyfewer arrests, unlike the trend in most jails. This may be attributa-ble to the highly rehabilitative conditions of the San FranciscoCounty Jail System, which employs, outside of RSVP, many sub-stantial programmes in the areas of substance abuse, education,life-skills training, etc. Andrews and colleagues documented that inother cities and states14 incarceration in and of itself increasesrecidivism by 7 per cent, but if needed treatment and services areoffered, it reduces it by 15 per cent, and if training of cognitiveskills is given, the reduction is 29 per cent. Given the results in SanFrancisco, where it is difficult to go through the County Jail Sys-tem without participation in some kind of programme, it may bepredicted that the outcome of RSVP would compare even morefavourably to the absence of any programme.
Although far from being a panacea for the complex problemsof violent offenders, the programme intended to be a compre-hensive, major intervention, addressing violence as a matter notonly of individual actions but as a public health matter invol-ving community-wide cognitive, behavioural, affective andsocio-cultural conditioning. The results suggest the possibleeffectiveness of jail-based programmes, that include multidi-mensional, creative and empathy-building prevention approachesemphasizing restoration over the conventional but unsustainable‘lock them up’ approach. The model can be an important spring-board for generating hypotheses regarding the causes of viol-ence and for shaping more thoughtful avenues for reducingviolent offences and re-offences. Nevertheless, longitudinalmulti-site studies are necessary to determine the precise effect ofRSVP on violent recidivism. Although not done in this study,due to the precipitous drop in sample size with length of stay(not to mention the unevenness of size between the two groups),it would be valuable to determine the optimal length of parti-cipation, at which time improvements in recidivism rates would behighest before the benefits of the programme decline or plateau.
The lack of significant reduction in overall arrest rates is dis-appointing. Repeat offenders, who were re-arrested despitehaving refrained from violent offences, were found to returnmost commonly with drug charges or for old vehicular charges.Informal interviews with programme facilitators suggested pos-sible reasons for the former as being the inability to find a joband looking for a quick way to ‘earn a few nickels’, and for thelatter as not showing up in court to clear up allegations regardingthe use of motor vehicles. While this points to the need for morejob and coping skills training, in the instances of drug use, thegreater number of re-arrests may suggest RSVP’s irrelevance incases of substance addiction and the need for the criminaljustice system to address the problem more as a medical ratherthan a criminal one. The study signals the need perhaps for awider and greater emphasis on community supervision andcourt-ordered follow-up after release from jail. A sizeable pro-portion, perhaps the majority, of RSVP participants have beenreleased without continuing court sanctions or mandatoryfollow-up in the community during the very early stages of theprogramme, when all components were yet to be in place. Thesefindings indicate the need for programme staff to work closelywith the court and require that all inmates be placed on proba-tion upon release and include as a condition of probation thatthey participate in programmes. Also, the significant number ofpre-trial inmates sentenced to prison following participation inRSVP (excluded from the study) also reflects the need for com-munication with the court regarding the objectives of the pro-gramme. Limitations of the study include the inability toimplement an experimental design, as discussed above, whichmakes it impossible to eliminate the possibility of compoundingvariables or selection bias. Also, the paucity of demographicdata, due to the limited information in the records and to theretrospective design, makes it difficult to determine predictorsfor success in the programme, although the currently availabledata can serve as proxies for other information. The methodcan be improved through more extensive, controlled studies toexamine long-term outcomes prospectively and wider applica-bility of the programme through a multi-centre study.
In addition to examining the impact of a programme onrecidivism rates, it is important to evaluate its economic merits,especially during an era of public and political cost-consciousness.Thus, while it is difficult to place a price on protecting the gen-eral public and on the quality of life that comes with safety, ananalysis can be made as follows. The imprisoned offenderrequires approximately US$24 783 per year (the cost of housingof $21 352 plus medical expenses of $3 431), or about $68/day.For inmates’ families who go on welfare as a result, the costs onaverage is an additional $21/day.15 All this is without countingmedical spending, work loss and need for public programmes,not to mention offender criminal processing, adjudication, pro-bation and parole, unpaid state or federal taxes, and the esca-lating cost of building new prisons as a result of overcrowding.Counting a reduction of 22.1 days spent in custody during thefollowing year for 110.9 days of RSVP, an additional cost of
by guest on October 1, 2014
http://jpubhealth.oxfordjournals.org/D
ownloaded from
Page: 115

148 J O U R N A L O F P U B L I C H E A L T H
$21/participant-day was incurred to cover all offender, victimand community portions. However, the average 0.14 reductionin re-arrests during the year post-release is an estimated averagesaving of as much as $28 000 in total violence-related costs peroffender, including medical and mental health spending, victimwork loss, public programmes, property damage, criminal jus-tice processing, legal defence, sanctioning and offender workloss.16,17 It was found that by reducing violence-related re-arrestsand reincarcerations, there was a gain of approximately $4 intotal expenses for every dollar spent for the programme.
Not included here are non-monetary losses from incarceration,such as loss of job skills; disruption of family structure; loss ofcommunity integration; further training in violent and socio-pathic mores; loss of avenues for restitution; and increasinglikelihood of imprisonment with longer stays in custody. Addedtogether, the benefits that offenders and the public derive fromviolence prevention programmes such as RSVP are immense.Nevertheless, efforts to expand correctional initiatives withoutimplementing concomitant changes in community environ-ments that engender violence is short-sighted, and ex-offenders,as they rehabilitate into productive rather than destructivemembers of society, will be a valuable resource here.
Conclusion
RSVP was intended to be a comprehensive, major and multidi-mensional intervention to decrease violence, and the changesthat remained for 1 year post-release following only a short stayin jail attest to the programme’s effectiveness. The evaluationgenerated some optimistic conclusions on multilevel preventionapproaches that emphasize restoration over purely retributiveefforts. More experimentation with, and evaluations of, similarprogrammes in a variety of different social contexts, coupledwith further enhancements of our empirical knowledge and the-oretical understanding of the root causes of violence, may enableus to develop ever more potent and successful models for itsprevention. From the perspective of public health, the pro-gramme described here represents only tertiary prevention (i.e.intervention only with those individuals who have alreadybecome sick, or in the case of violence, have already injuredothers), but as it is now being adapted for use in a variety of set-tings including in schools, it should be possible to determinewhether it can also lead to primary and secondary prevention –i.e. preventing violence before it occurs in the first place.
Acknowledgement
The Open Society Institute offered a generous grant for the initi-ation of RSVP as well as for an independent evaluation thatincluded the research for this paper.
References
1 Reiss AJ, Roth JA, eds. Understanding and preventing violence. Washington, DC: National Academy Press, 1993.
2 U.S. Center for Disease Control Research. Youth Violence Prevention: Description and Baseline Data from 13 Evaluation Projects. Am J Prev Med, 1996 Supplement to 12: (5)
3 Sherman LW, Gottfredson D, MacKenzie D, et al., eds. Preventing crime: what works, what doesn’t, what’s promising: a report to the United States Congress prepared for the National Institute of Justice. Washington, DC: U.S. Department of Justice, 1997.
4 Van Voorhis P, Cullen FT, Applegate B. Evaluating interventions with violent offenders: A guide for practitioners and policymakers. Federal Probation 1995; 59: 17–27.
5 Gartner R. The biology and sociology of violence: Toward a new synthesis. In: Grisolía JS, Sanmartin J, Luján JL, Grisolía S, eds. Violence: from biology to society. Proceedings of the International Meeting on Biology and Sociology of Violence, Valencia, Spain, 16–18 September, 1996. New York, NY: Elsevier, 1997; 261–267.
6 Zimring FE, Hawkins G. Crime is not the problem: Lethal violence in America New York, NY: Oxford University Press, 1997.
7 Steffensmeier D, Harer MD. Bulging prisons, an aging U.S. population, and the nation’s violent crime rate. Federal Probation 1993; 57: 3–10.
8 Linsky AS, Straus MA. Social stress in the United States: links to regional patterns in crime and illness. Dover, MA: Auburn House Publishing Co., 1986.
9 Byrne JM, Kelly L. Restructuring probation as an intermediate sanction: An evaluation of the Massachusetts Intensive Probation Supervision Program. Final Report. Washington, DC: National Institute of Justice, 1989.
10 Sampson RJ, Laub JH. Crime and deviance in the life course. Ann Rev Sociol 1992; 18: 63–84.
11 U.S. Department of Justice Office Programs. The Costs of Crime to Victims. Washington, DC: Bureau of Justice Statistics, 1994.
12 San Francisco Police Department Monthly Crime Statistics January-October (Preliminary Reports). San Francisco, CA: City and County of San Francisco Records, 1996.
13 Lee B, Gilligan J. The Resolve to Stop the Violence Project: transforming an in-house culture through a jail-based programme. J Public Health (Oxf) 2005; 27: 149–155.
14 Andrews DA, Zinger I, Hoge RD et al. Does correctional treatment work? A clinically relevant and psychologically informed meta-analysis. Criminology 1990; 28: 369–404.
15 California Department of Social Services Research and Development Division. CAL Statistics Fiscal year 1997/1998. Sacramento, CA: Data Analysis and Publications Branch, 2001.
16 Children’s Safety Network Economics and Data Analysis Resource Center. Cost of Violent Crime and Impaired Driving (Fact sheet). Newton, MA: Education Development Center, 1997.
17 California Department of Justice, Division of Criminal Justice Information Services. Crime and Delinquency in California, 1997. Sacramento, CA: Criminal Justice Statistics Center, 1998.
by guest on October 1, 2014
http://jpubhealth.oxfordjournals.org/D
ownloaded from
Page: 116

Page: 117

Page: 118