massachusetts health connector and department of revenue ... · of revenue (the instructions ......
TRANSCRIPT

Massachusetts Health Connector and Department of Revenue
Data on the Individual Mandate
Tax Year 2012 July 2015

Page 2
Contents Key Findings ........................................................................................................................................ 4
Introduction and Background ........................................................................................................... 6
Methodology ........................................................................................................................................ 8
Results ................................................................................................................................................... 9
Overview of All Filers ................................................................................................................. 9
Insurance Status of Schedule HC Filers ................................................................................. 10
Full-Year Insured Filers ............................................................................................................ 11
Full-Year Uninsured Filers ....................................................................................................... 12
Part-Year Insured Filers ............................................................................................................ 18
Summary ............................................................................................................................................. 24
About the Authors
Michael Chin is an Assistant Professor at the University of Massachusetts Medical School, Department of Family Medicine & Community Health.
Audrey Gasteier is the Director of Policy at the Massachusetts Health Connector.

Page 3
Figures
Overview of All Filers: Figure 1. Total Number of Tax Filers Insurance Status of Schedule HC Filers: Figure 2. Schedule HC Filers by Insurance Status Full-Year Insured Filers: Figure 3. Type of Insurance Among Full-Year Insured Full-Year Uninsured Filers: Figure 4. Details of Full-Year Uninsured
Figure 5. Full-Year Uninsured by Age Figure 6. Full-Year Uninsured by Age and Affordability Figure 7. Full-Year Uninsured by Gender Figure 8. Full-Year Uninsured by Region and Affordability Figure 9. Full-Year Uninsured by Filing Status
Figure 10. Full-Year Uninsured Individuals by Income Figure 11. Full-Year Uninsured Couples by Income Figure 12. Full-Year Uninsured Families by Income
Part-Year Insured Filers: Figure 13. Details of Part-Year Insured
Figure 14. Part-Year Insured by Age Figure 15. Part-Year Insured by Age and Affordability Figure 16. Full-Year Uninsured and Part-Year Insured by Affordability Figure 17. Part-Year Insured by Gender Figure 18. Part-Year Insured by Region and Affordability Figure 19. Part-Year Insured by Filing Status
Figure 20. Part-Year Insured Individuals by Income Figure 21. Part-Year Insured Couples by Income Figure 22. Part-Year Insured Families by Income

Page 4
Key Findings
This report provides analysis of tax year 2012 data on the health insurance status of adult tax filers in Massachusetts, and is a follow-up to the analyses of tax years 2008, 2009, 2010 and 2011 data published by the Massachusetts Health Connector (Health Connector) and the Department of Revenue (DOR).1
This analysis of 2012 data demonstrates that there was near universal compliance with the requirement to report health insurance information on tax filings, and a continued high rate of insurance coverage among tax filers in the state. Ninety-six percent of tax filers who filed a Schedule HC were insured at some point during 2012, which was not significantly changed from the previous year. The results from 2012 are consistent with other state and federal surveys that suggest a continued high rate of insurance coverage in the state. Changes from 2011: There were no significant changes in the majority of findings in this analysis when compared to those of the previous year. Similar to the reports for tax year 2010 and 2011 data, in this report, when a filer is described as being “uninsured,” it indicates that the filer either had no insurance, or had insurance that did not meet Minimum Creditable Coverage (MCC) standards. Compliance with filing a Schedule HC:
§ Ninety-nine percent of tax filers required to file a Schedule HC for tax year 2012 complied with the filing requirement to report health insurance information. This percent is unchanged from the prior three years (i.e., 2009, 2010 and 2011).
§ The number of individuals who were subject to the individual mandate but did not file a Schedule HC or filed it with incomplete information (5,100) decreased for the fourth consecutive year, and was less than 1% of all tax filers (Figure 1).
Full-year insured filers:
§ Of those adult tax filers who complied with the Schedule HC filing requirement, 92% (4.2 million) reported being insured for all of tax year 2012 (Figure 2).
Full-year uninsured filers:
§ Approximately 4% of filers who complied with the Schedule HC filing requirement (180,000) reported being uninsured for all of tax year 2012 (Figure 2).
§ Of the adults who were uninsured for all of tax year 2012, 64% (110,000) reported that their income was at or below 150% Federal Poverty Level (FPL) and were therefore exempt from the individual mandate penalty. Sixteen percent (27,000) reported that health insurance was not affordable for them, based on their application of the state's affordability schedule. Fourteen percent (25,000) were assessed a penalty because affordable insurance was available to them but not obtained. Two percent (3,100) sought to file an appeal of the penalty.2 Four percent (7,200)
1 The analyses of data for tax years 2008, 2009, 2010 and 2011 are available on-line at:
https://www.mahealthconnector.org/about/policy-center/reports-publications 2 Throughout this report the numbers of people who file an appeal describes only those who file an appeal, and does not
capture the outcomes of the appeal process.
An appeal of the penalty can be made at the time of filing the Schedule HC if an individual could not afford insurance because they experienced a hardship such as being homeless, or incurring a significant, unexpected increase in essential expenses due to domestic violence or the death of a family member. A full list of qualifying hardships is provided in the state’s instructions for completing a Schedule HC, which can be found on the website for the Massachusetts Department of Revenue (the instructions are titled, 2012 Massachusetts Schedule HC Health Care).
Page 5
claimed a religious exemption and less than 1% (280) reported having a Certificate of Exemption (Figure 4).3
Part-year insured filers:
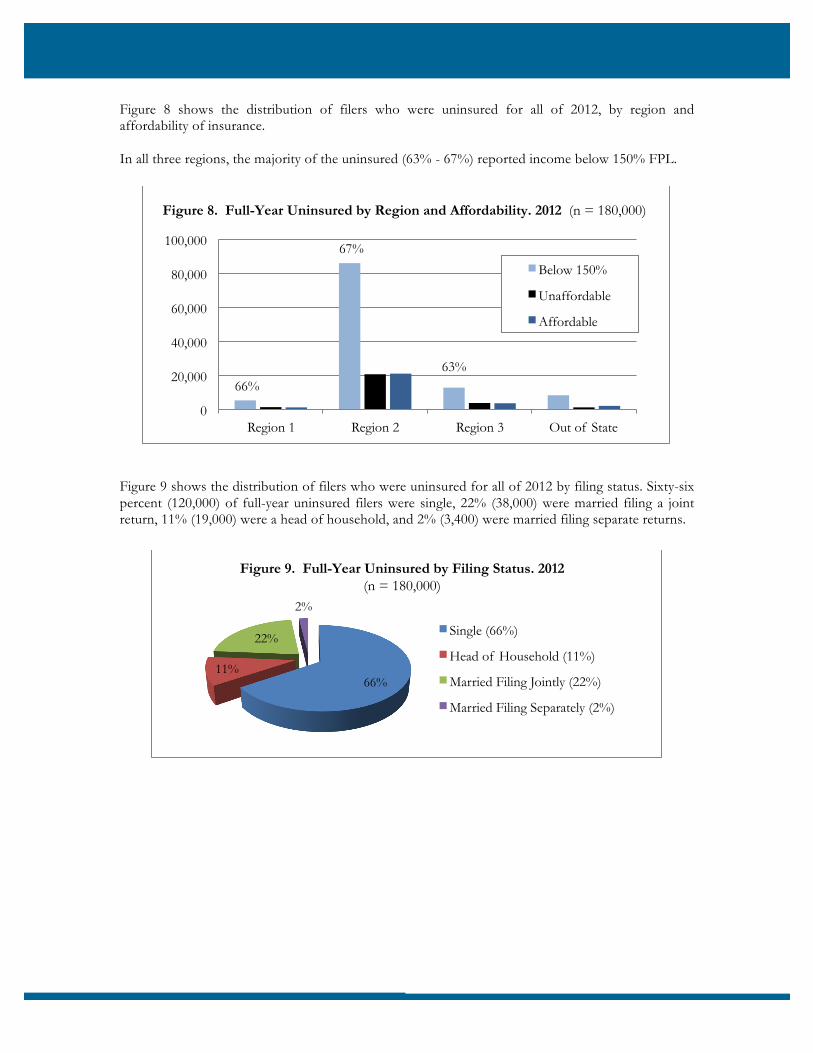
§ Approximately 4% of filers who complied with the Schedule HC filing requirement (160,000) reported being uninsured for part of tax year 2012 (Figure 2). Of these filers with part-year insurance, 28% (46,000) had income at or below 150% FPL and thus were not subject to a penalty. Sixteen percent (25,000) reported that insurance was not affordable, based on their application of the affordability schedule. Forty percent (64,000) had a permissible gap in coverage which lasted three or fewer consecutive months.4 Fourteen percent (22,000) were subject to a penalty since insurance available to them was affordable. Two percent (2,500) sought to file an appeal of the penalty. The remaining filers with part-year insurance (1%) included filers who had a Certificate of Exemption (220) or a religious exemption (1,100) (Figure 13).
Filers who were assessed a penalty: § One percent of filers were assessed a penalty in 2012 (i.e., 25,000 who were uninsured for the full
year and 22,000 with part-year insurance, for a combined total of 47,000 who were assessed a penalty). Although the number of tax filers assessed a penalty was approximately 2,800 greater in 2012 than in the prior year, the percent of filers who were assessed a penalty has remained at 1% since the start of the individual mandate in 2008.
3 A Certificate of Exemption can be obtained prior to filing the Schedule HC if the individual has experienced certain
hardships such as being homeless or other hardships described in state regulations (i.e., the state regulation 956 CMR 6.08, titled, Determining Affordability for the Individual Mandate).
4 The Health Connector’s Administrative Bulletin 03-10: Guidance Regarding M.G.L. c. 111M and M.G.L. c. 176Q as implemented by 956 CMR 6.00 (available online at: https://www.mahealthconnector.org/about/policy-center/rules-regulations) clarifies that for purposes of penalty calculation, taxpayers will not be subject to the penalty if they had lapses in coverage consisting of three or fewer consecutive calendar months.

Page 6
Introduction and Background
In 2006, Massachusetts passed its landmark health reform law. The cornerstone of this law is the concept of shared responsibility whereby government, individuals and employers all assumed new responsibilities in order to expand access to health insurance in the Commonwealth. A key feature of the Massachusetts reform is the requirement that most adult residents who can afford health insurance maintain coverage or pay a penalty. This requirement, which is also referred to as the individual mandate, is enforced by the Massachusetts Department of Revenue (DOR) through the income tax filing process where Massachusetts residents are required to report information about their health insurance coverage on the Schedule HC. For tax year 2007, which was the first year of the mandate, tax filers were required to indicate if they had health insurance as of December 31, 2007. The penalty for noncompliance with the mandate in 2007 was loss of the personal income tax exemption, which was $219. Between 2007 and 2009 there were some changes made to the Schedule HC and the implementation of the individual mandate. These changes have been summarized in prior versions of this annual report. The most significant of these changes include:
• In 2007, the first year of individual mandate, individuals were required to indicate if they had health insurance at the end of the calendar year. In subsequent years, individuals were required to indicate whether they had coverage in each month of the year.
• The penalty amounts have changed over time. In 2007, the first year of the mandate, the
penalty for noncompliance with the mandate was the loss of the personal income tax, which was $219. In the second year of the mandate, the penalty amount was no more than 50% of the lowest-cost health insurance premium available through the Health Connector. Since the Health Connector offers subsidized insurance to low-income individuals which lowers the monthly premium of health insurance, this change resulted in the penalty amount being different based on a person’s income.
• In the 2009, the third year of the individual mandate, the requirement was modified so that
tax filers were required to report if they had health insurance that met MCC standards. Prior to 2009, residents were only required to report if they had any health insurance for each month regardless of whether or not it met MCC standards. As a result of this change, beginning in 2009 and including this report for 2012, when a filer is described as being “uninsured” this indicates that the filer either had no insurance, or had insurance that did not meet MCC standards.
Between 2010 and 2012, there were no significant changes to the individual mandate requirements, or to the Schedule HC. Table 1 shows the penalties for failing to comply with the individual mandate from 2007 to 2012. Over this time, the same exemptions to the mandate have been available for individuals with income below 150% FPL, religious exemptions and those receiving a Certificate of Exemption. The FPL guidelines had minor adjustments made between 2011 and 2012, and adjustments were made to the state’s 2012 affordability schedule.5
5 For more details about the 2012 affordability schedule, see Section 6.2 (regarding the “Individual Mandate and the
Affordability Schedule”) of the Health Connector’s annual Report to the Massachusetts Legislature for Fiscal Year 2012.

Page 7
2012 was the first year in which data was available for tracking the insurance status of tax filers over consecutive years. Future analyses using this new data may provide information such as the percent of tax filers who gained insurance coverage in 2012 after being uninsured in 2011.
Table 1. Penalty Schedule for Failure to Comply with the Individual Mandate. 2007 - 2012
2007 2008 2009 2010 2011 2012
per
year* per
month per
month per
month per
month per
month
150.1 - 200% FPL $219 $17.50 $17 $19 $19 $19
200.1 - 250% FPL $219 $35.00 $35 $38 $38 $38
250.1 - 300% FPL $219 $52.50 $52 $58 $58 $58
Above 300% FPL, Age 18-26 $219 $56.00 $52 $66 $72 $83
Above 300% FPL, Age 27+ $219 $76.00 $89 $93 $101 $105
* For tax year 2007, the penalty for not having insurance as of December 31, 2007 was $219.
Previous reports have analyzed tax data for 2007, 2008, 2009, 2010, and 2011.6, 7 This report analyzes the data on the individual mandate for tax year 2012.
6 Massachusetts Department of Revenue, Data on the Individual Mandate and Uninsured Tax Filers: Tax Year 2007, October
2008. Available on-line at: http://www.mass.gov/dor/docs/dor/news/pressreleases/2008/2007-demographic-data-report-final-2.pdf
7 The analyses of data for tax years 2008, 2009, 2010 and 2011 are available on-line at:
https://www.mahealthconnector.org/about/policy-center/reports-publications

Page 8
Methodology
This analysis was compiled by the Health Connector using data provided by DOR, under a Memorandum of Understanding between the agencies. The methodology used in this analysis was similar to the methodology used for the preceding year.8 This report presents analyses of tax returns filed and processed by DOR as of April 2014. As of this date, there were approximately 3.7 million returns, representing 4.9 million tax filers.9 Based on the experience from prior years of tax filings, the returns processed as of April 2014 represented approximately 99% of all expected tax year 2012 returns. Similar to previous years, this analysis relies primarily on information as self-reported by tax filers. This information is subject to tax filer reporting errors and inconsistencies, as well as post-filing verification, enforcement and audit efforts by DOR. The analysis in this report focuses on adult tax filers aged 19 and over, and thus does not reflect the health insurance status of children, individuals who are not required to file a tax return, or individuals who did not file a return despite being required to do so.10 While the mandate applies to adult tax filers (age 18 and over), for purposes of simplicity this report excludes individuals who turned 18 during the tax year.11 Numbers in this report are rounded. Percentages, where provided, may not add to 100% due to rounding.
8 The analysis of the Schedule HC data for tax years 2008 to 2012 was performed using SAS® statistical software. 9 There may be one or two tax filers per tax return. 10 A Massachusetts full-year and/or part-year resident is generally required to file a tax return with the state of
Massachusetts if his/her Massachusetts gross income is in excess of $8,000. A Massachusetts nonresident is required to file a Massachusetts nonresident tax return if his/her Massachusetts source income exceeds the smaller of $8,000 or the prorated personal exemption. http://www.mass.gov/dor/individuals/filing-and-payment-information/personal-income-tax-faqs/personal-income-tax-faqs.html#1
11 Individuals who turned 18 during the tax year became subject to the mandate on the first day of the month following
their birthday.

Page 9
Results
Overview of All Filers Figure 1 shows the total number of tax filers for tax year 2012 (4.9 million) and the percent that filed a Schedule HC. Tax filers subject to the individual mandate are required to file a Schedule HC with their income tax return in order to document their compliance with the individual mandate. Of the 4.9 million filers, 88% (4.3 million) filed a Schedule HC. Approximately 12% (600,000) were not required to file, which includes non-residents, certain part-year residents, and individuals under age 18. Similar to the prior two years, among the filers who were required to file a Schedule HC, 99% of these filers complied with the filing requirement.12 Less than 1% (5,100) were subject to the mandate but did not file a Schedule HC or filed it with incomplete information.13 This is the fourth consecutive year that the number of filers who did not file a Schedule HC or filed it with incomplete information decreased (i.e., from 25,000 in 2009, down to 5,100 in 2012).
The subsequent analyses presented in this report include information for only those tax filers who submitted a completed Schedule HC, and who were age 19 and older.
12 Among those who are not required to file a Schedule HC includes part-year residents if they were residents of
Massachusetts for less than three full months. 13 DOR corresponds with tax filers who either did not file a Schedule HC or filed it with insufficient information to
determine the applicability of the individual mandate.
88%
12%
<1%
Filed a Schedule HC (88%)
Not required to file a Schedule HC (12%)
Did not file a Schedule HC, or filed an incomplete Schedule HC (<1%)
Figure 1. Total Number of Tax Filers. 2012 (n = 4.9 million)

Page 10
Insurance Status of Schedule HC Filers In filing the 2012 tax return, individuals were required to indicate on the Schedule HC whether they were enrolled in an MCC-compliant plan for all, part, or none of 2012. Individuals who reported having federal government insurance were considered to have full-year insurance.14 Ninety-two percent (3.9 million) of the 4.2 million adult filers who submitted a complete Schedule HC reported having MCC-compliant health insurance for the full tax year (Figure 2).15 Four percent (160,000) of these filers reported being insured for part of the year, and 4% (180,000) reported being uninsured for the full year.16 As described later in this report, 40% of the filers who were insured for part of the year reported a permissible gap in coverage for three or fewer months (Figure 13). When the part-year insured filers are combined with filers with full-year insurance, a total of 96% of filers reported having insurance at some point during the year, which was not significantly changed from the previous year. These findings corroborate state and federal survey data, which have found that insurance rates in Massachusetts have remained high since the 2006 Massachusetts health reform law was enacted, and that from 2011 to 2012 there was no clear evidence of a significant change in the rates of health insurance coverage among Massachusetts residents.17
14 Federal government insurance includes Medicare, the Veterans Administration Program, Tricare or other government
health coverage, as indicated in Question 4 on the 2012 Schedule HC. MassHealth, Commonwealth Care and Commonwealth Care Bridge were not considered to be federal government insurance.
15 The full-year insured category includes 63,000 part-year residents who met the requirements of the mandate for the entire
period that the mandate applied to them. 16 The part-year insured category includes 27,000 part-year residents who indicated insurance for some but not all of the
period for which the mandate applied to them. 17 The Massachusetts Health Insurance Survey (MHIS) found that the rate of insurance coverage for adults age 19 to 64
was 96.5% in 2009, 97.1% in 2010, and 95.9% in 2011. The MHIS was not conducted in 2012. For more details see the full reports: http://chiamass.gov/insurance-surveys/
The federal Current Population Survey (CPS) estimated that the insurance rate among all Massachusetts residents was 95.7% in 2009, 94.5% in 2010, 96.6% in 2011, and 95.5% in 2012. For more details, see: Health Insurance Historical Table (HIB -4).
For a discussion regarding why insurance rates vary among different surveys, see the 2008 report from DHCFP: Estimates of the Uninsurance Rate in Massachusetts from Survey Data: Why Are They So Different? Available online at: http://archives.lib.state.ma.us/bitstream/handle/2452/36512/ocn244302544.pdf?sequence=1
92%
4% 4%
Full-year (92%)
Part-year (4%)
Uninsured (4%)
Figure 2. Schedule HC Filers by Insurance Status. 2012 (n = 4.2 million)

Page 11
Full-Year Insured Filers Among those who reported having full-year insurance coverage on their Schedule HC, private insurance was the most common source of health insurance coverage (Figure 3). Seventy-one percent (2.7 million) of adult filers with full-year coverage reported having private insurance. An additional 25% (970,000) reported having government insurance.18 The remaining 4% (170,000) of filers with full-year health insurance coverage reported having both private and government insurance. This could be either concurrent or consecutive coverage. The percent of full-year tax filers reporting government insurance increased by 1% (from 24% in 2011, up to 25% in 2012). This increase is consistent with the growth in enrollment of both the MassHealth and Commonwealth Care programs from 2011 to 2012.19
18 Government insurance includes federal government insurance (such as Medicare, the Veterans Administration Program,
and Tricare) as well as MassHealth and Commonwealth Care. 19 Total enrollment for the Commonwealth Care program are available on the Health Connector's Monthly Summary Reports
that are available online at: https://www.mahealthconnector.org/about/leadership/board-meetings.
Total enrollment trends for MassHealth are available in the Massachusetts Medicaid Policy Institute's report MassHealth: The Basics (updated April 2014) which is available on-line at: http://bluecrossmafoundation.org/publication/updated-masshealth-basics-facts-trends-and-national-context Total enrollment for the MassHealth program is also available on-line at: http://kff.org/medicaid/state-indicator/monthly-medicaid-enrollment-in-thousands/#graph which reports data compiled by Health Management Associates (HMA) from state Medicaid enrollment reports for the Kaiser Commission on Medicaid and the Uninsured (KCMU).
71%
25%
4%
Private (71%)
Government (25%)
Both (4%)
Figure 3. Type of Insurance Among Full-Year Insured. 2012 (n = 3.9 million)

Page 12
Full-Year Uninsured Filers Approximately 4% (180,000) of adult filers indicated on their Schedule HC that they were uninsured for all of 2012, as mentioned previously in Figure 2. Figure 4 shows details of Schedule HC filers who reported being uninsured for all of 2012. Sixty-four percent (110,000) of full-year uninsured adult filers reported that their income was at or below 150% FPL. These individuals are exempt from the individual mandate penalty. Sixteen percent (27,000) reported that health insurance was not affordable for them, based on their application of the state's affordability schedule. Fourteen percent (25,000) were assessed a penalty because affordable insurance was available to them. Two percent (3,100) sought to file an appeal of the penalty. Four percent (7,200) claimed a religious exemption, and less than 1% (280) reported having a Certificate of Exemption. 2012 was the second consecutive year in which there was a significant decrease in the number of appeals of the penalty. In 2011 there was a 13% decrease in the number of appeals from the prior year (i.e., from 4,400 in 2010, down to 3,900 in 2011), and in 2012 there was a 20% decrease (i.e., from 3,900 in 2011, down to 3,100 in 2012).
64% 16%
2% 14% 4% Below 150% FPL* (64%)
Unaffordable* (16%)
Affordable, appeal of penatly was requested (2%) Affordable, penalty was assessed (14%)
Figure 4. Details of Full-Year Uninsured. 2012 (n = 180,000)
* Individuals are exempt from the individual mandate penalty if they have income below 150% of FPL, do not have health insurance available to them that is affordable based on the state's affordability schedule, or have a religious exemption.

Page 13
Figure 5 shows the distribution of adult Schedule HC filers who were uninsured for all of 2012 by age category. This figure also includes 7% of filers whose age could was not known.20 Consistent with findings from other state and federal surveys, and consistent with analyses of Schedule HC filings from prior years, young adults are over-represented among uninsured adults in Massachusetts. Adults aged 19 to 26 represented 15% of all adult residents in Massachusetts aged 19 or over based on 2010 population estimates from the U.S. Census Bureau. However, they comprised 33% to 34% of full-year uninsured Schedule HC filers in 2009, 2010, 2011 and 2012.
20 These filers with “unknown” age are only included in figures which show age distribution (i.e., Figures 5, 6, 17, 18). The
remaining analyses in this report are limited to filers with a known age that is greater than or equal to 19.
In Figure 5, the total number of full-year uninsured filers is 190,000. This differs from the total of 180,000 that is shown in Figure 4, 6 and 7 because these figures do not include the individuals with an unknown age.
33%
27% 14%
15%
5% 7% 19-26 years old (33%)
27-39 years old (27%)
40-49 years old (14%)
50-64 years old (15%)
65 and above (5%)
Unknown age (7%)
Figure 5. Full-Year Uninsured by Age. 2012 (n = 190,000)

Page 14
Figure 6 shows the age distribution of Schedule HC filers who were uninsured for the full year by affordability. The “Affordable” category includes those who reported that they were able to afford insurance and were assessed a penalty, as well as those who reported that they were able to afford insurance but wished to appeal the penalty. The “Below 150% FPL” category includes filers who are exempt from penalty because their income is below 150% FPL. The “Unaffordable” category includes filers who reported being unable to afford coverage based on their application of the state's affordability schedule. Filers who claimed a religious exemption or a Certificate of Exemption were not included in this analysis because they were not asked to provide information about whether affordable insurance was available to them. In 2012, as was the case in previous years, among the filers who were uninsured for the full year, the majority had incomes below 150%. This is true for all age groups, as shown in Figure 6.
Figure 7 shows information on the gender of full-year uninsured adult Schedule HC filers. Gender information was available for 68% of filers who were full-year uninsured. As in previous years, the percent of full-year uninsured filers who were male (43%) was significantly greater than those who were female (25%). Among full-year uninsured filers for whom gender information is known, 64% were male.
0
10,000
20,000
30,000
40,000
50,000
19-26 27-39 40-49 50-64 Over 65 Unknown
Below 150%
Unaffordable
Affordable
Figure 6. Full-Year Uninsured by Age and Affordability. 2012 (n = 180,000)
25%
43%
32% Female (25%)
Male (43%)
Unknown (32%)
Figure 7. Full-Year Uninsured by Gender. 2012 (n = 180,000)

Page 15
Table 2 shows the distribution of full-year uninsured filers by region. The regions are defined based on the county groupings used for the Schedule HC worksheets, and each region is composed of counties which have approximately similar insurance costs. The Schedule HC worksheets list the lowest monthly premiums that are available in each of three geographic regions.21 The last column of Table 2 presents the number of uninsured adult Schedule HC filers in each region as a percentage of the region’s total adult population. Similar to the prior years of 2008 to 2011, in 2012 the percent of the population that was uninsured for the full year varied less than one percent among the three regions (i.e., 2.8% to 3.6%).
Table 2. Full-Year Uninsured by Region. 2012
Number of Full-Year
Uninsured Adult Schedule HC Filers
2012 Adult Population by
Region*
Full-Year Uninsured Filers
as a % of the Adult Population22
Region 1: Berkshire, Franklin, and Hampshire Counties 8,400 298,405 2.8%
Region 2: Bristol, Essex, Hampden, Middlesex, Norfolk, Suffolk, and Worcester Counties
130,000 4,360,683 3.0%
Region 3: Barnstable, Dukes, Nantucket, and Plymouth Counties 21,000 585,641 3.6%
Out of State 12,000 N/A N/A
* The data in this column comes from the 2012 U.S. Census Bureau estimates.
21 The 2012 Schedule HC worksheets are available on-line at: http://www.mass.gov/dor/docs/dor/health-care/2012/hc-
instr.pdf 22 The percentages in Table 2 should not be interpreted as the exact uninsured rate for several reasons: first, the number of
uninsured filers in each region includes only those who filed a Schedule HC, and thus excludes people who are not required to file. Second, there is a slight discrepancy in the age cut-offs used (i.e., the Schedule HC data includes those ages 19 and over, whereas the Census data includes those ages 18 and over). Third, as mentioned in the methodology section of this report, filers that are categorized as uninsured could have had insurance that did not meet MCC standards.
Page 16
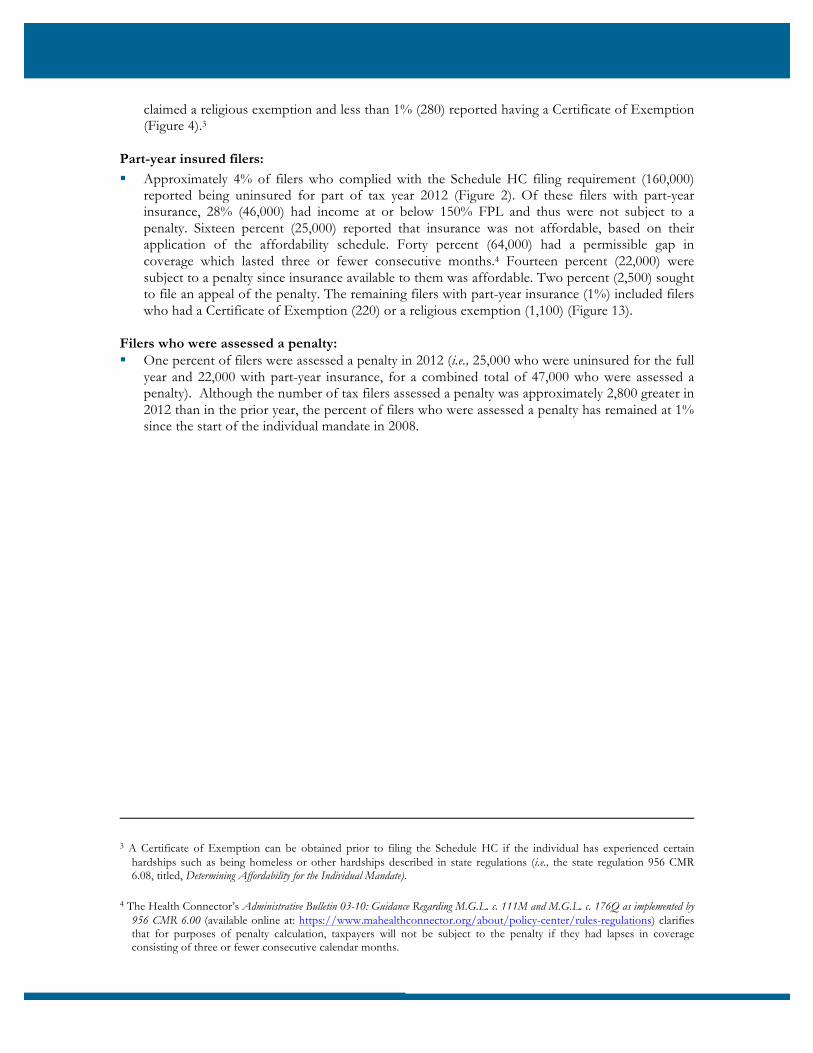
Figure 8 shows the distribution of filers who were uninsured for all of 2012, by region and affordability of insurance. In all three regions, the majority of the uninsured (63% - 67%) reported income below 150% FPL.
Figure 9 shows the distribution of filers who were uninsured for all of 2012 by filing status. Sixty-six percent (120,000) of full-year uninsured filers were single, 22% (38,000) were married filing a joint return, 11% (19,000) were a head of household, and 2% (3,400) were married filing separate returns.
66%
67%
63% 8,371
0
20,000
40,000
60,000
80,000
100,000
Region 1 Region 2 Region 3 Out of State
Below 150%
Unaffordable
Affordable
Figure 8. Full-Year Uninsured by Region and Affordability. 2012 (n = 180,000)
66% 11%
22%
2%
Single (66%)
Head of Household (11%)
Married Filing Jointly (22%)
Married Filing Separately (2%)
Figure 9. Full-Year Uninsured by Filing Status. 2012 (n = 180,000)

Page 17
To analyze the distribution of full-year uninsured adult Schedule HC filers by income, filers were categorized into one of three categories based on filing status and family size: individuals, couples, or families.
Figures 10, 11 and 12 show the distribution of full-year uninsured individuals, couples, and families by income.23 Among adult Schedule HC filers uninsured for the full year, 58% (110,000) were categorized as individuals, 24% (46,000) as couples, and 14% (26,000) as families. In all three of these categories, the majority of uninsured filers (i.e., 53% to 72%) were in the lowest income category. There were an additional 4% (7,600) of filers who could not be categorized as individuals, couples, or families on the basis of the information provided on the Schedule HC.24
23 In Figures 10, 11 and 12, the lowest income bracket represents 0-150% FPL, and the subsequent income brackets
represent increments of approximately 50% FPL. Therefore the second income bracket represents 151-200% FPL, and the third income bracket represents 201-250% FPL.
24 Filers who could not be categorized as individuals, couples or families included filers who reported a family size of zero.
0
20,000
40,000
60,000
80,000
$0 to
$16,764
$16,765 to
$22,344
$22,345 to
$27,936
$27,937 to
$33,516
$33,517 to
$40,195
$40,196 to
$45,554
$45,555 to
$56,273
$56,274 and
above
Figure 10. Full-Year Uninsured Individuals by Income. 2012 (n =111,000)
0
10,000
20,000
30,000
$0 to
$22,704
$22,705 to
$30,264
$30,265 to
$37,836
$37,837 to
$45,396
$45,397 to
$56,656
$56,657 to
$67,448
$67,449 to
$89,032
$89,033 and
above
Figure 11. Full-Year Uninsured Couples by Income. 2012 (n = 46,000)
0
5,000
10,000
15,000
$0 to
$28,644
$28,645 to
$38,184
$38,185 to
$47,736
$47,737 to
$57,276
$57,277 to
$75,899
$75,900 to
$97,584
$97,585 to
$119,270
$119,271 and
above
Figure 12. Full-Year Uninsured Families by Income. 2012 (n = 26,000)
Page 18
Part-Year Insured Filers Approximately 4% of Schedule HC filers (160,000) reported having insurance for only part of tax year 2012, as previously mentioned in Figure 2. Figure 13 shows details of Schedule HC filers who reported having part-year insurance. Forty percent (64,000) had a permissible gap in coverage which lasted three or fewer consecutive months, and were not subject to a penalty.25 Twenty-eight percent (46,000) of filers with part-year insurance reported that their income was at or below 150% FPL and thus were not subject to a penalty. Sixteen percent (25,000) reported that insurance was not affordable, based on their application of the affordability schedule. Fourteen percent (22,000) were subject to a penalty since insurance was affordable, and 2% (2,500) sought to file an appeal of the penalty. The remaining filers with part-year insurance (1%) included filers who had a Certificate of Exemption (220) or a religions exemption (1,100). In tax year 2012, the percentage of filers reporting a permissible gap in coverage for three or fewer months) decreased by three percent (i.e., from 43% in 2011, down to 40% in 2012). The percentage of part-year insured tax filers who reported that insurance was not affordable increased by two percent (i.e., from 14% in 2011, up to 16% in 2012). In 2012, 1% (47,000) of tax filers were assessed a penalty for not having health insurance. This 47,000 total consisted of 22,000 with part-year insurance and 25,000 who were uninsured for the full year. Although the number of tax filers assessed a penalty was approximately 2,800 greater in 2012 than in the prior year, the percent of filers who were assessed a penalty has remained at 1% since the start of the individual mandate in 2008.
25 The Health Connector’s Administrative Bulletin 03-10 (which is available on-line at:
https://www.mahealthconnector.org/about/policy-center/rules-regulations) clarifies that for purposes of penalty calculation, taxpayers will not be subject to the penalty if they had lapses in coverage consisting of three or fewer consecutive calendar months.
28%
15%
2%
14%
40%
1% Below 150% FPL* (28%)
Unaffordable* (16%)
Affordable, appeal of penalty was requested (2%)
Affordable, penalty was assessed (14%)
Permissible gap in coverage* (40%)
Other* (1%)
Figure 13. Details of Part-Year Insured. 2012 (n = 160,000)
* Individuals are exempt from the individual mandate penalty if they have income below 150% of FPL, do not have health insurance available to them that is affordable based on the state's affordability schedule, have a permissible gap in coverage lasting three or fewer consecutive months, have a Certificate of Exemption, or have a religious exemption.

Page 19
The age distribution of filers with insurance for part of tax year 2012 is shown in Figure 14. Filers between ages 19-26 and 27-39 were the largest categories of those with part-year insurance (24% and 40%, respectively). Similar to the full-year uninsured population described previously in Figure 5, these young adults are also over-represented among part-year insured adults in Massachusetts. In 2012, the percent of the part-year insured filers who were age 19-26 years old decreased by two percent (i.e., from 26% in 2011, down to 24% in 2012), and the percent who were 27-37 years old increased by approximately 2% (i.e., from 38% in 2011, up to 40% in 2012).
Figure 15 shows the age distribution of part-year insured tax filers by affordability.
The “affordable” category includes those who reported that they were able to afford insurance and were assessed a penalty, as well as those who reported that they were able to afford insurance but wished to appeal the penalty. The “below 150% FPL” category includes those tax filers who reported an income below 150% FPL. The “unaffordable” category includes tax filers who reported that insurance was not affordable to them, based on the state's affordability schedule. Filers with a Certificate of Exemption or a religious exemption are excluded from Figure 15. In addition, a significant number of filers (64,000) had a permissible gap in coverage, so were not asked to provide information about whether affordable insurance was available to them.
24%
40%
17%
18%
1% 0%
19-26 years old (24%)
27-39 years old (40%)
40-49 years old (17%)
50-64 years old (18%)
65 and above (1%)
Unknown age (0%)
Figure 14. Part-Year Insured by Age. 2012 (n = 160,000)
0
5,000
10,000
15,000
20,000
Unknown 19-26 27-39 40-49 50-64 Over 65
Below 150% FPL Unaffordable Affordable
Figure 15. Part-Year Insured by Age and Affordability. 2012 (n = 94,000)

Page 20
Figure 16 shows that when compared to filers who were uninsured for the full year, a higher percentage of filers who were uninsured for part of tax year 2012 reported being able to afford coverage (i.e., 26% of filers with part-year insurance, compared with 16% of filers who were uninsured for all of 2012).
Figure 17 shows the distribution of part-year insured Schedule HC filers by gender. Gender information was available for 79% of filers who were part-year insured. Similar to the full-year uninsured filers described in Figure 7, the percent of part-year insured filers who were male (42%) was significantly greater than those who were female (37%). Among part-year insured filers for whom gender information is known, 53% were male.
37%
42%
21%
Figure 17. Part-Year Insured by Gender. 2012 (n= 160,000) *
Female (37%)
Male (42%)
Unknown (21%)
* The total number of part-year insured in Figures 15 and 18 (n = 94,000 and 96,000, respectively) is different than the total in Figures 17 and 19 (n = 160,000) because those with a permissible gap in coverage are excluded from Figures 15 and 18.
16%
84%
Able to afford coverage
Unable to afford coverage
Figure 18b. Full-Year Uninsured and Part-Year Insured by Affordability. 2012
Full-Year Uninsured (n = 180,000)
26%
74%
Part-Year Insured (n = 94,000)
Page 21
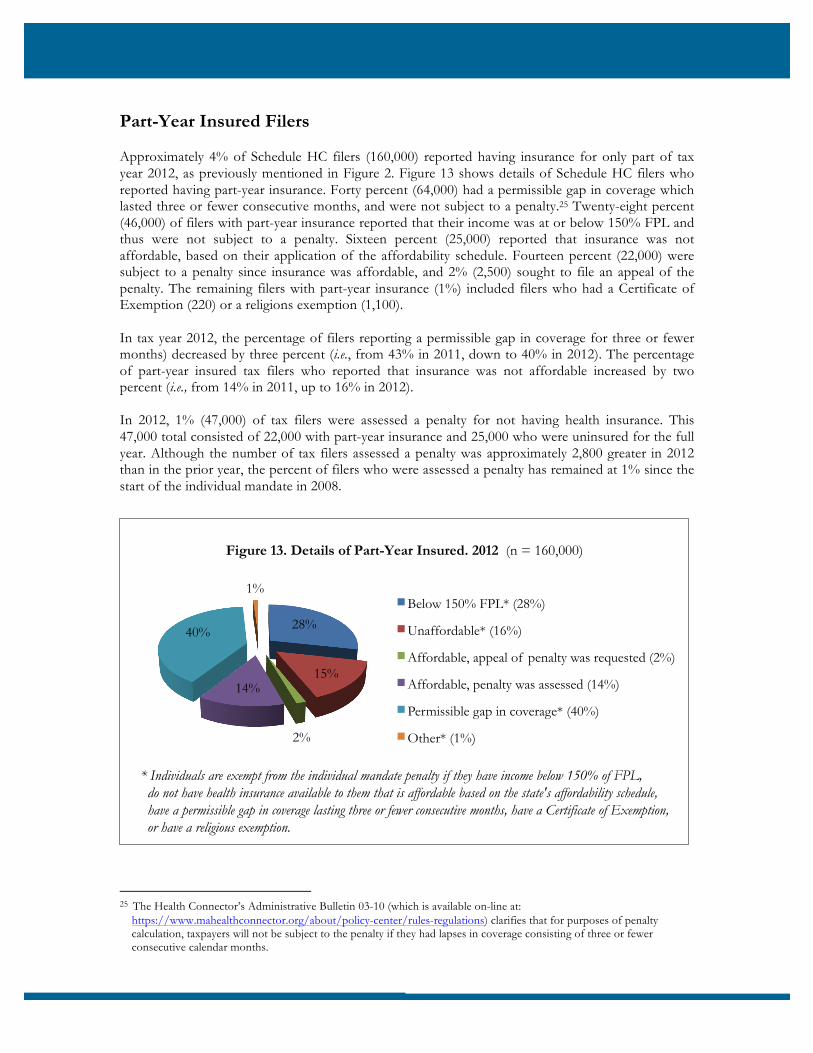
Table 3 shows the regional distribution of filers reporting part-year insurance, compared with the total adult population (age 18 and over) in each region, based on 2012 Census Bureau estimates. The percent of the population that was part-year insured varied less than half of one percent among the three regions (i.e., 2.8% to 3.0%).
Table 3. Part-Year Insured by Region. 2012
Number of Part-Year
Uninsured Adult Schedule HC Filers
2012 Adult Population by
Region*
Part-Year Uninsured Filers as
a % of the Adult Population
Region 1: Berkshire, Franklin, and Hampshire Counties
9,000 298,405 3.0%
Region 2: Bristol, Essex, Hampden, Middlesex, Norfolk, Suffolk, and Worcester Counties
120,000 4,360,683 2.8%
Region 3: Barnstable, Dukes, Nantucket, and Plymouth Counties
17,000 585,641 2.9%
Out of State 15,000 N/A N/A
* The data in this column comes from the 2012 U.S. Census Bureau estimates.
Figure 18 shows the distribution of part-year insured filers by region and affordability. As previously described, the “affordable” category includes those who reported that they were able to afford insurance and were assessed a penalty, as well as those who reported that they were able to afford insurance but wished to appeal the penalty. The “below 150% FPL” category includes those tax filers who reported an income below 150% FPL. The “unaffordable” category includes filers who reported that insurance was not affordable to them. Filers with a Certificate of Exemption, or religious exemption were less than 1% of the total, and therefore were not included in the figures below. A significant number of filers (64,000) had a permissible gap in coverage so could not be classified into the “affordable” and “unaffordable” categories.
0
10,000
20,000
30,000
40,000
Region 1 Region 2 Region 3 Out of State
Below 150% FPL
Unaffordable
Affordable
Figure 18. Part-Year Insured by Region and Affordability. 2012
(n = 96,000)

Page 22
Figure 19 shows the distribution of part-year insured Schedule HC filers by filing status. The majority (56%) of filers who were insured for part of 2012 filed as single, which is also observed among full-year uninsured filers (i.e., 66% of filers who were uninsured for the full year filed as single, as shown in Figure 9).
56% 9%
32%
2%
Single (56%)
Head of Household (9%)
Married Filing Jointly (32%)
Married Filing Separately (2%)
Figure 19. Part-Year Insured by Filing Status. 2012 (n = 160,000)

Page 23
Figures 20, 21 and 22 show the part-year insured Schedule HC filers by income category. As with full-year uninsured filers (shown in Figures 10, 11 and 12), filers with part-year insurance were categorized as individuals, couples or families, based on filing status and family size. Among adult Schedule HC filers with part-year insurance, 55% (89,000) were categorized as individuals, 21% (34,000) as couples and 21% (34,000) as families. An additional 3% (5,000) of filers with part-year insurance could not be categorized on the basis of the information provided.
0
10,000
20,000
30,000
$0 to
$16,764
$16,765 to
$22,344
$22,345 to
$27,936
$27,937 to
$33,516
$33,517 to
$40,195
$40,196 to
$45,554
$45,555 to
$56,273
$56,274 and
above
Figure 20. Part-Year Insured Individuals by Income. 2012 (n= 89,000)
0
2,000
4,000
6,000
8,000
$0 to
$22,704
$22,705 to
$30,264
$30,265 to
$37,836
$37,837 to
$45,396
$45,397 to
$56,656
$56,657 to
$67,448
$67,449 to
$89,032
$89,033 and
above
Figure 21. Part-Year Insured Couples by Income. 2012 (n = 34,000)
0
2,000
4,000
6,000
8,000
$0 to
$28,644
$28,645 to
$38,184
$38,185 to
$47,736
$47,737 to
$57,276
$57,277 to
$75,899
$75,900 to
$97,584
$97,585 to
$119,270
$119,271 and
above
Figure 22. Part-Year Insured Families by Income. 2012 (n=34,000)

Page 24
Summary
This analysis demonstrates that there continues to be high levels of compliance with the Massachusetts health insurance individual mandate. For the fourth consecutive year, there continued to be high rates of insurance coverage; 92% of adults who filed a Schedule HC reported being insured with MCC-compliant coverage for all of 2012. When the additional 4% of adults with part-year insurance are considered, a total of 96% of adults who filed a Schedule HC were insured at some point during the year. These findings corroborate other state and federal data which include Massachusetts results who do not file state taxes. Both the analysis described in this report and other state and federal data have found that insurance rates in Massachusetts have remained high since the 2006 Massachusetts health reform law was enacted, and that from 2011 to 2012 there was no clear evidence of a significant change in the rates of health insurance coverage among Massachusetts residents. This analysis further demonstrates continued strong compliance with health insurance reporting requirements and that, similar to the prior three years, 99% of tax filers who were required to file a Schedule HC complied with the reporting requirement. In addition, the percent of individuals who did not file a Schedule HC or filed it with incomplete information decreased for the fourth consecutive year, and was less than 1% of all tax filers. One percent of tax filers were assessed a penalty for not having health insurance, which has remained consistent since the start of the individual mandate in 2008. Data for uninsured tax filers is consistent with other reports and research findings that suggest that the uninsured in Massachusetts are disproportionately low-income, young adults, male, and single. The Commonwealth and its partners across the health care system continue to work to better understand barriers to coverage that may exist for the remaining uninsured and to help residents overcome those barriers and join the population that has health insurance coverage.
Page 25
Board of Directors
Michael Chernew, Leonard D. Schaeffer Chair of Health Care Policy, Harvard Medical School
Mark Gaunya, Principal, Borislow Insurance
Daniel Judson, Commissioner, Division of Insurance
Kristen Lepore, Secretary, Executive Office for Administration and Finance
Louis Malzone, President, Massachusetts Coalition of Taft-Hartley Funds
Dolores Mitchell, Executive Director, Massachusetts Group Insurance Commission
Dimitry Petion, President and Chief Executive Officer, Mulberry Systems, Inc.
Marylou Sudders, Secretary, Executive Office of Health and Human Services
Nancy Turnbull, Associate Dean for Educational Programs, Harvard School of Public Health
Rina Vertes, President, Marjos Business Consulting, LLC
Celia Wcislo, Assistance Division Director, 1199 SEIU United Health Care Workers East
Produced by the Commonwealth Health Insurance Connector Authority
Louis Gutierrez, Executive Director
Audrey Gasteier, Director of Policy
Michael Chin, Assistant Professor at the University of Massachusetts Medical School, Department
of Family Medicine & Community Health