mass spectrometry-based proteomics using q … · more than 2,500 proteins can be identified in...
TRANSCRIPT

Q Exactive, a benchtop quadrupole Orbitrap mass spectrometer
[1]
Mass spectrometry-based proteomics using
Q Exactive, a high-performance benchtop
quadrupole Orbitrap mass spectrometer
Annette Michalski§, Eugen Damoc‡, Jan-Peter Hauschild‡, Oliver Lange‡, Andreas Wieghaus
‡, Alexander
Makarov‡, Nagarjuna Nagaraj§, Juergen Cox§, Matthias Mann§*, Stevan Horning‡**
§Department of Proteomics and Signal Transduction, Max-Planck Institute for Biochemistry, Am
Klopferspitz 18, D-82152 Martinsried, Germany
‡Thermo Fisher Scientific (Bremen) GmbH, Hanna-Kunath-Strasse 11, 28199 Bremen, Germany
*To whom correspondence may be addressed. E-mail: [email protected]
**To whom correspondence may be addressed. E-mail: [email protected]
Running title: Q Exactive, a benchtop quadrupole Orbitrap mass analyzer
Abbreviations: AIF, All Ion Fragmentation; CID, Collision Induced Dissociation; ETD, Electron Transfer
Dissociation; FDR, False Discovery Rate; FT Fourier Transform; HCD, Higher Energy Collisional
Dissociation; HPLC, High Performance Liquid Chromatography; IPI, International Protein Index; LTQ,
Linear Trap Quadrupole; MS/MS, Tandem mass spectrometry; pAGC predictive Automatic Gain
Control; RF Radio Frequency; SIM Selected Ion Monitoring; TOF Time Of Flight
MCP Papers in Press. Published on June 3, 2011 as Manuscript M111.011015
Copyright 2011 by The American Society for Biochemistry and Molecular Biology, Inc.

Q Exactive, a benchtop quadrupole Orbitrap mass spectrometer
[2]
Summary
Mass spectrometry-based proteomics has greatly benefitted from enormous advances in high
resolution instrumentation in recent years. In particular, the combination of a linear ion trap
with the Orbitrap analyzer has proven to be a popular instrument configuration.
Complementing this hybrid trap-trap instrument, as well as the standalone Orbitrap analyzer
termed Exactive, we here present coupling of a quadrupole mass filter to an Orbitrap
analyzer. This ‘Q Exactive’ instrument features high ion currents due to an S-lens, and fast
HCD peptide fragmentation due to parallel filling and detection modes. The image current
from the detector is processed by an ‘enhanced Fourier Transformation’ (eFT) algorithm,
doubling mass spectrometric resolution. Together with almost instantaneous isolation and
fragmentation, the instrument achieves overall cycle times of 1 s for a top10 HCD method.
More than 2,500 proteins can be identified in standard 90 min gradients of tryptic digests of
mammalian cell lysates – a significant improvement over previous Orbitrap mass
spectrometers. Furthermore, the quadrupole Orbitrap analyzer combination enables
multiplexed operation at the MS and MS/MS levels. This is demonstrated in a multiplexed
single ion monitoring mode, in which the quadrupole rapidly switches between different
narrow mass ranges that are analyzed in a single composite MS spectrum. Similarly, the
quadrupole allows fragmentation of different precursor masses in rapid succession, followed
by joint analysis of the HCD fragment ions in the Orbitrap analyzer. High performance in a
robust benchtop format together with the ability to perform complex multiplexed scan
modes make the Q Exactive an exciting new instrument for the proteomics and general
analytical communities.
Q Exactive, a benchtop quadrupole Orbitrap mass spectrometer
[3]
Mass spectrometry-based proteomics often involve the analysis of complex mixtures of proteins derived
from cell or tissue lysates or from body fluids, posing tremendous analytical challenges (1–3). After
proteolytic digestion, the resulting peptide mixtures are separated by liquid chromatography and online
electrosprayed for mass spectrometric (MS) and tandem mass spectrometric (MS/MS) analysis. Since
tens of thousands of peptides elute over a relatively short time and with ion signals different by many
orders of magnitude (4, 5), mass spectrometers have been pushed to even higher sensitivity, sequencing
speed and resolution (6, 7). In current shotgun proteomics there are mainly four mass spectrometric
separation principles: quadrupole mass filters, time of flight (TOF) mass analyzers, linear ion traps and
Orbitrap™ analyzers. These are typically combined in hybrid configurations. Quadrupole TOF
instruments use a quadrupole mass filter to either transmit the entire mass range produced by the ion
source (for analysis of all ions in MS mode) or to transmit only a defined mass window around a
precursor ion of choice (MS/MS mode). In the latter case ions are activated in a collision cell and
resulting fragments are analyzed in the TOF part of the instrument with very high repetition rate. This
TOF part of quadrupole TOF instruments replaces the final quadrupole section of triple quadrupole
instruments, which are today mainly used for targeted proteomics (8–10).
The quadrupole TOF instruments achieve peptide separation ‘in space’, meaning the ions are separated
nearly instantaneously by passing through either the quadrupole section, in which only a chosen small
mass range has stable trajectories, or by traversing the TOF section. In contrast, trapping instruments
such as linear ion traps separate ions ‘in time’ by applying external RF-DC fields to a stationary ion
population that allow only a certain ion population to stably remain in the trap (see ref. (11) for the
concept of separation and fragmentation ‘in time’ vs. ‘in space’).
The Orbitrap mass analyzer was developed about ten years ago by Makarov. It consists of a small
electrostatic device into which ion packets are injected at high energies to orbit around a central,

Q Exactive, a benchtop quadrupole Orbitrap mass spectrometer
[4]
spindle-shaped electrode (12–14). The image current of the axial motion of the ions is picked up by the
detector and this signal is Fourier Transformed (FT) to yield high resolution mass spectra. Commercially,
the Orbitrap analyzer was first introduced in 2005 in a hybrid instrument (15). In proteomics and related
fields, this combination of a low resolution linear ion trap with the high resolution Orbitrap analyzer –
termed ‘LTQ Orbitrap’ – has now become widespread (16, 17). The LTQ Orbitrap instruments represent
a multi-stage trap combination (Figure 1). In MS mode the linear trap performs the function of collecting
the ion population, passing them on to an intermediate C-trap for injection and analysis in the Orbitrap
analyzer at high resolution. In MS/MS mode the linear ion trap only retains a chosen mass window,
which is activated by a supplemental RF field leading to fragmentation of the trapped precursor ions,
and records the signal of a mass dependent scan at low resolution. Note that the high resolution MS
scan can be performed at the same time as the low resolution MS/MS scans in the linear ion trap.
Recently, an improved linear ion trap Orbitrap analyzer combination termed ‘LTQ Orbitrap Velos’ has
been introduced (18). It features an S-lens with up to tenfold improved ion transmission from
atmosphere, a dual linear ion trap and a more efficient Higher Energy Collision (HCD) cell interfaced
directly to the C-trap (18). HCD fragmentation is similar to the fragmentation in triple quadrupole or
quadrupole TOF instruments and its products are analyzed with high mass accuracy in the Orbitrap
analyzer (19). Thus, the LTQ Orbitrap or LTQ Orbitrap Velos instruments offer versatile fragmentation
modes depending on the analytical problem (20–22).
Taking advantage of the small size of the Orbitrap analyzer a standalone benchtop instrument termed
‘Exactive’ has been introduced mainly for small molecule applications. However, due to the absence of
mass selection, its use in proteomics is limited to non-mass selective fragmentation of the entire mass
range (called ‘All Ion Fragmentation’ (AIF) on this instrument (23)).

Q Exactive, a benchtop quadrupole Orbitrap mass spectrometer
[5]
The combination of a quadrupole mass filter with an Orbitrap analyzer has not yet been reported. We
reasoned that such a quadrupole trap combination might offer unique and complementary advantages
to the hybrid mass spectrometers described above. In particular, a quadrupole Exactive instrument or ‘Q
Exactive’ would be able to select ions virtually instantaneously due to the fast switching times of
quadrupoles and it would be able to fragment peptides in HCD mode on a similarly fast time scale.
Furthermore, due to the small size and mature technology used in current quadrupole mass filters, this
analyzer combination should have a small footprint and be particularly robust. Finally, the ability to
separate ‘in space’ and analyze MS and MS/MS ranges at high resolution in the Orbitrap analyzer, offers
the promise of enabling efficient multiplexed scan modes not currently used in proteomics research
using trapping instruments.
EXPERIMENTAL PROCEDURES
Construction of a quadrupole Orbitrap instrument – The Q Exactive instrument includes an
atmospheric pressure ion source (API), a stacked-ring ion guide (S-lens) in the source region, a
quadrupole mass filter, a C-trap, an HCD cell, and an Orbitrap mass analyzer as shown in Fig. 2. Ions are
formed at atmospheric pressure (in this work in a nanoelectrospray ion source), pass through a transfer
tube to an S-lens described in (18) and then via an injection multipole into a bent flatapole. The bent
flatapole has 2 mm gaps between its rods, oriented in such a way that the line of sight from the S-lens is
open for clusters and droplets to fly unimpeded out of the flatapole.
Following collisional cooling in the bent flatapole, ions are transmitted via a lens into a hyperbolic
quadrupole (r0 = 4 mm), capable of isolating ions down to an isolation width of 0.4 Th at m/z 400. The
quadrupole is followed by its exit lens combined with a split lens used to gate the incoming ion beam. A

Q Exactive, a benchtop quadrupole Orbitrap mass spectrometer
[6]
short octapole then brings ions into the C-trap interfaced to an HCD cell with axial field (18). The gas-
filled HCD cell is separated from the C-trap only by a single diaphragm, allowing easy HCD tuning.
Fragmentation of ions in the HCD cell is achieved by adjusting the offset of the RF rods and the axial field
to provide the required collision energy. As long as this offset remains negative relative to the C-trap
and the HCD exit lenses, all fragments remain trapped inside the HCD cell, even if the offset of the RF
rods is varied. This allows to introduce multiple precursor ions and to fragment them at their optimum
collision energy without compromising the storage of preceding injections. The summed ion population
can then be transferred back into the C-trap, ejected into the Orbitrap analyzer and analyzed in a single
Orbitrap detection cycle. This opens the possibility of fundamentally new, ‘multiplexing’ modes of
operation. In practice, the useful number of ion injections for a single Orbitrap detection is limited by
the sum of the individual inject times being lower than the time for the Orbitrap scan.
A new challenge posed by interfacing the Orbitrap analyzer to a quadrupole is the automatic gain
control (AGC) of weak ion signals. This problem was addressed by using an AGC pre-scan for a full MS
spectrum with subsequent prediction of the ion currents for the weak signals on the basis of their share
in total ion current (predictive AGC).
The mass range covered by the instrument is m/z 50–4000, with the range of mass selection reaching
m/z 2500. Acquisition speed ranges from 12 Hz for resolving power 17,500 at m/z 200 (corresponding to
12,500 at m/z 400) to 1.5 Hz for resolving power 140,000 at m/z 200 (corresponding to 100,000 at m/z
400). Vacuum in the Orbitrap compartment is typically below 7 x 10⁻¹⁰ mBar, which makes the analyzer
adequate for high resolution analysis of most analytes, including large peptides and small proteins.
The ability to fill the HCD cell or the C-trap with ions while a previous Orbitrap detection cycle is still
ongoing is another important innovation that allows to significantly reduce the influence of low ion
currents on acquisition speed and quality of spectra.
Q Exactive, a benchtop quadrupole Orbitrap mass spectrometer
[7]
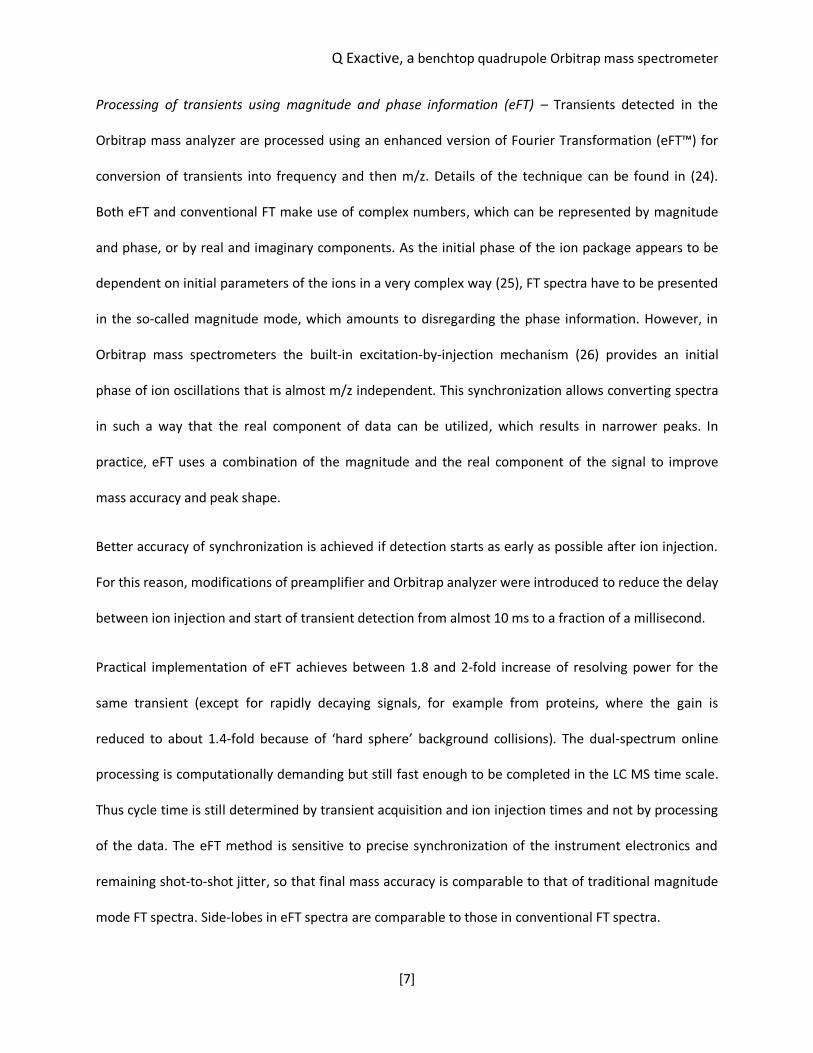
Processing of transients using magnitude and phase information (eFT) – Transients detected in the
Orbitrap mass analyzer are processed using an enhanced version of Fourier Transformation (eFT™) for
conversion of transients into frequency and then m/z. Details of the technique can be found in (24).
Both eFT and conventional FT make use of complex numbers, which can be represented by magnitude
and phase, or by real and imaginary components. As the initial phase of the ion package appears to be
dependent on initial parameters of the ions in a very complex way (25), FT spectra have to be presented
in the so-called magnitude mode, which amounts to disregarding the phase information. However, in
Orbitrap mass spectrometers the built-in excitation-by-injection mechanism (26) provides an initial
phase of ion oscillations that is almost m/z independent. This synchronization allows converting spectra
in such a way that the real component of data can be utilized, which results in narrower peaks. In
practice, eFT uses a combination of the magnitude and the real component of the signal to improve
mass accuracy and peak shape.
Better accuracy of synchronization is achieved if detection starts as early as possible after ion injection.
For this reason, modifications of preamplifier and Orbitrap analyzer were introduced to reduce the delay
between ion injection and start of transient detection from almost 10 ms to a fraction of a millisecond.
Practical implementation of eFT achieves between 1.8 and 2-fold increase of resolving power for the
same transient (except for rapidly decaying signals, for example from proteins, where the gain is
reduced to about 1.4-fold because of ‘hard sphere’ background collisions). The dual-spectrum online
processing is computationally demanding but still fast enough to be completed in the LC MS time scale.
Thus cycle time is still determined by transient acquisition and ion injection times and not by processing
of the data. The eFT method is sensitive to precise synchronization of the instrument electronics and
remaining shot-to-shot jitter, so that final mass accuracy is comparable to that of traditional magnitude
mode FT spectra. Side-lobes in eFT spectra are comparable to those in conventional FT spectra.

Q Exactive, a benchtop quadrupole Orbitrap mass spectrometer
[8]
Preparation of HeLa lysates – HeLa cells were lysed and the pellet was dissolved in a urea (6 M) and
thiourea (2 M) solution. Proteins were reduced with dithiotreitol (DTT) (1 mM) for 30 min at room
temperature followed by alkylation with iodoacetamide (IAA) (55 mM) for 20 min in the dark. The
mixture was incubated with LysC (1 μg/50 μg protein) (Wako) at room temperature for 3 h before 1:4
dilution with water. Incubation with trypsin (1 μg /50 μg protein) (Promega) was carried out for 12 h at
room temperature. The digestion was stopped by addition of formic acid (3 %). Organic solvent was
removed in a SpeedVac concentrator. The peptide mixture was desalted on reversed phase C18 StageTips
(27). Directly before analysis, peptides were eluted into 8 well autosampler vials with 60 µL buffer B (80%
ACN in 0.5% acetic acid). Organic solvent was removed in a SpeedVac concentrator and the final sample
volume was adjusted with buffer A* (2% ACN in 0.1 % TFA) to 12 µL.
LC MS/MS analysis for Q Exactive and LTQ Orbitrap Velos – A nanoflow HPLC instrument (Easy nLC,
Proxeon Biosystems, now Thermo Fisher Scientific) was coupled on-line to a Q Exactive or an
LTQ Orbitrap Velos mass spectrometer (both from Thermo Fisher Scientific) with a nanoelectrospray ion
source (Proxeon). Chromatography columns were packed in-house with ReproSil-Pur C18-AQ 3 μm resin
(Dr. Maisch GmbH) in buffer A (0.5% acetic acid). The peptide mixture (5 µg) was loaded onto a
C18-reversed phase column (15 cm long, 75 μm inner diameter) and separated with a linear gradient of
5–60% buffer B (80% ACN and 0.5% acetic acid) at a flow rate of 250 nL/min controlled by IntelliFlow
technology over 90 min. Due to loading and washing steps, the total time for an LC MS/MS run was
about 40–50 min longer.
MS data was acquired using a data-dependent top10 method dynamically choosing the most abundant
precursor ions from the survey scan (300–1650 Th) for HCD fragmentation. Target values on Q Exactive
were similar to those typically used on an LTQ Orbitrap Velos. Determination of the target value is based
on predictive Automatic Gain Control (pAGC) in both instruments. However, the LTQ Orbitrap Velos is

Q Exactive, a benchtop quadrupole Orbitrap mass spectrometer
[9]
equipped with electron multipliers, which allows scaling of the number of ions in a direct manner. In
contrast, scaling of the number of ions is more indirect on the Q Exactive accounting for the difference
in target values for the same S/N. Dynamic exclusion duration was 60 s with early expiration disabled on
the LTQ Orbitrap Velos. Isolation of precursors was performed with a 4 Th window and MS/MS scans
were acquired with a starting mass of 100 Th. Survey scans were acquired at a resolution of 70,000 at
m/z 200 on the Q Exactive and 30,000 at m/z 400 on the LTQ Orbitrap Velos (see RESULTS AND
DISCUSSION and Table 1 for conversion of resolution values to different m/z values). Resolution for HCD
spectra was set to 17,500 at m/z 200 on the Q Exactive and 7,500 at m/z 400 on the LTQ Orbitrap Velos.
Normalized collision energy was 30 eV for the Q Exactive and 35 eV for the LTQ Orbitrap Velos – they are
not identical due to different scaling functions in the instrument software. The underfill ratio, which
specifies the minimum percentage of the target value likely to be reached at maximum fill time, was
defined as 0.1% on the Q Exactive. For the LTQ Orbitrap Velos the lower threshold for targeting a
precursor ion in the MS scans was 5,000 counts. Both instruments were run with peptide recognition
mode enabled, but exclusion of singly charged and unassigned precursor ions was only enabled on the
LTQ Orbitrap Velos. This was due to the higher sequencing speed of the Q Exactive and a slightly
different precursor selection algorithm for the data-dependent scans. However, in practice there was
not much difference between the settings with regard to the number of identified unique peptides and
proteins.
To demonstrate multiplexing of selected ion monitoring (SIM) scans, a method alternating full scans and
SIM scans over the entire gradient was set up on the Q Exactive. The 92 min range in which peptides
eluted was divided into 23 segments of 4 min duration. For each of these segments, three SIM windows
of 2 Th width were defined, centered around 69 randomly chosen, low abundance precursor ions
observed in these elution time windows in a previous top10 run. Pre-selection of these low abundance
peptides was carried out manually based on the msms.txt file resulting from MaxQuant analysis. The
Q Exactive, a benchtop quadrupole Orbitrap mass spectrometer
[10]
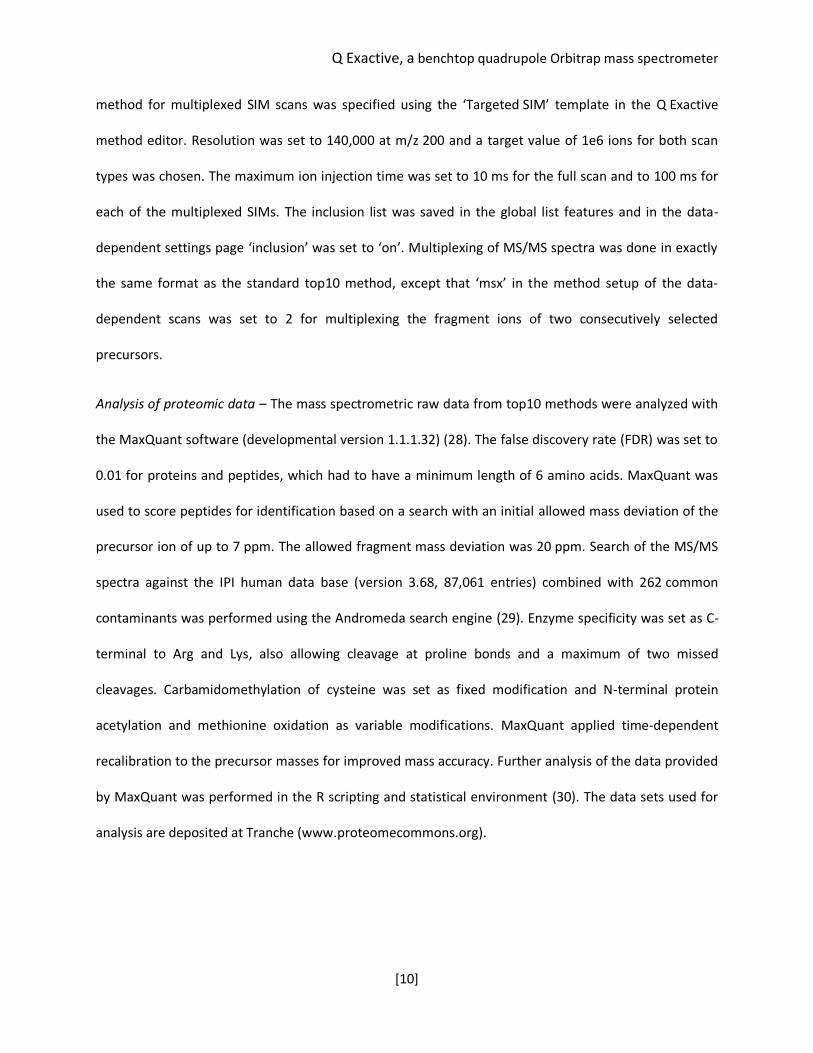
method for multiplexed SIM scans was specified using the ‘Targeted SIM’ template in the Q Exactive
method editor. Resolution was set to 140,000 at m/z 200 and a target value of 1e6 ions for both scan
types was chosen. The maximum ion injection time was set to 10 ms for the full scan and to 100 ms for
each of the multiplexed SIMs. The inclusion list was saved in the global list features and in the data-
dependent settings page ‘inclusion’ was set to ‘on’. Multiplexing of MS/MS spectra was done in exactly
the same format as the standard top10 method, except that ‘msx’ in the method setup of the data-
dependent scans was set to 2 for multiplexing the fragment ions of two consecutively selected
precursors.
Analysis of proteomic data – The mass spectrometric raw data from top10 methods were analyzed with
the MaxQuant software (developmental version 1.1.1.32) (28). The false discovery rate (FDR) was set to
0.01 for proteins and peptides, which had to have a minimum length of 6 amino acids. MaxQuant was
used to score peptides for identification based on a search with an initial allowed mass deviation of the
precursor ion of up to 7 ppm. The allowed fragment mass deviation was 20 ppm. Search of the MS/MS
spectra against the IPI human data base (version 3.68, 87,061 entries) combined with 262 common
contaminants was performed using the Andromeda search engine (29). Enzyme specificity was set as C-
terminal to Arg and Lys, also allowing cleavage at proline bonds and a maximum of two missed
cleavages. Carbamidomethylation of cysteine was set as fixed modification and N-terminal protein
acetylation and methionine oxidation as variable modifications. MaxQuant applied time-dependent
recalibration to the precursor masses for improved mass accuracy. Further analysis of the data provided
by MaxQuant was performed in the R scripting and statistical environment (30). The data sets used for
analysis are deposited at Tranche (www.proteomecommons.org).

Q Exactive, a benchtop quadrupole Orbitrap mass spectrometer
[11]
RESULTS AND DISCUSSION
Our goal was to construct a high performance quadrupole Orbitrap mass spectrometer in a compact
format. Details of the hardware are in EXPERIMENTAL PROCEDURES but here we give a brief overview.
We started by building on the Exactive platform. The Exactive does not have mass selection capability
and was developed mainly for small molecule applications (31). However, it can be equipped with a
higher energy dissociation cell (HCD) at the far side of the C-trap. Thus the detection system of the
Exactive already allows HCD fragmentation (19) albeit without mass selection. This mode is called ‘AIF’
for All Ion Fragmentation on this instrument and can also be used in proteomics (23). To support mass
selective MS/MS scans in the Q Exactive, the transmission from electrospray source to vacuum was
increased up to ten-fold, for which we used the S-lens employed in the LTQ Orbitrap Velos (18). New,
rapidly switching electronics systems controlling the instrument were incorporated. Apart from some
inlet ion optics changes the Orbitrap analyzer is the same as in previous Orbitrap analyzers. The Orbitrap
voltage is 5 kV as it is on the Exactive and therefore higher than the 3.5 kV on LTQ Orbitrap instruments.
The Q Exactive also employs a 90° bent ion path from the source towards the mass analyzer in common
with the Exactive and in contrast to the LTQ Orbitrap instruments. The defining difference of the Q
Exactive compared to the Exactive is the presence of a mass selective quadrupole analyzer between the
ion source and the C-trap (Figure 2). This quadrupole is the same as that used in triple quadrupole
Access instruments, however, it features a modified RF-generator capable of driving selection of wide
mass selection windows.
From a practical point of view, maintenance of the Q Exactive is similar to that of the Exactive. The
quadrupole mass filter has very few tunable parameters and the instrument is automatically calibrated
in a few minutes.

Q Exactive, a benchtop quadrupole Orbitrap mass spectrometer
[12]
Mass spectrometric resolution – In the analysis of complex mixtures, peptides of similar mass often co-
elute and therefore resolution is a key parameter of a mass spectrometer in these applications (7).
Shotgun proteomics on the LTQ Orbitrap instruments is usually performed with 30,000 or 60,000
resolution at m/z 400. (Note that resolution decreases with the square root of the m/z value in Orbitrap
analyzers.) High intrinsic resolution of an instrument allows short transients and hence short cycle times
in topN methods – facilitating deep coverage of the proteome.
Due to the higher voltage of the Q Exactive, resolution at the same transient length is 20% higher. More
importantly, we here employ ‘enhanced Fourier Transformation’ (eFT) of the transients, which boosts
resolution by a factor 1.8 to 2.0 (for further explanation see EXPERIMENTAL METHODS). A similar
principle has recently been described by Marshall and coworkers for FT ICR (32).
In figure 3, the resolution of the Q Exactive is demonstrated for the tetra peptide MRFA. As apparent
from the widths of the isotope peaks and by their spacing, a resolution of more than 90,000 was
achieved at m/z 524. The figure also illustrates the effect of turning the eFT algorithm on and off
(although in normal operation of the Q Exactive, eFT is always on). With eFT enabled, the instrument
clearly resolves the two isotopes of the same nominal mass that are due to two 13C carbon atoms or the
sulfur atom contained in methionine (13C2 vs. 34S).
In the Exactive instrument, resolution is specified at m/z 200 because of its small molecule applications
and this convention is kept in the Q Exactive. We provide a table to aid comparison between resolution
values at m/z 200 and m/z 400 used with the LTQ Orbitrap instruments for the four possible transient
lengths on the Q Exactive (TABLE 1). The standard 60,000 resolution scan on the LTQ Orbitrap
instruments uses a 768 ms transient. On the Q Exactive, a resolution of 100,000 (at m/z 400) is reached
with a 512 ms transient. We use a resolution of 50,000 (at m/z 400), corresponding to a 256 ms
transient length as a standard in proteomics experiments. This resolution is only slightly lower than that

Q Exactive, a benchtop quadrupole Orbitrap mass spectrometer
[13]
normally used on the LTQ Orbitraps, but takes less than half of the time. For MS/MS experiments we
employ a resolution of 17,500 at m/z 200 (12,500 at m/z 400), which is achieved with a transient length
of 64 ms. This value is substantially higher than the 7,500 resolution (at m/z 400) typical for HCD
experiments on the LTQ Orbitrap Velos. The higher resolution in MS/MS spectra helps in assigning
fragments of large precursors, however, the 64 ms transient was mainly chosen because even shorter
transients would decrease the signal to noise in the MS/MS spectra.
Cycle times for MS and MS/MS analysis – As the quadrupole only serves as a selection device, the
Q Exactive cannot perform MS and MS/MS operations in parallel (Figure 1). On the other hand, the
Q Exactive – unlike the LTQ Orbitrap Velos – fills ions in parallel to Orbitrap transient acquisition.
Therefore, we next tested its overall cycle times and compared them to other Orbitrap instruments.
For the analysis of complex peptide mixtures, topN experiments consisting of a survey scan followed by
N MS/MS scans are typically performed. Depending on the complexity of the mixture, N is usually
between three and 20, and top10 is a widely used standard method. As explained above, a transient of
256 ms results in a resolution of 50,000 (at m/z 400), which is appropriate for proteomic applications.
We combined this survey scan with ten 64 ms MS/MS scans (resolution 12,500 at m/z 400). If
accumulation of the ions to the desired target count happened entirely in parallel with transient
detection and if there was no overhead, this method would take 896 ms. The actually measured time for
this sequence was 1.06 s, indicating that all overhead times together amounted only to about 160 ms
(Figure 4). This figure even included the automatic gain control scan performed prior to each full scan
(whereas fill times for MS/MS scans are determined by ‘predictive AGC’).
Completion of a full top10 method in about 1 s is exceedingly fast and compares favorably with top10
HCD methods on a Velos instrument. For example, the number of HCD spectra in such a Velos based
method in a recent study was 3.3 MS/MS/s over the entire gradient (4). Even compared to top10 CID

Q Exactive, a benchtop quadrupole Orbitrap mass spectrometer
[14]
methods on the Velos instrument, which have the advantage of parallel acquisition, the Q Exactive
proved to be faster in our hands (18). The reasons for the very fast cycle times are five-fold: (i) eFT
allows using short transient times (ii) ion filling is done in parallel with detection (iii) overhead times of
electronics components have been minimized (iv) precursor selection is done ‘in space’ in a few ms and
(v) HCD peptide fragmentation is nearly instantaneous.
Because of the parallel ion accumulation in the Q Exactive, fill times shorter than the transient length do
not affect the overall cycle time. In our experiments with complex mixtures (see below), fill times for full
scans were in the range of 1 to 10 ms, and for MS/MS scans they were generally between 5 and 50 ms
leading to completely parallel acquisition and detection in almost all cases. The fill times observed here
are similar to those of the LTQ Orbitrap Velos (18), indicating comparable sensitivity of both instrument
types in full scan and HCD MS/MS mode.
Q Exactive performance for proteome analysis – To characterize the performance of the Q Exactive for
shotgun proteomics, we prepared a digest of a mammalian cell line (EXPERIMENTAL METHODS). The
peptide mixture was separated by on-line HPLC in a 90 min gradient by standard methods used in our
laboratories. The entire analysis was done in triplicate and for comparison it was also performed on an
LTQ Orbitrap Velos. Figure 5 shows a heat map of the MS signals generated by peptides eluting from the
column over the 90 min. The inset in the heat map is a zoom of a typical region, showing the complexity
of eluting isotope patterns in this peptide mixture derived from whole cell lysate. As can be seen on the
left hand scale, MS scans occurred every second and consequently eluting peptide peaks were well
sampled. The MS spectrum in figure 5B depicts a single MS scan intersecting the zoomed region and
indicates a triply charged precursor that was selected for fragmentation. Note that on the Q Exactive all
fragmentation is performed by HCD and MS/MS spectra are always acquired with high resolution. This

Q Exactive, a benchtop quadrupole Orbitrap mass spectrometer
[15]
enables unambiguous recognition of charge states as illustrated in Figure 5D and high fragment mass
accuracy.
The data were analyzed in MaxQuant with the integrated Andromeda search engine (28, 29). Table 2A
lists the results of the database search of the Q Exactive data. The total number of MS scans was in
excess of 5,000 and the total number of MS/MS scans in excess of 35,000. (Note that top10 sequencing
is only performed when there are sufficient peptide candidates in the MS scan that meet selection
criteria for fragmentation.) The number of isotope patterns detected was close to 150,000, a very high
number considering that the gradient was not particularly long (4, 5), presumably because of the short
MS and MS/MS cycle time of 1s. On average 12,563 unique peptides were identified in each run, for a
total of 16,255 peptides in the triplicate analysis. These peptides mapped to an average of 2,557
proteins per run, and a total of 2,864 proteins of the HeLa proteome with the three 90 minute gradients
(supplementary tables 1-4).
For comparison, we performed the same analysis on an LTQ Orbitrap Velos (Table 2B). As expected,
significantly more unique peptides were identified by the Q Exactive in the single LC runs (12,253 vs.
10,207 on average; increase of 23%). Thus the Q Exactive, despite its compact format, represents an
advance in the analysis of complex peptide mixtures as typically analyzed in shotgun proteomics. Note,
however, that the above comparison only considers relatively short analysis of very complex mixtures
and compares HCD fragmentation on both instruments. A detailed comparison of the two instrument
types would require additional experiments and should also take into account that the Velos instrument
can perform high or low resolution CID, in addition to HCD. Furthermore, the LTQ Orbitrap Velos, unlike
the Q Exactive, is available with an ETD unit thereby providing a complementary fragmentation
approach.

Q Exactive, a benchtop quadrupole Orbitrap mass spectrometer
[16]
Multiplexing at the MS and MS/MS levels – The linear ion trap Orbitrap analyzer combination is very
versatile because it is comprised of two fully functional mass spectrometers. This allows isolation and
fragmentation in different parts of the instruments and offers considerable flexibility in combining
isolation and fragmentation events. While many of these operation modes are not possible on the
Q Exactive, it turns out that this novel combination of a mass filter and an Orbitrap analyzer also enables
unique scan events. The principle feature making these scan modes possible is the fact that mass
selection occurs ‘in space’ which is extremely fast (Figure 1). This should allow almost arbitrarily complex
‘mixing and matching’ of MS and MS/MS mass ranges followed by high resolution analysis in the
Orbitrap analyzer.
Figure 6 illustrates two such multiplexed scan modes, one at the MS level and one at the MS/MS level.
In selected ion monitoring (SIM) scans, a narrow mass range is accumulated providing increased signal
to noise for particular ions of interest. SIM scans are useful in many applications but they are not often
performed on Orbitrap instruments. This is because (i) the isolation of the SIM mass range in the linear
ion trap is relatively time consuming, (ii) there is a space charge limit on the number of ions that can be
cleanly isolated and (iii) the analysis of even a single SIM scan takes considerable time. With few
exceptions such as the lock mass injection to correct the mass scale (33), multiple mass range filling of
the Orbitrap has not been implemented. The Q Exactive does not have the above limitations and, for
example, allows selecting several SIM mass ranges of interest (Figure 6A). In this mode, the C-trap is
used as a storage device, which is filled with the desired number of ions from up to ten different SIM
windows. These ions are together injected into the Orbitrap analyzer and measured in the same way as
full mass ranges. Because fill times are typically much shorter than MS transient times, multiplexed SIM
scans use Orbitrap instrument time much more efficiently. We demonstrate this concept in Figure 6B–D
where a complete HeLa cell lysate was run in a 90 minute gradient. (Note that such a gain does not
occur on TOF instruments because they are not limited by scan times.) Three peptides known to be of

Q Exactive, a benchtop quadrupole Orbitrap mass spectrometer
[17]
low abundance from a previous top10 run were selected to define mass ranges
(LTGMAFRVPTANVSVVDLTCR, DMIILPEMVGSMVGVYNGK, DAATIMQPYFTSNGLVTK). Figure 6B represents
the full range MS scans. In figure 6C and 6D, depicting a zoom into one of the SIM windows, the peptides
are clearly visible with very good signal to noise. Mean fill time for the full scans was 4 ms, whereas ions
for each of the SIM scans were accumulated for 100 ms accounting for the drastically improved S/N. At
this high sensitivity, other peptides emerged from the background but were clearly resolved from the
targeted peptide. These three multiplexed SIM windows were analyzed together in 140,000 resolution
scans (0.5 s), adding little to the overall cycle time. Switching time to position the quadrupole at each
mass window was 6 ms. Clearly such multiplexed SIMs could play an important role in targeted peptide
analysis and peptide quantitation.
In complex mixture analysis, sequencing speed can be a limiting factor. In principle, fragmentation of
several precursors with simultaneous recording of the fragments can further boost the number of
analyzable MS/MS events per unit time. While in principle possible with a linear ion trap, in practice the
necessary multiple rounds of peptide isolation and fragmentation preclude such an option on the LTQ
Orbitrap. The Q Exactive, however, can successively isolate different precursor ions and fragment them
in the HCD cell each at an individual normalized collision energy suitable for its properties. As each
population of precursor ions is only fragmented once during injection into the HCD cell, all fragment ions
are stored successively in the HCD cell and then they undergo joint analysis in the Orbitrap analyzer (see
Figure 7A). To demonstrate this, we specified a top10 method with multiplex degree of two. Figure 7B
shows a representative example of a multiplexed MS/MS spectrum analyzed at the normal MS/MS
resolution setting of 12,500 (at m/z 400). Visual inspection of the spectrum clearly reveals extensive
sequence information from both sequences. Interpretation of these deliberately multiplexed spectra, as
opposed to co-fragmented precursors, is aided by the fact that the same number of ions can be
fragmented for each targeted precursor. While it is clear that multiplexed MS/MS scans are easily
Q Exactive, a benchtop quadrupole Orbitrap mass spectrometer
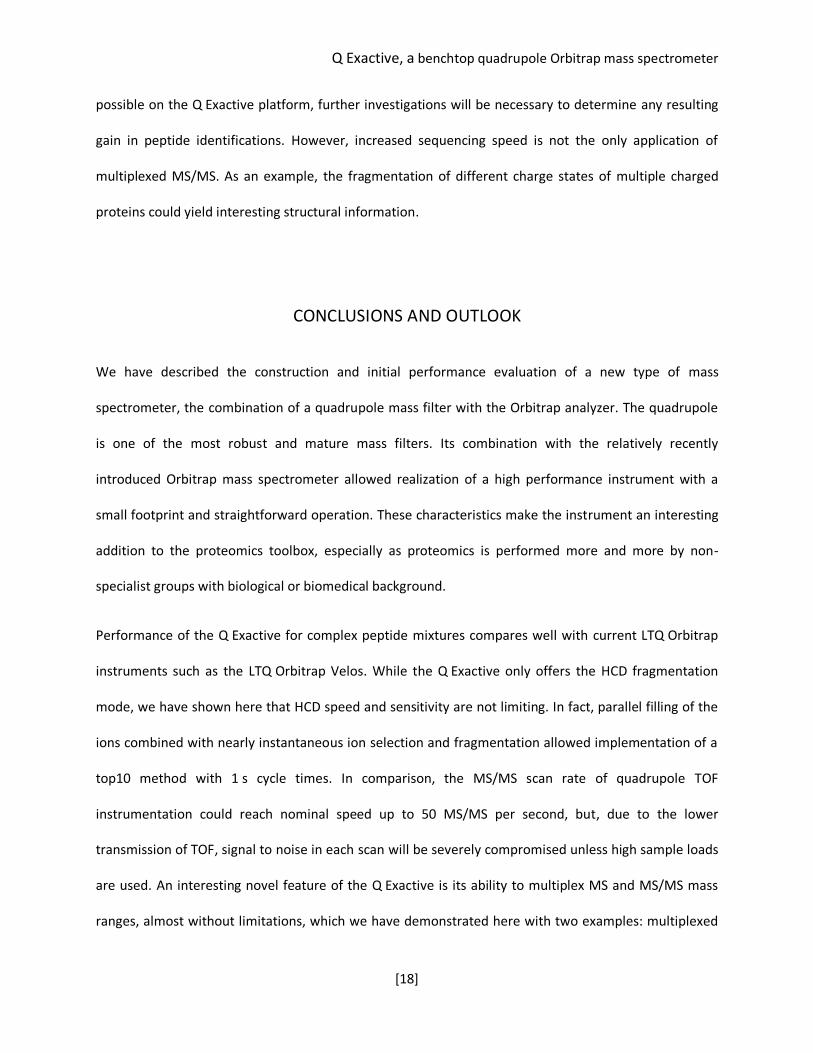
[18]
possible on the Q Exactive platform, further investigations will be necessary to determine any resulting
gain in peptide identifications. However, increased sequencing speed is not the only application of
multiplexed MS/MS. As an example, the fragmentation of different charge states of multiple charged
proteins could yield interesting structural information.
CONCLUSIONS AND OUTLOOK
We have described the construction and initial performance evaluation of a new type of mass
spectrometer, the combination of a quadrupole mass filter with the Orbitrap analyzer. The quadrupole
is one of the most robust and mature mass filters. Its combination with the relatively recently
introduced Orbitrap mass spectrometer allowed realization of a high performance instrument with a
small footprint and straightforward operation. These characteristics make the instrument an interesting
addition to the proteomics toolbox, especially as proteomics is performed more and more by non-
specialist groups with biological or biomedical background.
Performance of the Q Exactive for complex peptide mixtures compares well with current LTQ Orbitrap
instruments such as the LTQ Orbitrap Velos. While the Q Exactive only offers the HCD fragmentation
mode, we have shown here that HCD speed and sensitivity are not limiting. In fact, parallel filling of the
ions combined with nearly instantaneous ion selection and fragmentation allowed implementation of a
top10 method with 1 s cycle times. In comparison, the MS/MS scan rate of quadrupole TOF
instrumentation could reach nominal speed up to 50 MS/MS per second, but, due to the lower
transmission of TOF, signal to noise in each scan will be severely compromised unless high sample loads
are used. An interesting novel feature of the Q Exactive is its ability to multiplex MS and MS/MS mass
ranges, almost without limitations, which we have demonstrated here with two examples: multiplexed

Q Exactive, a benchtop quadrupole Orbitrap mass spectrometer
[19]
SIM mass ranges and multiplexed MS/MS spectra. In contrast to quadrupole TOF instrumentation,
where scan speed in SIM mode is limited mainly by the time needed to reach acceptable signal to noise
ratio, multiplexed SIM allows decoupling spectral acquisition speed from the speed of acquiring SIM
scans and thus to utilize the full high transmission to the Orbitrap analyzer. We anticipate that the Q
Exactive will enable additional interesting multiplexing capabilities in the future.
Acknowledgments – We thank our colleagues at Thermo Fisher Scientific, especially Ulf Froehlich, Andreas Kuehn
and Florian Grosse-Coosmann, and at the Max Planck Institute, especially Nadin Neuhauser, Tami Geiger and
Richard Scheltema, for help and fruitful discussions. This project was supported by the European Commission’s 7th
Framework Program PROteomics SPECificat ion in Time and Space (PROSPECTS, HEALTH‑F4‑2008‑021,648).
Data availability: Supplementary data is available with this publication at the MCP web site. Raw MS
files are uploaded to Tranche (www.proteomecommons.org) as "Michalski et al. Q Exactive"
Hash code:
Nbh0v8NbSxDGuN/qunMhsCz2z+rNP6YtKM1/uW2r2a2FEt9fUWESQH5XE1mGzU1BsPxpVWSlHtfTeeufl2
hkW54eL54AAAAAAAAIDQ==

Q Exactive, a benchtop quadrupole Orbitrap mass spectrometer
[20]
TABLE 1
Resolution @ m/z = 200 Th
Resolution @ m/z = 400 Th
Transient length
17,500 12,500 64 ms 35,000 25,000 128 ms 70,000 50,000 256 ms
140,000 100,000 512 ms
TABLE 1: Four Q Exactive resolution settings and transient times.
TABLE 2
MS spectra
MSMS spectra
Identifications [%]
Unique peptides
Proteins
Isotope clusters
HeLa (1) 5427 35203 37.23 12298 2513 146138
HeLa (2) 5098 35911 38.35 12830 2601 143556
HeLa (3) 5274 35348 38.23 12560 2557 144336
Σ Triplicates 37.94 16255 2864
TABLE 2A: Peptide identification from HeLa lysate triplicate analysis on a Q Exactive (90 min gradient).
MS spectra
MSMS spectra
Identifications [%]
Unique peptides
Proteins
Isotope clusters
HeLa (1) 2012 19818 55.64 10420 1895 125738
HeLa (2) 2102 19103 56.64 9855 1843 120553
HeLa (3) 2005 19634 56.37 10347 1906 126717
Σ Triplicates
56.21 14401 2242
TABLE 2B: Peptide identification from HeLa lysate triplicate analysis on an LTQ Orbitrap Velos (90 min
gradient).
Q Exactive, a benchtop quadrupole Orbitrap mass spectrometer
[21]
REFERENCES
1. Aebersold, R., and Mann, M. (2003) Mass spectrometry-based proteomics. Nature 422, 198-207. 2. Yates, J. R., 3rd, Gilchrist, A., Howell, K. E., and Bergeron, J. J. (2005) Proteomics of organelles and large cellular structures. Nature reviews 6, 702-714. 3. Walther, T. C., and Mann, M. (2010) Mass spectrometry-based proteomics in cell biology. The Journal of cell biology 190, 491-500. 4. Michalski, A., Cox, J., and Mann, M. (2011) More than 100,000 Detectable Peptide Species Elute in Single Shotgun Proteomics Runs but the Majority is Inaccessible to Data-Dependent LC-MS/MS. Journal of proteome research 10, 1785-1793. 5. Kocher, T., Swart, R., and Mechtler, K. (2011) Ultra-High-Pressure RPLC Hyphenated to an LTQ-Orbitrap Velos Reveals a Linear Relation between Peak Capacity and Number of Identified Peptides. Analytical chemistry 83, 2699-2704. 6. Domon, B., and Aebersold, R. (2006) Mass spectrometry and protein analysis. Science 312, 212-217. 7. Mann, M., and Kelleher, N. L. (2008) Precision proteomics: the case for high resolution and high mass accuracy. Proceedings of the National Academy of Sciences of the United States of America 105, 18132-18138. 8. Wolf-Yadlin, A., Hautaniemi, S., Lauffenburger, D. A., and White, F. M. (2007) Multiple reaction monitoring for robust quantitative proteomic analysis of cellular signaling networks. Proceedings of the National Academy of Sciences of the United States of America 104, 5860-5865. 9. Addona, T. A., Abbatiello, S. E., Schilling, B., Skates, S. J., Mani, D. R., Bunk, D. M., Spiegelman, C. H., Zimmerman, L. J., Ham, A. J., Keshishian, H., Hall, S. C., Allen, S., Blackman, R. K., Borchers, C. H., Buck, C., Cardasis, H. L., Cusack, M. P., Dodder, N. G., Gibson, B. W., Held, J. M., Hiltke, T., Jackson, A., Johansen, E. B., Kinsinger, C. R., Li, J., Mesri, M., Neubert, T. A., Niles, R. K., Pulsipher, T. C., Ransohoff, D., Rodriguez, H., Rudnick, P. A., Smith, D., Tabb, D. L., Tegeler, T. J., Variyath, A. M., Vega-Montoto, L. J., Wahlander, A., Waldemarson, S., Wang, M., Whiteaker, J. R., Zhao, L., Anderson, N. L., Fisher, S. J., Liebler, D. C., Paulovich, A. G., Regnier, F. E., Tempst, P., and Carr, S. A. (2009) Multi-site assessment of the precision and reproducibility of multiple reaction monitoring-based measurements of proteins in plasma. Nature biotechnology 27, 633-641. 10. Picotti, P., Bodenmiller, B., Mueller, L. N., Domon, B., and Aebersold, R. (2009) Full dynamic range proteome analysis of S. cerevisiae by targeted proteomics. Cell 138, 795-806. 11. Louris, J. N., Cooks, R. G., Syka, J. E. P., Kelley, P. E., Stafford, G. C., and Todd, J. F. J. (1987) INSTRUMENTATION, APPLICATIONS, AND ENERGY DEPOSITION IN QUADRUPOLE ION-TRAP TANDEM MASS-SPECTROMETRY. Analytical Chemistry 59, 1677-1685. 12. Hardman, M., and Makarov, A. A. (2003) Interfacing the orbitrap mass analyzer to an electrospray ion source. Anal Chem 75, 1699-1705. 13. Makarov, A. (2000) Electrostatic axially harmonic orbital trapping: a high-performance technique of mass analysis. Anal Chem 72, 1156-1162. 14. Scigelova, M., and Makarov, A. (2006) Orbitrap mass analyzer--overview and applications in proteomics. Proteomics 6 Suppl 2, 16-21. 15. Syka, J. E., Marto, J. A., Bai, D. L., Horning, S., Senko, M. W., Schwartz, J. C., Ueberheide, B., Garcia, B., Busby, S., Muratore, T., Shabanowitz, J., and Hunt, D. F. (2004) Novel linear quadrupole ion trap/FT mass spectrometer: performance characterization and use in the comparative analysis of histone H3 post-translational modifications. Journal of proteome research 3, 621-626.

Q Exactive, a benchtop quadrupole Orbitrap mass spectrometer
[22]
16. Makarov, A., Denisov, E., Lange, O., and Horning, S. (2006) Dynamic range of mass accuracy in LTQ Orbitrap hybrid mass spectrometer. Journal of the American Society for Mass Spectrometry 17, 977-982. 17. Makarov, A., Denisov, E., Kholomeev, A., Balschun, W., Lange, O., Strupat, K., and Horning, S. (2006) Performance evaluation of a hybrid linear ion trap/orbitrap mass spectrometer. Analytical chemistry 78, 2113-2120. 18. Olsen, J. V., Schwartz, J. C., Griep-Raming, J., Nielsen, M. L., Damoc, E., Denisov, E., Lange, O., Remes, P., Taylor, D., Splendore, M., Wouters, E. R., Senko, M., Makarov, A., Mann, M., and Horning, S. (2009) A dual pressure linear ion trap Orbitrap instrument with very high sequencing speed. Molecular & cellular proteomics : MCP 8, 2759-2769. 19. Olsen, J. V., Macek, B., Lange, O., Makarov, A., Horning, S., and Mann, M. (2007) Higher-energy C-trap dissociation for peptide modification analysis. Nature methods 4, 709-712. 20. Macek, B., Waanders, L. F., Olsen, J. V., and Mann, M. (2006) Top-down protein sequencing and MS3 on a hybrid linear quadrupole ion trap-orbitrap mass spectrometer. Molecular & cellular proteomics : MCP 5, 949-958. 21. McAlister, G. C., Berggren, W. T., Griep-Raming, J., Horning, S., Makarov, A., Phanstiel, D., Stafford, G., Swaney, D. L., Syka, J. E., Zabrouskov, V., and Coon, J. J. (2008) A proteomics grade electron transfer dissociation-enabled hybrid linear ion trap-orbitrap mass spectrometer. Journal of proteome research 7, 3127-3136. 22. McAlister, G. C., Phanstiel, D. H., Westphall, M. S., and Coon, J. J. (2011) Higher-energy collision-activated dissociation without a dedicated collision cell. Molecular & cellular proteomics : MCP. 23. Geiger, T., Cox, J., and Mann, M. (2010) Proteomics on an Orbitrap benchtop mass spectrometer using all-ion fragmentation. Mol Cell Proteomics 9, 2252-2261. 24. Lange, O., Makarov, A., Denisov, E., and Balschun, W. (2010) Accelerating spectral acquisition rate of Orbitrap mass spectrometry. Proc. 58th Conf. Amer. Soc. Mass Spectrom. 25. Vining, B. A., Bossio, R. E., and Marshall, A. G. (1999) Phase correction for collision model analysis and enhanced resolving power of fourier transform ion cyclotron resonance mass spectra. Analytical chemistry 71, 460-467. 26. Makarov, A. (2009) In: March, R. E., and Todd, J. F. J., eds. Practical Aspects of Trapped Ion Mass Spectrometry. Volume 4: Theory and Instrumentation, CRC Press (Taylor & Francis). 27. Rappsilber, J., Ishihama, Y., and Mann, M. (2003) Stop and go extraction tips for matrix-assisted laser desorption/ionization, nanoelectrospray, and LC/MS sample pretreatment in proteomics. Anal Chem 75, 663-670. 28. Cox, J., and Mann, M. (2008) MaxQuant enables high peptide identification rates, individualized p.p.b.-range mass accuracies and proteome-wide protein quantification. Nat Biotechnol 26, 1367-1372. 29. Cox, J., Neuhauser, N., Michalski, A., Scheltema, R. A., Olsen, J. V., and Mann, M. (2011) Andromeda: A Peptide Search Engine Integrated into the MaxQuant Environment. Journal of proteome research. 30. Ihaka, R., and Gentleman, R. (1996) R: A Language for Data Analysis and Graphics. J Comput Graph Stat 5, 16. 31. Bateman, K. P., Kellmann, M., Muenster, H., Papp, R., and Taylor, L. (2009) Quantitative-qualitative data acquisition using a benchtop Orbitrap mass spectrometer. Journal of the American Society for Mass Spectrometry 20, 1441-1450. 32. Beu, S. C., Blakney, G. T., Quinn, J. P., Hendrickson, C. L., and Marshall, A. G. (2004) Broadband phase correction of FT-ICR mass spectra via simultaneous excitation and detection. Analytical chemistry 76, 5756-5761.

Q Exactive, a benchtop quadrupole Orbitrap mass spectrometer
[23]
33. Olsen, J. V., de Godoy, L. M., Li, G., Macek, B., Mortensen, P., Pesch, R., Makarov, A., Lange, O., Horning, S., and Mann, M. (2005) Parts per million mass accuracy on an Orbitrap mass spectrometer via lock mass injection into a C-trap. Molecular & cellular proteomics : MCP 4, 2010-2021.

Q Exactive, a benchtop quadrupole Orbitrap mass spectrometer
[24]
FIGURE LEGENDS FIG. 1. Mass spectrometers incorporating an Orbitrap analyzer. The Exactive is a standalone instrument
without mass selection. The total ion population is collected in the C-trap and injected into the Orbitrap
analyzer (see text and Fig. 2 for details on detector components). In the LTQ Orbitrap Velos combination,
ions can be selected ‘in time’ by mass selective scans in the linear ion trap. In CID mode, the LTQ and
Orbitrap operate as separate mass spectrometers. In HCD mode its function is to isolate a particular
precursor, which is then fragmented in the HCD cell. In contrast, in the Q Exactive mass selection is ‘in
space’ as ions of only a specified m/z range have stable trajectories and are transferred to the storage or
fragmentation devices before Orbitrap analysis.
FIG. 2. Construction details of the Q Exactive. This instrument is based on the Exactive platform but
incorporates an S-lens, a mass selective quadrupole and HCD collision cell directly interfaced to the C-
trap. Note that the drawing is not to scale.
FIG. 3. Resolution of the Q Exactive using eFT. A. Isotope cluster of the MRFA peptide from a mass scan
with a 512 ms transient employing eFT. B. Zoom into A demonstrating resolution of the 13C2 isotope
from the 34S isotope. The red curve is the simulated signal for MRFA. C. The same isotopes as in B
measured with the same transient but without enabling eFT.
FIG. 4. Cycle times for a top10 method on the Q Exactive. Large ticks represent the total cycle
consisting of MS and MS/MS scans. Duration for the MS survey scans is indicated by the green arrows
(resolution 70,000 at m/z 200 or 50,000 at m/z 400) and for the MS/MS scans by the blue arrows
(resolution 17,500 at m/z 200 or 12,500 at m/z 200). The X axis indicates chromatographic elution time
and the Y axis the total spectral intensity. B. Total cycle time for a top10 method is about 1 s and
fragmentation frequency is more than 12 Hz. The lower trace indicates parallel ion accumulation for the

Q Exactive, a benchtop quadrupole Orbitrap mass spectrometer
[25]
following scan. Note that peptide ion accumulation times for typical LC column loads are generally
shorter than transient times (as indicated in this example) and that they therefore do not add to cycle
times.
FIG. 5. Proteome analysis with the Q Exactive. A. Heat map of an LC MS/MS run of a peptide mixture
resulting from proteolytic digestion of a HeLa lysate. B. Zoom of a typical part of the heat map. Marks on
the left hand side represent the MS survey scans of each MS and MS/MS cycle and are separated by 1s.
C. Survey spectrum showing 50,000 resolution (at m/z 400) and the isotope pattern of a triply charged
precursor in green. D. MS/MS spectrum of the precursor shown in C with 12,500 resolution (at m/z 400)
and zoom of a doubly charged fragment ion.
FIG. 6. Multiplexing at the MS level. A. The quadrupole mass filter is set to transmit a specific SIM mass
range. After accumulation of the desired number of ions, the quadrupole is rapidly switched to the next
SIM window up to the total number of SIM windows to be monitored. The combined SIM ranges are
analyzed together in one high resolution scan as shown in cartoon form in the inset. B. Three
dimensional representation of a four minute segment of full range MS scans from a 90 min LC run of
HeLa peptides. C. Visualization of the data from triplex scans acquired directly after each full scan in the
same segment. Signals of the targeted low abundant peptides are clearly visible in the three SIM scans
in C but virtually absent in the full scans in B. D. Zoom of one of the SIM ranges in C show that the SIM
range contains peptides of even lower abundance than the targeted one marked with the dark blue
arrow.
FIG. 7. Multiplexing at the MS/MS level. A. Different precursor ions are mass selected in the
quadrupole, fragmented in turn by HCD and stored in the HCD cell. The combined fragment populations
are measured together in the Orbitrap analyzer (depicted in cartoon form in the inset) B. Duplexed
MS/MS spectrum.

No Selection
Exac
tive
Selection in Time (trap-trap)
LTQ
Orb
itrap
Velo
s(C
ID)
LTQ
Orb
itrap
Velo
s(H
CD
)
Selection in Space (filter-trap)
Q E
xact
ive
Figure 1
Transfer
Scanning
Isolation - Fragmentation - Scanning
Scanning
I. Isolation II. Fragmentation
III. Scanning
Storage
I. Mass Selection II. Fragmentation
III. Scanning

Figure 2:
NanoSpray Source
Capillary
S-LensS-Lens Exit Lens
Injection FlatapoleInter-Flatapole Lens
Orbitrap Mass Analyzer
Z Lens
HCD Collision CellC-Trap Exit Lens
C-TrapC-Trap Entrance Lens
Split Lens Quad Exit Lens Quadrupole Lens Bent Flatapole

5 2 4 .2 5 2 4 .4 5 2 4 .6 5 2 4 .8 5 2 5 .0 5 2 5 .2 5 2 5 .4 5 2 5 .6 5 2 5 .8 5 2 6 .0 5 2 6 .2 5 2 6 .4m /z
01 02 03 04 05 06 07 08 09 0
1 0 0R
ela
tive
Ab
un
da
nce
5 2 5 .2 6 8 49R=9 5 ,6 0 2
5 2 6 .26050R=9 3 ,3 0 0
5 2 4 .26477R=97,60 2
526.24 526.25 526.26 526.27 526.28 526.29m/z
0
10
20
30
40
50
60
70
80
90
100
526.26050R=93,300
526.27075R=87,000
526.24 526.25 526.26 526.27 526.28 526.29
100
526.26044R=35,900
526.27075R=32,400
Rel
ativ
e A
bund
ance
m /z
0
10
20
30
40
50
60
70
80
90
Re
lativ
e A
bu
nd
an
ce
CB eFT on eFT off
A
Figure 3:

19.315 19.320 19.325 19.330 19.335 19.340 19.345 19.350 19.355 19.360 19.365 19.370
Time (min)
0
1
2
3
4
5
6
7
8
Tota
l Int
ensi
ty [a
rb.u
.]
256 ms 64 ms 64 ms 64 ms 64 ms 64 ms 64 ms 64 ms 64 ms 64 ms 64 ms
1.06 s
accumulation time
transient length
Figure 4:
A
B
MSR = 70,000@ m/z = 200
10 MS/MSR = 17,500@ m/z = 200
Cycle 1 Cycle 2 Cycle 3
> 12 MS/MS /s

Loading...
Figure 5:
BA
C
D
400 600 800 1000 1200 1400m/z
0
20
40
60
80
100
120
Tim
e
599.0 599.5 600.0 600.5 601.0 601.5m/z
0102030405060708090
100
Rel
ativ
e A
bund
ance
3 0 0 3 5 0 4 0 0 4 5 0 5 0 0 5 5 0 6 0 0 6 5 0 7 0 0 7 5 0 8 0 0 8 5 0
m /z
0
1 0
2 0
3 0
4 0
5 0
6 0
7 0
8 0
9 0
1 0 0
Re
lativ
e A
bu
nd
an
ce
4 5 3 .7 2 1 5 9
798.0 798.5 799.0 799.5 800.0 800.5 801.0 801.5m/z
0102030405060708090
100
Rel
ativ
e A
bund
ance
*
AVTEQGHELSNEER
y2
b4
b3-NH3
b3
b2
a2
y4
y1
y4-NH3H
TE
y6
y5
y7
y11 y12
y122+
y102+
y82+
[y10-NH3]2+
y10
y9
y8
y10-NH3
y11-H2O y10-H2O
y8-NH3
b9
b4-NH3 b4-H2O
y7-H2O
y1-NH3
1 0 0 2 0 0 3 0 0 4 0 0 5 0 0 6 0 0 7 0 0 8 0 0 9 0 0 1 0 0 0 1 1 0 0 1 2 0 0 1 3 0 0 1 4 0 0 1 5 0 0 1 6 0 0
m /z
0
1 0
2 0
3 0
4 0
5 0
6 0
7 0
8 0
9 0
1 0 0
Re
lativ
e A
bu
nd
an
ce
*
b8
770 780 790 800 810 820 830
m/z
12.8
13.0
13.2
13.4
13.6
13.8
14.0
Tim
e Loading...

Figure 6
A.
m/zt
t
12C
13C
12C
13C
m/zt
B. C. D.Full range MS scans Triplex SIM scans
I. Mass Selection II. Storage
III. Scanning
SIM 1 2 3
m/z

Figure 7
B.
A.
100 200 300 400 500 600 700 800 900 1000 1100 1200 1300m/z
0102030405060708090
100
Rel
ativ
e A
bund
ance
AGLAPLEVRSRLGDLYEEEMRy1
y2
y3y4 y5
y6y9 y10
y7
b8b7b6
b5
b2 - NH3
b9b10
y2
y3y4
y5
y6b3
y1
[M+H]2+
I. Mass Selection II. Fragmentation+ Storage
III. Scanning
MS/MS
m/z