maryland’s motorcycle crash picture - atsip · pdf file31.10.2012 ·...
TRANSCRIPT
Maryland’s Motorcycle Crash Picture
Cindy Burch University of Maryland, Baltimore
National Study Center for Trauma and EMS
Maryland Center for Traffic Safety Analysis
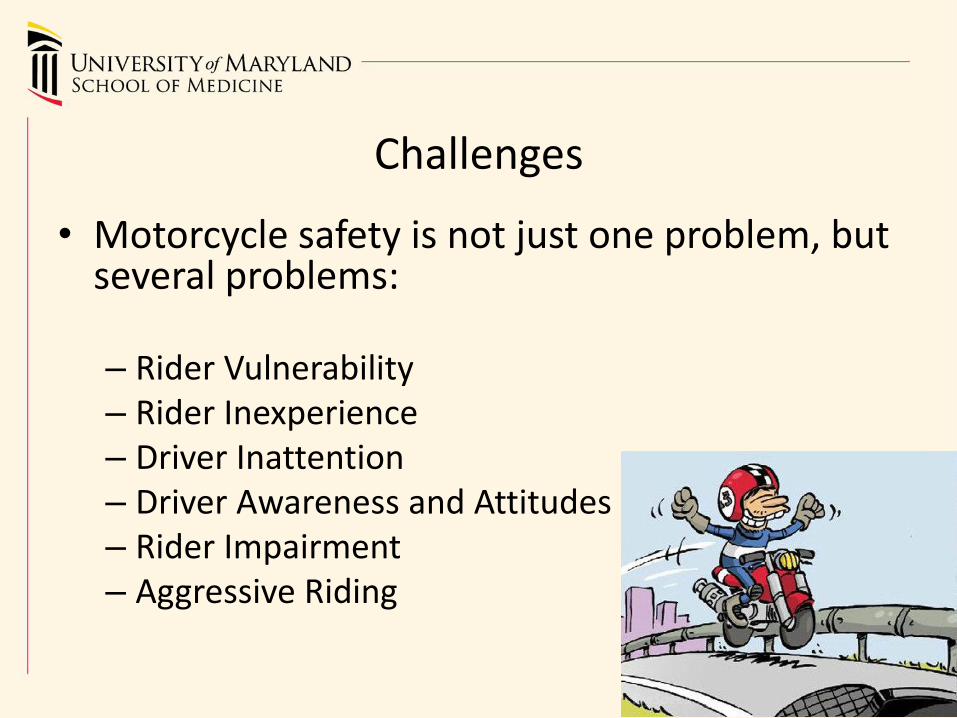
• Motorcycle safety is not just one problem, but several problems:
– Rider Vulnerability – Rider Inexperience – Driver Inattention – Driver Awareness and Attitudes – Rider Impairment – Aggressive Riding
Challenges
Complex Issue
• Exposure data
– Licensed riders?
– Registered motorcycles?
– Miles traveled?? Years experience??
• Accurate data capture
– Crash reports
– Moving violations
Outline • Overview • Traffic Records Data in Maryland
– Statistical Overview – Crash Outcome Data Evaluation System (CODES)
• Previous research studies – Motorcycle type – Helmet study
• Ongoing studies – Promising practices – Behavioral surveys
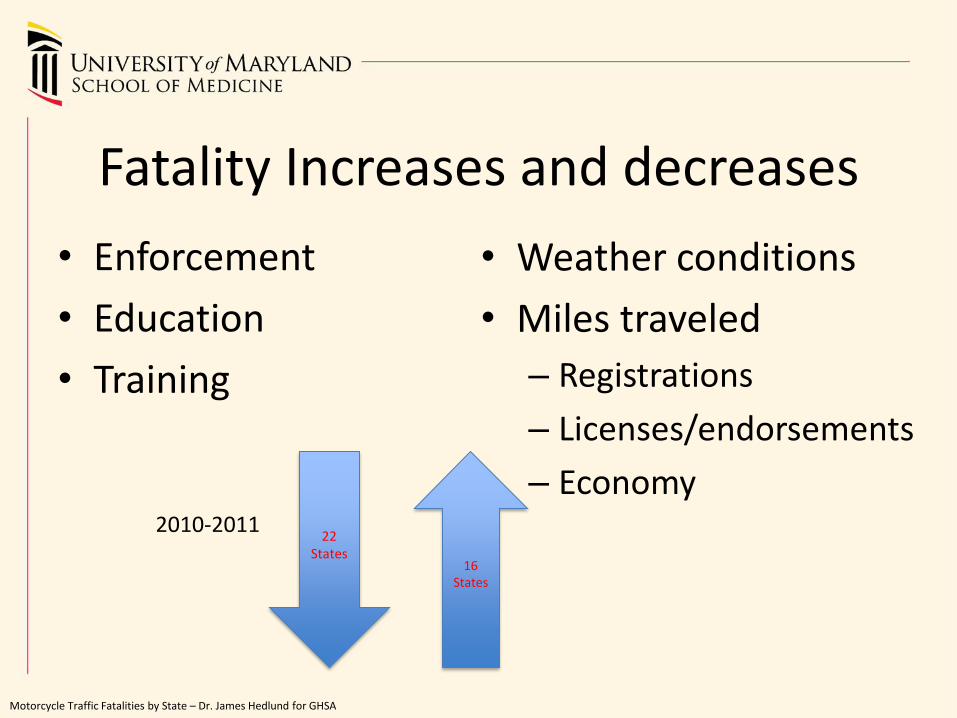
Fatality Increases and decreases
• Enforcement
• Education
• Training
• Weather conditions
• Miles traveled
– Registrations
– Licenses/endorsements
– Economy
Motorcycle Traffic Fatalities by State – Dr. James Hedlund for GHSA
22 States
16 States
2010-2011
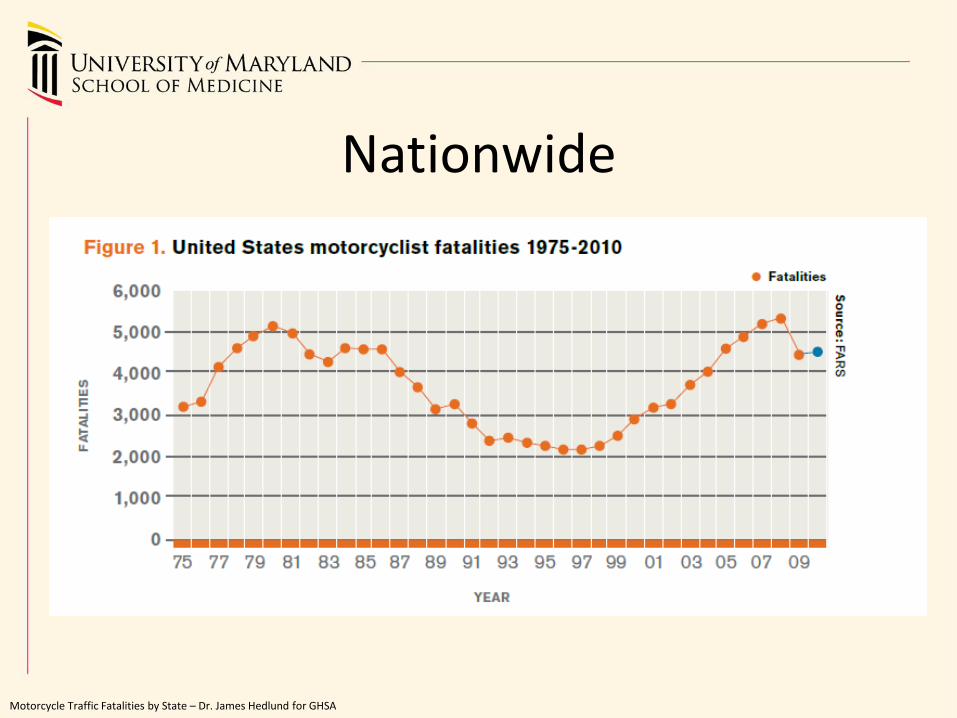
Nationwide
Motorcycle Traffic Fatalities by State – Dr. James Hedlund for GHSA
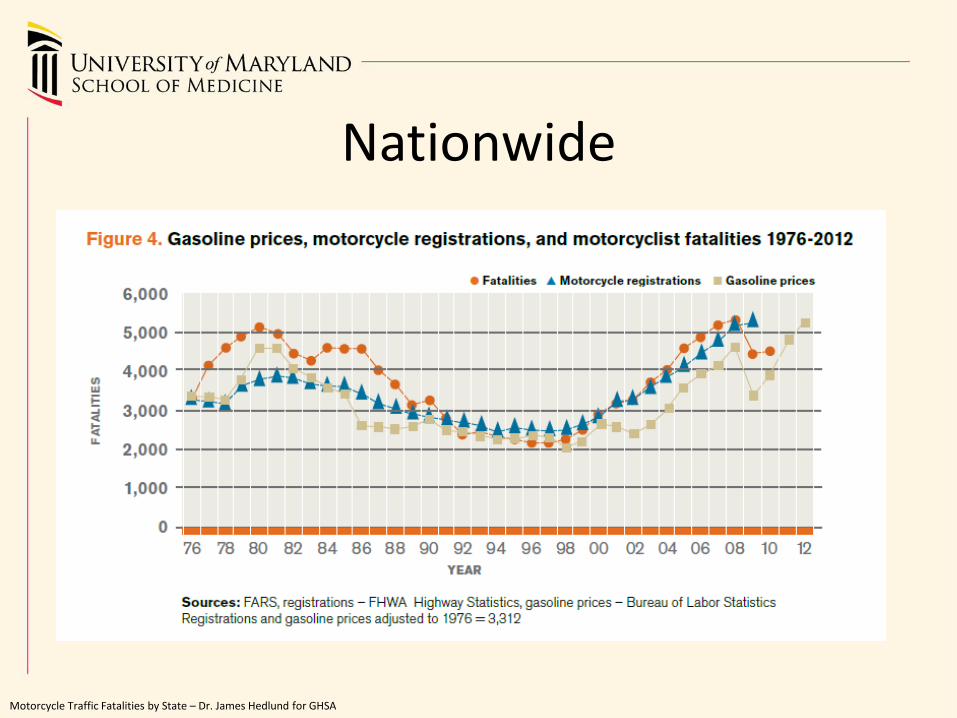
Nationwide
Motorcycle Traffic Fatalities by State – Dr. James Hedlund for GHSA
Statistical Overview of Maryland Motorcycle Crashes
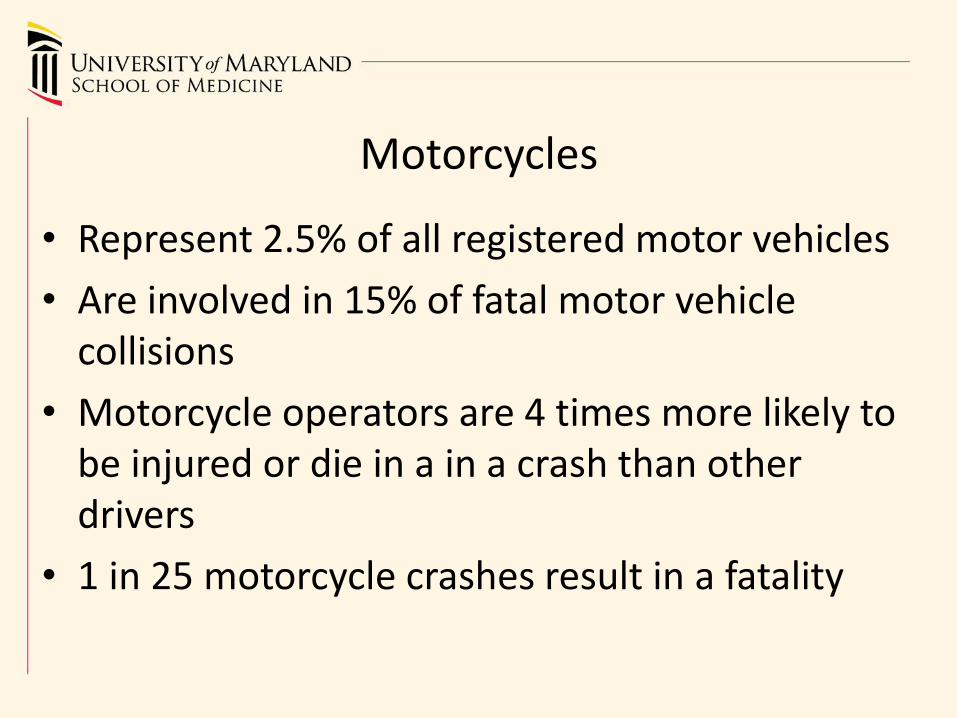
• Represent 2.5% of all registered motor vehicles
• Are involved in 15% of fatal motor vehicle collisions
• Motorcycle operators are 4 times more likely to be injured or die in a in a crash than other drivers
• 1 in 25 motorcycle crashes result in a fatality
Motorcycles
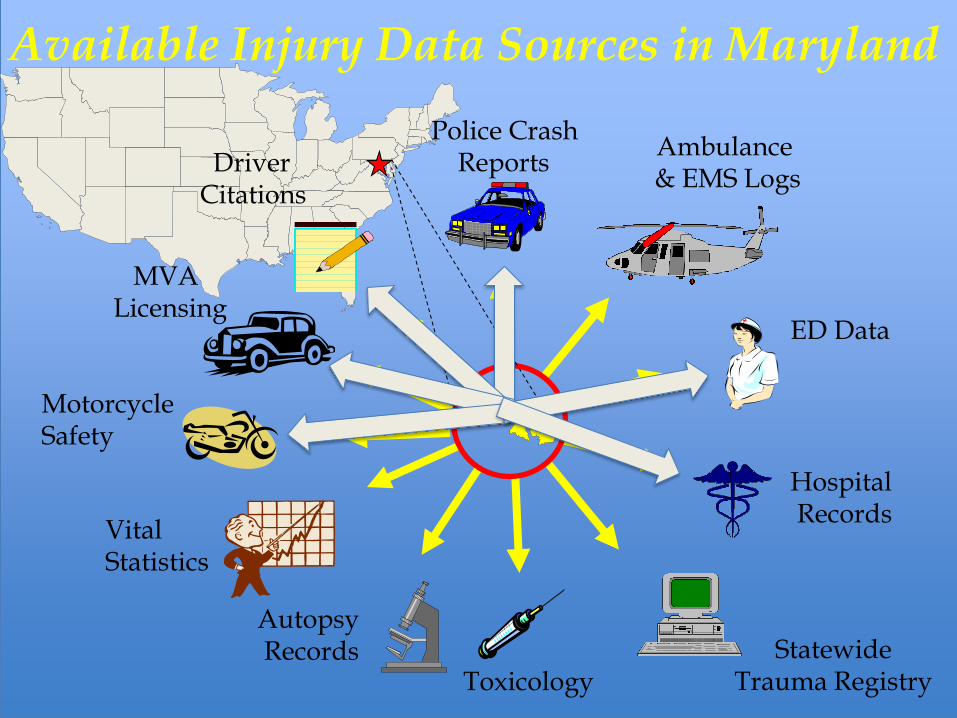
Hospital Records
Autopsy Records Statewide
Trauma Registry
Ambulance & EMS Logs
Police Crash Reports
Vital Statistics
ED Data
MVA Licensing
Driver Citations
Toxicology
Available Injury Data Sources in Maryland
Motorcycle Safety
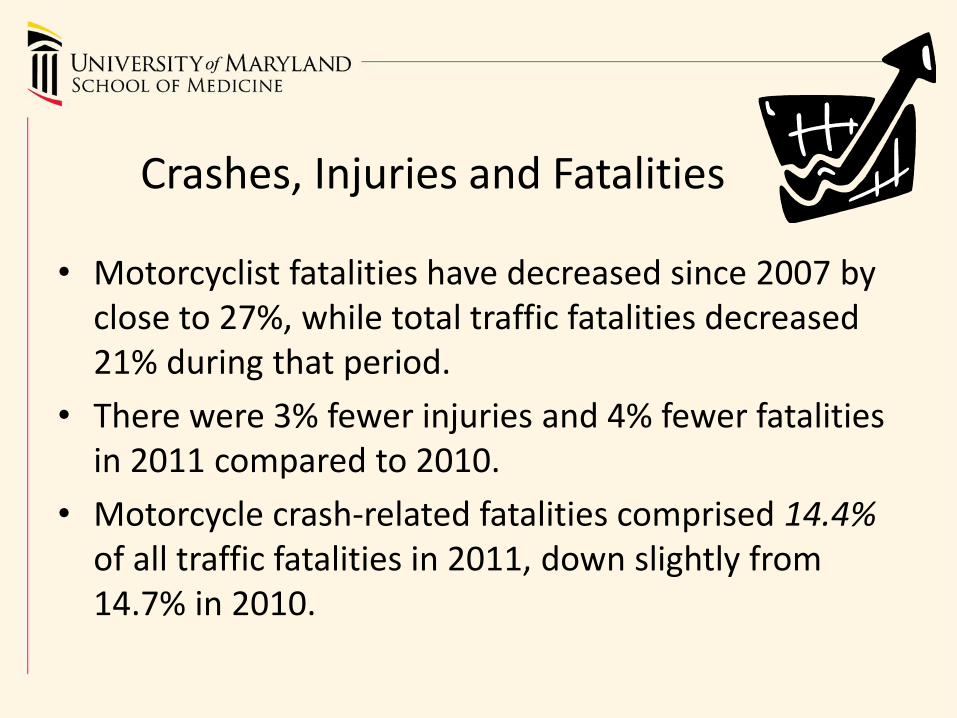
Crashes, Injuries and Fatalities
• Motorcyclist fatalities have decreased since 2007 by close to 27%, while total traffic fatalities decreased 21% during that period.
• There were 3% fewer injuries and 4% fewer fatalities in 2011 compared to 2010.
• Motorcycle crash-related fatalities comprised 14.4% of all traffic fatalities in 2011, down slightly from 14.7% in 2010.
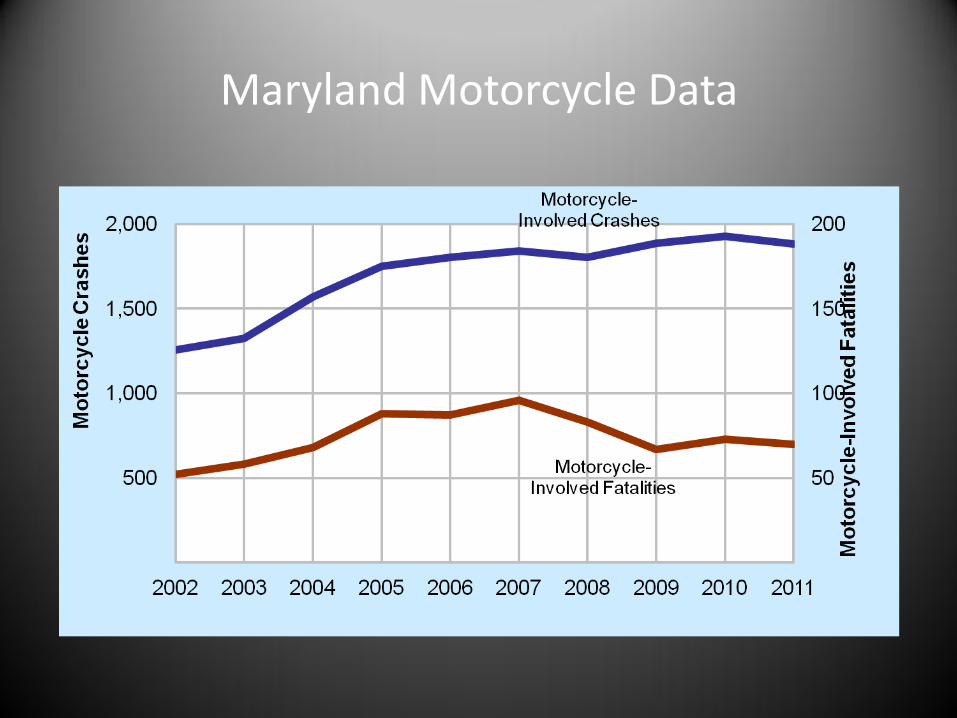
Maryland Motorcycle Data
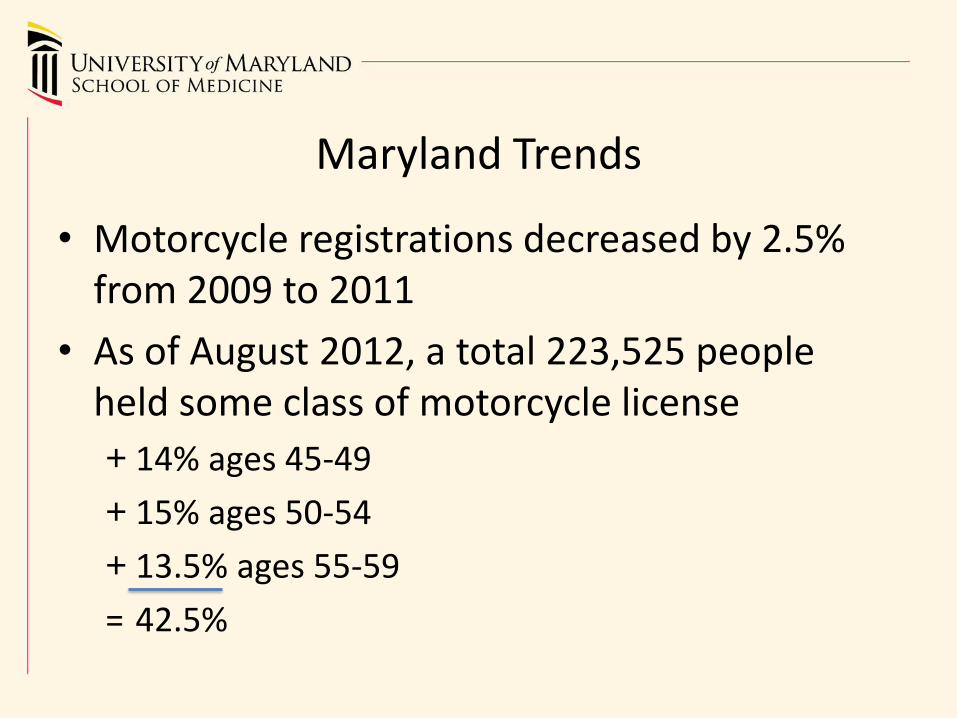
• Motorcycle registrations decreased by 2.5% from 2009 to 2011
• As of August 2012, a total 223,525 people held some class of motorcycle license
+ 14% ages 45-49
+ 15% ages 50-54
+ 13.5% ages 55-59
= 42.5%
Maryland Trends
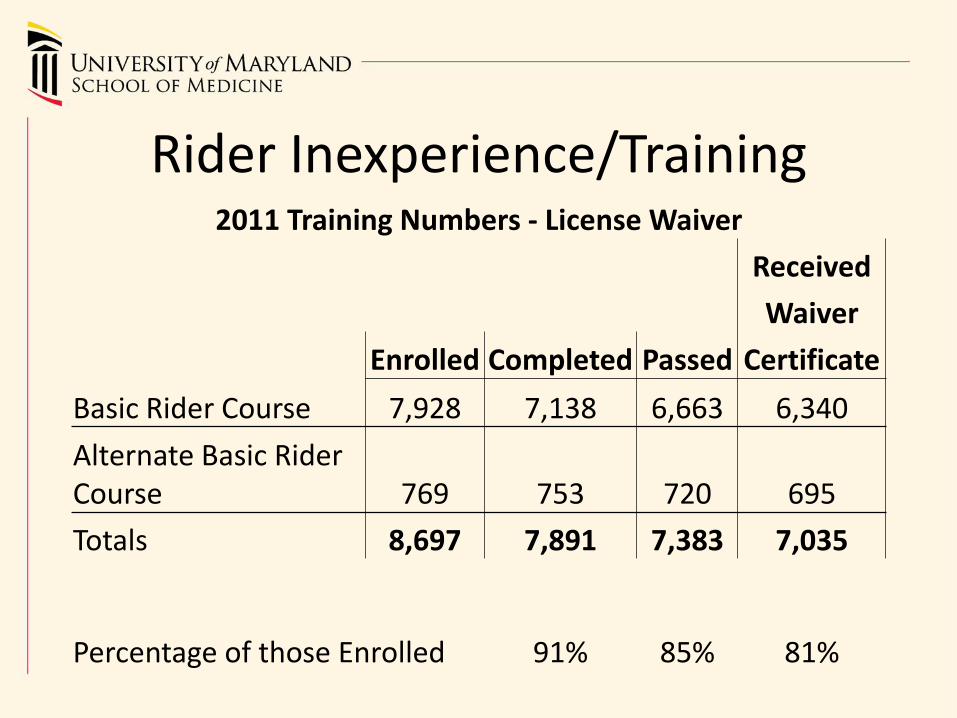
2011 Training Numbers - License Waiver
Received
Waiver
Enrolled Completed Passed Certificate
Basic Rider Course 7,928 7,138 6,663 6,340
Alternate Basic Rider Course 769 753 720 695
Totals 8,697 7,891 7,383 7,035
Percentage of those Enrolled 91% 85% 81%
Rider Inexperience/Training
100
200
300
400
500
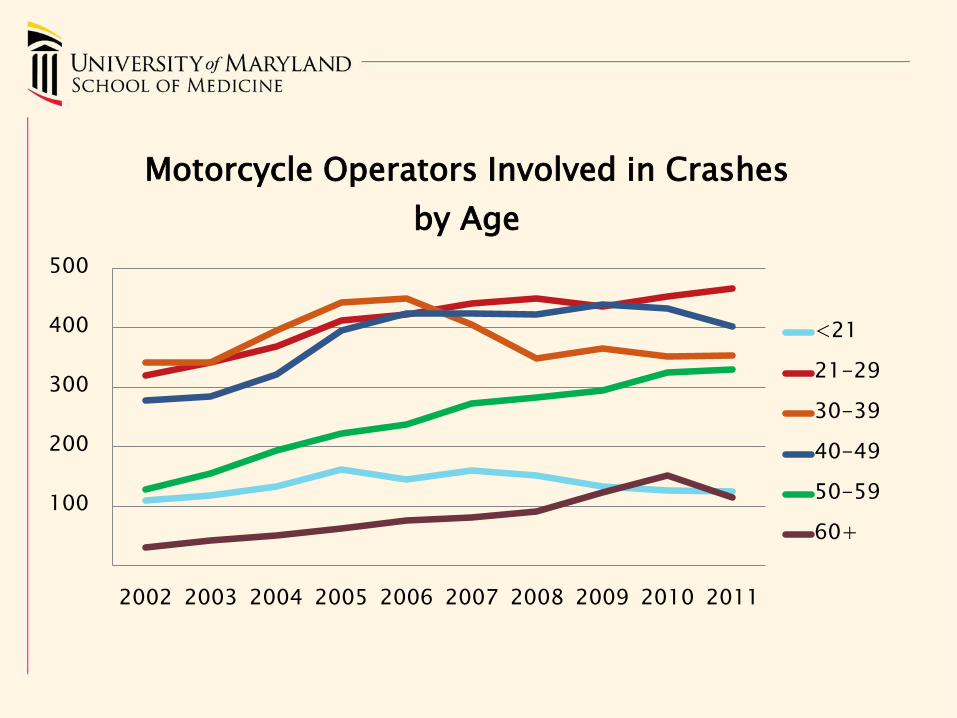
2002 2003 2004 2005 2006 2007 2008 2009 2010 2011
Motorcycle Operators Involved in Crashes
by Age
<21
21-29
30-39
40-49
50-59
60+
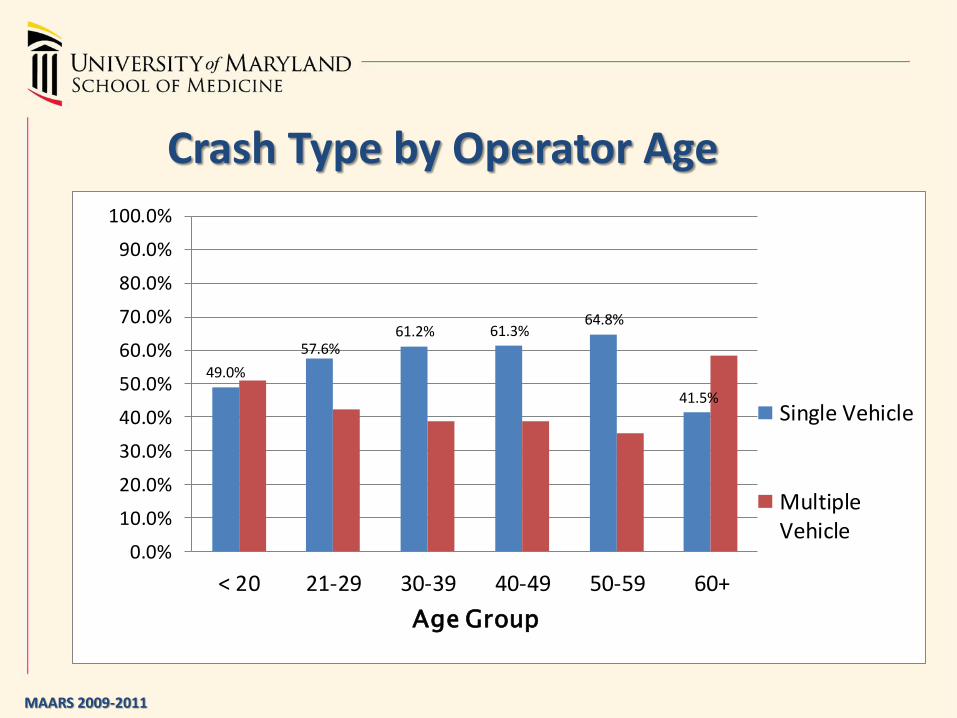
Crash Type by Operator Age
49.0%
57.6%61.2% 61.3%
64.8%
41.5%
0.0%
10.0%
20.0%
30.0%
40.0%
50.0%
60.0%
70.0%
80.0%
90.0%
100.0%
< 20 21-29 30-39 40-49 50-59 60+
Age Group
Single Vehicle
MultipleVehicle
MAARS 2009-2011
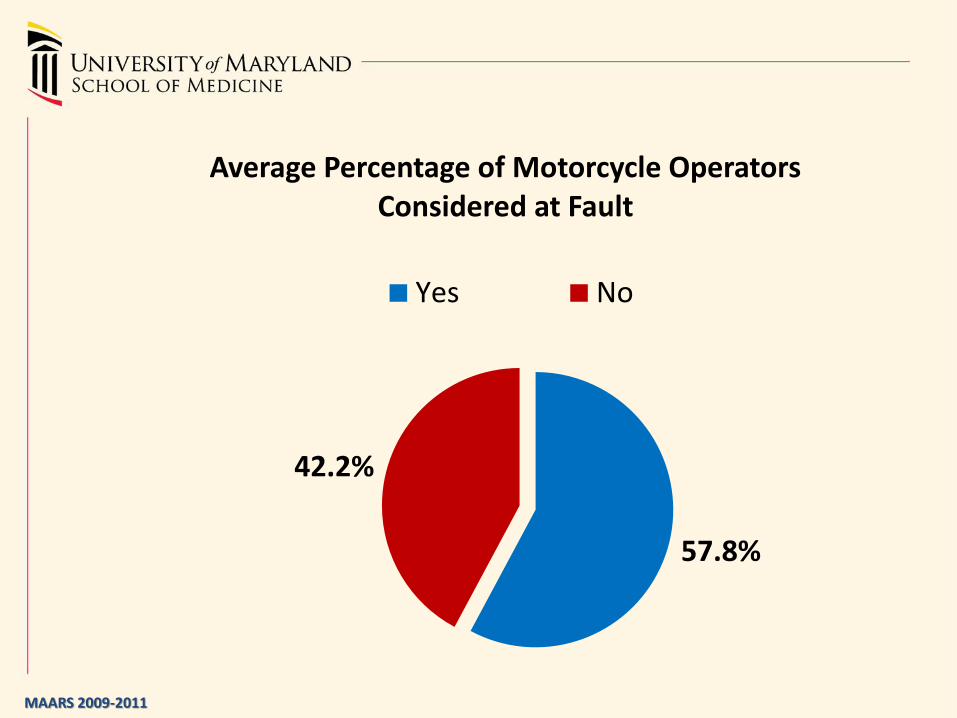
57.8%
42.2%
Average Percentage of Motorcycle Operators Considered at Fault
Yes No
MAARS 2009-2011
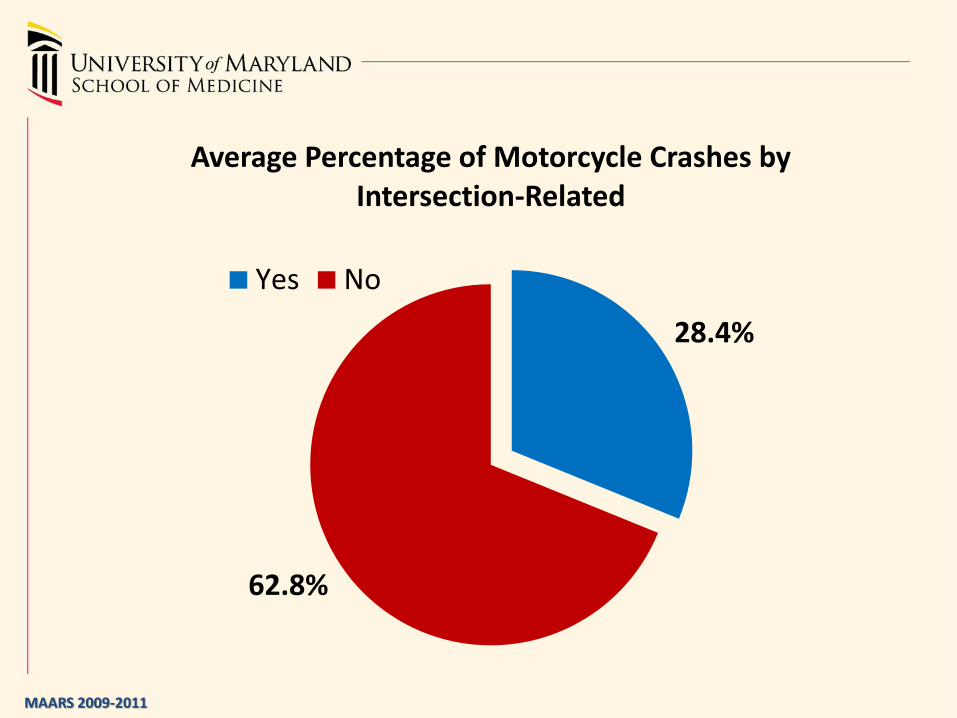
28.4%
62.8%
Average Percentage of Motorcycle Crashes by Intersection-Related
Yes No
MAARS 2009-2011
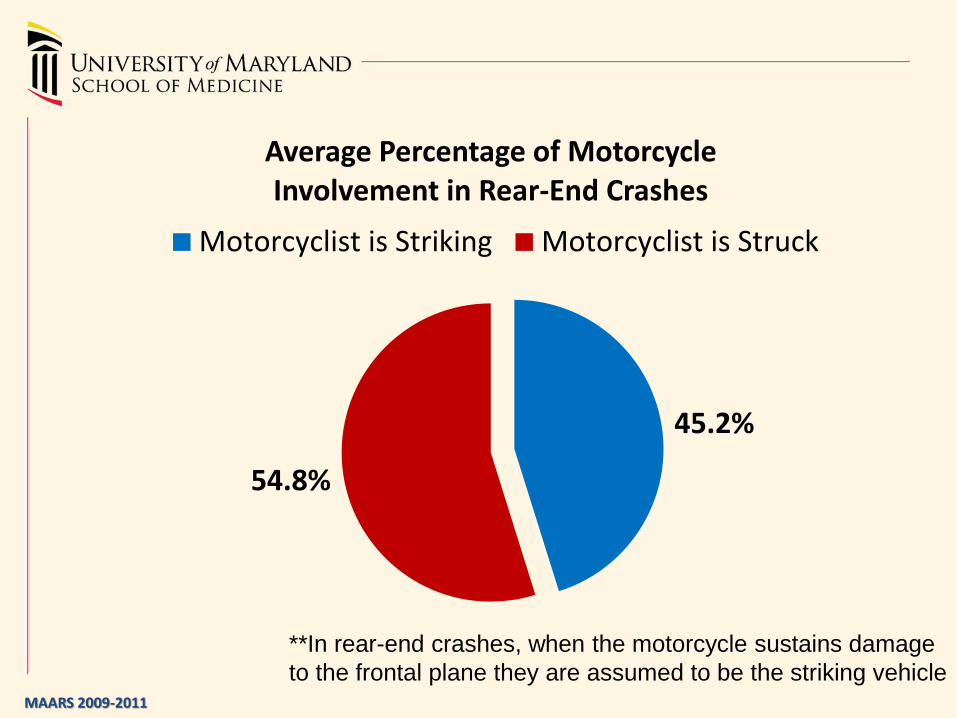
**In rear-end crashes, when the motorcycle sustains damage
to the frontal plane they are assumed to be the striking vehicle
45.2%
54.8%
Average Percentage of Motorcycle Involvement in Rear-End Crashes
Motorcyclist is Striking Motorcyclist is Struck
MAARS 2009-2011
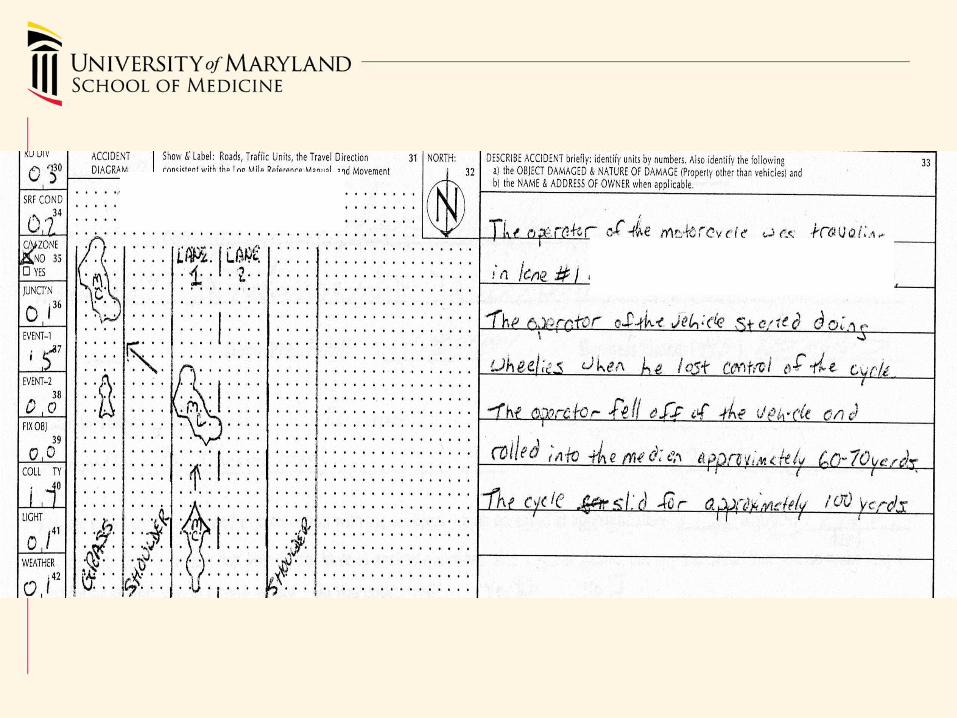
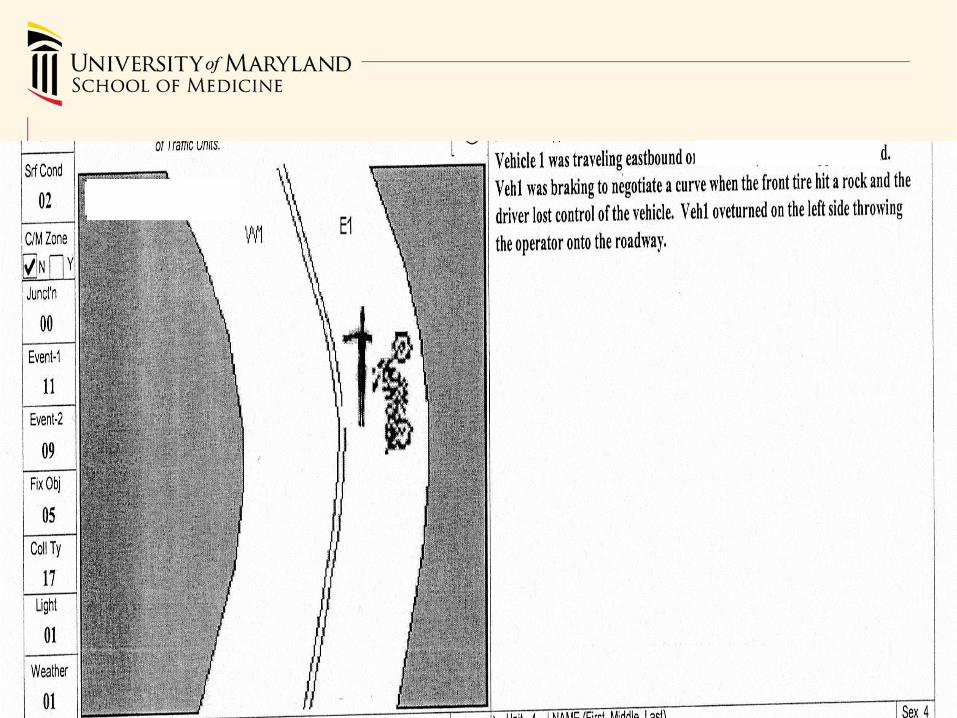
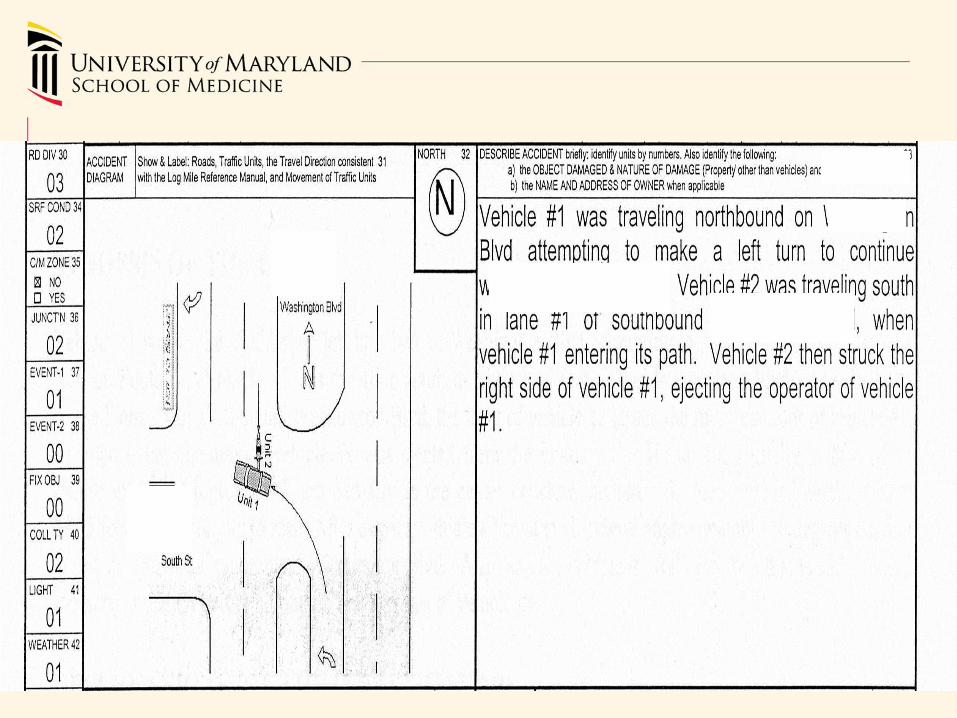
• From 2009-2011, there were 175 same direction, left turn crashes involving motorcycles.
• In those crashes, the motorcycle was moving at a constant speed, accelerating, slowing or stopping, or passing in 80% of the crashes.
• The motorcycle was only turning left in 7% of those crashes.
Crash Information
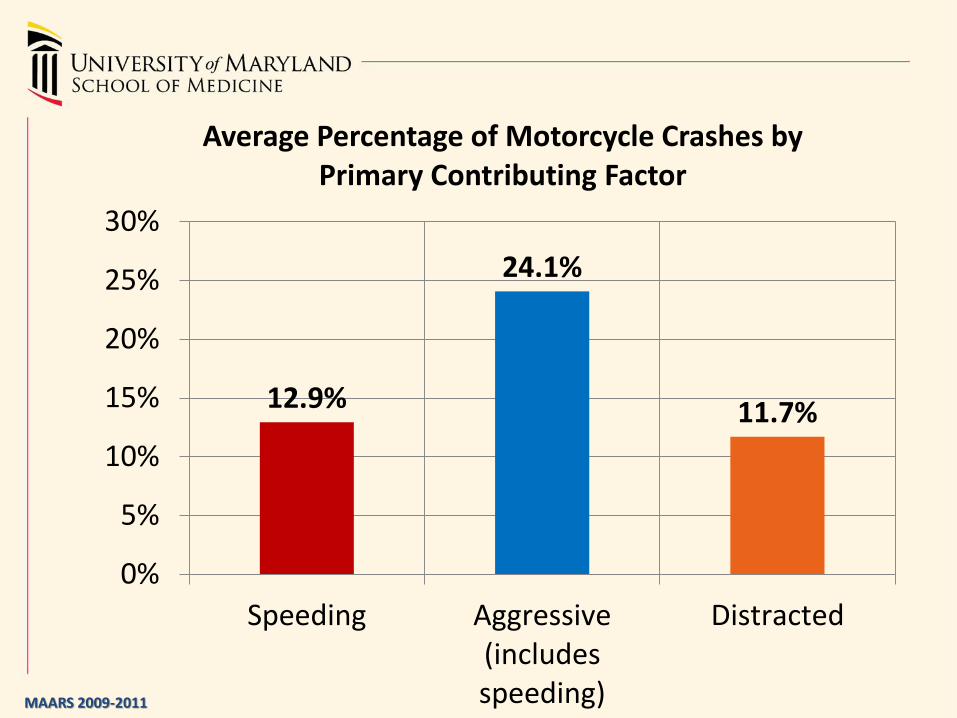
12.9%
24.1%
11.7%
0%
5%
10%
15%
20%
25%
30%
Speeding Aggressive(includesspeeding)
Distracted
Average Percentage of Motorcycle Crashes by Primary Contributing Factor
MAARS 2009-2011
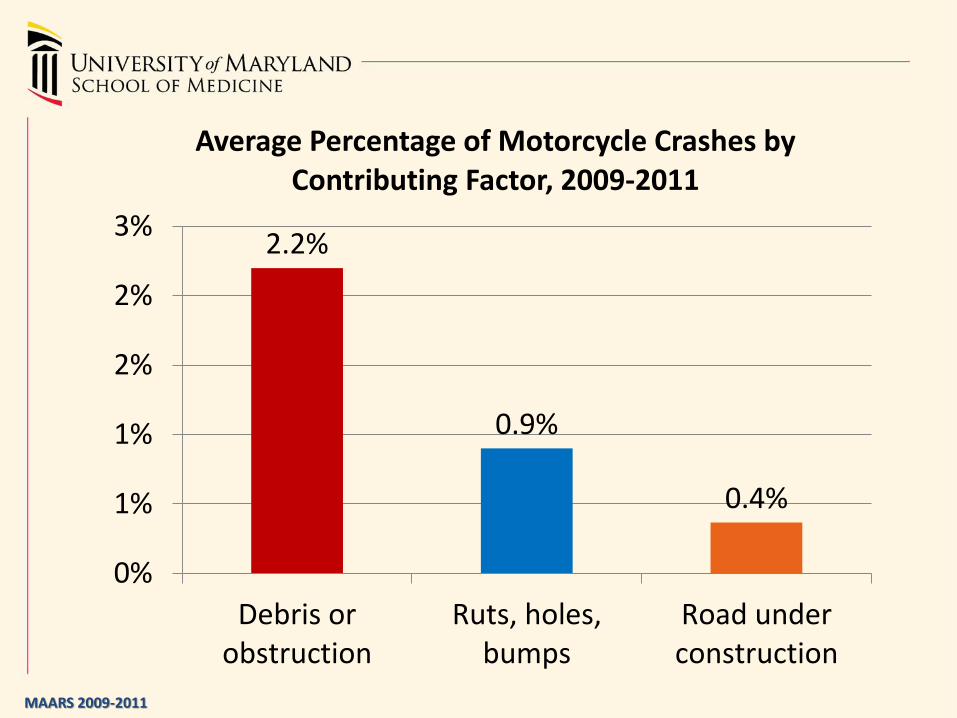
2.2%
0.9%
0.4%
0%
1%
1%
2%
2%
3%
Debris orobstruction
Ruts, holes,bumps
Road underconstruction
Average Percentage of Motorcycle Crashes by Contributing Factor, 2009-2011
MAARS 2009-2011
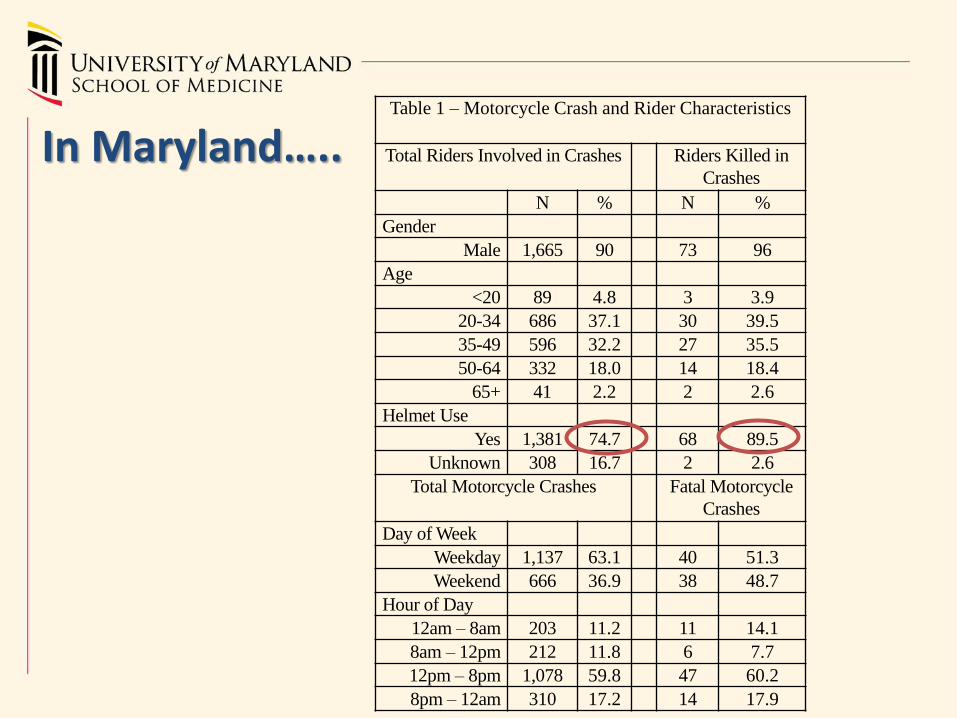
Table 1 – Motorcycle Crash and Rider Characteristics
Total Riders Involved in Crashes Riders Killed in
Crashes
N % N %
Gender
Male 1,665 90 73 96
Age
<20 89 4.8 3 3.9
20-34 686 37.1 30 39.5
35-49 596 32.2 27 35.5
50-64 332 18.0 14 18.4
65+ 41 2.2 2 2.6
Helmet Use
Yes 1,381 74.7 68 89.5
Unknown 308 16.7 2 2.6
Total Motorcycle Crashes Fatal Motorcycle
Crashes
Day of Week
Weekday 1,137 63.1 40 51.3
Weekend 666 36.9 38 48.7
Hour of Day
12am – 8am 203 11.2 11 14.1
8am – 12pm 212 11.8 6 7.7
12pm – 8pm 1,078 59.8 47 60.2
8pm – 12am 310 17.2 14 17.9
In Maryland…..
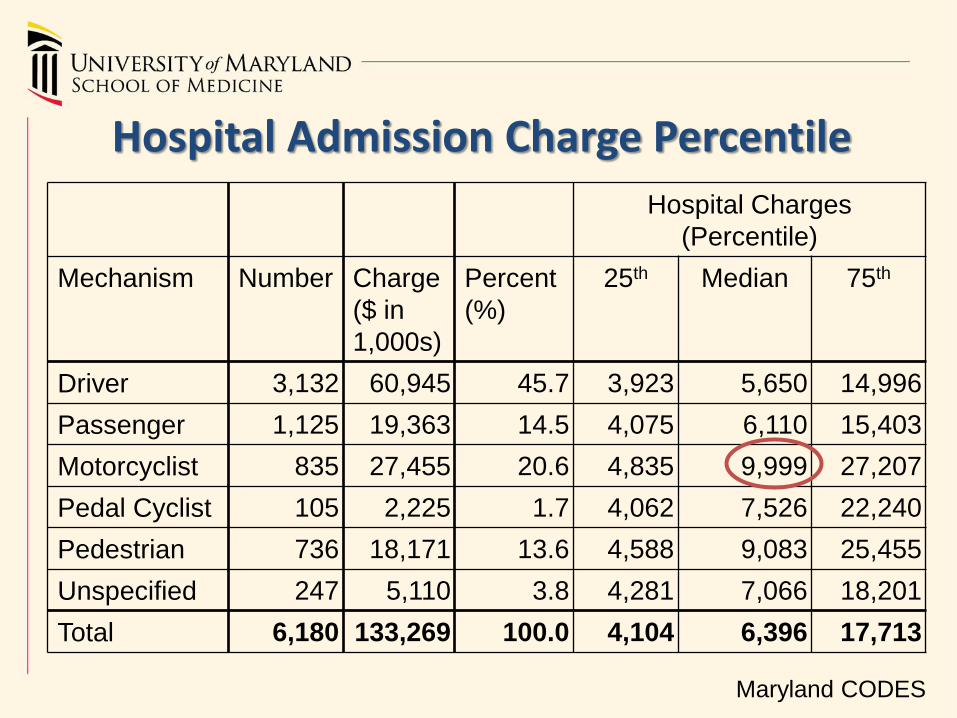
Hospital Admission Charge Percentile
Hospital Charges
(Percentile)
Mechanism Number Charge
($ in
1,000s)
Percent
(%)
25th Median 75th
Driver 3,132 60,945 45.7 3,923 5,650 14,996
Passenger 1,125 19,363 14.5 4,075 6,110 15,403
Motorcyclist 835 27,455 20.6 4,835 9,999 27,207
Pedal Cyclist 105 2,225 1.7 4,062 7,526 22,240
Pedestrian 736 18,171 13.6 4,588 9,083 25,455
Unspecified 247 5,110 3.8 4,281 7,066 18,201
Total 6,180 133,269 100.0 4,104 6,396 17,713
Maryland CODES
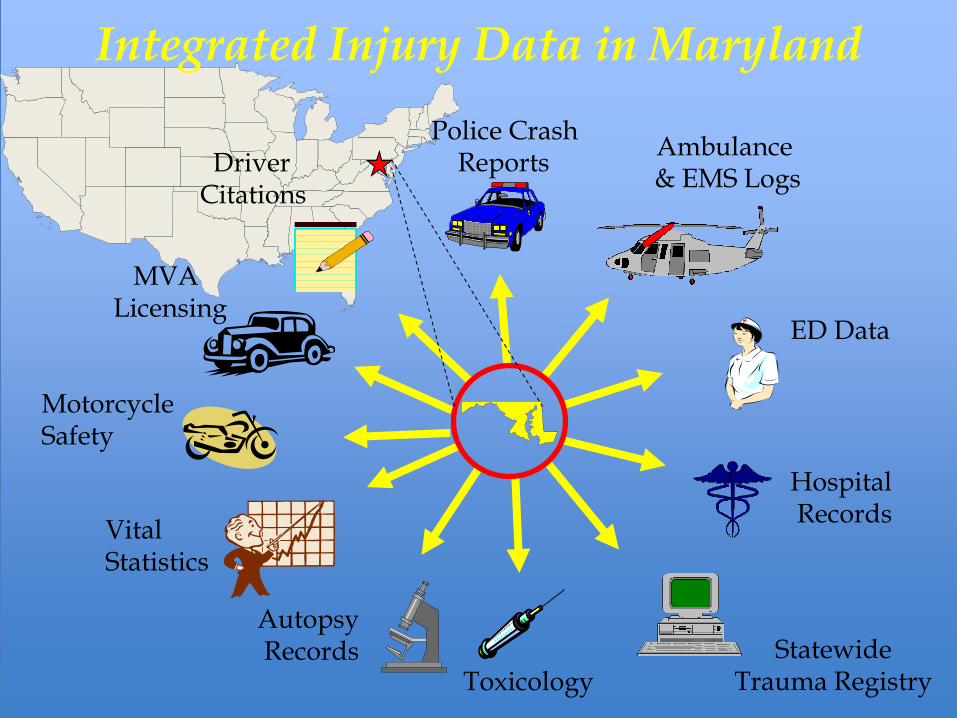
Hospital Records
Autopsy Records Statewide
Trauma Registry
Ambulance & EMS Logs
Police Crash Reports
Vital Statistics
ED Data
MVA Licensing
Driver Citations
Toxicology
Integrated Injury Data in Maryland
Motorcycle Safety
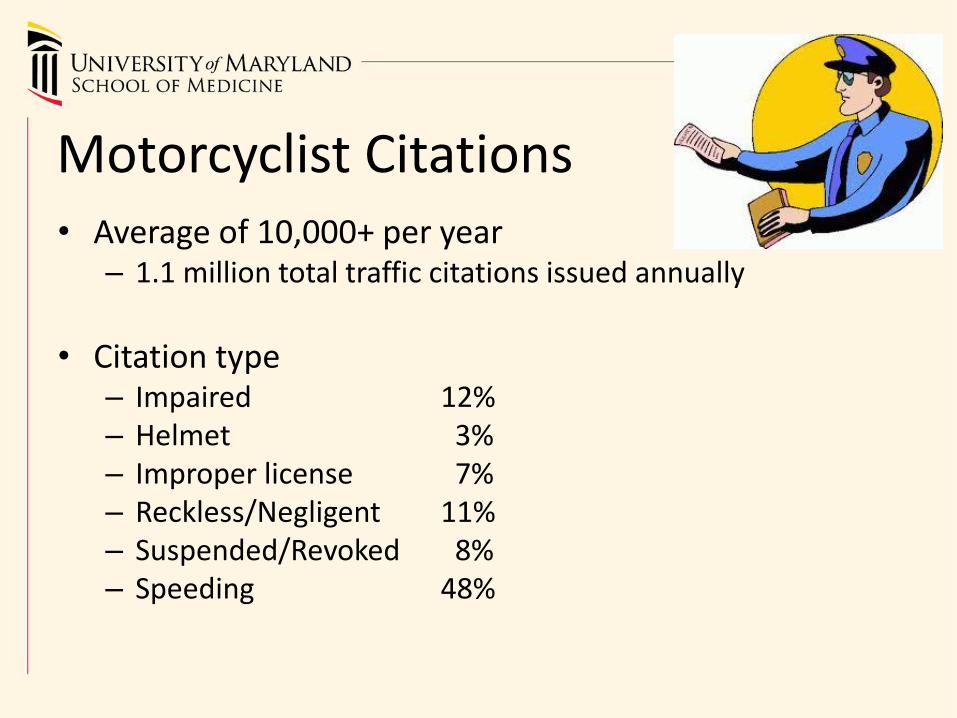
Motorcyclist Citations • Average of 10,000+ per year
– 1.1 million total traffic citations issued annually
• Citation type
– Impaired 12% – Helmet 3% – Improper license 7% – Reckless/Negligent 11% – Suspended/Revoked 8% – Speeding 48%
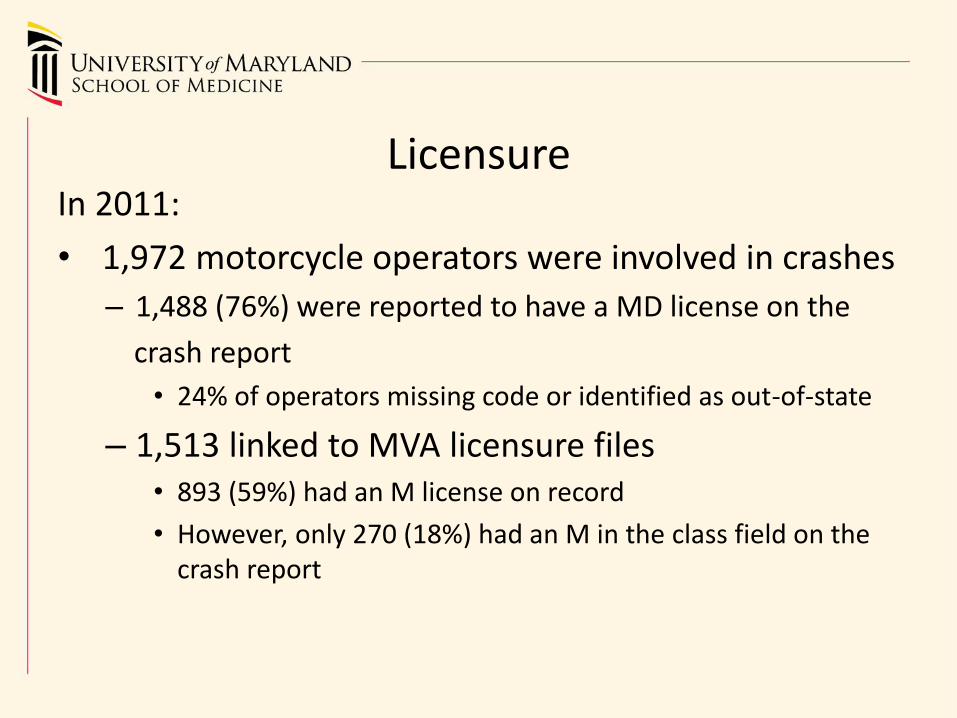
In 2011:
• 1,972 motorcycle operators were involved in crashes
– 1,488 (76%) were reported to have a MD license on the
crash report
• 24% of operators missing code or identified as out-of-state
– 1,513 linked to MVA licensure files • 893 (59%) had an M license on record
• However, only 270 (18%) had an M in the class field on the crash report
Licensure

Previous Research Studies

Motorcycle Body Type
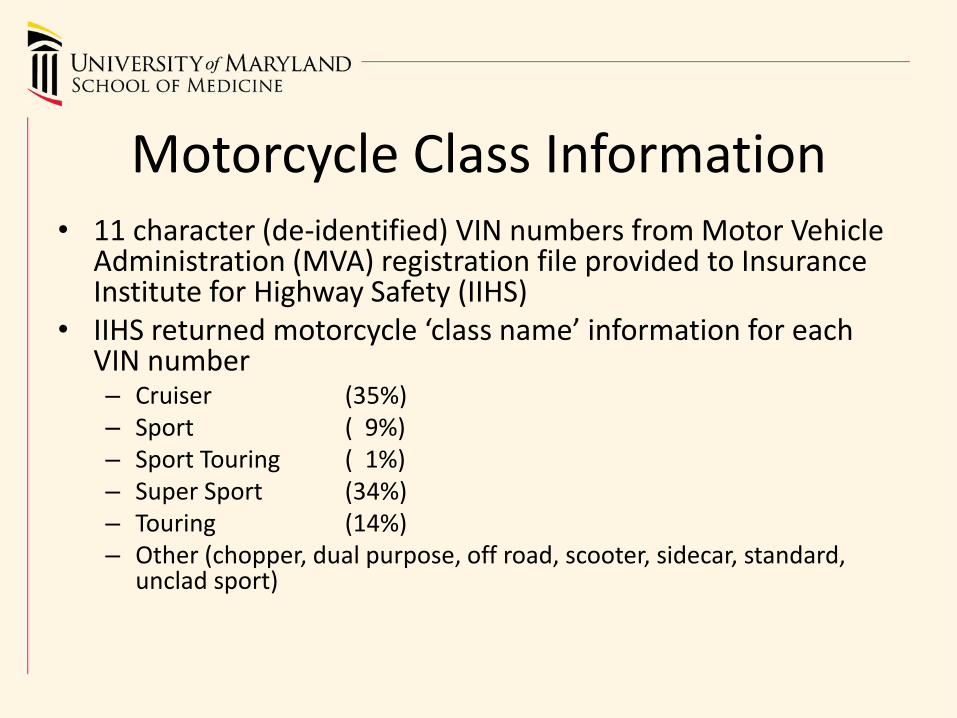
Motorcycle Class Information • 11 character (de-identified) VIN numbers from Motor Vehicle
Administration (MVA) registration file provided to Insurance Institute for Highway Safety (IIHS)
• IIHS returned motorcycle ‘class name’ information for each VIN number – Cruiser (35%) – Sport ( 9%) – Sport Touring ( 1%) – Super Sport (34%) – Touring (14%) – Other (chopper, dual purpose, off road, scooter, sidecar, standard,
unclad sport)
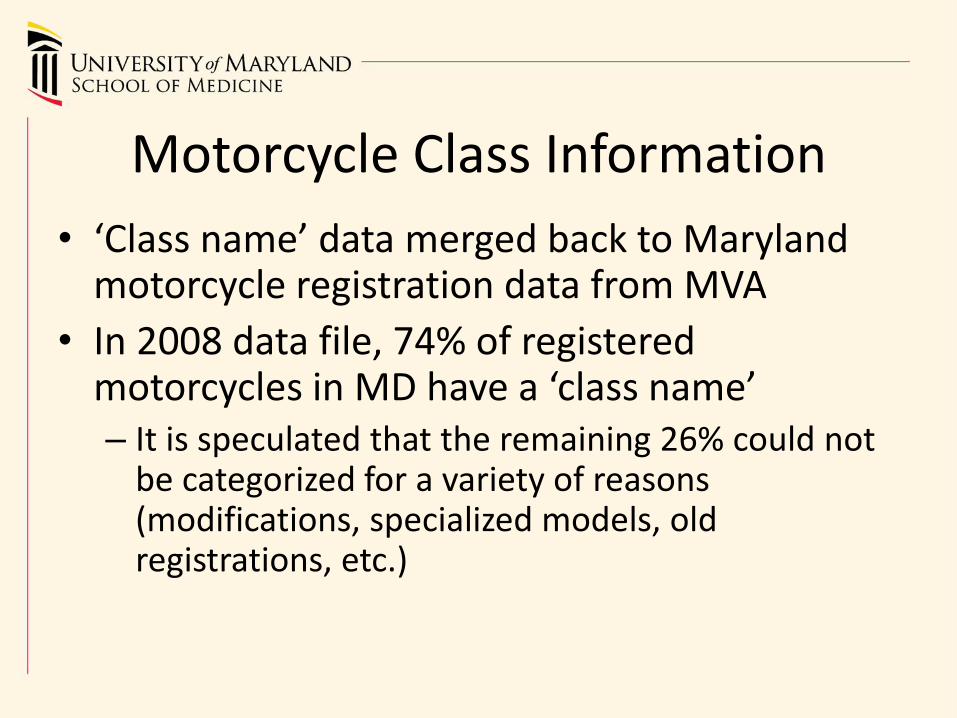
Motorcycle Class Information
• ‘Class name’ data merged back to Maryland motorcycle registration data from MVA
• In 2008 data file, 74% of registered motorcycles in MD have a ‘class name’ – It is speculated that the remaining 26% could not
be categorized for a variety of reasons (modifications, specialized models, old registrations, etc.)
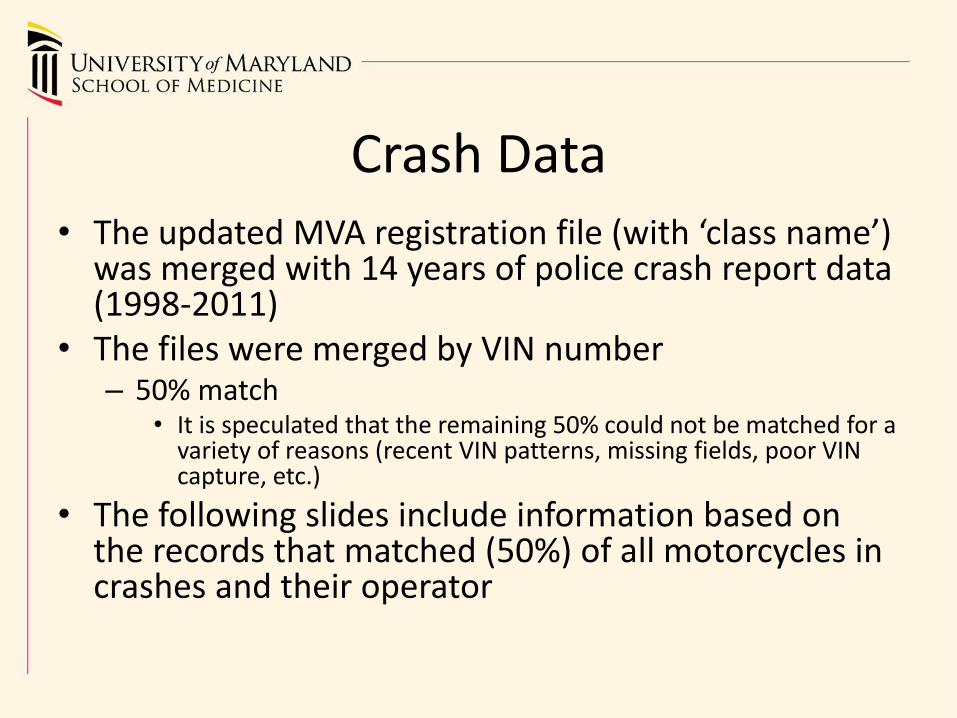
Crash Data • The updated MVA registration file (with ‘class name’)
was merged with 14 years of police crash report data (1998-2011)
• The files were merged by VIN number – 50% match
• It is speculated that the remaining 50% could not be matched for a variety of reasons (recent VIN patterns, missing fields, poor VIN capture, etc.)
• The following slides include information based on the records that matched (50%) of all motorcycles in crashes and their operator
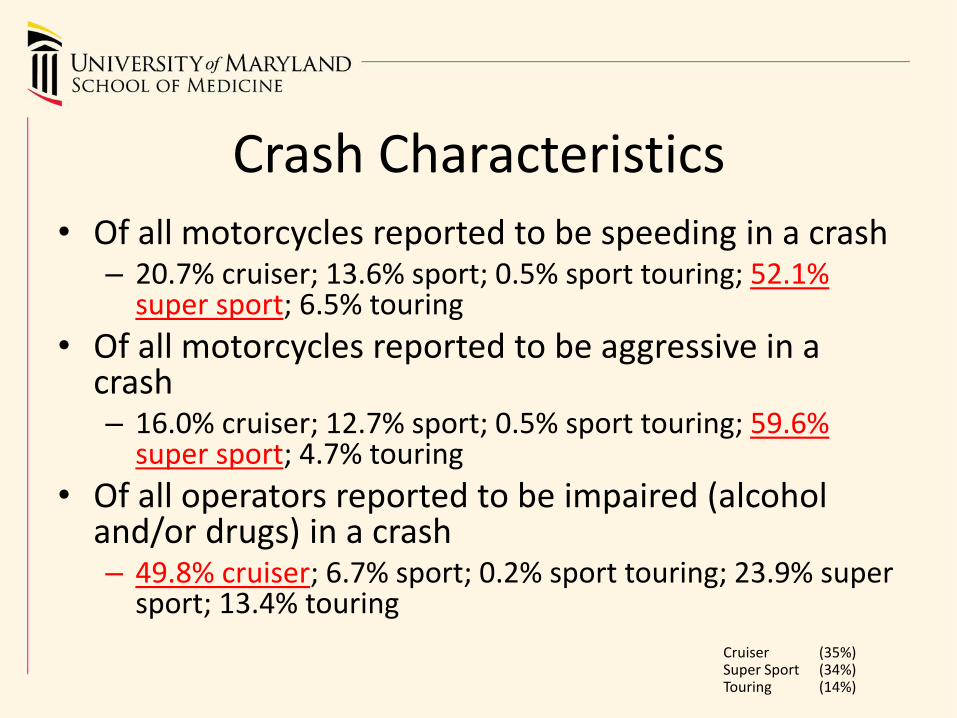
Crash Characteristics • Of all motorcycles reported to be speeding in a crash
– 20.7% cruiser; 13.6% sport; 0.5% sport touring; 52.1% super sport; 6.5% touring
• Of all motorcycles reported to be aggressive in a crash – 16.0% cruiser; 12.7% sport; 0.5% sport touring; 59.6%
super sport; 4.7% touring
• Of all operators reported to be impaired (alcohol and/or drugs) in a crash – 49.8% cruiser; 6.7% sport; 0.2% sport touring; 23.9% super
sport; 13.4% touring
Cruiser (35%) Super Sport (34%) Touring (14%)
How well do helmets work to prevent deaths?
• Very well – can't prevent all deaths
• Reduce the chances of a traumatic brain injury
• Some helmets are not certified & will not provide protection
Estimated effectiveness of helmets
• 37%-41% effective at reducing fatal injuries (NHTSA, 2011)
• Estimated 1,829 lives saved in 2010
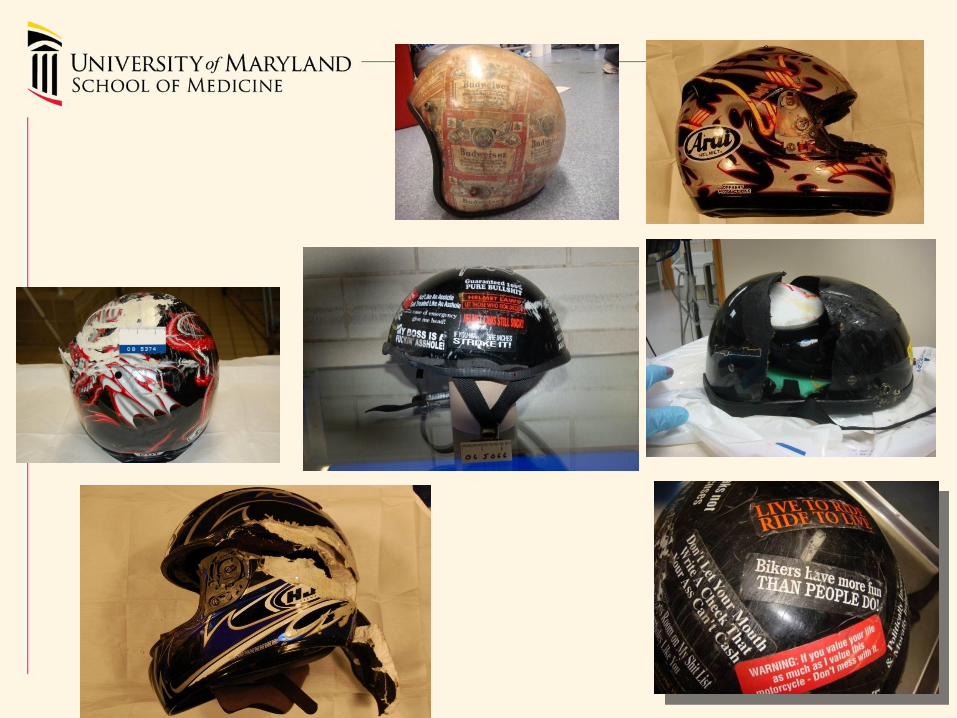
Motorcycle Helmet Study
• 2007-2009 (n=189)
• 94% men
• 76% white
• Education
– 21%<12th grade
– 27% High School, GED
– 23% Some College
– 22% College Graduate or higher
Characteristics of Motorcycle Operators
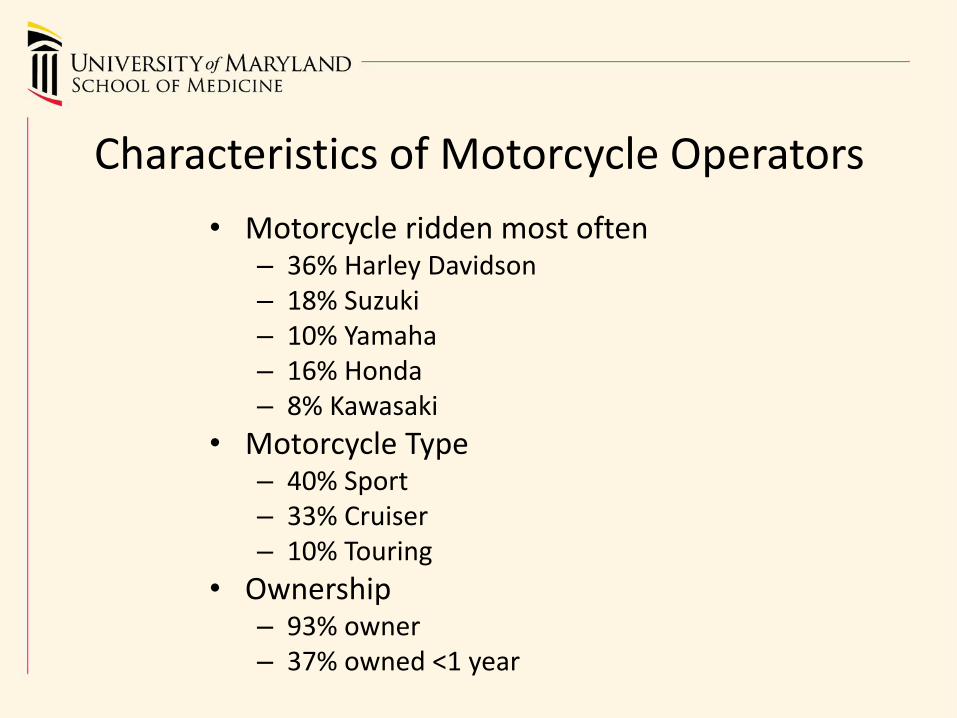
• Motorcycle ridden most often – 36% Harley Davidson – 18% Suzuki – 10% Yamaha – 16% Honda – 8% Kawasaki
• Motorcycle Type – 40% Sport – 33% Cruiser – 10% Touring
• Ownership – 93% owner – 37% owned <1 year
Characteristics of Motorcycle Operators
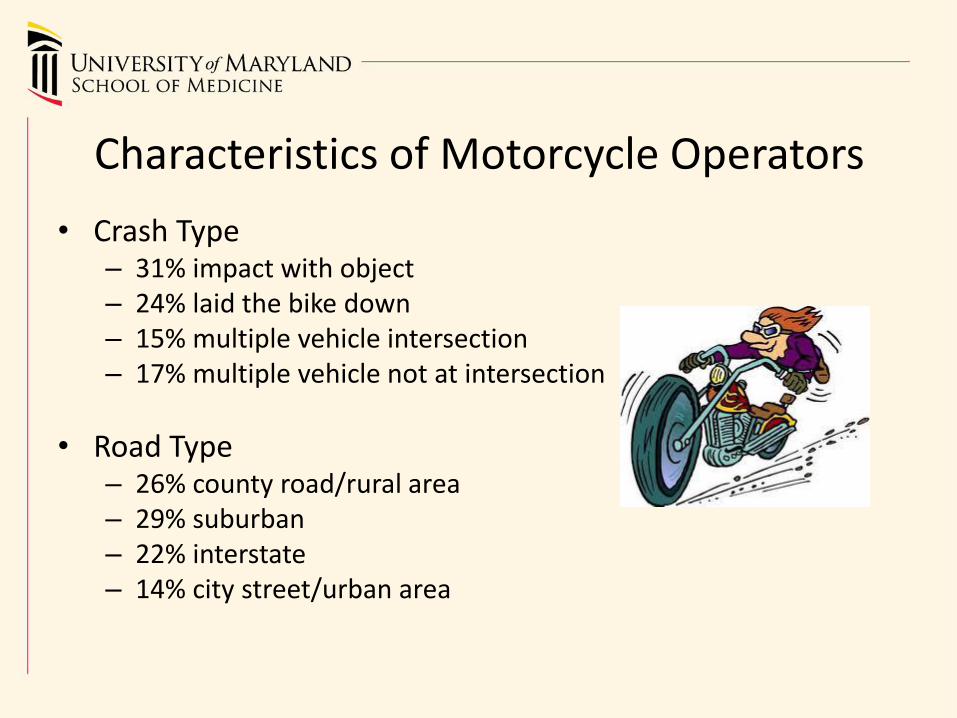
• Crash Type – 31% impact with object – 24% laid the bike down – 15% multiple vehicle intersection – 17% multiple vehicle not at intersection
• Road Type – 26% county road/rural area – 29% suburban – 22% interstate – 14% city street/urban area
Characteristics of Motorcycle Operators
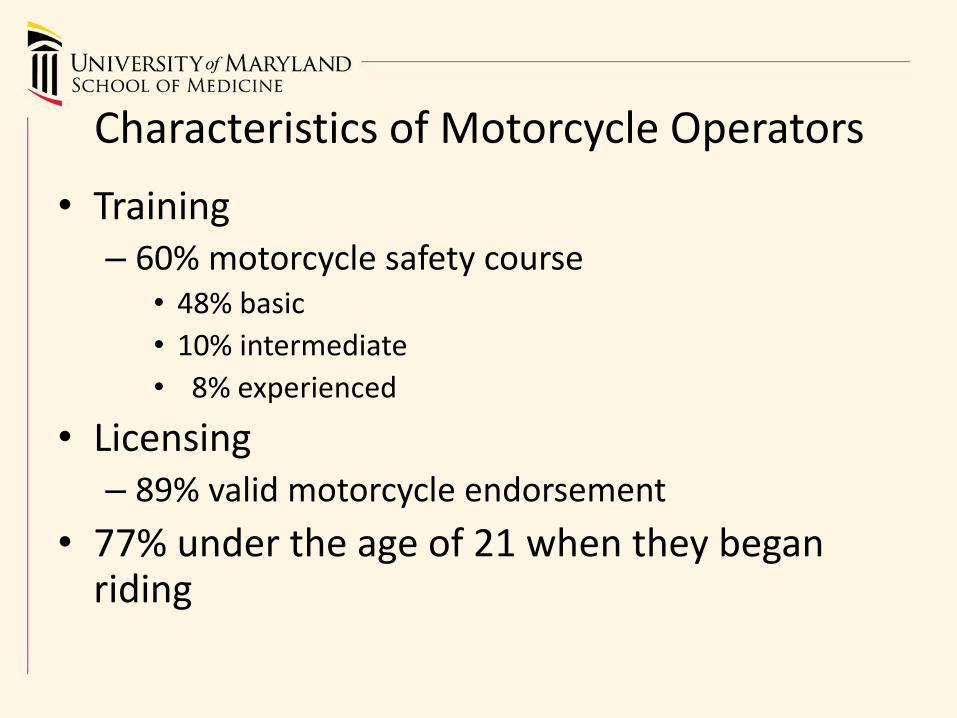
• Training – 60% motorcycle safety course
• 48% basic
• 10% intermediate
• 8% experienced
• Licensing – 89% valid motorcycle endorsement
• 77% under the age of 21 when they began riding
Characteristics of Motorcycle Operators
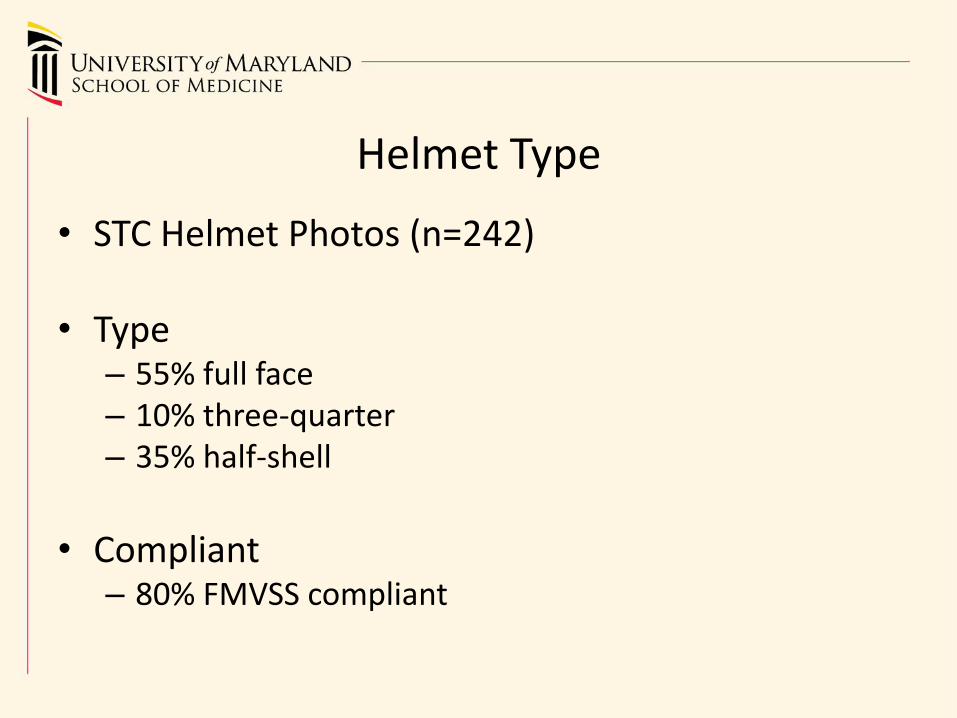
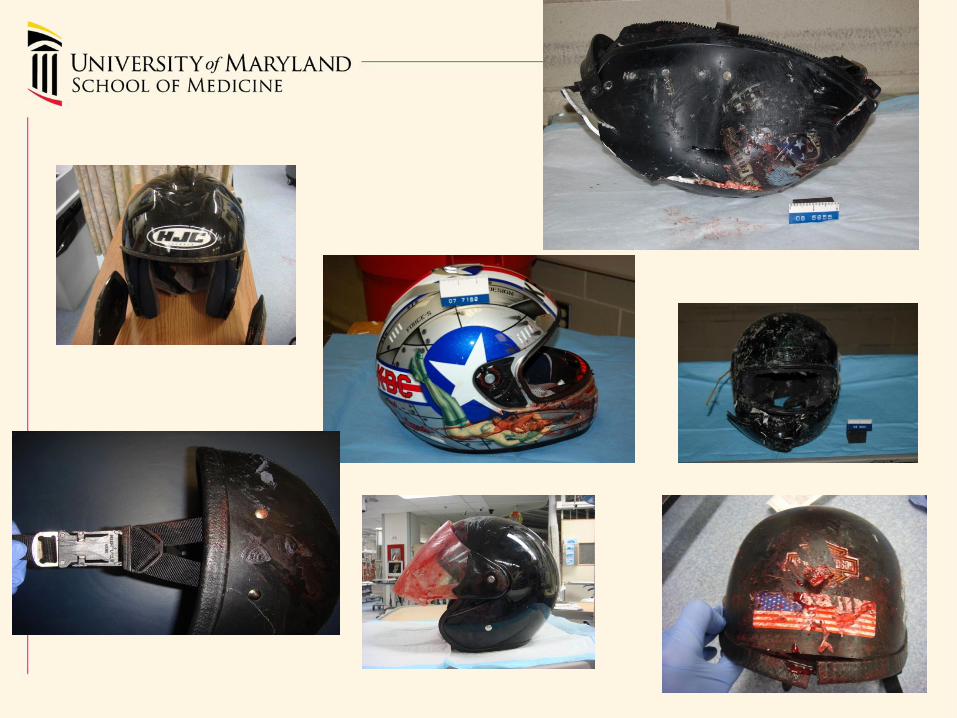
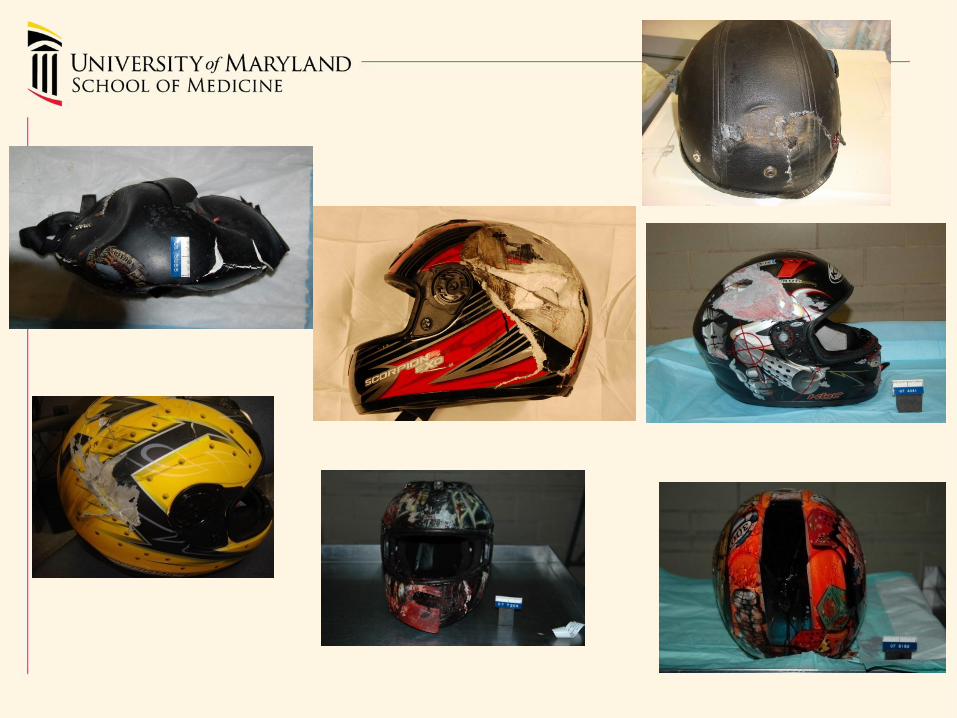
• STC Helmet Photos (n=242)
• Type – 55% full face – 10% three-quarter – 35% half-shell
• Compliant
– 80% FMVSS compliant
Helmet Type
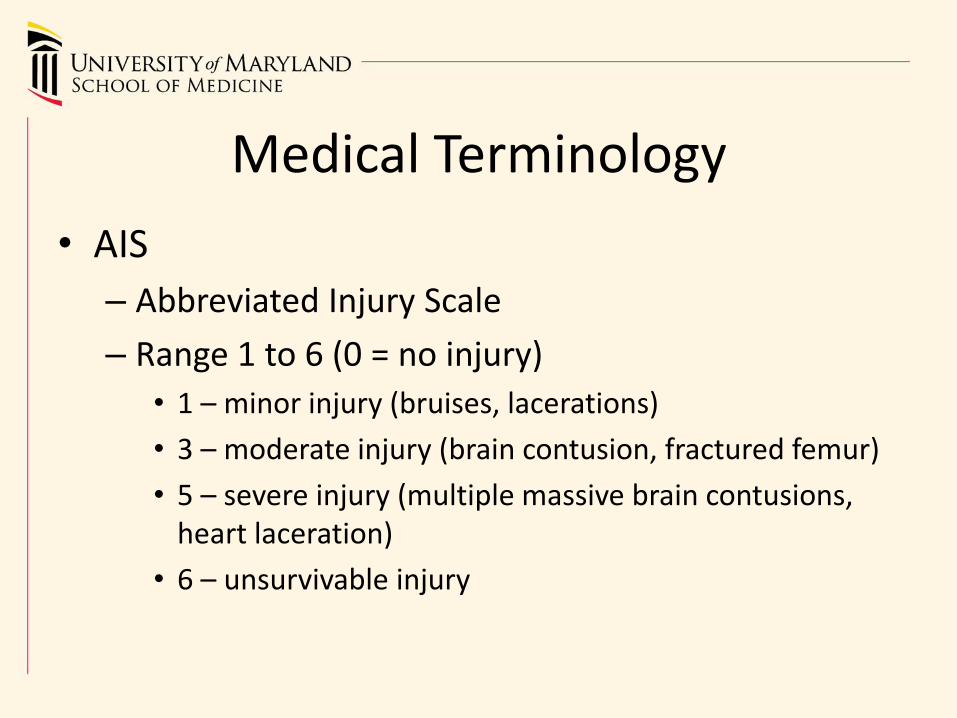
Medical Terminology
• AIS
– Abbreviated Injury Scale
– Range 1 to 6 (0 = no injury)
• 1 – minor injury (bruises, lacerations)
• 3 – moderate injury (brain contusion, fractured femur)
• 5 – severe injury (multiple massive brain contusions, heart laceration)
• 6 – unsurvivable injury
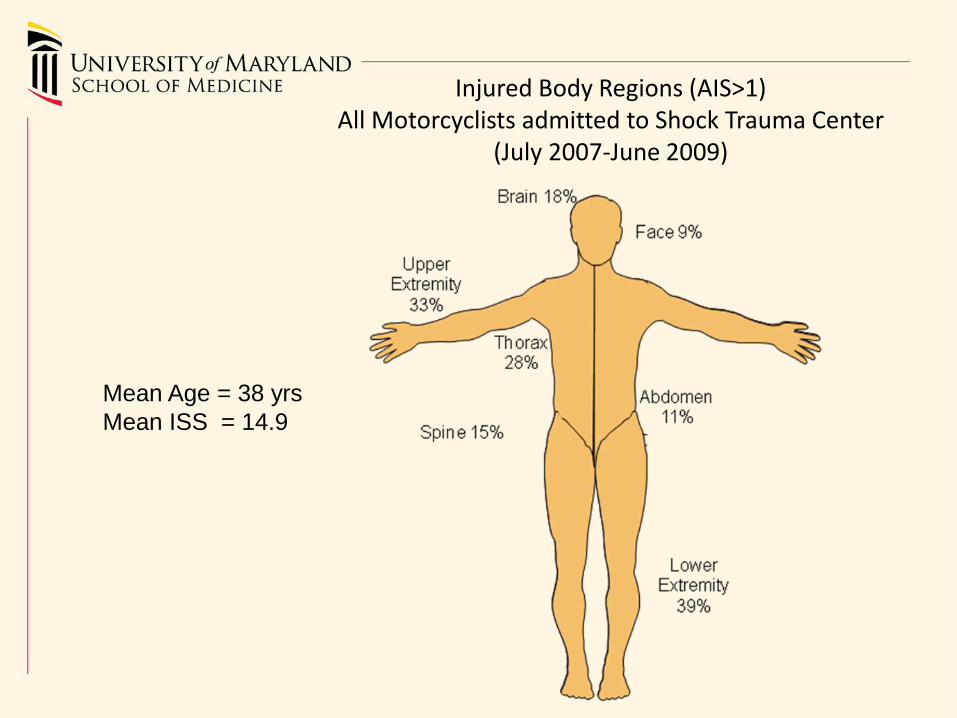
Injured Body Regions (AIS>1) All Motorcyclists admitted to Shock Trauma Center
(July 2007-June 2009)
Mean Age = 38 yrs
Mean ISS = 14.9
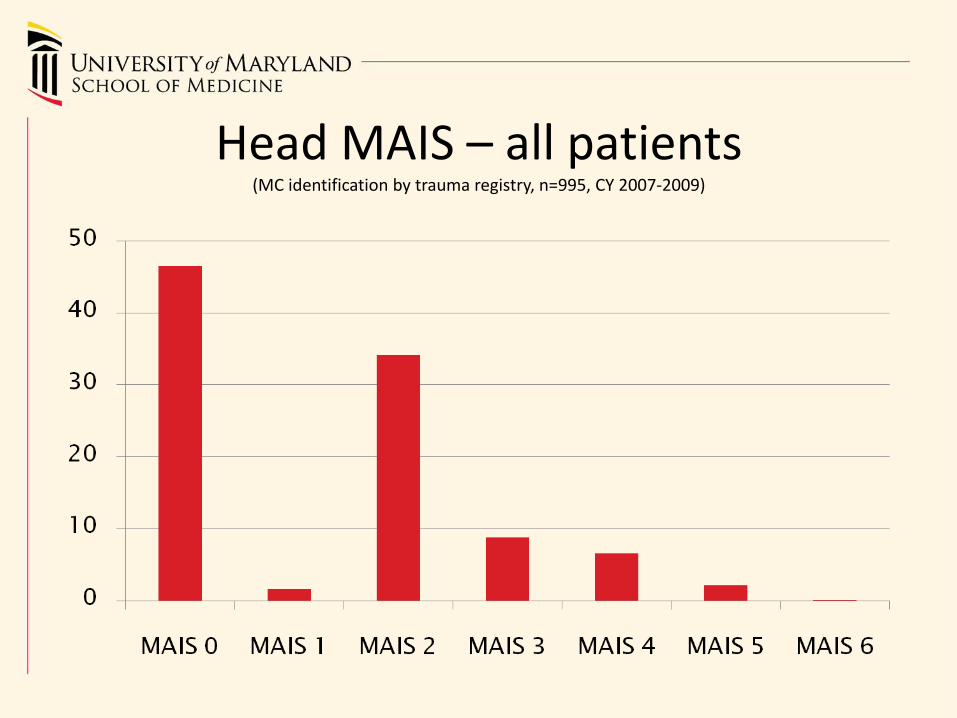
Head MAIS – all patients (MC identification by trauma registry, n=995, CY 2007-2009)
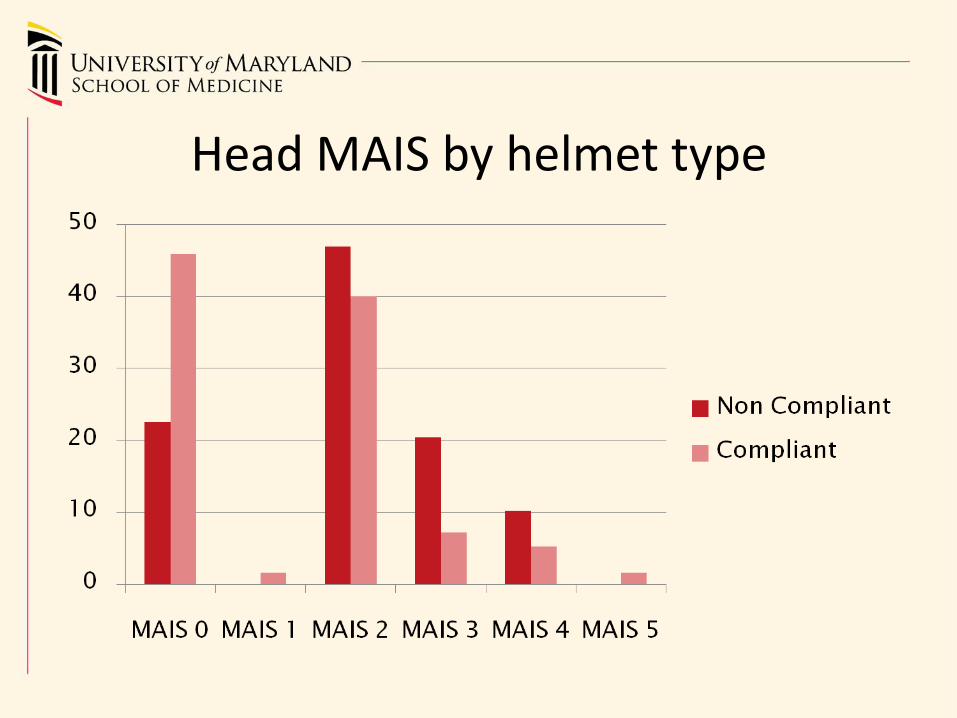
Head MAIS by helmet type
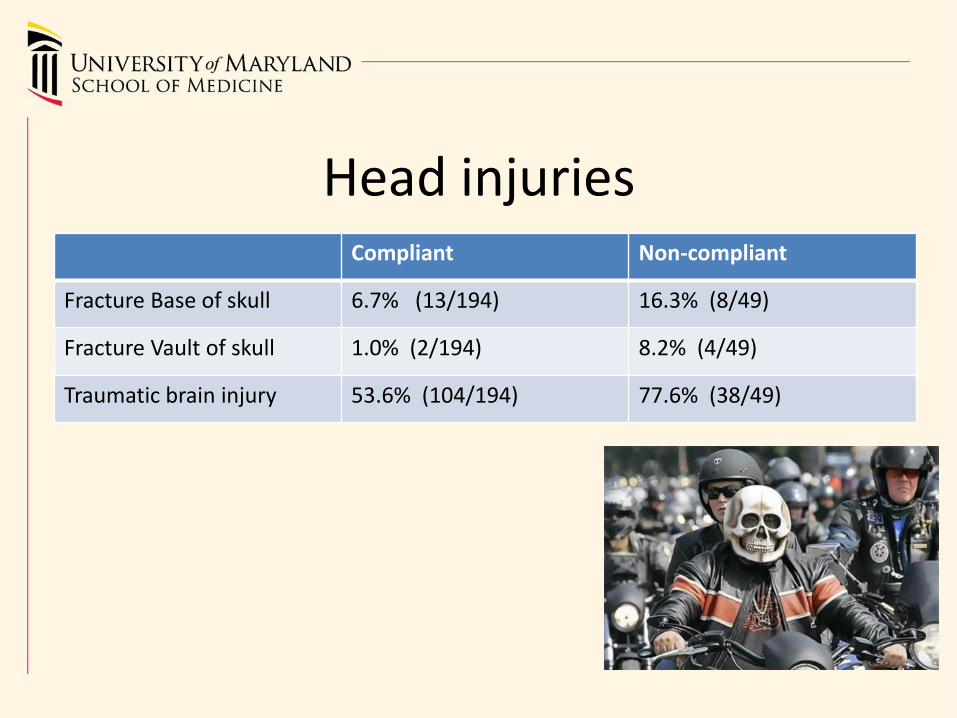
Compliant Non-compliant
Fracture Base of skull 6.7% (13/194) 16.3% (8/49)
Fracture Vault of skull 1.0% (2/194) 8.2% (4/49)
Traumatic brain injury 53.6% (104/194) 77.6% (38/49)
Head injuries
• Promising Practices – Analyze new exposure data (odometer readings = new
measure of miles traveled)
– Analyze new baseline data (motorcycle safety training course test scores and reported riding histories)
• Behavioral Surveys – Quantify and analyze knowledge, attitudes and behaviors
• Motorcycle operators/riders
• Motor vehicle drivers
Next steps….
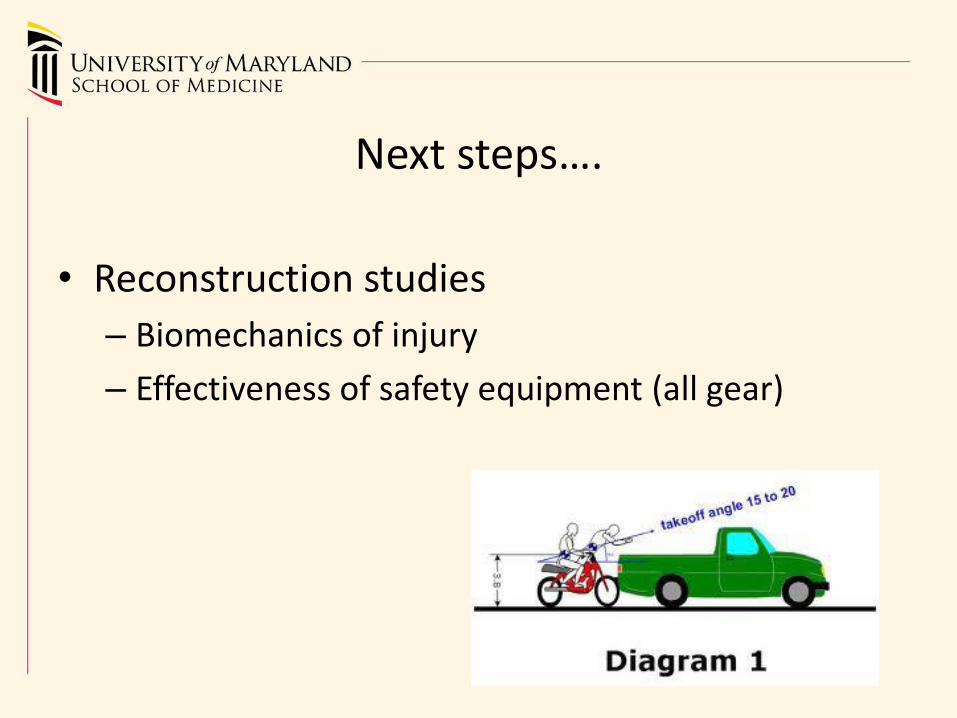
• Reconstruction studies
– Biomechanics of injury
– Effectiveness of safety equipment (all gear)
Next steps….
Recommended Strategies
• Increase helmet use
• Reduce alcohol impairment
• Reduce speeding
• Train all motorcycle operators
• ‘Share the road’ campaigns
Contacts
Tim Kerns – [email protected]
Cindy Burch – [email protected]
Maryland Center for Traffic Safety Analysis
National Study Center for Trauma & EMS