maryland autism services survey summary of results … · maryland autism services survey summary...
TRANSCRIPT

1
Maryland Autism Services Survey
Summary of Results for Waiver Services
Karen Goldrich Eskow, Ph.D.
This project is supported through grant awards from the Maryland State Department of
Education (MSDE) Division of Special Education/Early Intervention Services and the Bowen
Foundation. We are also extremely grateful to the families who have given so generously of their time
to assist us with this project.
Towson University, in collaboration with MSDE, recently completed Phase II of a research study
to learn more about the impact of services provided by the Maryland Medicaid Home and Community
Based Services (HCBS) Waiver for Children with Autism Spectrum Disorder (Autism Waiver) on
several outcomes including: waiver services being utilized, overall family quality of life, progress related
to the child’s social, academic, independent living skills, behavior and communication as well as family
demographics including employment, income, and marital status.
Maryland is one of a number of states utilizing the HCBS Waiver to provide Medicaid home and
community services for eligible children with Autism and their families. The Autism Waiver services
include: intensive individual support services (IISS), therapeutic integration services, residential
habilitation, respite care, environmental accessibility adaptations, adult life planning and family
training. Service coordination is also provided to each family. There are 900 Autism Waiver slots
which are filled. An Autism Waiver Registry has been created for families who are interested in
receiving waiver services when a slot becomes available. In May 2011, MSDE reported that 900
Maryland families were currently receiving Autism Waiver services and 3436 families were listed on
the Autism Waiver Registry. These numbers have increased since the last survey was conducted in
2008, which included 800 families receiving Waiver services (it did not include the families that entered
the waiver in 2008) and 2649 families on the Registry; the number of families on the registry has
increased by 30 percent since 2008.
2
The Maryland Autism Services Survey (MASS) is a multi-item quantitative questionnaire that
includes questions specific to Maryland Autism Waiver Services and a valid and reliable scale to
measure family quality of life (FQOL). Family quality of life has been defined as “an interactive
process in which individual family member demographics, characteristics, and beliefs interact with
family-unit dynamics and characteristics within the context of individual and family level supports,
services, and practice” (Zuna, Summers, Turnbull, Xu, & Hu, 2011). The survey tool was developed by
Towson University in consultation with the Maryland State Department of Education, which
administers the Maryland Autism Waiver, and Dr. Jean Ann Summers, one of the original survey
authors at the Beach Center on Disability (Kansas University). Feedback from potential participants
was elicited from a focus group session with professionals and parents of children with Autism in 2008.
Phase I of the study was completed in 2009, and MSDE contacted the research team in May 2011 to
repeat the survey. Respondents could not be identified from the initial study for comparative data thus
the current project is identified as a Phase II initiative rather than a direct continuation of Phase I.
Project Goals
1. Determine the number and percentage of families reporting that the waiver services they receive
meet their needs. Specifically determine the percent/number of families who respond positively that services meet their needs based on all families who respond to the question.
2. Gather and analyze data on perceived family quality of life for families with children who have
Autism. 3. Determine the relationship between Autism Waiver Services and Family Quality of Life (Working
Hypothesis Below) Working Hypotheses
There is a positive correlation between families who receive Autism Waiver services and reported
FQOL. 1. Reported FQOL will increase with the amount and duration of Autism Waiver Services that
a family utilizes and participates in (amount and duration to be defined.)
2. Examine the impact of waiver services predicting FQOL after accounting for the impact of other services and family income.
3
Methods
To ensure confidentiality, the mailings for the survey were distributed by MSDE to waiver
families and a sample of families on the Registry. In total, 2,140 families were sent surveys, including
823 who were on the Waiver, 1289 who were on the Registry and 28 Registry families who would be
enrolled in the Autism Waiver as of July 1, 2011. Three separate mailings were made on July 29,
August 26, and October 11, 2011. Each subsequent mailing did not include those who had already
completed the survey or those whose mail had been returned as undeliverable. The original Plan had
been to survey the entire Waiver population (900 families). However, 77 families were not surveyed
because they were leaving the Waiver program this year. Of the 823 surveys mailed to families on the
Waiver that were mailed, 15 were returned with no forwarding address, 39 had already completed a
similar survey earlier in the year, and 34 had more than one child on the Waiver leaving 735 possible
participants.
A representative sample of 1520 Registry families was chosen randomly to participate. The
sample was used to lower costs and improve efficiency of the sample response rate. Out of the 1520
Registry families, 12 families were not surveyed because their addresses were missing, 184 families were
not surveyed because their mail was returned to MSDE with no forwarding address, and 35 families
had multiple children on the Registry. The first two survey mailings included a cover letter that
directed the respondent to an internet-based survey. The cover letter also included options to respond
via paper survey or phone interview. In an effort to increase the number of responses, the third mailing
included a revised cover letter, a paper copy of the survey, a postage-paid return envelope addressed to
Towson University, and a resource card for families. The cover letter contained background
information about the Autism Waiver, a brief description of the survey and survey instructions.
Participants were informed that participation was entirely voluntary and their identities would remain
anonymous.
4
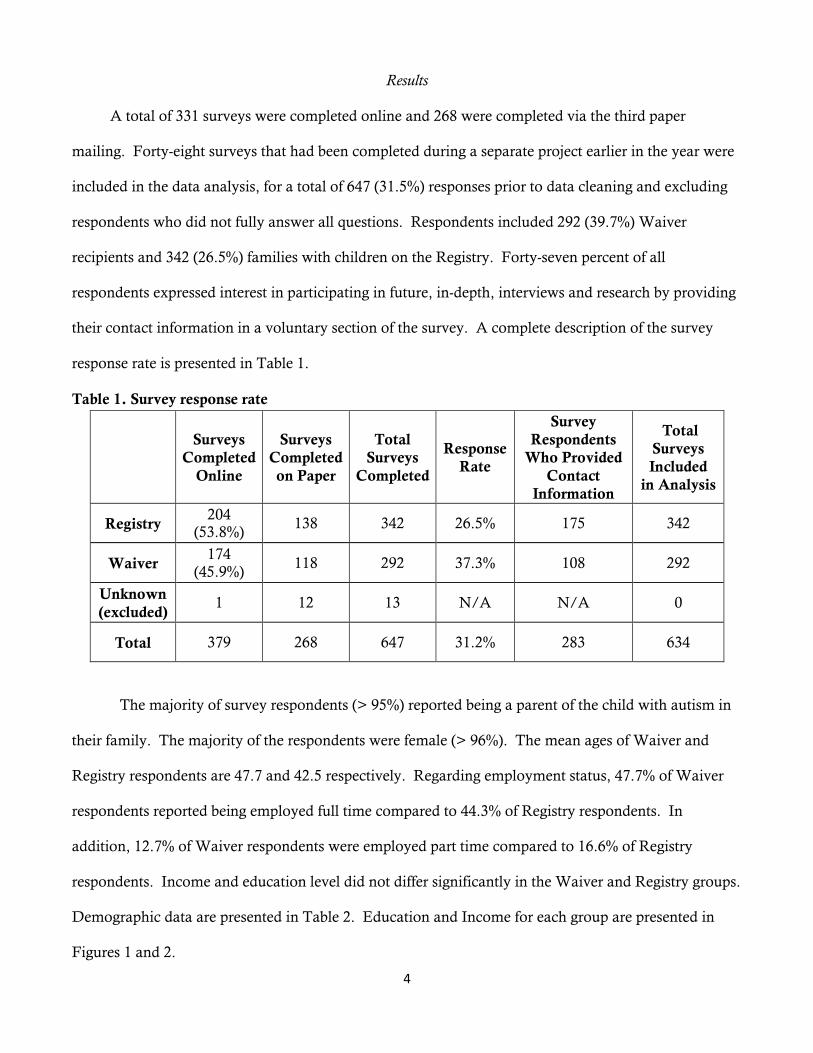
Results
A total of 331 surveys were completed online and 268 were completed via the third paper
mailing. Forty-eight surveys that had been completed during a separate project earlier in the year were
included in the data analysis, for a total of 647 (31.5%) responses prior to data cleaning and excluding
respondents who did not fully answer all questions. Respondents included 292 (39.7%) Waiver
recipients and 342 (26.5%) families with children on the Registry. Forty-seven percent of all
respondents expressed interest in participating in future, in-depth, interviews and research by providing
their contact information in a voluntary section of the survey. A complete description of the survey
response rate is presented in Table 1.
Table 1. Survey response rate
Surveys
Completed
Online
Surveys
Completed
on Paper
Total
Surveys
Completed
Response
Rate
Survey
Respondents
Who Provided
Contact
Information
Total
Surveys
Included
in Analysis
Registry 204
(53.8%) 138 342 26.5% 175 342
Waiver 174
(45.9%) 118 292 37.3% 108 292
Unknown
(excluded) 1 12 13 N/A N/A 0
Total 379 268 647 31.2% 283 634
The majority of survey respondents (> 95%) reported being a parent of the child with autism in
their family. The majority of the respondents were female (> 96%). The mean ages of Waiver and
Registry respondents are 47.7 and 42.5 respectively. Regarding employment status, 47.7% of Waiver
respondents reported being employed full time compared to 44.3% of Registry respondents. In
addition, 12.7% of Waiver respondents were employed part time compared to 16.6% of Registry
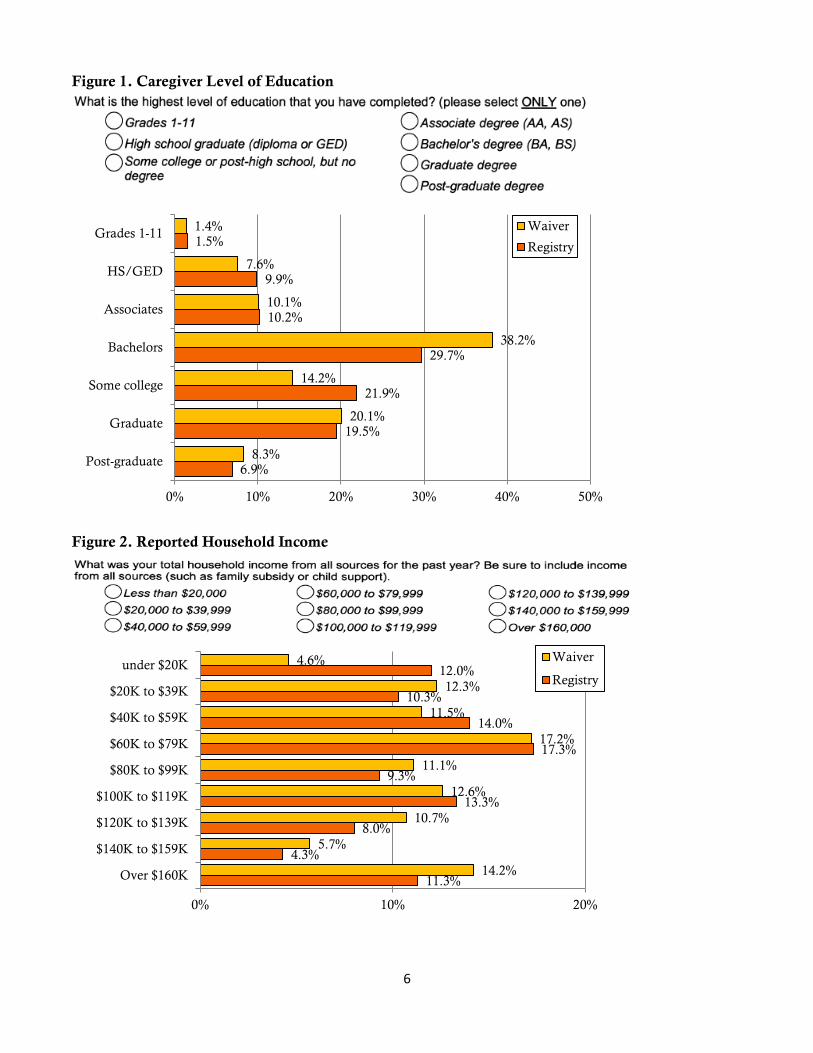
respondents. Income and education level did not differ significantly in the Waiver and Registry groups.
Demographic data are presented in Table 2. Education and Income for each group are presented in
Figures 1 and 2.

5
Table 2. Demographic information about survey respondents
Survey Question Response Waiver Registry
Biological/adopted child
276 (95.5%) 331 (97.1%)
Grandchild 6 (2.1%) 6 (1.8%)
Niece/nephew 0 (0.0%) 0 (0.0%)
Foster child 0 (0.0%) 2 (0.6%)
Sibling 1 (0.3%) 1 (0.3%)
Step-child 4 (1.4%) 1 (0.3%)
Other 2 (0.7%) 0 (0.0%)
Female 276 (95.5%) 331 (97.1%)
Male 6 (2.1%) 6 (1.8%)
Full-time job 135 (47.7%) 144 (44.3%)
Part-time job
(30 hours or less) 36 (12.7%) 54 (16.6%)
Self-employed 50 (17.7%) 55 (16.9%)
Government-supported
training 3 (1.1%) 2 (0.6%)
Unemployed and looking for work
6 (2.1%) 7 (2.2%)
Fully retired 10 (3.5%) 13 (4.0%)
Full-time education 10 (3.5%) 2 (0.6%)
Looking after home/family
33 (11.7%) 41 (12.6%)
Permanently
sick/disabled -- 7 (2.2%)
Mean age of survey respondent
(Range 19-74)
47.7 42.5
6
Figure 1. Caregiver Level of Education
Figure 2. Reported Household Income
6.9%
19.5%
21.9%
29.7%
10.2%
9.9%
1.5%
8.3%
20.1%
14.2%
38.2%
10.1%
7.6%
1.4%
0% 10% 20% 30% 40% 50%
Post-graduate
Graduate
Some college
Bachelors
Associates
HS/GED
Grades 1-11Waiver
Registry
11.3%
4.3%
8.0%
13.3%
9.3%
17.3%
14.0%
10.3%
12.0%
14.2%
5.7%
10.7%
12.6%
11.1%
17.2%
11.5%
12.3%
4.6%
0% 10% 20%
Over $160K
$140K to $159K
$120K to $139K
$100K to $119K
$80K to $99K
$60K to $79K
$40K to $59K
$20K to $39K
under $20KWaiver
Registry

7
Descriptive data about the children reveal that approximately 80% of the children are male and
20% are female. The gender split does not differ significantly between the Waiver and Registry groups.
Child’s age does differ between the two groups. Children receiving Waiver services are generally older
than those on the Registry. Sixty-six percent of children on the Registry compared with 11.4% of
children on the Waiver are under age 12. This may be explained by the fact that many of the children
on the Registry are too young to have joined the Waiver when it began in 2001. In addition, the
current wait time on the Registry is seven years before having an opportunity to apply to the Waiver for
a slot, meaning that most children entering the Waiver are older than the children on the Registry. The
majority of the children on the Waiver (65%) have been receiving waiver services for more than five
years. These data are presented in Figures 3-5.
Figure 3. Gender of child
Waiver
Registry
Gender Freq Percent Freq Percent
Male 227 (79%) 280 (83%)
Female 61 (21%) 59 (17%)
Total 288 100 339 100
Figure 4. Age group of child
Waiver Registry
Age Group Freq Percent Freq Percent
0-5 -- -- 56 17.3%
6-11 32 11% 160 49.4%
12-17 160 57% 79 24.4%
18+ 89 32% 29 9%
Total 281 100% 324 100%
79%
21%
83%
17%
0%
20%
40%
60%
80%
100%
Male Female
Waiver
Registry
11%
57 %
32%
17%
49%
24%
9%
0%
10%
20%
30%
40%
50%
60%
0-5 6-11 12-17 18+
Waiver
Registry

8
Figure 5. Years on Waiver Years Freq Percent
0 14 5.7
1 22 9
2 19 7.8
3 12 4.9
4 17 7
5 18 7.4
6 22 9
7 24 9.8
8 34 13.9
9 27 11.1
10 30 12.3
11 5 2
Total 244 100
Missing 48
Waiver recipients reported Intensive Individual Support Services (IISS,) Family Training and
Respite as the most frequently used services. Seventy-two percent of those respondents used IISS
workers one or more times a week. Family Training services were used by 67% of the respondents one
or more times a month. Respite services were used by 88% of the waiver respondents one or more times
per year. Lastly, Therapeutic Integration services were used by 57% of the respondents one or more
times per month. Over 60% of the respondents reported that they did not use Adult Life Planning,
Residential Habilitation, and Environmental Accessibility Adaptations at all. Adult Life Planning is
limited to children between the ages of 18 to 21 for a maximum of 45 hours over three years.
Residential habilitation is provided under very limited circumstances. Environmental Accessibility
Adaptations is limited to $1,500 over three years when needed for health and safety. The majority of
the respondents reported adequate or complete satisfaction with the most frequently used services; IISS,
Respite, and Family Training. The highest satisfaction was with IISS workers. Satisfaction with
reported services is summarized in Figure 6.
0-4 35%
5-8 40%
> 8 25%

9
Figure 6. Satisfaction with Waiver Services (Fall 2011 Waiver Recipients only)
T-tests comparing the Registry and Waiver groups yielded significant differences between the groups in
several key areas. Hypothesis 1 was supported; Waiver recipients reported significantly higher
satisfaction with their overall family quality of life. In addition to overall FQOL, families on the waiver
reported higher satisfaction on three of the five FQOL subscales (Family Interaction, Parenting and
Emotional Well-Being). These data are presented in Figure 7. Additionally, a longer time on the
Waiver is positively correlated with higher satisfaction with overall Family Quality of Life as well as
the Family Interaction, Emotional Well-Being, Physical/Material Well-Being, and Disability Support
sub-scales. Supporting Hypothesis 2, waiver recipients reported higher family quality of life after
controlling for income.
Environmen
tal
accessibility
adaptations
(n=224)
Intensive
Individual
Support
Services
(n=234)
Therapeutic
integration
(n=228)
Residential
habilitation
(n=225)
Family
training
(n=232)
Respite care
(n=230)
Adult life
planning
(n=207)
Did not use 48.20% 3.00% 28.90% 65.30% 6.90% 12.20% 62.30%
Adequately 7.60% 38.90% 19.30% 3.10% 30.60% 26.50% 5.80%
Completely 8.90% 47.00% 23.20% 6.70% 34.10% 42.60% 5.80%
Somewhat 8.90% 9.40% 13.20% 0.90% 16.80% 13.00% 4.80%
A little 4.50% 0.00% 4.80% 1.30% 6.50% 3.00% 4.30%
Not at all 21.90% 1.70% 10.50% 22.70% 5.20% 2.60% 16.90%
0%
20%
40%
60%
80%
100%

10
Figure 7. Family Quality of Life Overall Mean and Subscales
The Beach Center Family Quality of Life Scale is a 25-item scale that measures family perceptions of
satisfaction within five domains: family interaction, parenting, emotional well-being, physical/material well-
being, and disability-related supports. Sample item below and figure follows.
A child with Autism impacts parental employment. Eighty-two percent of Waiver respondents
and eighty percent of Registry respondents reported that the needs of their child with Autism affected
4.04
n=290
4.08
n=289 4.03
n=289 3.72
n=288
4.28
n=287 4.11
n=289
3.74
n=339
3.82
n=339 3.81
n=339
3.25
n=338
3.96
n=338 3.80
n=339
1
2
3
4
5
Overall FQOL** FamilyInteraction*
Parenting* EmotionalWell-Being**
Physical/MaterialWell-Being
Disability Support
Waiver Registry
1 = very dissatisfied 2 = dissatisfied 3 = neither 4 = satisfied 5 = very satisfied
*Significant at p<.05 **Significant at p<.01
11
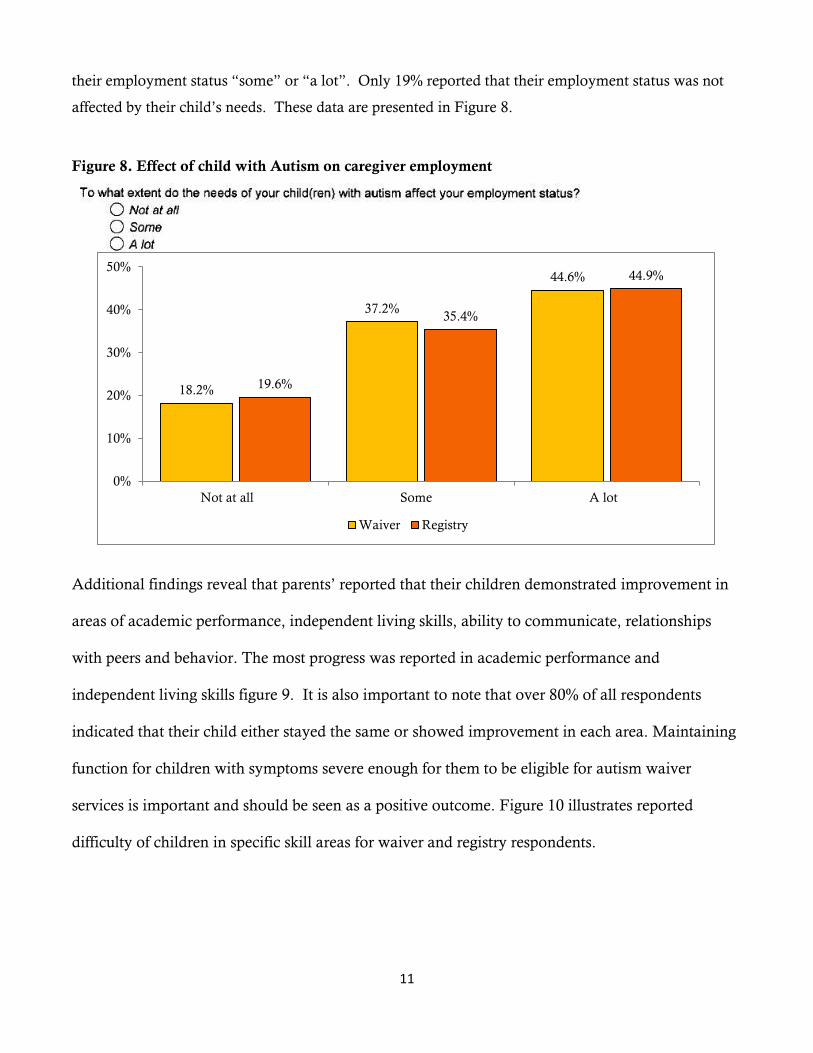
their employment status “some” or “a lot”. Only 19% reported that their employment status was not
affected by their child’s needs. These data are presented in Figure 8.
Figure 8. Effect of child with Autism on caregiver employment
Additional findings reveal that parents’ reported that their children demonstrated improvement in
areas of academic performance, independent living skills, ability to communicate, relationships
with peers and behavior. The most progress was reported in academic performance and
independent living skills figure 9. It is also important to note that over 80% of all respondents
indicated that their child either stayed the same or showed improvement in each area. Maintaining
function for children with symptoms severe enough for them to be eligible for autism waiver
services is important and should be seen as a positive outcome. Figure 10 illustrates reported
difficulty of children in specific skill areas for waiver and registry respondents.
18.2%
37.2%
44.6%
19.6%
35.4%
44.9%
Not at all Some A lot
0%
10%
20%
30%
40%
50%
Waiver Registry

12
Figure 9. Child Progress Reported by Waiver Recipients
Figure 10. Perceived Difficulty in Functional Skills
Greater than 50% of all respondents (waiver and registry) reported use of parent/family
organizations, online social networks, extended family, friends, other parents of children with autism
(or other disability), family care(differentiated from family support), mental health services and healthy
10% 10% 12% 8% 18%
49% 45% 52%
72% 44%
41% 45% 36% 20%
38%
0%
20%
40%
60%
80%
100%
Academicperformance
Independentliving skills
Ability tocommunicate
Relationshipwith peers
Behavior
Child's Progress Reported by Waiver Recipients
Improved
Same
Worse
13
kids check-ups. Of particular interest is the percentage of participants who report use of mental health
services. This finding combined with reported low scores on the emotional well-being subscale is
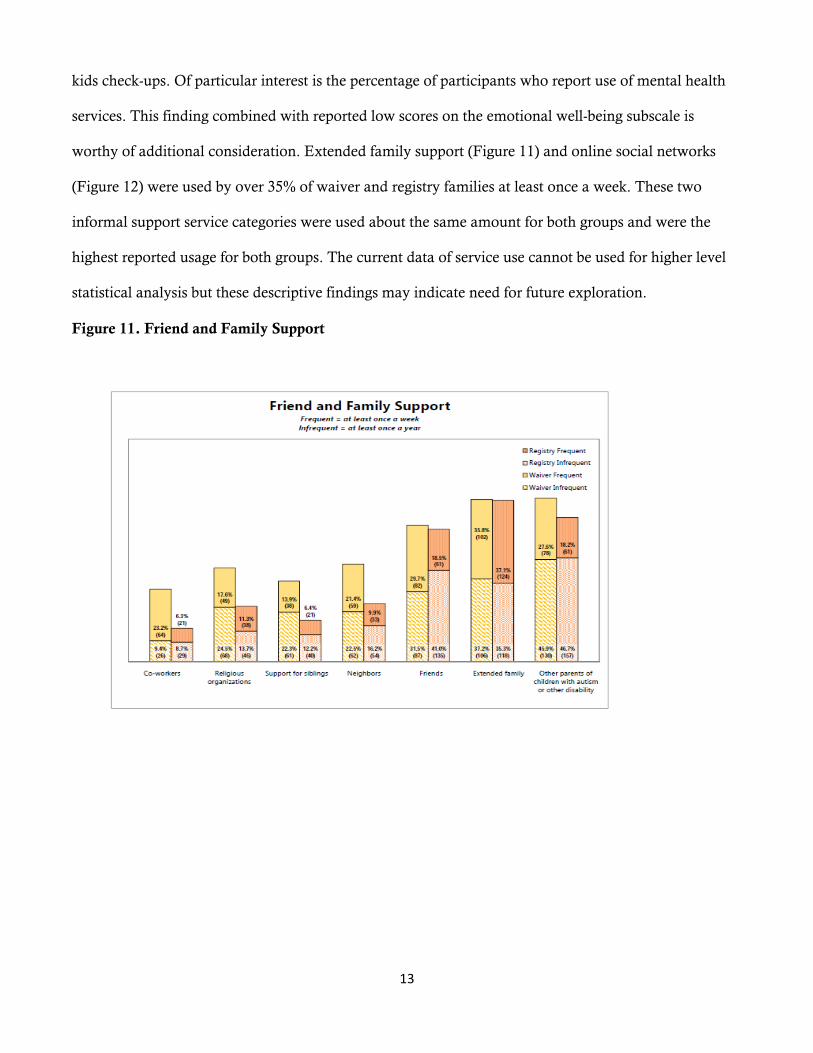
worthy of additional consideration. Extended family support (Figure 11) and online social networks
(Figure 12) were used by over 35% of waiver and registry families at least once a week. These two
informal support service categories were used about the same amount for both groups and were the
highest reported usage for both groups. The current data of service use cannot be used for higher level
statistical analysis but these descriptive findings may indicate need for future exploration.
Figure 11. Friend and Family Support

14
Figure 12. Information Services
Formal and informal service utilization in general was higher for waiver recipients. This
information is interesting to note for future investigation. The results could reflect the severity of the
child’s symptoms necessitating additional services. A second possibility is that there is an unanticipated
boost in parents’ advocacy skills that result in access to and use of other formal and informal services
for families. A third consideration is availability of additional Medicaid services. Friend and family
supports including extended family, friends and other parents of children with autism or other disability
were used by over 25% of waiver families at least once a week. In addition, family care (provision of
child care by family member), parent/family organizations and online social networks were used by
over 25% of waiver families at least once a week.
15
Discussion
The MASS project provided an opportunity to gather data from families receiving waiver
services and those on the registry. Overall both groups reported a family quality of life that was lower
than findings from similar studies (Eskow, Pineles, & Summers, 2011; Summers et al., 2007; Wang et
al., 2006). In addition, a significant number of respondents reported that having a child with Autism
impacted their employment. Findings support Autism as a complex disorder that impacts the family.
Results were both significant and meaningful. The data suggest that Waiver services are effective in
promoting overall family quality of life. Waiver services are making a difference in the lives of children
with autism and their families. Maryland is one of a small number of states that offer a waiver program
specific to individuals with Autism and has the largest enrollment of all such waivers. The Maryland
program likely provides the most comprehensive services in the country; however, there are still over
3,400 families on the Registry. The purpose of the Home and Community Based Autism Waiver is to
provide services in the home and community for children that met criteria for institutionalization.
Those children receive services in the least restrictive environment thus meeting the intended purpose of
Home and Community Bases Services Waivers. Current findings indicate a high percentage (67%) of
children younger than 12 on the Registry. Early intervention for children with Autism has been found
to enhance treatment outcomes (Corsello, 2005; Dunst & Bruder, 2002). Despite Maryland’s
comprehensive program, more children and families are in need of services.
Additional study is needed to fully understand how waiver programs are enhancing families’
quality of life, health and productivity. This research is essential for development and implementation
of best practices when treating children with Autism and their families. Perhaps most important is the
potential to broadly influence services and policy. Research-based evidence will be used to advocate for
expanded provision of services and comprehensive policies. Areas for future consideration include
availability of coordinated services, such as those characteristic of the Waiver program, through third
party payment as well as additional resources to expand Waiver services to more families in Maryland.

16
References
Corsello, C. (2005). Early intervention in Autism. Infants & Young Children: An Interdisciplinary Journal of
Special Care Practices, 18(2), 74-85.
Dunst, C., & Bruder, M. (2002). Valued outcomes of service coordination, early intervention, and
natural environments. Exceptional Children, 68, 361-375.
Eskow, K, Pineles, L, & Summers, J.A. (2011). Exploring the effects of autism waiver services on
family outcomes. Journal of Policy and Practice in Intellectual Disabilities, 8(1), 28-35.
Summers, J., Marquis, J., Mannan, H., Turnbull, A., Fleming, K., Poston, D., Wang, M. & Kupzyk,
K. (2007). Relationship of Perceived Adequacy of Services, Family-Professional Partnerships,
and Family Quality of Life in Early Childhood Service Programmes. International Journal of
Disability, Development and Education, 54(3), 319-338.
Wang, M., Summers, J., Little, T., Turnbull, A., Poston, D. & Mannan, H. (2006). Perspectives of
fathers and mothers of children in early intervention programmes in assessing family quality of
life. Journal of Intellectual Disability Research, 50, 977-988.
Zuna, N., Summers, J. A., Turnbull, A.P., Hu, X., and Xu, S. (2011). Theorizing about family quality
of life. In R. Kober (Ed.), Enhancing the quality of life of people with intellectual disability: From theory
to practice. London: Springer Publishers.