martin adelaar and mark pasini, marbek resource ... · paper 1: green building energy scenarios for...
TRANSCRIPT
Paper 1: Green Building Energy Scenarios for 2030
Martin Adelaar and Mark Pasini, Marbek Resource Consultants, Ltd. Odón de Buen, Energía, Tecnología y Educación (ENTE)
Stephen Selkowitz, Lawrence Berkeley National Laboratory
Background Paper One – Green Building Scenarios for 2030 2
Table of Contents
1. ABOUT THIS REPORT: OBJECTIVES AND SCOPE ...................................................................................... 3
1.1 CONTEXT........................................................................................................................................ 3
1.2 ORGANIZATION OF THIS REPORT......................................................................................... 4
1.3 THE AIA/RAIC TARGETS ........................................................................................................... 4
2. APPROACH AND ASSUMPTIONS .................................................................................................................. 6
2.1 OVERVIEW ..................................................................................................................................... 6
2.2 ANALYSIS BOUNDARIES............................................................................................................ 7
2.3 DERIVATION OF THE BASELINE AND BUSINESS-AS-USUAL PROFILES.................. 10
2.4 ESTABLISHING THE DEEP GREEN SCENARIO................................................................. 13
2.5 LIMITATIONS AND EXCLUSIONS ......................................................................................... 17
3. HIGH-LEVEL RESULTS AND IMPLICATIONS ............................................................................................ 19
3.1 PROFILE OF THE AFFECTED TARGET MARKETS.......................................................... 19
3.2 ENERGY SAVINGS AND GHG REDUCTION IMPACTS..................................................... 41
3.3 IMPLICATIONS OF RESULTS.................................................................................................. 65
APPENDIX A: NORTH AMERICAN RESIDENTIAL SECTOR............................................................................ 66
APPENDIX B: NORTH AMERICAN COMMERCIAL BUILDING SECTOR....................................................... 71

Green Building in North America
Background Paper One – Green Building Scenarios for 2030 3
1. About this Report: Objectives and Scope
1.1 Context
The team of Marbek Resource Consultants Ltd. (Marbek), Odón de Buen, and Lawrence Berkeley National Laboratory (LBL) is pleased to submit this report, which documents the preliminary findings and implications of a study entitled “Green Building Scenarios,” undertaken under the auspices of the Commission for Environmental Cooperation (CEC) project “Green Building in North America: Opportunities and Challenges.”
The primary objective of the study is to present a vision of the potential energy performance improvements that can be attained in the North American building markets, as differentiated by building type and region in designated future milestone periods. The resultant vision, referred to as the “Deep Green” scenario or “Scenario 1,” is based on an aggressive but technically achievable uptake of energy efficiency practices in the construction of new buildings and renovation of existing buildings, supplemented by low-carbon forms of new energy supply. In practical terms, the outcome of the study is a defensible, robust modeling platform to help inform the overall CEC project and associated background papers, as well as to conduct future analysis. Although this paper provides useful guidance in beginning to think quantitatively about potential visions for building energy use and carbon emissions, it should be noted that the time and resources available could not allow either a definitive or exhaustive exploration of the options, issues, likelihood of success, etc., for the vision outlined. The paper does, however, provide a useful set of insights into the scope and dimension of the problem, and helps identify policy and technical issues that must be explored more exhaustively in the future.
The vision represented by the Deep Green scenario also provides some insight into the potential positive environmental, social and economic benefits of improving energy performance in buildings, an essential part of eventually reducing the environmental footprint associated with building design, location and operation.
In 2005, the residential and commercial building stock in North America comprised more than 29 billion square meters (m2) of floor space, which is projected to grow by another 13.5 billion m2, or 46 percent, to 42.5 billion m2 by 2030.1 The construction, operation and demolition of buildings in North America leave behind an enormous environmental footprint.2 The choices made with regard to building design, materials, equipment and location affect resource use and consequent environmental effects on air, water, land and biota.
If we examine but one aspect of this environmental footprint, energy use, we see that in 2005, operations of the North American buildings stock resulted in a primary energy consumption amounting to 19,638 petajoules (PJ), which in turn contributed to 2,248 million tons of GHG emissions. The projections of stock growth under the business-as-usual (BAU) scenario and the existing patterns of energy consumption of the North American buildings stock indicate that aggregate overall energy use and associated carbon emissions will show continued growth. The first step needed in a successful transition to a sustainability pathway is to slow the growth in overall energy consumption and carbon emissions and demonstrate that consumption and emissions can be not merely stabilized but decreased.
There is an increasing number of institutions and organizations in North America that are exploring this challenge. Collectively, this search for a vision and practical pathway forward is lending credibility to the notion of aggressive energy performance improvements. The American Institute of Architects (AIA) and the Royal Architectural Institute of Canada (RAIC) have together adopted an ambitious schedule of carbon reduction targets that is predicated largely on substantial energy efficiency improvements. As elaborated in this report, it is The 2030 Challenge (also referred to in this paper as the AIA/RAIC targets or scenario) that is used as the focal point of the study team’s analysis, with some additional reference to the 1990 greenhouse gas (GHG) emissions levels as the point of reference for the Kyoto targets.
1 Figures derived by the authors based on the sources given in section 2.3.1 below. 2 An environmental footprint is an ecological accounting tool that helps to measure the impact of human activities on the environment. The environmental footprint is defined as the biologically productive land and water area required to supply the resources needed and assimilate the wastes generated by a given human population using the prevailing technology. In other words, the environmental footprint takes a holistic perspective of all human activities in which energy supply and use are key elements.

Green Building in North America
Background Paper One – Green Building Scenarios for 2030 4
1.2 Organization of this Report
This paper is organized as follows:
The balance of this introductory section of the paper focuses on our interpretation of the possible green building end-state in 2030, based on the characterization of such and the targets adopted to achieve it by the AIA and RAIC. The AIA/RAIC targets were selected as defining the desired end-state against which our modeled scenarios are compared, to test key assumptions concerning performance improvements and market take-up.
Section 2 presents the modeling approach and key assumptions in support of our proposed green building scenario, referred to as Scenario 1 or the “Deep Green” scenario. Scenario 1 depicts a 2030 end-state characterized by accelerated market penetration of advanced energy efficiency within existing and newly constructed residential and commercial buildings in North America, utilizing supplemental renewable energy supply.
Section 3 presents the high-level results predicted for North America and the implications of these on shaping public policy.
Appendix A contains more detailed analysis and modeling results for the North American residential sector.
Appendix B contains more detailed analysis and modeling results for the North American commercial building sector.
1.3 The AIA/RAIC Targets
To help frame the scope and approach to the study analysis, the AIA/RAIC 2030 Challenge targets were chosen as a project goal. The AIA/RAIC targets offer the opportunity to test modeling assumptions concerning building energy performance improvements and rates of market penetration.
In 2005, the AIA adopted “The 2030 Challenge,” designed to help address the global issue of climate change by setting out targets and a schedule for energy performance improvements in buildings. The RAIC subsequently also adopted The 2030 Challenge, which has now gained significant traction as a vision statement in the architectural profession as well as among some important institutions, including the US Council of Mayors and the International Council for Local Environmental Initiatives (ICLEI) in North America. To meet the goals of The 2030 Challenge, it is imperative not only to create new buildings and developments that are high-performance and carbon-neutral but also to advocate for policies and actions that will ensure that all existing buildings and developments meet aggressive energy reduction targets as well.
1.3.1 How the AIA/RAIC 2030 Challenge Is Interpreted The approach to and assumptions underlying the study analysis are influenced, in part, by the interpretation of the AIA/RAIC targets. Although the end-state is partially defined, it is how one gets there, particularly from the standpoint of the existing building stock, that poses a significant challenge. Our interpretation of The 2030 Challenge is presented below.
The 2030 Challenge was established to address the global issue of carbon emissions and climate change, recognizing that buildings are responsible for 40 to 50 percent of direct and indirect use of energy and the resultant carbon emissions. The AIA and RAIC have endorsed a plan that, if implemented, would lead to a carbon-neutral end-state for newly constructed buildings in 2030 and to substantial carbon emission reductions in existing buildings.3 It is assumed that the targets in the energy-use scenario would be met by a combination of aggressive energy performance improvements in buildings and the supply of on-site, zero-carbon, renewable energy to address any remaining demand.
3 For the wording of and more information on The 2030 Challenge, see Architecture 2030’s website, at <http://www.architecture2030.org/open_letter/index.html>.

Green Building in North America
Background Paper One – Green Building Scenarios for 2030 5
The specific roll-out schedule of the AIA/RAIC targets is presented as follows and distinguished according to new and existing buildings.
Starting in the next eligible year (2008), all new buildings are to be 50 percent more efficient than the current, or base-year (2005), stock. Subsequent increases in performance efficiency of 10 percent, will lead to 100 percent better performance over that of the base-year stock by 2030. This implies a very large reduction in energy use, with the remainder to be provided by renewable sources. The schedule of energy improvements is as follows:
50 percent in 2008 60 percent in 2010 70 percent in 2015 80 percent in 2020 90 percent in 2025 Carbon-neutral by 2030 (using no net fossil-fuel, GHG-emitting energy to operate).
All major renovations are to be designed to meet an energy consumption performance standard—in the use of fossil fuels, and the emission of greenhouse gas (GHG)—of 50 percent relative to the regional (or country) average for current (2005) stock of that building type.
At a minimum, an amount of existing building area equal to the amount of new building floor area is to be renovated annually to meet a fossil-fuel, greenhouse gas (GHG)–emitting, energy-consumption performance standard of 50 percent relative to the regional (or country) average for current (2005) stock of that building type.
The use of renewable technologies and/or the purchase of renewable energy cannot exceed a maximum of 20 percent of the targeted savings.
For our modeling exercise, we have interpreted the AIA/RAIC roll-out schedule as follows:
Newly Constructed Buildings
Starting in 2008 (or 2010 for US modeling), all newly constructed buildings will consume 50 percent less energy (per building) (60 percent for US modeling) than the existing stock in the 2005 baseline year.
Over subsequent years, the requirements for newly constructed buildings will be to consume less energy (per building) than the existing stock of the baseline year according to the following schedule: 60 percent by 2010, 70 percent by 2015, 80 percent by 2020, 90 percent by 2025, and 100 percent by 2030. These levels of performance are to be achieved by reducing intrinsic energy use and then providing the remaining needs with on-site renewable power.
Existing Buildings
Over the 2008–2030 period (2010–2030 period for the US modeling), a portion of the existing building stock equal to the rate of new construction will undergo some sort of major renovation. These buildings will undergo an energy performance improvement leading to a 50 percent reduction in energy consumption (per building) relative to the performance of buildings in the 2005 baseline year.
Over the 2008–2030 period (2010–2030 period for US modeling), the portion of the existing building stock that does not undergo some sort of major renovation will be eligible for an energy retrofit. The size of this market is estimated to be equivalent to the annual quantity of renovated buildings plus the annual quantity of new buildings. These buildings will undergo an energy retrofit leading to a 50 percent reduction in energy consumption (per building type) relative to the performance of buildings in the 2005 baseline year.

Green Building in North America
Background Paper One – Green Building Scenarios for 2030 6
2. Approach and Assumptions
2.1 Overview
Figure 2.1 is a flow chart illustrating the main steps undertaken in this study. The main elements of the study approach are summarized as follows:
Define “benchmark” targets, based on the AIA/RAIC 2030 Challenge and the Kyoto reference (1990 levels) Build a defensible base-year profile and a business-as-usual (BAU) scenario Explore “aggressive,” yet defensible, energy efficiency scenario (“Deep Green” scenario, or Scenario 1) for
years 2010 to 2030 Focus on advanced energy efficiency of buildings Consider all building markets and equipment as part of the target market Build market penetration rate scenarios Compare results of Scenario 1 to benchmark targets
Figure 2.1: Green Building Scenarios Process Flowchart
At the core of this approach are three important variables:
A defensible “business as usual” projection—The appendices elaborate how the BAU projections were built for the residential and commercial sectors.
Improving the unit performance of buildings—Aggressive but defensible unit performance upgrades have been elaborated.
Accelerating the market penetration of the advanced performance buildings—Plausible roll-out schedules have been formulated, while keeping in mind that public policy and market forces will ultimately drive penetration rates.
The approach is further elaborated below.
Define benchmarks
Develop archetypes
Determine equipment turnover rates
Determine market penetration rate of advanced performance
Does Scenario 1 meet or exceed targets?
Determine retrofit rate for remainder of market
Model all scenarios (Scenario 1, AIA/RAIC, BAU)
Compare results of Scenario 1 to AIA/RAIC targets
End
No
Yes

Green Building in North America
Background Paper One – Green Building Scenarios for 2030 7
2.2 Analysis Boundaries
2.2.1 Countries The analysis includes the buildings sector in three countries: Canada, Mexico and the United States. The analysis boundaries are specified below. There are minor differences in the analysis undertaken between some of the countries as we were limited to available data sources for each country and these were not always consistent in terms of date, data format, etc. We do not believe that these differences affect our conclusions.
2.2.2 Definitions of “Study Period,” “Base Year,” and “Business as Usual” The study period is 2005–2030, with study outputs presented in the following interim milestone years: 2008, 2010, 2015, 2020, and 2025.
The base-year profile provides a detailed description of “where” and “how” energy is currently used in the existing building stock. Although 2005 is the base year, 2008 was chosen as the starting point for the market penetration of the building efficiency measures in Canada and Mexico and 2010 in the United States.
The business-as-usual projection estimates the expected level of energy consumption that would occur over the study period in the absence of new, post-2007, energy efficiency initiatives The business-as-usual (BAU) projection is based on extrapolation of current stock growth rates coupled with energy-use intensities typical of new construction today, and with no significant policy initiatives that would fundamentally change current trends with respect to new building codes and to retrofit or renovation initiatives.
2.2.3 Building Segments For all three countries, the analysis included both the residential and commercial/institutional (hereafter referred to as the commercial) buildings sectors. Additional segmentation within these sectors is specified in Figure 2.2, as follows:

Green Building in North America
Background Paper One – Green Building Scenarios for 2030 8
Figure 2.2: Building Segmentation in the Three Countries
Sector Canada Mexico United States
Residential
Single-detached
Row Housing 4
Low-rise Multi-residential
High-rise Multi-residential
Mobile Homes
Commercial
Warehouses
Hotels and Restaurants5
Office Buildings6
Wholesale and Retail7
Theatres and Recreational
Religious Structures
Hospitals and Health
Educational
Supermarket
Other
2.2.4 Energy End-uses Profiled The analysis employs a bottom-up approach, in which energy end-uses of the buildings are profiled. An energy end-use is an amenity or service supplied jointly by energy and other components/equipment such as buildings, motors and lights. Energy is of no value to a user without first being transformed, by a piece of equipment, into a service of economic value. Examples of energy services include space heating, refrigeration, and public transit. The same energy service can frequently be supplied with different mixes of equipment and energy sources.
Energy end-uses can also be associated with a specific technology and its associated energy-efficiency characteristics, which can have different efficiency levels according to vintage and operating conditions. To conceive the higher-energy-efficiency scenarios, we have assumed increasing levels of efficiency for new and replacement equipment and appliances in buildings.
The energy end-uses profiled in the study are listed as follows below. These were initially derived from Canadian studies and adapted or adjusted as required for Mexican and US building stock.
4 For the purposes of this study, the row and low-rise multi-residential segments are considered to be non-existent in Mexico. 5 The US sector is further broken down into large hotels, small hotels, fast-food restaurants, and sit-down restaurants. 6 The US sector is further broken down into large office and small office. 7 The US sector is further broken down into large retail and small retail.

Green Building in North America
Background Paper One – Green Building Scenarios for 2030 9
Residential Sector
Using the measure of unit dwelling, whole-building and end-use intensities were developed for the following:
Space heating Space cooling Domestic hot water heating Appliances Lighting Other electronics Commercial sector
The commercial building sector is analyzed in terms of energy use per square meter (m2) of conditioned floor space, also taking a bottom-up approach. The breakdown of end-uses for the commercial building sector is as follows:
Space heating Space cooling Domestic hot water heating Lighting Auxiliary motors Auxiliary equipment
2.2.5 Modeling Platform Relatively similar spreadsheet-based modeling platforms were used to build the baseline, BAU and Deep Green scenarios for the three countries.
Canada and Mexico
The Canadian and Mexican residential building sectors were based on: i) Residential Sector Energy End-use Model (RSEEM) (Marbek’s end-use accounting model) and ii) HOT-2000.
HOT-2000 is commercially-supported, residential-building energy-use simulation software. HOT-2000 uses state-of-the-art heat loss/gain and system modeling algorithms to calculate household electricity use. It addresses:
electric, natural gas, oil, propane and wood space heating systems; domestic hot water (DHW) systems, from conventional to high-efficiency condensing systems; and the interaction effect between space-heating appliances and non-space-heating appliances, such as
lights and refrigerators.
The modeling platform used for the commercial building sectors in Canada and Mexico is Marbek’s CSEEM (Commercial Sector Energy End-use Model), calibrated to Canada’s CBECS (Commercial Building Energy Consumption Survey).
United States
Two similar spreadsheet tools were developed for use in the analysis of the residential and commercial sectors in the United States.
The residential sector spreadsheet was based on the Residential Energy Consumptions Survey (RECS) database of residential energy end-use. These data are derived from periodic energy-use surveys that document building characteristics, energy end-uses, energy sources and total energy use, for a representative selection of homes across the United States. Because the database has breakdowns of energy supply sources, these data can be used to calculate carbon emissions. The spreadsheet uses these stock data as a starting point, and then uses data from the US Energy Information Administration’s Annual Energy Outlook to project building starts and other stock change out to 2030. For the actual energy use of the stock we apply changing energy efficiency scenarios, as described elsewhere in this report. The residential stock is split into five housing types as noted above, 19 climatic regions, and 19 “vintages,” where a vintage includes the effects of year built, age, and whether there were any retrofit or renovation impacts on the stock. The model tracks the input source energy used (electricity, fuel, etc.) so that carbon emissions can be calculated and it allows on-site renewables to be specified to offset a fraction of the building load.
The commercial sector spreadsheet was similarly based on data in the CBECS database of commercial energy consumption. The CBECS building types were condensed to 13 of the most important subtypes, and the data are

Green Building in North America
Background Paper One – Green Building Scenarios for 2030 10
disaggregated for five climates. As with the residential model, the spreadsheet uses the stock data as a starting point, and then uses data from the US Annual Energy Outlook to project commercial building starts and other stock change out to 2030. We apply changing energy efficiency scenarios as described elsewhere in this report to each of the 19 vintages for each scenario. As above, the model tracks the input source energy used (electricity, fuel, etc.) so that carbon emissions can be calculated and it allows on-site renewables to be specified to offset a fraction of the building load. The final output shows the end-use breakdown of fuel used, including renewables, to supply building needs.
These models have the ability to assess many more parameters and details than could be addressed in this study. In general the energy savings strategies were applied across all building stock rather than be custom tailored to specific types of buildings in specific climates. This level of detail will be addressed in future studies. Both models allow the efficiency impacts to be managed in two ways—by the fraction of stock affected each year for any given strategy and by the reduction in energy use for that time period and vintage. These are explored in more detail later in the report.
2.3 Derivation of the Baseline and Business-as-Usual Profiles
2.3.1 Building Stock in the Study Period As further elaborated below, the energy and GHG profiles generated from this study are significantly influenced by the characterizations and projections of the growth of the residential and commercial building stock to 2030. This subsection provides an overview of the approach taken to derive the building stock profile, with further elaboration provided in Appendices A and B.
The building stock profile is generated from an initial base profile that is then modified over time as follows:
The base-year profile: This is an accounting of both residential and commercial stock as it exists in 2005 (or nearest available dataset), the starting point for the analysis.
New building stock constructed in the 2005–2030 period: This is the best attempt to estimate the volume and type of newly constructed buildings for the years 2005–2030. Various credible sources have been used, as elaborated below. It should be noted that, where projections rely on data sources that do not run to 2030, a simple straight-line extrapolation has been used from the last available projection.
Renovated buildings: Renovations, particularly, those that are more comprehensive in nature, represent an enormous opportunity to integrate energy retrofits when those activities occur. For the most part, the pace and type of renovation activity is dictated by market forces. Therefore, historical renovation rates are thought to be a defensible indicator of future rates and this is the approach used in the study.
For the most part, the building stock characteristics and patterns of the United States and Canada are similar. However, there are some important differences when the Mexico profile is considered. First, the residential housing stock in Mexico is projected to grow at a much higher rate, about four percent per year, driven in part by federal government commitments to provide new and affordable housing. Second, renovation activity in Mexico has been virtually non-existent and this pattern has been assumed in this study.
United States
The Energy Information Agency within the US Department of Energy (US DOE) funds the creation and updating of commercial and residential building stock databases, updated by ongoing surveys, to provide the two main data sources for the derivation of the base-year US building stock.
The Commercial Buildings Energy Consumption Survey (CBECS) 2003 and resulting database is the key source used for the commercial sector.
The Residential Energy Consumption Survey (RECS) 2003 and resulting database is the key source used for the residential sector.
The building stock growth projections for the BAU scenario were developed from the US DOE’s Annual Energy Outlook 2007 with projections to 2030 (AEO 2007).
Canada
The base-year residential sector profile drew upon Canada’s 2001 Census database, from Statistics Canada (StatsCan), and Natural Resources Canada (NRCan) data sources. The StatsCan 2001 Census data were used to

Green Building in North America
Background Paper One – Green Building Scenarios for 2030 11
establish the allocation of dwelling stock by dwelling type. The NRCan Canadian Energy Outlook 2006 database was used to derive the base-year volume of dwellings and the projection of residential stock to 2030.8
The NRCan Canadian Energy Outlook database was also used to derive the base-year volume of commercial building stock and the projection of this stock to 2030.
Mexico
The main sources used to derive the residential building stock profile were the Comisión Nacional de Vivienda (Conavi) and the Instituto Nacional de Estadística, Geografía e Informática (INEGI).
Given that there are no official statistics on commercial buildings in Mexico, estimations of building stock by types of buildings were made based on a number of sources:
Fideicomiso para el Ahorro de Energía Eléctrica (Fide): Total energy use, floor area, and energy intensity per square meter, by building types based on individual descriptions.
Comisión Nacional para el Ahorro de Energía (Conae): Office building stock and energy intensity. Annual reports of commercial sector companies and trade associations: Building stock and floor area.
2.3.2 Derivation of the Baseline Profiles of Energy Use and Greenhouse Gas (GHG) Emissions The baseline profile of energy use in the target building segments, as listed above in Section 2.1.2, is derived on the basis of the following relationship:
Total secondary (on-site) energy use in building segment = building segment energy use/unit building (or /unit floor area) x number of buildings (or floor area) within the building segment.
This is a bottom-up analysis that relies on an effective utilization of key data sources and assumptions relating to both the building stock (as discussed above) and the derivation of the overall building-specific energy end-use intensities (EUIs). The bottom-up analysis generates a rolled-up profile of total energy use and GHG emissions, over time, for each country.
The overall whole-building energy end-use for a given building segment in a given year is derived as the sum of the energy end-use intensities for each subset of the stock in that time period (new, renovated, existing) times their respective weighting in terms of building area, accounting for growth, demolition and conversions.
The details of the baseline EUI derivations are provided in Appendices A and B. The general approach and identification of key data sources are discussed below for each country.
Canada
Over the years, Marbek has built an extensive in-house database of energy end-use characteristics in the building sectors, on the basis of several utility- and government-funded studies, including current work in British Columbia, Newfoundland and Labrador. While some of these data sets are rich in comprehensiveness and detail, they are limited to the jurisdictions and service territories for which the studies were commissioned. Therefore, the approach used for this study was to refer to the national inventory of end-use data and fuel shares as obtained from Natural Resources Canada (NRCan) and adjust the energy intensities and fuel shares based on information in the Marbek database.
The main data sources, for both sectors, are as follows:
NRCan: Energy Use Data Handbook (EUDH), which is compiled from various residential sector surveys
NRCan: 2003 Survey of Household Energy Use (SHEU) Canadian Building Energy End-use Data and Analysis Centre (CBEEDAC) NRCan: The EnerGuide for Houses Database NRCan: Energy Consumption of Major Household Appliances Shipped in Canada Utility equipment saturation surveys and customer surveys Statistics Canada: Household Facilities and Equipment Survey
8 Natural Resources Canada. 2006. Canada’s Energy Outlook: The Reference Case 2006. Online at <http://www.nrcan.gc.ca/com/resoress/publications/peo/peo-eng.php>.

Green Building in North America
Background Paper One – Green Building Scenarios for 2030 12
Marbek’s in-house database, which, among other things, contains residential building archetypes for Ontario, Quebec, Manitoba and British Columbia
In RSEEM, energy consumption data for Canada was calibrated according to NRCan’s Canada’s Energy Outlook: The Reference Case 2006.
United States
Energy-use data for US building stock are available from a variety of sources. The detail and accuracy of both building segment energy uses (e.g., small retail stores) and end-use breakdowns within segments (e.g., heating, cooling, lighting, refrigeration, etc.) vary considerably amongst the assorted data sources. These sources include both measured and simulated data that a variety of different agencies collect by state, by region, by utility service territory, etc. Since there is not yet a standard procedure used for collection and analysis of the data and, in keeping with the uncertainties involved in extrapolating both building stock and energy-use intensities over many years, we elected to use energy-use intensities derived from the CBECS and RECS databases referred to above. These surveys include measured energy data derived from utility bills for a selection of buildings across the US climatic zones, disaggregated by building subtype and age. These databases also provide a breakdown of site energy use by fuel type. A variety of other sources has been used in other studies to estimate end-use breakdowns from the building totals but this was not explored in this study.
Mexico
Energy consumption data for Mexico were calibrated to data from Mexico’s Federal Electrical Utility (CFE) as well as national data on fossil fuel consumption.
General data for Mexico’s commercial sector were obtained from:
Sener (Mexico’s Secretariat of Energy): National Energy Balance (LP and natural gas use); Fide: Energy intensity per square meter by building types based on individual descriptions; and Conae: Office energy intensity.
2.3.3 Business-as-usual (BAU) Derivation The business-as-usual (BAU) scenario is a projection of building-sector energy demand to 2030, in the absence of any major new and incremental institutional market interventions after 2005. It is the baseline against which the Deep Green scenario of energy savings is calculated. The BAU projection includes “natural energy efficiency changes,” that is, increases in average end-use efficiency as new buildings built to modern energy codes replace older building stock with lower efficiencies, and also includes other factors that are projected to occur over the study period in the absence of new and incremental market interventions.
Using the data sources listed in the previous section, the BAU was derived, taking into account recent changes to the building code, commitments made by some Canadian provincial governments that will affect future building codes, as well as consultations among building sector professionals as to anticipated improvements in individual energy end-uses.
The method used to derive the BAU scenario takes into account four important dynamics that affect energy end-use intensities and aggregate energy use in buildings over this time period:
New buildings and dwellings are being constructed and added to the dwelling stock. The whole-building end-use intensities (EUIs) of newly built stock should be lower than the existing stock average, although this is not always the case since service and amenity levels change.
Existing buildings are demolished and removed from the stock; in general these are expected to be older buildings with EUIs that are probably higher than average.
Some portion of the existing, base-year building stock will undergo some form of energy retrofit, either as part of a renovation or as targeted solely to improve energy performance. Under either circumstance, the EUIs of these existing buildings will decline.
Natural replacement of equipment: There will be naturally occurring improvements to unit energy performance as failed energy-using equipment is replaced with a modern equivalent system.
Green Building in North America
Background Paper One – Green Building Scenarios for 2030 13
While each of these trends will reduce energy use, there are also BAU forces that work against these reductions in EUI. The average size of houses in most of North America continues to increase (e.g., the US Annual Energy Outlook projects a 13 percent increase in average size of homes in the entire stock, from 2005 to 2030), so although EUI on a unit-area basis may decrease overall, dwelling EUI in some markets may see little change. Despite gains in improving the thermal integrity of the envelope and HVAC efficiencies, some other end-uses are increasing, such as increased use of electronics in homes and plug loads in the commercial sector. The net result from measured data is that the EUI of new buildings, on average, has not fallen as fast as would have been expected from the intrinsic efficiency data alone.
2.3.4 Energy to Greenhouse Gas Conversions One of the important outputs from this analysis is the estimation of the GHG reduction in the Deep Green scenario. In order to do this, all end-use energy is converted to emissions of carbon dioxide equivalent (CO2eq). One of the key inputs to the derivation of the GHG emissions is the GHG conversion coefficient for electric power generation. The coefficients used for each of the three countries for both electricity and fossil fuel energy sources are noted below. For a fossil fuel we use natural gas as a basis for the conversions since, on a North American basis, this is the primary source of fuel use in buildings.
Canada
GHG emissions are calculated using Environment Canada’s national average9 of 0.222 kilogram (kg) of CO2eq for every kilowatt-hour (kWh) of electricity generated and 1.90263 kg of CO2eq for every cubic meter (m3) of natural gas consumed.
Mexico
GHG emissions are calculated using national averages of 0.6539 kg CO2eq for every kWh of electricity generated and 1.90263 kg CO2eq for every m3 of fossil fuel consumed.
United States
GHG emissions for electricity in the United States vary widely, by almost a factor of 10:1 between states where electricity is largely generated by coal-fired power plants (e.g., North Dakota) and states where electricity is derived largely from hydroelectric and nuclear power generation (e.g., Washington and California). The national average used in this study was 0.646 kg CO2eq per kWh generated. The national average for natural gas use was 1.903 kg CO2eq for every m3 of natural gas.
2.4 Establishing the Deep Green Scenario
This subsection provides an overview of how the Deep Green scenario was derived, with further explanation in Appendices A and B. There are two main dimensions to the construct of the scenario:
the assumed energy efficiency performance improvements; and the rate at which the energy performance improvements are assumed to be applied to the building target
markets. Each of these dimensions is addressed in the discussion below.
2.4.1 Define Building Energy Efficiency Target Markets The market was divided into new and existing buildings. Activities in existing buildings were then further specified as follows:
A renovation is defined as an activity where the building changes are extensive enough to enable integration of aggressive energy efficiency measures into the project. This might involve building envelope improvements, as well as mechanical and electrical performance upgrades. Hence, the eligible market for major renovations is only a small subset of the overall existing buildings market.
A retrofit is defined as an intervention or change in the building solely focused on improving the energy performance of the building.
9 See <http://www.ec.gc.ca/pdb/ghg/inventory_report/2004_report/ta9_1_e.cfm>.
Green Building in North America
Background Paper One – Green Building Scenarios for 2030 14
Equipment replacement: It is assumed that a portion of the building stock will not undergo any renovations or retrofits to achieve specific energy performance improvements and, hence, this portion of the market is eligible for energy efficiency associated with equipment replacement as existing equipment and systems are replaced when they fail.
2.4.2 Define Building Archetypes The construct with which to measure the effect of energy performance improvements is the building “archetype,” which is a physical depiction of a “representative” building. Archetype characteristics are derived for both the baseline buildings and performance up-grades. Analysis of the energy savings and resulting GHG reduction starts with a depiction of baseline archetypes for new homes and commercial buildings built in 2005.
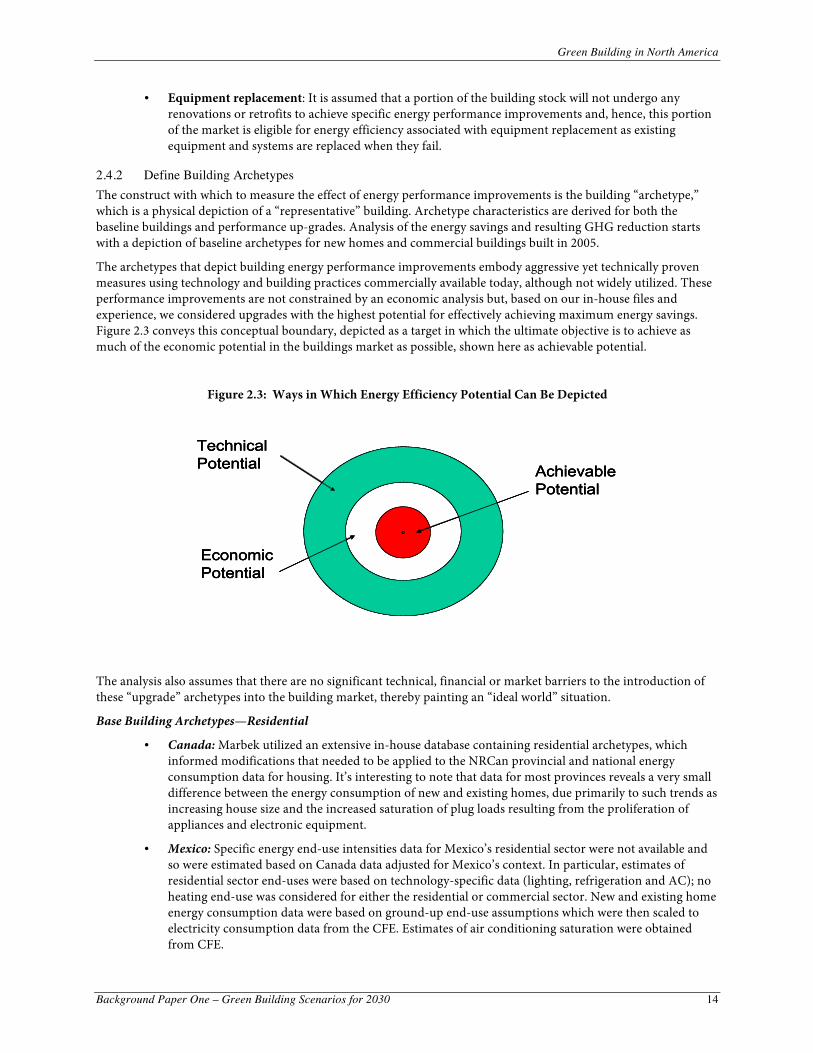
The archetypes that depict building energy performance improvements embody aggressive yet technically proven measures using technology and building practices commercially available today, although not widely utilized. These performance improvements are not constrained by an economic analysis but, based on our in-house files and experience, we considered upgrades with the highest potential for effectively achieving maximum energy savings. Figure 2.3 conveys this conceptual boundary, depicted as a target in which the ultimate objective is to achieve as much of the economic potential in the buildings market as possible, shown here as achievable potential.
Figure 2.3: Ways in Which Energy Efficiency Potential Can Be Depicted
Technical Potential
Economic Potential
Achievable Potential
Technical Potential
Economic Potential
Achievable Potential
Technical Potential
Economic Potential
Achievable Potential
The analysis also assumes that there are no significant technical, financial or market barriers to the introduction of these “upgrade” archetypes into the building market, thereby painting an “ideal world” situation.
Base Building Archetypes—Residential
Canada: Marbek utilized an extensive in-house database containing residential archetypes, which informed modifications that needed to be applied to the NRCan provincial and national energy consumption data for housing. It’s interesting to note that data for most provinces reveals a very small difference between the energy consumption of new and existing homes, due primarily to such trends as increasing house size and the increased saturation of plug loads resulting from the proliferation of appliances and electronic equipment.
Mexico: Specific energy end-use intensities data for Mexico’s residential sector were not available and so were estimated based on Canada data adjusted for Mexico’s context. In particular, estimates of residential sector end-uses were based on technology-specific data (lighting, refrigeration and AC); no heating end-use was considered for either the residential or commercial sector. New and existing home energy consumption data were based on ground-up end-use assumptions which were then scaled to electricity consumption data from the CFE. Estimates of air conditioning saturation were obtained from CFE.

Green Building in North America
Background Paper One – Green Building Scenarios for 2030 15
United States: Overall residential energy performance data for the spreadsheet were derived from the RECS database. There is a wide range of residential housing types in the United States whose end-uses vary enormously by climate, house vintage, family size, income level, etc. Examining the details of specific trends in end-use over time was beyond the scope of this study. The US Department of Energy publishes its Buildings Energy Data Book (latest version 2006), which contains breakdowns of energy use by end-use function and other information about trends in these values. The US Annual Energy Outlook also presents statistical data on changes in these end-uses, annually from 2004 to 2030. These trends are based on the Energy Information Administration’s assessment of a business-as-usual environment. We reviewed the data from these sources, studied more recent reports on savings that are possible from emerging technologies and new policies to accelerate their adoption, and after further group discussion finally generated our own energy savings structures for the Deep Green scenario, based on new, renovated and retrofit buildings.
Base Building Archetypes—Commercial
Canada: Marbek utilized an extensive in-house database containing commercial archetypes, which informed modifications that needed to be applied to the NRCan provincial and national energy consumption data for buildings. In order to predict the change in energy intensity by end-use in the commercial building sector as a whole, NRCan data were used that were based on the projected change in energy efficiency of end-use equipment over time.
Mexico: As noted, specific energy end-use intensities for Mexico’s commercial sectors were not available and so were estimated based on Canada data adjusted for Mexico’s context. Cooling end-use was considered greater than Canada’s reference for commercial buildings and scaled appropriately.
United States: US data were derived from the CBECS 2003 database, supplemented by data from the US DOE Buildings Energy Databook for 2006. CBECS contains measured whole-building energy use, with a breakdown by source (e.g., natural gas, electricity), that is statistically sampled by region and commercial subtype so that it is representative in aggregate of the US commercial stock at the time the sample data were collected. End-use breakdowns within this sector vary widely by building type (e.g., restaurant vs. office), by climate region and latitude (e.g., Minnesota vs. Florida), and by vintage or age. Accordingly, we used engineering estimates of best practice in terms of overall improvement levels possible in the whole-building EUIs, without specifically examining the impacts of each end-use, as these would vary widely be climate and building subtype. After reviewing the EIA and DOE sources, and reviewing the trends in energy efficiency by leading practitioners, owners, and manufacturers, we developed aggressive but achievable energy savings scenarios. As noted earlier, for time and logistical reasons we used the same factors for all climates and building types, although in fact they would likely vary.
2.4.3 Energy Efficiency Upgrade Archetypes and Analysis Assumptions Two upgrade archetypes, Super-efficient Building 1 and Super-efficient Building 2 (SE1 and SE2), were defined for both the residential and the commercial building archtypes. These four archetypes incorporate advanced building construction techniques, equipment and technology that are available today, but may not necessarily be cost-effective or widely used at the present moment.
SE1 achieves roughly 50 to 85 percent in whole-building energy savings relative to the base-year archetype. SE1 represents the technically best available performance, by using state-of-the-art building envelope construction materials and methods as well as state-of-the-art energy HVAC equipment.
SE2 achieves a roughly 40 to 60 percent whole-building energy savings relative to the base-year archetype. Relative to SE1, SE2 is less aggressive and more achievable in the near term, using more cost-effective and conventional equipment to achieve a building performance level that is still well beyond current conventional construction practice.
See Figures A1 and A2 in Appendix A and Figures B1 and B2 in Appendix B for illustrations of the possible prescriptive features of SE1 and SE2 for residential and commercial buildings, respectively, for selected North American markets.
Green Building in North America
Background Paper One – Green Building Scenarios for 2030 16
To understand how the energy performance estimates from these archetypes upgrades are applied to the overall market, we refer again to the basic construct for estimating segment energy use, as follows:
Total secondary (on-site) energy use in building segment = building segment energy use/unit building (or /unit floor area) x number of buildings (or floor area) within the building segment.
For the energy efficiency upgrade options, the building segment energy use per unit building or unit area is the difference between the base case and the upgraded unit consumption. For the analysis, the routes by which the energy performance improvements are brought to the target markets vary according to the specific circumstances of the new and existing buildings markets. The specific assumptions are highlighted below.
New construction: The upgraded archetype energy performance is estimated as an improvement when compared to the performance of the new construction baseline archetype. New construction offers an enormous opportunity to “get it right” the first time, using integrated design, siting and all the appropriate technology options. Hence, the optimum unit performance to be achieved by use of all the strategies and technical measures described in the Appendices is applied to the new stock.
Renovations and retrofits: Neither the renovation nor retrofit upgrades can be expected to achieve the same level of performance as a new construction upgrade. A combination of modeling and judgment was used to scale back the scope of the possible technical measures, which results in a lower unit performance improvement than that of the new construction archetypes. Renovations and retrofits are less aggressive than new construction in what can be achieved through building-envelope improvements. For example, the penetration of ground-source heat pumps in existing buildings markets, both residential and commercial, is considered to be far less proportionally than what can be done in new building stock.
The expected energy performances of the renovation and retrofit archetypes are estimated by a comparison to the performance of the new construction baseline archetype.
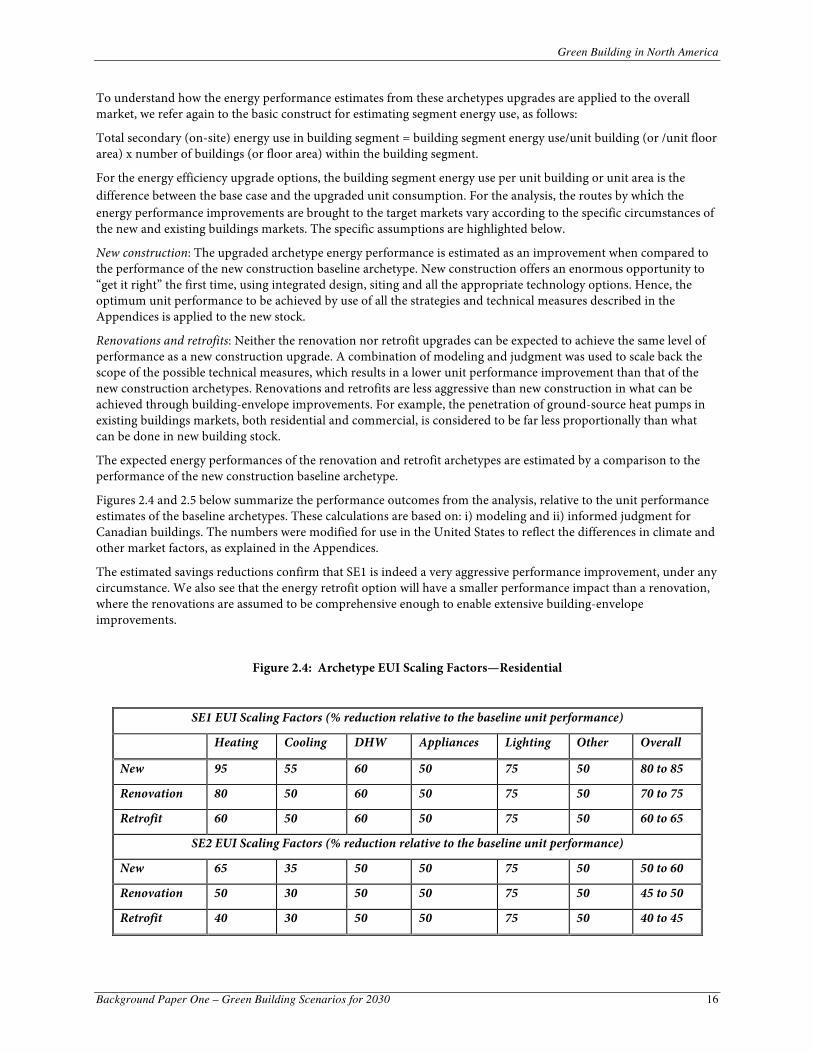
Figures 2.4 and 2.5 below summarize the performance outcomes from the analysis, relative to the unit performance estimates of the baseline archetypes. These calculations are based on: i) modeling and ii) informed judgment for Canadian buildings. The numbers were modified for use in the United States to reflect the differences in climate and other market factors, as explained in the Appendices.
The estimated savings reductions confirm that SE1 is indeed a very aggressive performance improvement, under any circumstance. We also see that the energy retrofit option will have a smaller performance impact than a renovation, where the renovations are assumed to be comprehensive enough to enable extensive building-envelope improvements.
Figure 2.4: Archetype EUI Scaling Factors—Residential
SE1 EUI Scaling Factors (% reduction relative to the baseline unit performance)
Heating Cooling DHW Appliances Lighting Other Overall
New 95 55 60 50 75 50 80 to 85
Renovation 80 50 60 50 75 50 70 to 75
Retrofit 60 50 60 50 75 50 60 to 65
SE2 EUI Scaling Factors (% reduction relative to the baseline unit performance)
New 65 35 50 50 75 50 50 to 60
Renovation 50 30 50 50 75 50 45 to 50
Retrofit 40 30 50 50 75 50 40 to 45

Green Building in North America
Background Paper One – Green Building Scenarios for 2030 17
Figure 2.5: Archetype EUI Scaling Factors—Commercial
SE1 EUI Scaling Factors (% reduction relative to the baseline unit performance)
Heating Cooling DHW Appliances Lighting Other Overall
New 90 60 50 50 60 20 60 to 65
Renovation 80 50 50 50 60 10 55 to 60
Retrofit 60 50 50 50 60 10 50 to 55
SE2 EUI Scaling Factors (% reduction relative to the baseline unit performance)
New 50 45 40 40 40 10 50 to 60
Renovation 40 35 40 40 40 0 45 to 50
Retrofit 35 25 40 40 40 0 40 to 45
2.4.4 Define Archetype Market Penetration Schedule The roll-out schedule defines the rate at which the two high-performance archetypes penetrate the market in the Deep Green scenario. Appendices A and B describe the specific roll-out schedules that were used for SE1 and SE2, in both the residential and commercial sectors, respectively.
The assumptions for the market penetration of the modeled upgrade archetypes are elaborated below:
Energy improvements that piggyback on major renovations are assumed to take place according to market trends for renovations. The market for renovations is the base-year stock.
The balance of the existing buildings market not affected by major renovations is an eligible market for energy retrofits. The derived average annual retrofit rate was calculated based on the target of including virtually all of the existing buildings stock not affected by renovations by 2030. The market for renovations is the base-year stock.
In any given year, once the energy retrofits take place, the balance of the existing buildings market not affected is the market for energy-using equipment improvements, at the rate of natural stock turn-over.
2.4.5 How Outputs Are Conveyed The modeling outputs are presented in terms of the following units:
Secondary, purchased-energy use, broken down by fuel type (i.e., electricity and fossil fuel)
GHG emissions (the emissions coefficients for electricity use are based on national averages weighted to the assumed marginal generation).
In addition, to inform the public policy discussions, if a gap exists between the modeled scenario and the AIA/RAIC targets, the outputs will include an estimate of how much on-site renewable energy or clean energy from the grid is required to make buildings in the residential and commercial sectors carbon neutral.
2.5 Limitations and Exclusions
For a high-level, policy-oriented exercise of this nature we have necessarily had to work within certain data and analysis limitations, in part due to budget and time constraints. While we have a reasonably high degree of confidence in the empirical outputs, it is worthwhile to note some of the important limitations and exclusions.

Green Building in North America
Background Paper One – Green Building Scenarios for 2030 18
We make no effort to predict the specific impacts of evolving policy and attitudes on investments in efficiency in the building sector. For example, the changing US political climate with an election upcoming, increased discussion of climate change and carbon emissions policies by industry, and new state and regional initiatives to address energy use all are likely to have measurable but unknown impacts on investments and trends in efficiency in the building sector.
Given these and other political and economic uncertainties, these studies are useful to illustrate potentials for change and what could be, rather than predictors of what will be. While there is always technical uncertainty in the performance and cost of specific technical solutions to saving energy, in this context these technical uncertainties are probably small compared to the larger socio-economic context in which the study is presented.
Building Stock Data
Mexico—There is quite a high degree of uncertainty associated with the baseline and projected commercial building stock in Mexico.
Canada—Projections of residential building stock do not seem to take into account the possible long-term effects of eventual integration by municipalities of “Smart Growth” planning applications, which result in higher densities.
US—The stock growth rates are extrapolations of current trends, which can be subject to rapid change. In all scenarios the uncertainties in the economic climate and its impact on building starts is an unknown. At the start of this project, residential new construction in the United States was setting new records on a quarterly basis. In less than a year’s time, the impact of the sub-prime mortgage problems has rippled through the homebuilding community, lowering prices and substantially reducing housing starts. This reminds us of the speed with which apparently well-established trends can change.
Energy Use
Canada—The energy end-use intensities are reasonably defensible at the whole-building level, but there is less precision at the level of individual end-uses (only the average consumption of the existing building stock, by sector, was available). Also, there is not a clear delineation of the commercial building stock by segment (i.e., certain segments are lumped together, including hotels and restaurants, which could potentially exhibit very different energy and resource consumption profiles).
Mexico—For the commercial sector there is very little defensible energy performance. For the Mexican residential sector, very little data were available in terms of the breakdown by end-use of the energy consumption of a typical home.
United States—There are large and growing databases of energy performance data but the building stock is diverse and complex. There is not yet complete agreement on how to disaggregate the various commercial sub-sectors, how to properly characterize operational issues that affect actual energy use, how to treat commercial buildings that have growing “process loads,” such as data centers, or how to meter or allocate the growing use of distributed heating and cooling systems in cities and campuses, etc. New buildings are not performing consistently at levels expected and the origins of these discrepancies—e.g., construction defects, lack of commissioning, operational failures—are still under study. But while the details will continue to be studied and refined, the sector-level energy-use predictions will continue to be tracked with some degree of accuracy, even if all the causal reasons for those changes are not clear.

Green Building in North America
Background Paper One – Green Building Scenarios for 2030 19
3. High-Level Results and Implications
This section presents the overall, high-level results and implications of the Deep Green scenario analysis. Four key aspects are discussed: i) affects of the scenarios in relation to the anticipated new and existing buildings markets, ii) the energy savings impacts, iii) the GHG reductions impacts, and iv) the scale of the GHG reduction gap to be met by zero- or low-carbon energy sources.
3.1 Profile of the Affected Target MarketS
As elaborated in Section 2, the energy efficiency target market for buildings encompasses both the new and existing buildings stocks, which are affected by various market penetration scenarios. In this sub-section we briefly profile the volumes and types of the building markets affected by the market penetration roll-out assumptions, starting with a profile of the baseline and BAU buildings stocks. Key indicators are presented, followed by specific metrics for the residential and commercial sectors.
3.1.1 A Snapshot of the Target Markets Figure 3.1 presents some key indicators of the affected building markets, for both the residential and commercial markets and by country. Figures 3.2 to 3.7 provide further elaboration of the overall affected markets for building energy efficiency improvements. Some observations according to country are presented as follows:
Canada
Residential stock grows 33 percent and commercial stock grows 62 percent between the base year and 2030.
Roughly 90 percent of the existing residential and commercial buildings undergo an energy retrofit or renovation.
By 2030, the affected residential market is: 25 percent new construction, 67 percent affected by some sort of major renovation or retrofit, and the remaining 8 percent unaffected.
By 2030, the affected commercial market is: 39 percent new construction, 55 percent affected by some sort of major renovation or retrofit, and the remaining 6 percent unaffected.
Mexico
Residential stock grows 60 percent and commercial stock grows 131 percent between the base year and 2030.
Roughly 87 percent of the existing commercial stock and 54 percent of the existing residential stock undergo an energy retrofit or renovation.
By 2030, the affected residential market is: 34 percent new construction, 38 percent affected by some sort of major renovation or retrofit, and the remaining 28 percent unaffected.
By 2030 the affected commercial market is: 57 percent new construction, 38 percent affected by some sort of major renovation or retrofit, and the remaining 5 percent unaffected.
United States
Residential stock grows 31 percent in number of units and 48 percent in floor area, and commercial stock grows 41 percent, between 2005 and 2030.
Roughly 90 percent of the existing residential and commercial buildings undergo an energy retrofit or renovation.
By 2030 the affected residential market is: 26 percent new construction, 41 percent affected by some sort of major renovation or retrofit, and the remaining 32 percent unaffected.
By 2030 the affected commercial market is: 36 percent new construction, 47 percent affected by some sort of major renovation or retrofit, and the remaining 17 percent unaffected.

Green Building in North America
Background Paper One – Green Building Scenarios for 2030 20
Figure 3.1: North American Building Stock Profile, 2005–2030
Residential Sector
(dwelling units)
Commercial sector
(m2)
United States
Mexico Canada United States
Mexico Canada
Total base-year units (residential = dwellings; commercial = floor space)
112,000,000 25,150,076 12,003,898 6.66B 154,600,000 574,958,400
Single-detached, as % of base-year total
85 55 N/A N/A
Total BAU stock in 2030 144,000,000 40,428,450 15,948,520 9.30B 357,357,689 933,255,349
Total newly built stock 2005–2030
38,100,000 15,278,373 3,944,622 3.35B 202,757,689 364,902,443
New buildings: average annual growth rates (%)
1.6 1.92 1.15 2.3 3.4 1.96
New stock as a % of total stock in 2030
26% 38 25 36% 57 39
Renovation rate: % total existing stock/annum growth rate
N/A 0 2.9 N/A 2.8 2.7
Total building stock affected by renovation take-up
N/A 0 5,770,515 N/A 76,414,932 290,245,650
Retrofit rate: % total existing stock/annum growth rate
N/A 3.25 3.25 N/A 3.25 3.25
Total building stock affected by retrofit take-up
N/A 17,982,304 5,153,032 N/A 64,271,068 232,966,494
Total building stock affected by renovation and retrofit take-up (% total existing market)
N/A 71.5 91 N/A 91 91

Green Building in North America
Background Paper One – Green Building Scenarios for 2030 21
Figure 3.2: Residential Target Market—Canada
Figure 3.3: Residential Target Market—Mexico
Residential Target Market - Canada
0
2
4
6
8
10
12
14
16
18
2005 2010 2015 2020 2025 2030
Mill
ions
of D
wel
lings
RetroRenoNewExisting
Residential Target Market - Mexico
0
5
10
15
20
25
30
35
40
45
2005 2010 2015 2020 2025 2030
Mill
ions
of D
wel
lings
RetroRenoNewExisting

Green Building in North America
Background Paper One – Green Building Scenarios for 2030 22
Figure 3.4: Residential Target Market—United States
Figure 3.5: Commercial Target Market—Canada
Commercial Target Market - Canada
0
100
200
300
400
500
600
700
800
900
1000
2005 2010 2015 2020 2025 2030
Mill
ions
of m
2
RetroRenoNewExisting
Residential Target Market - US
0
20
40
60
80
100
120
140
160
2005 2010 2015 2020 2025 2030
Mill
ions
of D
wel
lings
RetroRenoNewExisting
`

Green Building in North America
Background Paper One – Green Building Scenarios for 2030 23
Figure 3.6: Commercial Target Market—United States
Figure 3.7: Commercial Target Market—Mexico
Commercial Target Market - Mexico
0
50
100
150
200
250
300
350
400
2005 2010 2015 2020 2025 2030
Mill
ions
of m
2
RetroRenoNewExisting
Commercial Target Market - US
0
2000
4000
6000
8000
10000
2005 2010 2015 2020 2025 2030
Mill
ion
of m
2 RetroRenoNewExisting`

Green Building in North America
Background Paper One – Green Building Scenarios for 2030 24
3.1.2 Residential and Commercial Base-year and New Construction Target Markets Figures 3.8 to 3.13 profile the residential base-year and new construction target markets. Key observations are presented below for each of the three countries.
Canada—Residential
Figure 3.8 profiles the Canadian baseline market. In 2005, the Canadian residential building stock comprised about 12 million dwellings, of which about 55 percent were low-rise single-detached and 9.5 percent were mid- to high-rise multi-residential units.
Figure 3.9 profiles the projected new construction in the Canadian residential sector for the 2005–2030 period. It is projected that by 2030, there will be nearly 16 million dwellings, of which about 25 percent will be newly built stock. Approximately 53 percent of the new stock is projected to be single-detached.
Figure 3.8: Base-year Residential Stock Distribution, by Type—Canada
Base Year Residential Stock Distribution by Type - Canada
0
1
2
3
4
5
6
7
Attached/Row High-riseApartment
Low-riseApartment
Mobile Single-detached
Mill
ions
of D
wel
lings
Total

Green Building in North America
Background Paper One – Green Building Scenarios for 2030 25
Figure 3.9: Residential New Construction, by Type—Canada
Mexico—Residential
Figure 3.10 profiles the Mexican baseline market. In 2005, the residential market comprised about 25 million dwellings, of which about 85 percent are low-rise single-detached and 15 percent are mid- to high-rise multi-residential units.
Figure 3.11 profiles the projected new construction in the Mexican residential sector to 2030. It is projected that by 2030, there will be about 40 million dwellings, of which approximately 38 percent will be newly built stock. Approximately 41 percent of the new stock is projected to be single-detached, indicating a major shift in dwelling types to a denser development form.
Residential New Construction by Type - Canada
0
0.5
1
1.5
2
2.5
3
3.5
4
4.5
2005 2010 2015 2020 2025 2030
Mill
ions
of D
wel
lings
Single-detachedMobileLow-rise ApartmentHigh-rise ApartmentAttached/Row

Green Building in North America
Background Paper One – Green Building Scenarios for 2030 26
Figure 3.10: Base-year Residential Stock Distribution, by Type—Mexico
Figure 3.11: Residential New Construction, by Type—Mexico
Base Year Residential Stock Distribution by Type - Mexico
0
5
10
15
20
25
High-rise Apartment Single-detached
Mill
ions
of D
wel
lings
Total
Residential New Construction by Type - Mexico
0
2
4
6
8
10
12
14
16
18
2005 2010 2015 2020 2025 2030
Mill
ions
of D
wel
lings
Single-detachedHigh-rise Apartment

Green Building in North America
Background Paper One – Green Building Scenarios for 2030 27
United States—Residential
Figure 3.12 profiles the US baseline market. In 2005, the US residential building stock comprised about 112 million dwellings, of which about 59 percent were low-rise single-detached and 16 percent were mid- to high-rise multi-residential units.
Figure 3.13 profiles the projected new construction in the US residential sector for the 2005–2030 period. It is projected that by 2030, there will be nearly 144 million dwellings, of which about 26 percent will be newly built stock. Approximately 59 percent of the new stock is projected to be single-detached.
Figure 3.12: Base-year Residential Stock Distribution, by Type—United States
Base Year Residential Stock Distribution by Type - US
0
20
40
60
80
100
Attached/Row High-riseApartment
Low-riseApartment
Mobil Silgle-detached
Mill
ions
of D
wel
lings
Total

Green Building in North America
Background Paper One – Green Building Scenarios for 2030 28
Figure 3.13: Residential New Construction, by Type—United States
Figures 3.14 to 3.19 profile the commercial base-year and new construction target markets. Key observations are presented below for each of the three countries.
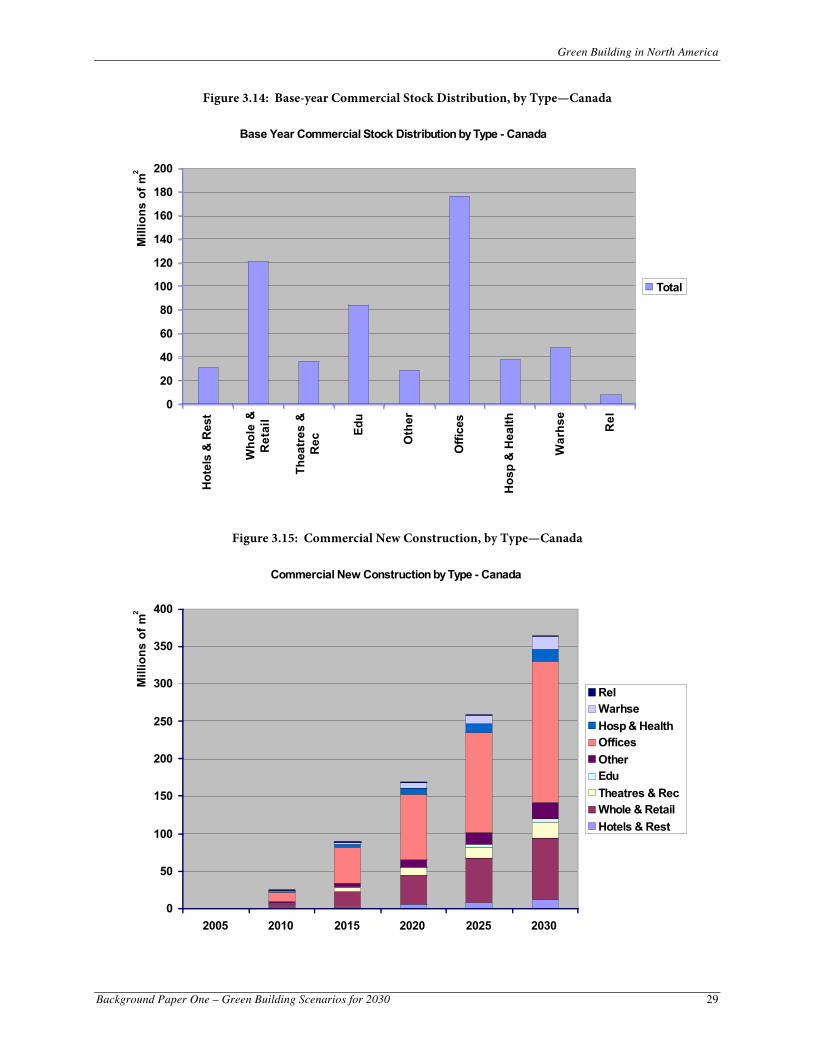
Canada—Commercial
Figure 3.14 profiles the Canadian baseline market according to building type. In 2005, the Canadian commercial building stock comprised about 575 million square meters of floor space. As shown, the commercial market is quite diffuse but two segments, office and wholesale/retail, represent 318 million square meters of floor space, or 55 percent of the total base-year stock.
Figure 3.15 profiles the projected new commercial building stock in Canada. It is projected that by 2030, there will be about 933 million square meters of floor space, of which approximately 39 percent will be newly built stock. Approximately 75 percent of the new stock is projected to be in the office and wholesale/retail segments.
Residential New Construction by Type - US
0
20
40
60
80
100
120
140
160
2005 2010 2015 2020 2025 2030
Mill
ions
of D
wel
lings
Silgle-detachedMobilLow-rise ApartmentHigh-rise ApartmentAttached/Row
Green Building in North America
Background Paper One – Green Building Scenarios for 2030 29
Figure 3.14: Base-year Commercial Stock Distribution, by Type—Canada
Figure 3.15: Commercial New Construction, by Type—Canada
Base Year Commercial Stock Distribution by Type - Canada
0
20
40
60
80
100
120
140
160
180
200
Hot
els
& R
est
Who
le &
Ret
ail
Thea
tres
&R
ec
Edu
Oth
er
Offi
ces
Hos
p &
Hea
lth
War
hse
Rel
Mill
ions
of m
2
Total
Commercial New Construction by Type - Canada
0
50
100
150
200
250
300
350
400
2005 2010 2015 2020 2025 2030
Mill
ions
of m
2
RelWarhseHosp & HealthOfficesOtherEduTheatres & RecWhole & RetailHotels & Rest

Green Building in North America
Background Paper One – Green Building Scenarios for 2030 30
Mexico—Commercial
Figure 3.16 profiles the Mexican baseline market according to building type. In 2005, the Mexican commercial building stock comprised about 154 million square meters of floor space. As shown, the commercial market is quite diffuse but three building segments, education, hotels/restaurants, and wholesale/retail, represent approximately 80 percent of the total base-year stock.
Figure 3.17 profiles the projected new commercial building stock in Mexico. It is projected that by 2030, there will be about 357 million square meters of floor space, of which about 57 percent will be newly built stock. Approximately 78 percent of the new stock is projected to be in the education, hotels/restaurants, and wholesale/retail segments.
Figure 3.16: Base-year Commercial Stock Distribution, by Type—Mexico
Base Year Commercial Stock Distribution by Type - Mexico
0
10
20
30
40
50
60
70
80
90
100
Hotels &Rest
Whole &Retail
Theatres& Rec
Edu Other Offices Hosp &Health
Warhse
Mill
ions
of m
2
Total

Green Building in North America
Background Paper One – Green Building Scenarios for 2030 31
Figure 3.17: Commercial New Construction, by Type—Mexico
United States—Commercial
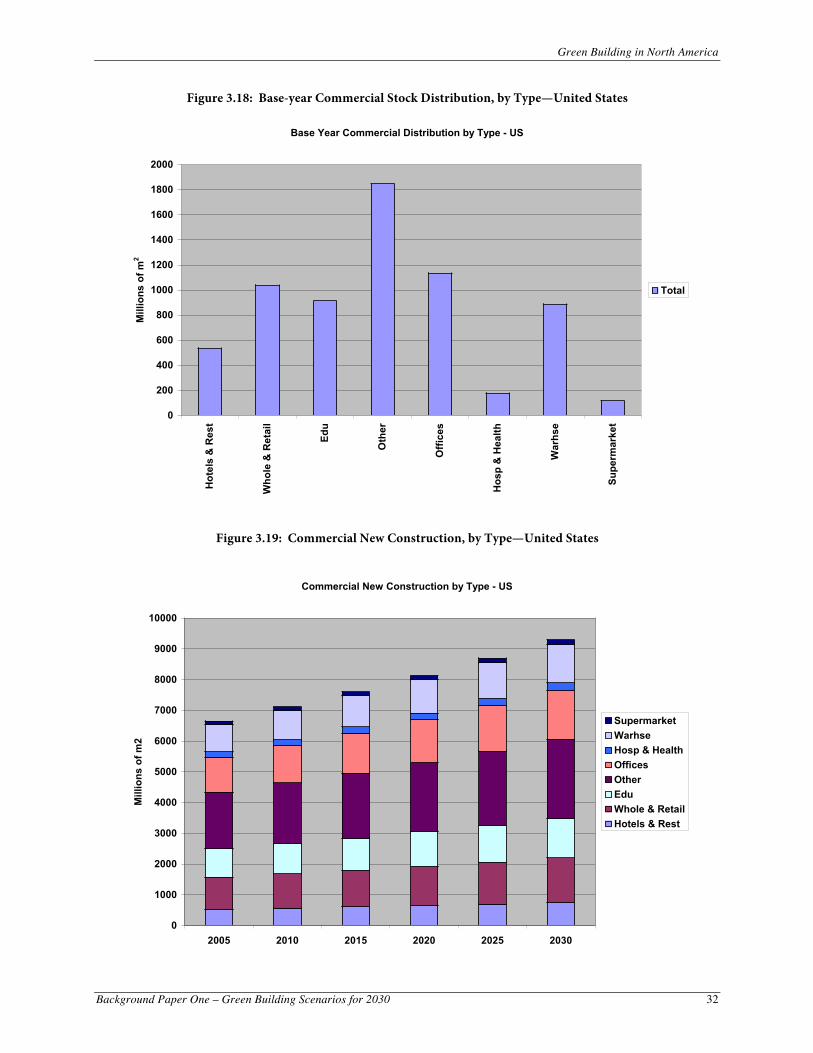
Figure 3.18 profiles the US baseline market according to building type. In 2005, the US commercial building stock comprised about 6.66 billion square meters of floor space. As shown, the commercial market is quite diffuse but two segments, offices and wholesale/retail, represent 2 billion square meters of floor space, or 33 percent of the total base-year stock.
Figure 3.19 profiles the projected new commercial building stock in the United States. It is projected that by 2030, there will be about 9.3 billion square meters of floor space, of which approximately 36 percent will be newly built stock. Approximately 33 percent of the new stock is projected to be in the office and wholesale/retail segments.
Commercial New Construction by Type - Mexico
0
50
100
150
200
250
2005 2010 2015 2020 2025 2030
Mill
ions
of m
2
WarhseHosp & HealthOfficesOtherEduTheatres & RecWhole & RetailHotels & Rest
Green Building in North America
Background Paper One – Green Building Scenarios for 2030 32
Figure 3.18: Base-year Commercial Stock Distribution, by Type—United States
Figure 3.19: Commercial New Construction, by Type—United States
Commercial New Construction by Type - US
0
1000
2000
3000
4000
5000
6000
7000
8000
9000
10000
2005 2010 2015 2020 2025 2030
Mill
ions
of m
2
SupermarketWarhseHosp & HealthOfficesOtherEduWhole & RetailHotels & Rest
Base Year Commercial Distribution by Type - US
0
200
400
600
800
1000
1200
1400
1600
1800
2000
Hot
els
& R
est
Who
le &
Ret
ail
Edu
Oth
er
Offi
ces
Hos
p &
Hea
lth
War
hse
Supe
rmar
ket
Mill
ions
of m
2
Total

Green Building in North America
Background Paper One – Green Building Scenarios for 2030 33
3.1.3 Market Affected by Major Renovations This section describes what portion of the existing building stock is affected by renovations that involve major energy efficiency improvements, as depicted under the Deep Green scenario. As noted, the projected renovation activity is assumed to take place at a rate consistent with historical trends.
The results have been divided by building type for each country.10 The results are further elaborated as follows:
Canada
By 2030, approximately 49 percent of the existing residential stock will have been affected by energy efficiency activities associated with major renovations. This amounts to about 5.7 million dwellings, of which the majority (64 percent) are single-detached homes. Figure 3.20 profiles this market.
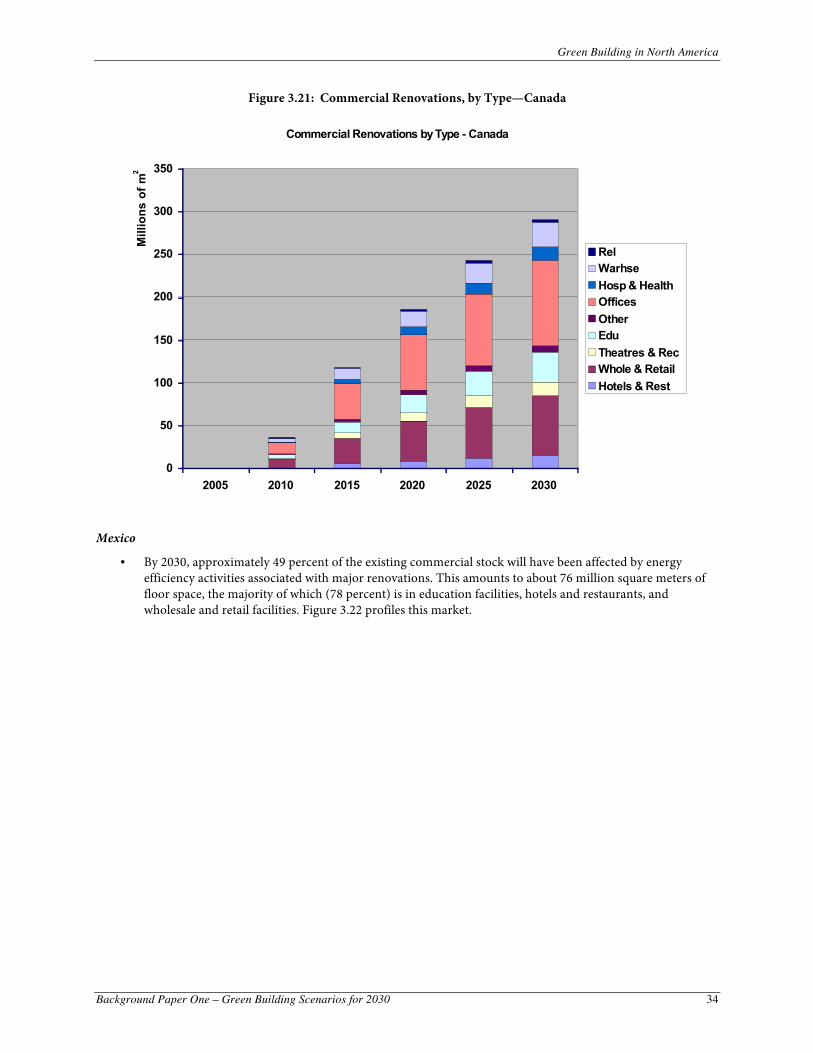
By 2030, approximately 51 percent of the existing commercial stock will have been affected by energy efficiency activities associated with major renovations. This amounts to about 290 million square meters of floor space, the majority of which (70 percent) is in office buildings, wholesale and retail facilities, and education facilities. Figure 3.21 profiles this market.
Figure 3.20: Residential Renovations, by Type—Canada
Residential Renovations by Type - Canada
0
1
2
3
4
5
6
7
2005 2010 2015 2020 2025 2030
Mill
ions
of D
wel
lings
Single-detachedMobileLow-rise ApartmentHigh-rise ApartmentAttached/Row
10 The Mexican residential market assumes no energy renovations, as elaborated further in Section 2.
Green Building in North America
Background Paper One – Green Building Scenarios for 2030 34
Figure 3.21: Commercial Renovations, by Type—Canada
Mexico
By 2030, approximately 49 percent of the existing commercial stock will have been affected by energy efficiency activities associated with major renovations. This amounts to about 76 million square meters of floor space, the majority of which (78 percent) is in education facilities, hotels and restaurants, and wholesale and retail facilities. Figure 3.22 profiles this market.
Commercial Renovations by Type - Canada
0
50
100
150
200
250
300
350
2005 2010 2015 2020 2025 2030
Mill
ions
of m
2
RelWarhseHosp & HealthOfficesOtherEduTheatres & RecWhole & RetailHotels & Rest

Green Building in North America
Background Paper One – Green Building Scenarios for 2030 35
Figure 3.22: Commercial Renovations, by Type—Mexico
United States
By 2030, approximately 26 percent of the existing residential stock will have been affected by energy efficiency activities associated with major renovations. This amounts to about 37 million dwellings, of which the majority (59 percent) are single-detached homes. Figure 3.23 profiles this market.
By 2030, approximately 47 percent of the existing commercial stock will have been affected by energy efficiency activities associated with major renovations. This amounts to about 3.3 billion square meters of floor space, of which 46 percent is in wholesale and retail facilities, office buildings, and education facilities. Figure 3.24 profiles this market.
Commercial Renovations by Type - Mexico
0
10
20
30
40
50
60
70
80
90
2005 2010 2015 2020 2025 2030
Mill
ions
of m
2
WarhseHosp & HealthOfficesOtherEduTheatres & RecWhole & RetailHotels & Rest

Green Building in North America
Background Paper One – Green Building Scenarios for 2030 36
Figure 3.23: Residential Renovations, by Type—United States
Figure 3.24: Commercial Renovations, by Type—United States
Residential Renovation by Type - US
0
5
10
15
20
25
30
35
40
2005 2010 2015 2020 2025 2030
Mill
ions
of D
wel
lings
Silgle-detachedMobilLow-rise ApartmentHigh-rise ApartmentAttached/Row
Commercial Renovation by Type - US
0
500
1000
1500
2000
2500
3000
3500
2005 2010 2015 2020 2025 2030
Mill
ions
of m
2
SupermarketWarhseHosp & HealthOfficesOtherEduWhole & RetailHotels & Rest

Green Building in North America
Background Paper One – Green Building Scenarios for 2030 37
3.1.4 Market Affected by Energy Retrofits This section describes what portion of the existing building stock is affected by energy retrofits, as depicted under the Deep Green scenario. As noted, the affected stock was calculated based on the target of including virtually all of the existing building stock (not affected by renovations) by 2030.
The results have been divided by building type for each country. The results are further elaborated as follows:
Canada
By 2030, approximately 41 percent of the existing residential stock will have been affected by energy efficiency activities associated with retrofit activities. This amounts to about 4.9 million dwellings, of which half (50 percent) are single-detached homes. Figure 3.25 profiles this market.
By 2030, approximately 40 percent of the existing commercial stock will have been affected by energy efficiency activities associated with retrofit activities. This amounts to about 225 million square meters of floor space, of which the majority (65 percent) is in office buildings, wholesale and retail facilities, and education facilities. Figure 3.26 profiles this market.
Figure 3.25: Residential Retrofits, by Type—Canada
Residential Retrofits by Type - Canada
0
1
2
3
4
5
6
2005 2010 2015 2020 2025 2030
Mill
ions
of D
wel
lings
Single-detachedMobileLow-rise ApartmentHigh-rise ApartmentAttached/Row

Green Building in North America
Background Paper One – Green Building Scenarios for 2030 38
Figure 3.26: Commercial Retrofits, by Type—Canada
Mexico
By 2030, approximately 54 percent of the existing residential stock will have been affected by energy efficiency activities associated with retrofit activities. This amounts to about 13.6 million dwellings, of which the majority (85 percent) are single-detached homes. Figure 3.27 profiles this market.
By 2030, approximately 38 percent of the existing commercial stock will have been affected by energy efficiency activities associated with retrofit activities. This amounts to about 59 million square meters of floor space, of which the majority (75 percent) is in education facilities, hotels and restaurants, and wholesale and retail facilities. Figure 3.28 profiles this market.
Commercial Retrofits by Type - Canada
0
50
100
150
200
250
2005 2010 2015 2020 2025 2030
Mill
ions
of m
2
RelWarhseHosp & HealthOfficesOtherEduTheatres & RecWhole & RetailHotels & Rest

Green Building in North America
Background Paper One – Green Building Scenarios for 2030 39
Figure 3.27: Residential Retrofits, by Type—Mexico
Figure 3.28: Commercial Retrofits, by Type—Mexico
Residential Retrofits by Type - Mexico
0
2
4
6
8
10
12
14
16
2005 2010 2015 2020 2025 2030
Mill
ions
of D
wel
lings
Single-detachedHigh-rise Apartment
Commercial Retrofits by Type - Mexico
0
10
20
30
40
50
60
70
2005 2010 2015 2020 2025 2030
Mill
ions
of m
2
WarhseHosp & HealthOfficesOtherEduTheatres & RecWhole & RetailHotels & Rest

Green Building in North America
Background Paper One – Green Building Scenarios for 2030 40
United States
By 2030, approximately 16 percent of the existing residential stock will have been affected by energy efficiency activities associated with retrofit activities. This amounts to about 22.9 million dwellings, of which the majority (59 percent) are single-detached homes. Figure 3.29 profiles this market.
By 2030, approximately 14 percent of the existing commercial stock will have been affected by energy efficiency activities associated with retrofit activities. This amounts to about 1.29 billion square meters of floor space, of which 47 percent is in office buildings, wholesale and retail facilities, and education facilities. Figure 3.30 profiles this market.
Figure 3.29: Residential Retrofits, by Type—United States
Residential Retrofits by Type - US
0
5
10
15
20
25
2005 2010 2015 2020 2025 2030
Mill
ions
of D
wel
lings
Silgle-detachedMobilLow-rise ApartmentHigh-rise ApartmentAttached/Row

Green Building in North America
Background Paper One – Green Building Scenarios for 2030 41
Figure 3.30: Commercial Retrofits, by Type—United States
3.2 Energy Savings and GHG Reduction Impacts
This section presents the overall energy savings and GHG reduction impacts under the Deep Green scenario.
3.2.1 BAU Energy Consumption and GHG Emissions As a point of reference, we begin with the business-as-usual (BAU) energy projections, as illustrated below. The results are presented as follows:
Canada
Figure 3.31 profiles the energy consumption of the Canadian residential sector, according to dwelling type, for the BAU scenario. For the base year, Canadian dwellings consume roughly 1276 petajoules (PJ) of energy per year. By 2030, annual energy consumption rises to 1638 PJ, an increase of 28 percent.
Figure 3.32 profiles the energy consumption of the Canadian commercial sector, according to building type, for the BAU scenario. For the base year, Canadian buildings consume roughly 1166 PJ of energy per year. By 2030, annual energy consumption rises to 1615 PJ, an increase of 39 percent.
Commercial Retrofits by Type - US
0
200
400
600
800
1000
1200
1400
2005 2010 2015 2020 2025 2030
Mill
ions
of m
2
SupermarketWarhseHosp & HealthOfficesOtherEduWhole & RetailHotels & Rest
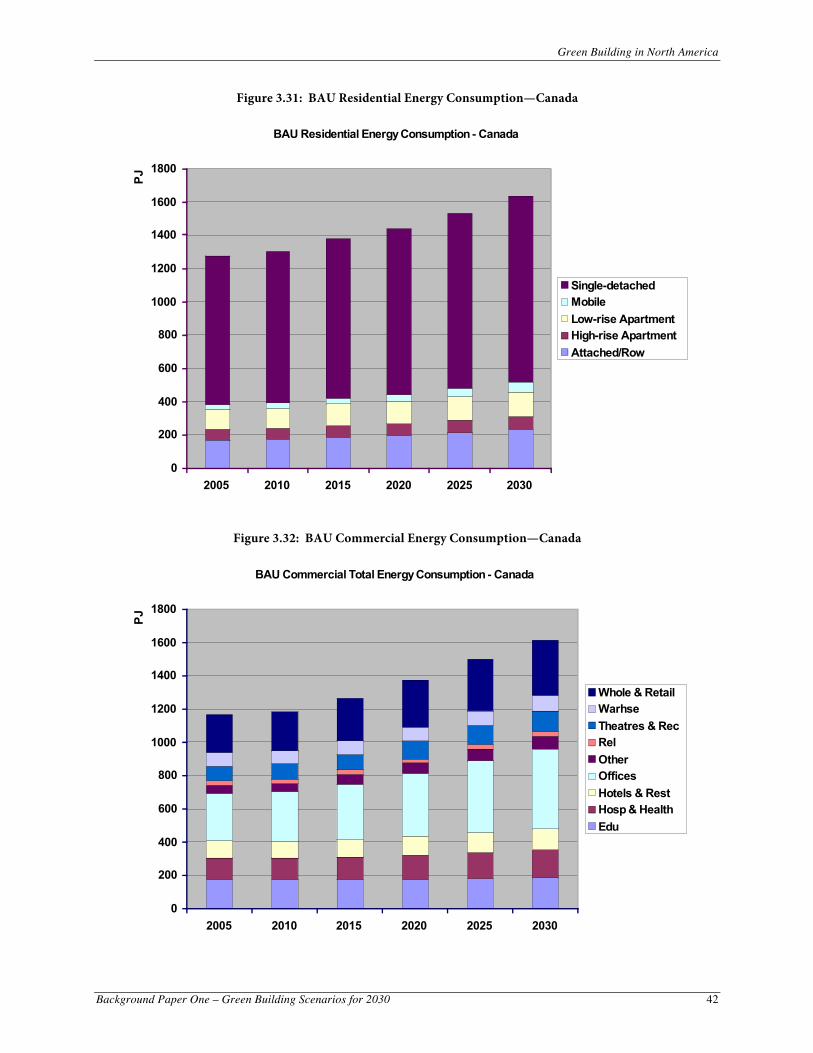
Green Building in North America
Background Paper One – Green Building Scenarios for 2030 42
Figure 3.31: BAU Residential Energy Consumption—Canada
Figure 3.32: BAU Commercial Energy Consumption—Canada
BAU Residential Energy Consumption - Canada
0
200
400
600
800
1000
1200
1400
1600
1800
2005 2010 2015 2020 2025 2030
PJ
Single-detachedMobileLow-rise ApartmentHigh-rise ApartmentAttached/Row
BAU Commercial Total Energy Consumption - Canada
0
200
400
600
800
1000
1200
1400
1600
1800
2005 2010 2015 2020 2025 2030
PJ
Whole & RetailWarhseTheatres & RecRelOtherOfficesHotels & RestHosp & HealthEdu

Green Building in North America
Background Paper One – Green Building Scenarios for 2030 43
Mexico
Figure 3.33 profiles the energy consumption of the Mexican residential sector, according to dwelling type, for the BAU scenario. For the base year, Mexican dwellings consume roughly 460 PJ of energy per year. By 2030, annual energy consumption rises to 1158 PJ, an increase of 152 percent.
Figure 3.34 profiles the energy consumption of the Mexican commercial sector, according to building type, for the BAU scenario. For the base year, Mexican buildings consume roughly 106 PJ of energy per year. By 2030, annual energy consumption rises to 259 PJ, an increase of 144 percent.
Figure 3.33: BAU Residential Energy Consumption—Mexico
BAU Residential Energy Consumption - Mexico
0
200
400
600
800
1000
1200
1400
2005 2010 2015 2020 2025 2030
PJ
Single-detachedHigh-rise Apartment

Green Building in North America
Background Paper One – Green Building Scenarios for 2030 44
Figure 3.34: BAU Commercial Energy Consumption—Mexico
United States
Figure 3.35 profiles the energy consumption of the US residential sector, according to dwelling type, for the BAU scenario. For the base year, American dwellings consume roughly 10,800 PJ of energy. By 2030, annual energy consumption rises to 13,300 PJ, an increase of 23 percent.
Figure 3.36 profiles the energy consumption of the US commercial sector, according to building type, for the BAU scenario. For the base year, commercial buildings consume roughly 6880 PJ of energy. By 2030, annual energy consumption rises to 9390 PJ, an increase of 36 percent.
BAU Commercial Total Energy Consumption - Mexico
0
50
100
150
200
250
300
2005 2010 2015 2020 2025 2030
PJ
Whole & RetailWarhseTheatres & RecOtherOfficesHotels & RestHosp & HealthEdu
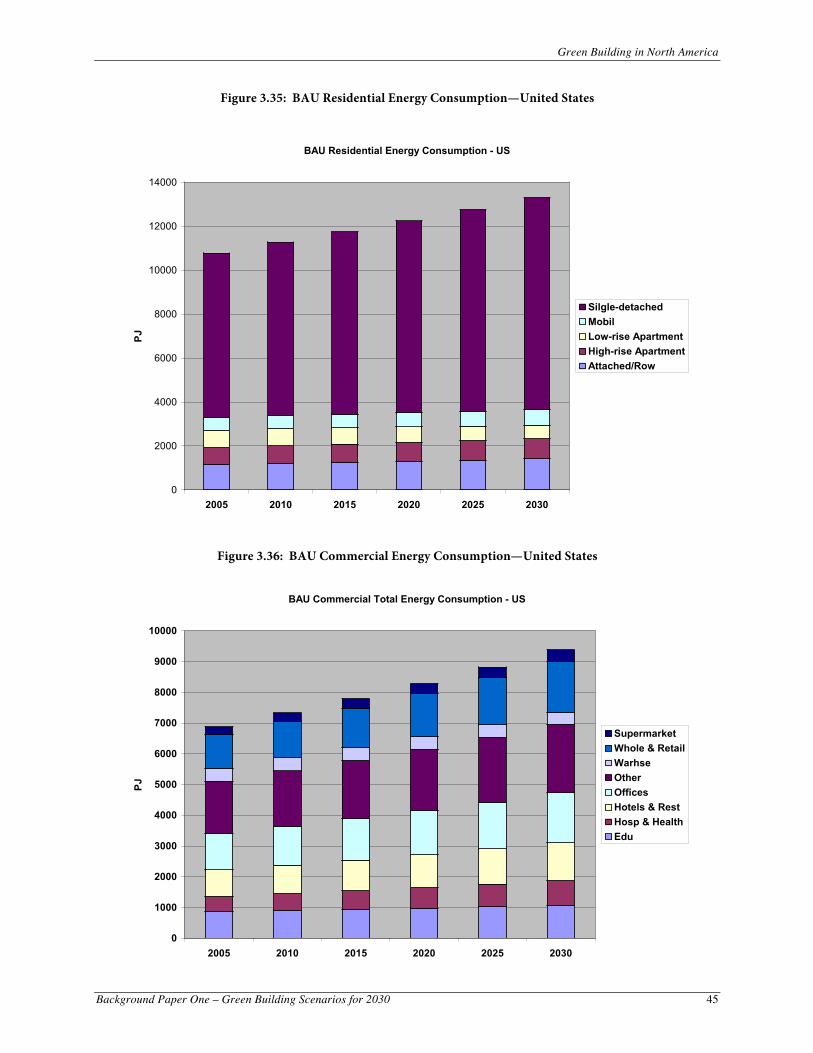
Green Building in North America
Background Paper One – Green Building Scenarios for 2030 45
Figure 3.35: BAU Residential Energy Consumption—United States
Figure 3.36: BAU Commercial Energy Consumption—United States
BAU Residential Energy Consumption - US
0
2000
4000
6000
8000
10000
12000
14000
2005 2010 2015 2020 2025 2030
PJ
Silgle-detachedMobilLow-rise ApartmentHigh-rise ApartmentAttached/Row
BAU Commercial Total Energy Consumption - US
0
1000
2000
3000
4000
5000
6000
7000
8000
9000
10000
2005 2010 2015 2020 2025 2030
PJ
SupermarketWhole & RetailWarhseOtherOfficesHotels & RestHosp & HealthEdu

Green Building in North America
Background Paper One – Green Building Scenarios for 2030 46
3.2.2 Deep Green Scenario Energy Savings—North American Buildings Sector Figures 3.37 to 3.43 profile, both in tabular and graphic form, the high-level energy savings implications of the Deep Green scenario. The savings, in terms of primary energy units, are shown relative to the AIA/RAIC savings projected for each of the interim milestone years running to 2030 and represent the annual energy savings of the building stock due to energy efficiency improvements. The following observations emerge from this analysis:
In terms of the North American buildings sector as a whole, energy efficiency improvements to buildings will achieve the overall continental AIA/RAIC targets but the specifics vary by country and sector. Since the building stock in the United States is the largest and constitutes the largest energy end-use, the US trends tend to dominate the overall continental picture.
Energy efficiency improvements to buildings could save over 14,000 PJ per year in 2030 compared to projections for the business-as-usual scenario. The results support the observation that energy efficiency can be an enormous long-term energy supply source for the buildings sector.
Energy efficiency improvements to buildings in the residential sector made according to the Deep Green scenario would enable the achievement of the AIA/RAIC targets for all of North America.
Energy efficiency improvements to buildings in the commercial sector made according to the Deep Green scenario would enable the achievement of the AIA/RAIC targets and result in a net decrease in energy consumption for Canada and the United States.
Despite energy efficiency improvements, Mexico’s commercial sector would see a slow increase in energy consumption up to 2030, due most likely to projected explosive growth. A gap therefore exists that could be addressed by on-site renewable energy or the purchase of clean energy. See Section 3.2.6 for gap analysis.
Figure 3.37: Deep Green and AIA/RAIC Scenarios Energy Savings
“Deep Green” Scenario Energy Savings (PJ) Sector Country BAU
2010 2015 2020 2025 2030
Base year
Residential
Canada 1638 244 477 674 867 1011 1276
Mexico 1158 192 302 433 599 812 460
USA 13300 0 2134 3900 5375 6641 10800
Total 436 2913 5007 6841 8464
Commercial
Canada 1615 125 307 453 647 830 1166
Mexico 259 25 45 71 103 142 106
USA 9390 0 1630 2910 3920 4720 6880
Total 150 1982 3434 4670 5692

Green Building in North America
Background Paper One – Green Building Scenarios for 2030 47
AIA/RAIC Scenario Energy Savings (PJ) Sector Country BAU
2010 2015 2020 2025 2030
Base year
Residential
Canada 1638 13 163 778 1091 1261 1276
Mexico 1158 24 112 255 429 650 460
USA 13300 0 745 1603 2540 3562 10800
Total 37 1020 2636 4060 5473
Commercial
Canada 1615 101 304 439 595 750 1166
Mexico 259 21 43 72 111 160 106
USA 9390 0 841 1766 2781 3892 6880
Total 122 1188 2277 3487 4802
3.2.3 Deep Green Scenario Energy Savings, by Country Canada
Figure 3.38 shows that the energy savings in the Canadian residential sector amount to a 51 percent decrease in energy consumption relative to base-year consumption and a 62 percent decrease relative to BAU consumption. See Section 3.2.6 for an analysis of the gap in the Canadian residential sector relative to the AIA/RAIC targets.
Figure 3.39 shows that the energy savings in the Canadian commercial sector amount to a 33 percent decrease in energy consumption relative to base-year consumption and a 51 percent decrease relative to BAU consumption.

Green Building in North America
Background Paper One – Green Building Scenarios for 2030 48
Figure 3.38: Residential Energy Savings—Canada
Residential Energy Savings - Canada
0
200
400
600
800
1000
1200
1400A
IA
Scen
ario
AIA
Scen
ario
AIA
Scen
ario
AIA
Scen
ario
AIA
Scen
ario
2010 2015 2020 2025 2030
PJ Canada

Green Building in North America
Background Paper One – Green Building Scenarios for 2030 49
Figure 3.39: Commercial Energy Savings—Canada
Commercial Total Energy Savings - Canada
0
100
200
300
400
500
600
700
800
900A
IA
Scen
ario
AIA
Scen
ario
AIA
Scen
ario
AIA
Scen
ario
AIA
Scen
ario
2010 2015 2020 2025 2030
PJ
Canada
Mexico
Figure 3.40 shows that the energy savings in the Mexican residential sector amount to a 25 percent decrease in energy consumption relative to the base-year consumption and a 70 percent decrease relative to BAU consumption. See Section 3.2.6 for an analysis of the gap in the Mexican residential sector.
Figure 3.41 shows that the energy savings in the Mexican commercial sector amount to a 10 percent increase in energy consumption relative to base-year consumption and a 55 percent decrease relative to BAU consumption. See Section 3.2.6 for an analysis of the gap in the Mexican commercial sector.
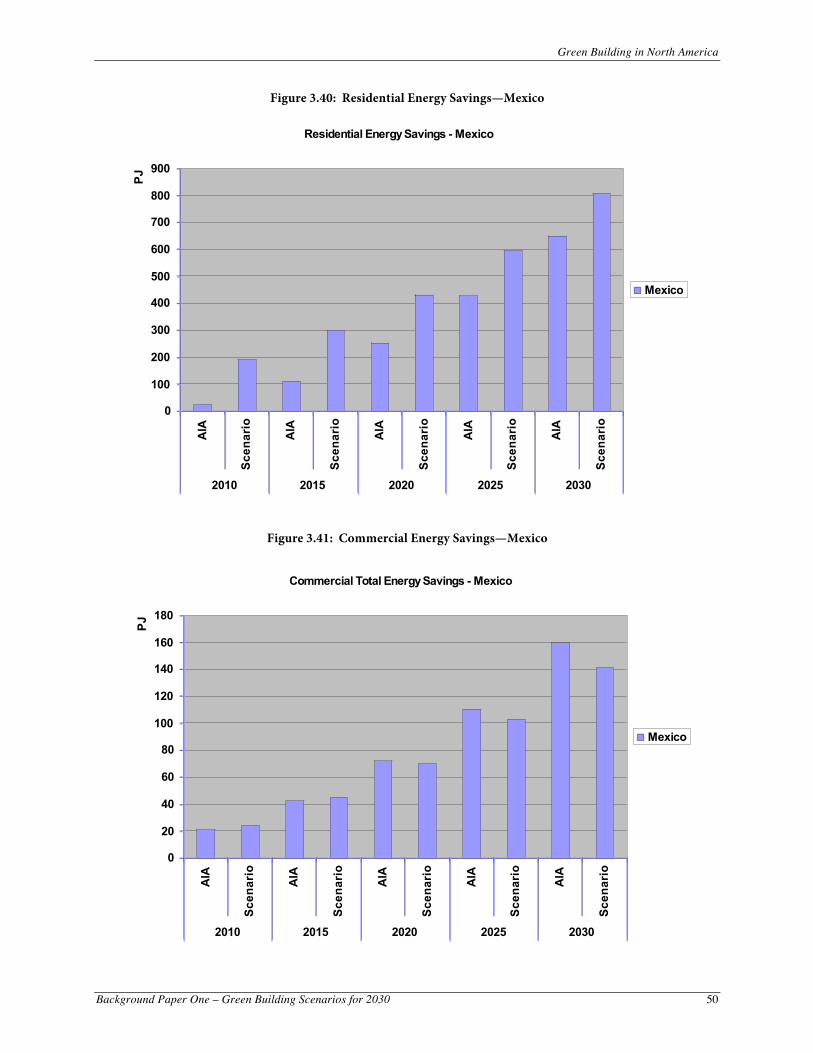
Green Building in North America
Background Paper One – Green Building Scenarios for 2030 50
Figure 3.40: Residential Energy Savings—Mexico
Figure 3.41: Commercial Energy Savings—Mexico
Residential Energy Savings - Mexico
0
100
200
300
400
500
600
700
800
900
AIA
Scen
ario
AIA
Scen
ario
AIA
Scen
ario
AIA
Scen
ario
AIA
Scen
ario
2010 2015 2020 2025 2030
PJ
Mexico
Commercial Total Energy Savings - Mexico
0
20
40
60
80
100
120
140
160
180
AIA
Scen
ario
AIA
Scen
ario
AIA
Scen
ario
AIA
Scen
ario
AIA
Scen
ario
2010 2015 2020 2025 2030
PJ
Mexico

Green Building in North America
Background Paper One – Green Building Scenarios for 2030 51
United States Figures 3.42 and 3.43 show energy savings relative to the business-as-usual cases.
Figure 3.42 shows that the energy savings in the US residential sector for the Deep Green scenario amount to a 38 percent decrease in energy consumption relative to 2005 base-year consumption and a 50 percent decrease relative to BAU consumption in 2030.
Figure 3.43 shows that the energy savings in the US commercial sector for the Deep Green scenario amount to a 32 percent decrease in energy consumption relative to 2005 base-year consumption and a 50 percent decrease relative to BAU consumption.
Figure 3.42: Residential Energy Savings—United States
Residential Energy Savings - US
0
1000
2000
3000
4000
5000
6000
7000
AIA
Scen
ario
AIA
Scen
ario
AIA
Scen
ario
AIA
Scen
ario
AIA
Scen
ario
2010 2015 2020 2025 2030
PJ US

Green Building in North America
Background Paper One – Green Building Scenarios for 2030 52
Figure 3.43: Commercial Energy Savings—United States
3.2.4 GHG Reductions—North American Buildings Sector Figure 3.44 presents a snapshot of the overall GHG reductions in the North American buildings sector.
Figure 3.44: GHG Emissions Reductions
“Deep Green” GHG Emissions Reduction (MT CO2eq) Sector Country
2010 2015 2020 2025 2030
Residential
Canada 14 27 38 48 58
Mexico 16 29 46 69 100
USA 0 229 421 583 725
Total 30 285 505 700 883
Commercial
Canada 7 17 25 35 45
Mexico 3 6 10 15 20
USA 0 210 391 566 763
Total 10 233 426 616 828
Commercial Total Energy Savings - US
0
500
1000
1500
2000
2500
3000
3500
4000
4500
5000
AIA
Scen
ario
AIA
Scen
ario
AIA
Scen
ario
AIA
Scen
ario
AIA
Scen
ario
2010 2015 2020 2025 2030
PJ US
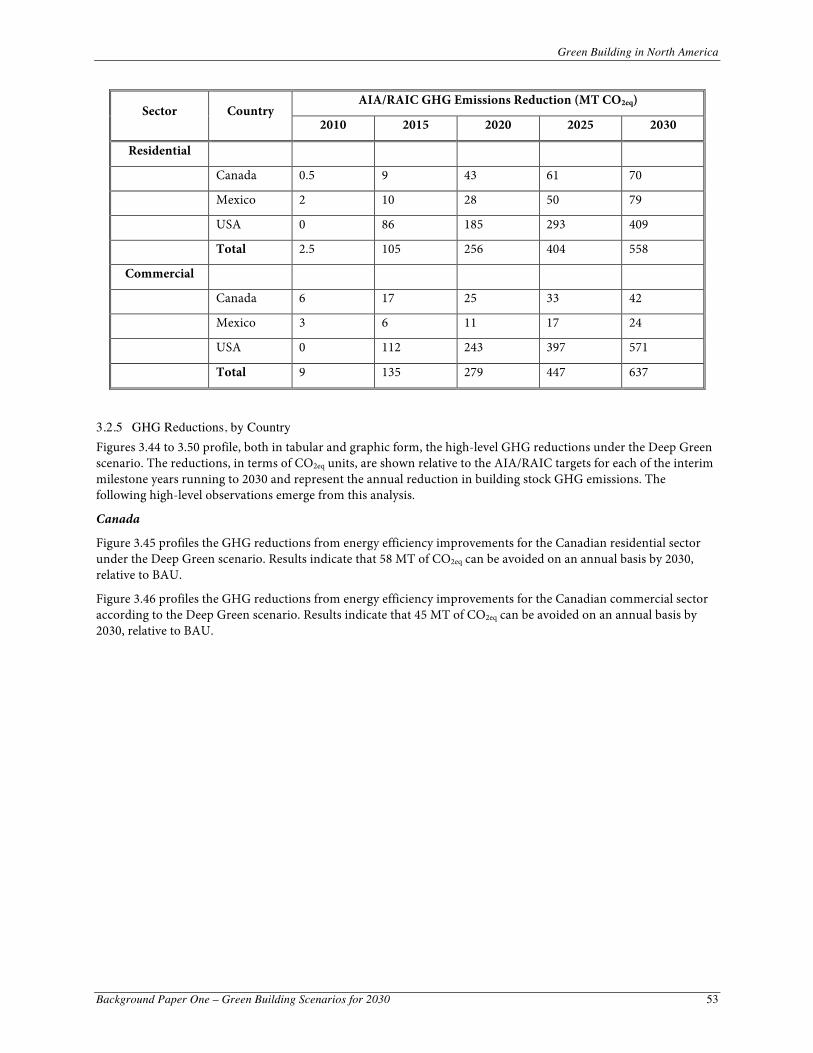
Green Building in North America
Background Paper One – Green Building Scenarios for 2030 53
AIA/RAIC GHG Emissions Reduction (MT CO2eq) Sector Country
2010 2015 2020 2025 2030
Residential
Canada 0.5 9 43 61 70
Mexico 2 10 28 50 79
USA 0 86 185 293 409
Total 2.5 105 256 404 558
Commercial
Canada 6 17 25 33 42
Mexico 3 6 11 17 24
USA 0 112 243 397 571
Total 9 135 279 447 637
3.2.5 GHG Reductions, by Country Figures 3.44 to 3.50 profile, both in tabular and graphic form, the high-level GHG reductions under the Deep Green scenario. The reductions, in terms of CO2eq units, are shown relative to the AIA/RAIC targets for each of the interim milestone years running to 2030 and represent the annual reduction in building stock GHG emissions. The following high-level observations emerge from this analysis.
Canada
Figure 3.45 profiles the GHG reductions from energy efficiency improvements for the Canadian residential sector under the Deep Green scenario. Results indicate that 58 MT of CO2eq can be avoided on an annual basis by 2030, relative to BAU.
Figure 3.46 profiles the GHG reductions from energy efficiency improvements for the Canadian commercial sector according to the Deep Green scenario. Results indicate that 45 MT of CO2eq can be avoided on an annual basis by 2030, relative to BAU.
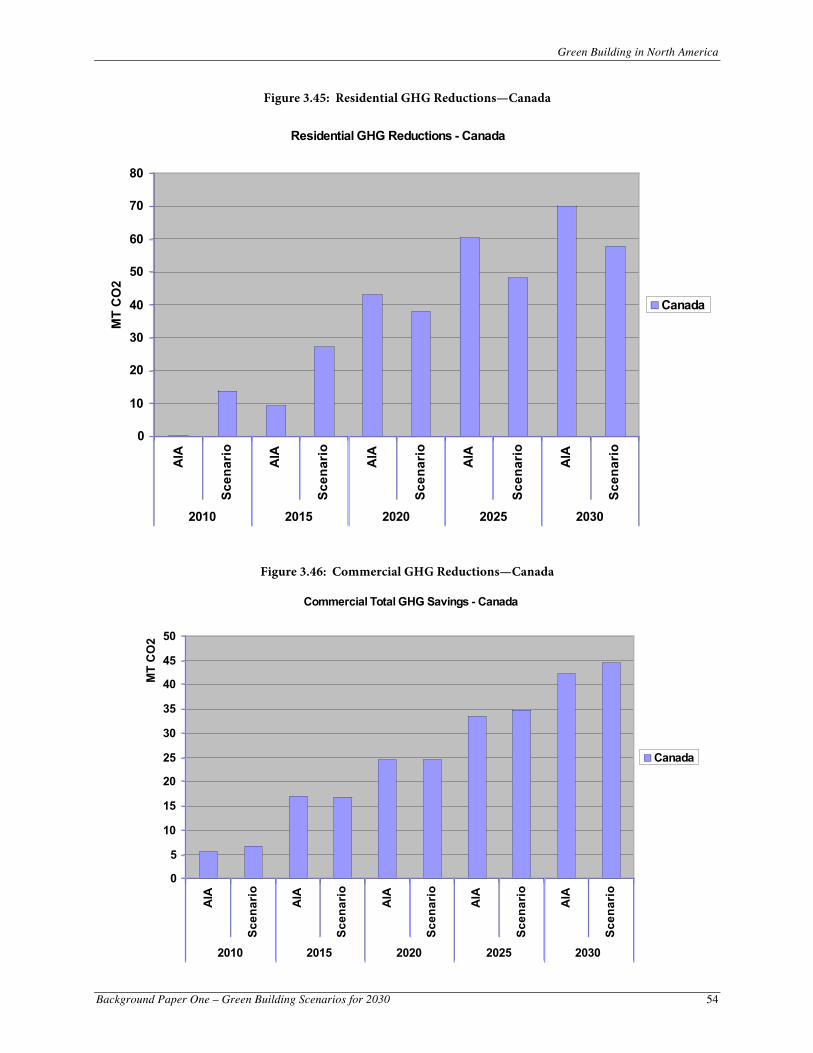
Green Building in North America
Background Paper One – Green Building Scenarios for 2030 54
Figure 3.45: Residential GHG Reductions—Canada
Figure 3.46: Commercial GHG Reductions—Canada
Residential GHG Reductions - Canada
0
10
20
30
40
50
60
70
80A
IA
Scen
ario
AIA
Scen
ario
AIA
Scen
ario
AIA
Scen
ario
AIA
Scen
ario
2010 2015 2020 2025 2030
MT
CO
2
Canada
Commercial Total GHG Savings - Canada
0
5
10
15
20
25
30
35
40
45
50
AIA
Scen
ario
AIA
Scen
ario
AIA
Scen
ario
AIA
Scen
ario
AIA
Scen
ario
2010 2015 2020 2025 2030
MT
CO
2
Canada

Green Building in North America
Background Paper One – Green Building Scenarios for 2030 55
Mexico
Figure 3.47 profiles the GHG reductions from energy efficiency improvements for the Mexican residential sector under the Deep Green scenario. Results indicate that 100 MT of CO2eq can be avoided on an annual basis by 2030, relative to BAU.
Figure 3.48 profiles the GHG reductions from energy efficiency improvements for the Mexican commercial sector under the Deep Green scenario. Results indicate that 20 MT of CO2eq can be avoided on an annual basis by 2030, relative to BAU.
Figure 3.47: Residential GHG Reductions—Mexico
Residential GHG Reductions - Mexico
0
20
40
60
80
100
120
AIA
Scen
ario
AIA
Scen
ario
AIA
Scen
ario
AIA
Scen
ario
AIA
Scen
ario
2010 2015 2020 2025 2030
MT
CO
2
Mexico
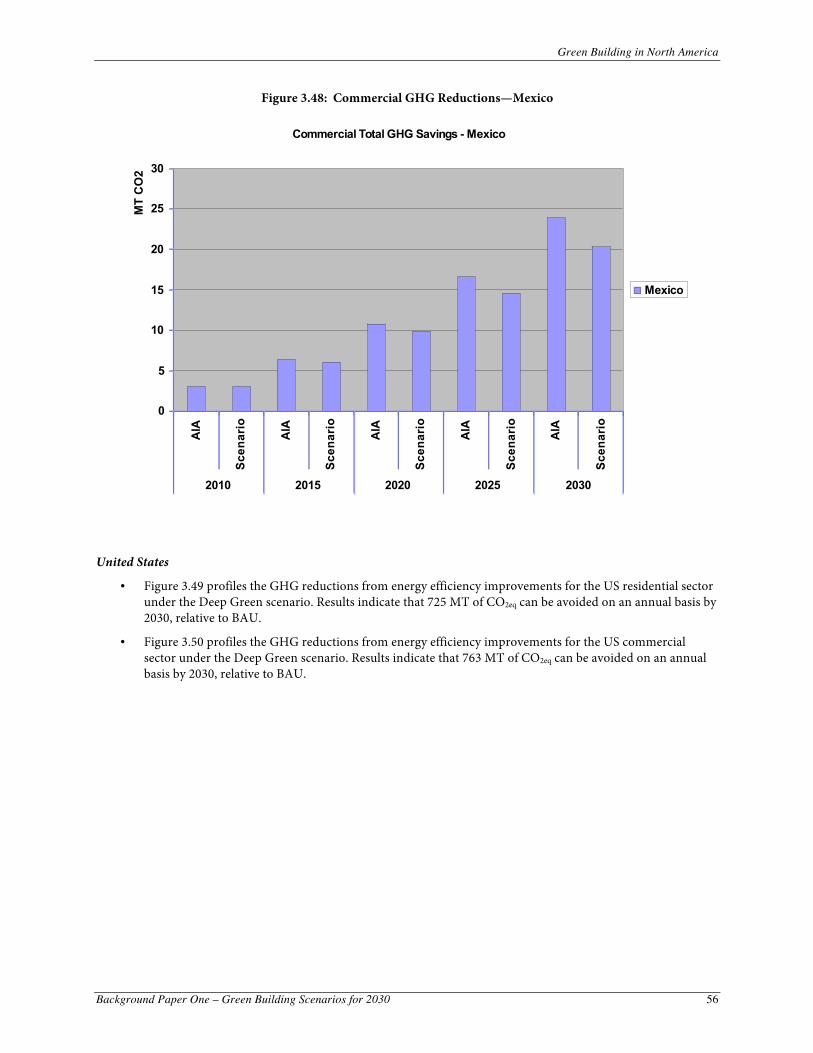
Green Building in North America
Background Paper One – Green Building Scenarios for 2030 56
Figure 3.48: Commercial GHG Reductions—Mexico
United States
Figure 3.49 profiles the GHG reductions from energy efficiency improvements for the US residential sector under the Deep Green scenario. Results indicate that 725 MT of CO2eq can be avoided on an annual basis by 2030, relative to BAU.
Figure 3.50 profiles the GHG reductions from energy efficiency improvements for the US commercial sector under the Deep Green scenario. Results indicate that 763 MT of CO2eq can be avoided on an annual basis by 2030, relative to BAU.
Commercial Total GHG Savings - Mexico
0
5
10
15
20
25
30
AIA
Scen
ario
AIA
Scen
ario
AIA
Scen
ario
AIA
Scen
ario
AIA
Scen
ario
2010 2015 2020 2025 2030
MT
CO
2
Mexico

Green Building in North America
Background Paper One – Green Building Scenarios for 2030 57
Figure 3.49: Residential GHG Reductions—United States
Figure 3.50: Commercial GHG Reductions—United States
Commercial Total GHG Savings - US
0
100
200
300
400
500
600
700
800
900
AIA
Scen
ario
AIA
Scen
ario
AIA
Scen
ario
AIA
Scen
ario
AIA
Scen
ario
2015 2020 2025 2030
MT
CO
2
US
Residential Total GHG Savings - US
0
100
200
300
400
500
600
700
800
AIA
Scen
ario
AIA
Scen
ario
AIA
Scen
ario
AIA
Scen
ario
AIA
Scen
ario
2010 2015 2020 2025 2030
MT
CO
2
US

Green Building in North America
Background Paper One – Green Building Scenarios for 2030 58
3.2.6 GHG Gap Analysis—North American Buildings Sector This section analyzes the GHG gap that exists in certain milestone years in the North American residential and commercial building sectors, relative to the AIA/RAIC targets as well as 1990 levels.11 Figures 3.51 through 3.57 provide a graphical representation of the GHG emissions resulting under each of the scenarios modeled in this report, namely the BAU, Deep Green/Scenario 1, AIA/RAIC, as well as a comparison to 1990 levels, if available.
In terms of North America as a whole, energy efficiency improvements result in a net gap of 12 MT of CO2eq by 2030 in the residential sector, relative to the AIA/RAIC scenario. In the commercial sector, energy efficiency improvements result in a net gap of 4 MT of CO2eq by 2030, relative to the AIA/RAIC scenario.
Figure 3.51 summarizes the results of the gap analysis for North America.
Figure 3.51: GHG Gap Analysis—North America
“Deep Green” Gap (MT CO2eq) relative to AIA/RAIC Sector Country
2010 2015 2020 2025 2030
Residential
Canada 0 0 5 13 12
Mexico 0 0 0 0 0
USA 0 0 0 0 0
Total 0 0 5 13 12
Commercial
Canada 0 0 0 0 0
Mexico 0 0 1 2 4
USA 0 0 0 0 0
Total 0 0 1 2 4
“Deep Green” Gap (MT CO2eq) relative to 1990 Sector Country
2010 2015 2020 2025 2030
Residential
Canada 0 0 0 0 0
Mexico 7 7 8 10 12
USA 177 0 0 0 0
Total 184 7 8 10 12
Commercial
Canada 11 6 4 1 0
Mexico N/A N/A N/A N/A N/A
USA 222 85 0 0 0
Total 133 91 4 1 0
11 Energy consumption of the Mexican commercial buildings sector was not available at the time the report was created.
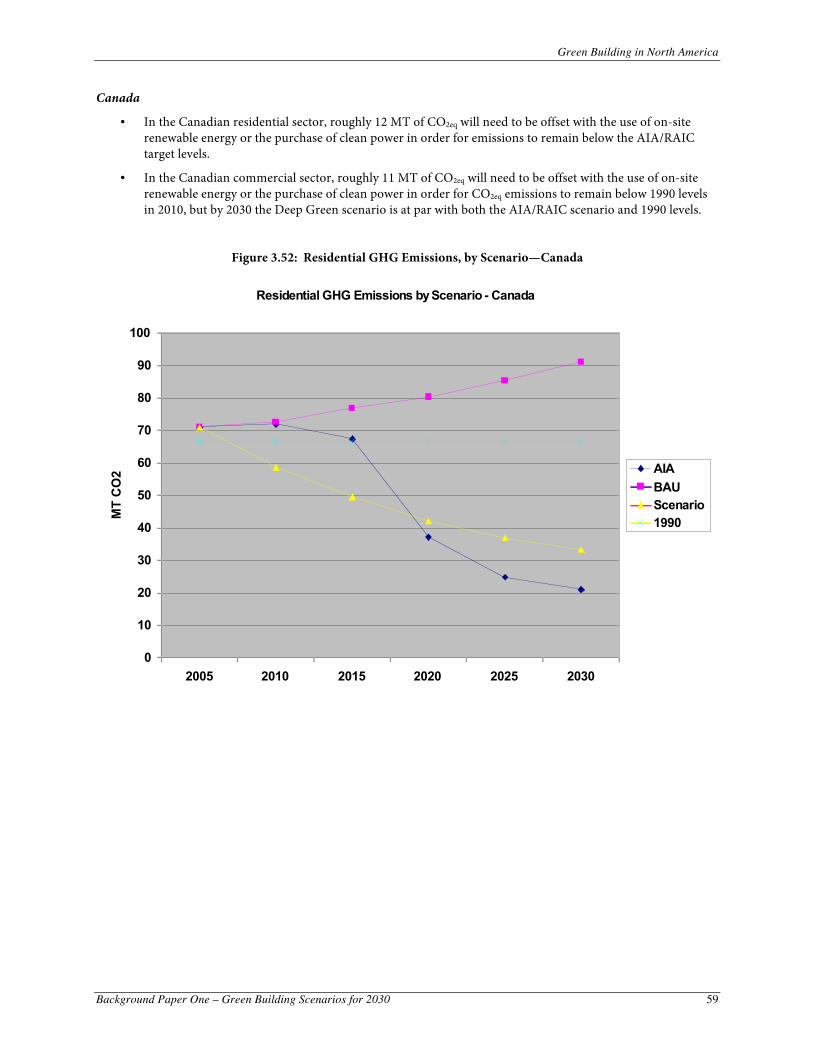
Green Building in North America
Background Paper One – Green Building Scenarios for 2030 59
Canada
In the Canadian residential sector, roughly 12 MT of CO2eq will need to be offset with the use of on-site renewable energy or the purchase of clean power in order for emissions to remain below the AIA/RAIC target levels.
In the Canadian commercial sector, roughly 11 MT of CO2eq will need to be offset with the use of on-site renewable energy or the purchase of clean power in order for CO2eq emissions to remain below 1990 levels in 2010, but by 2030 the Deep Green scenario is at par with both the AIA/RAIC scenario and 1990 levels.
Figure 3.52: Residential GHG Emissions, by Scenario—Canada
Residential GHG Emissions by Scenario - Canada
0
10
20
30
40
50
60
70
80
90
100
2005 2010 2015 2020 2025 2030
MT
CO
2 AIABAUScenario1990
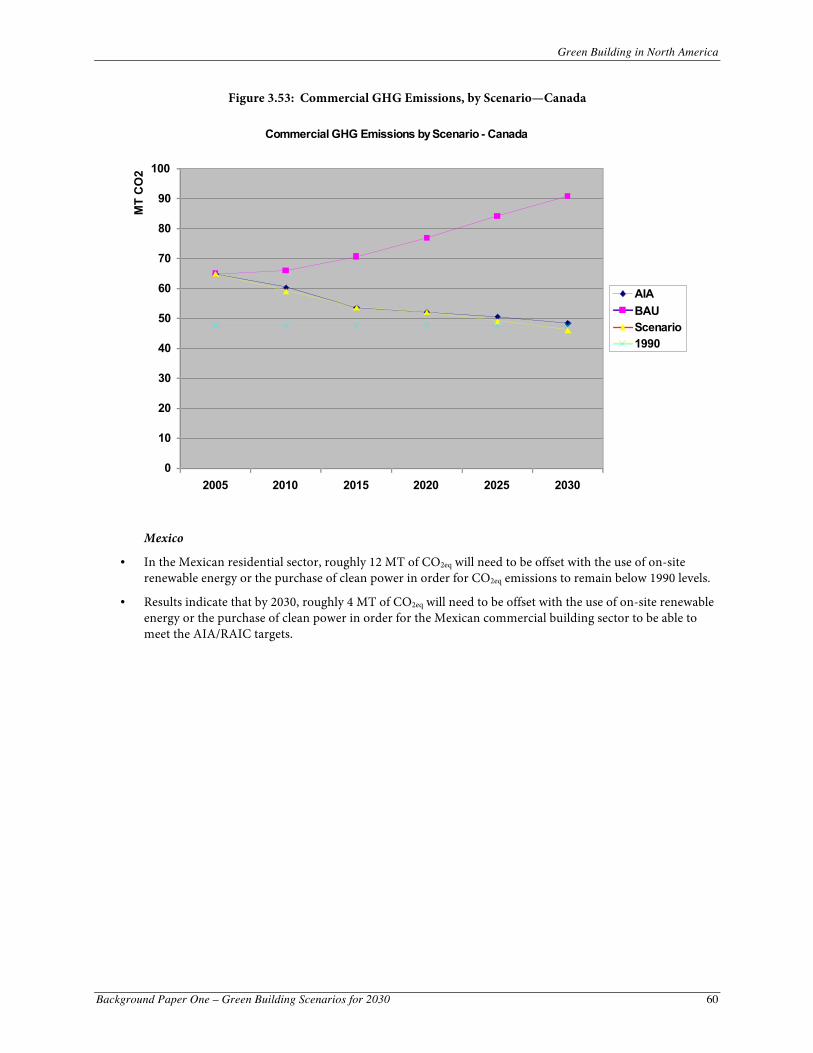
Green Building in North America
Background Paper One – Green Building Scenarios for 2030 60
Figure 3.53: Commercial GHG Emissions, by Scenario—Canada
Mexico
In the Mexican residential sector, roughly 12 MT of CO2eq will need to be offset with the use of on-site renewable energy or the purchase of clean power in order for CO2eq emissions to remain below 1990 levels.
Results indicate that by 2030, roughly 4 MT of CO2eq will need to be offset with the use of on-site renewable energy or the purchase of clean power in order for the Mexican commercial building sector to be able to meet the AIA/RAIC targets.
Commercial GHG Emissions by Scenario - Canada
0
10
20
30
40
50
60
70
80
90
100
2005 2010 2015 2020 2025 2030
MT
CO
2
AIABAUScenario1990
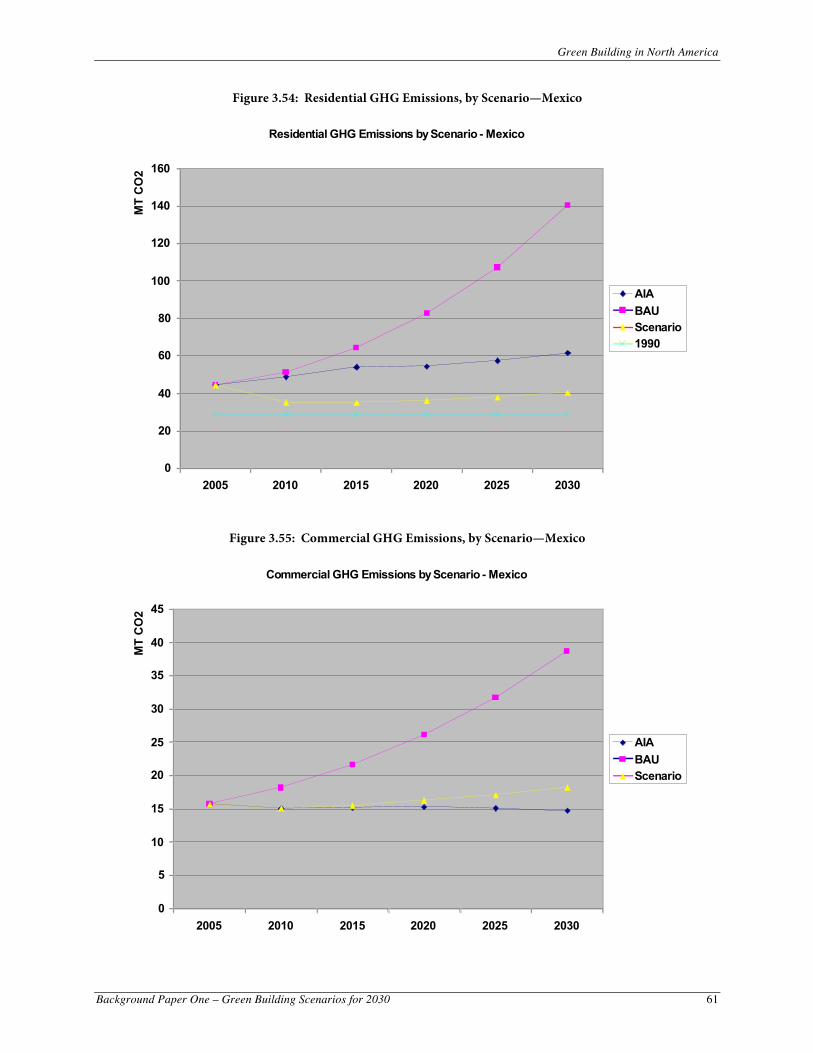
Green Building in North America
Background Paper One – Green Building Scenarios for 2030 61
Figure 3.54: Residential GHG Emissions, by Scenario—Mexico
Figure 3.55: Commercial GHG Emissions, by Scenario—Mexico
Residential GHG Emissions by Scenario - Mexico
0
20
40
60
80
100
120
140
160
2005 2010 2015 2020 2025 2030
MT
CO
2
AIABAUScenario1990
Commercial GHG Emissions by Scenario - Mexico
0
5
10
15
20
25
30
35
40
45
2005 2010 2015 2020 2025 2030
MT
CO
2
AIABAUScenario

Green Building in North America
Background Paper One – Green Building Scenarios for 2030 62
United States
In the US residential sector, emissions under the Deep Green scenario drop below the 1990 levels in 2015 and savings increase further thereafter.
In the US commercial sector, emissions are projected to drop below 1990 levels in 2020 and then decrease further in subsequent years.
Each of these analyses assumes that on-site renewables begin to provide a small part of the remaining load in 2010, growing to 100 percent after implementation of aggressive energy efficiency in 2030.
Figure 3.56: Residential GHG Emissions, by Scenario—United States
Residential GHG Emissions by Scenario - US
0
200
400
600
800
1000
1200
1400
1600
2000 2005 2010 2015 2020 2025 2030 2035
MT
CO
2 AIABAUScenario1990
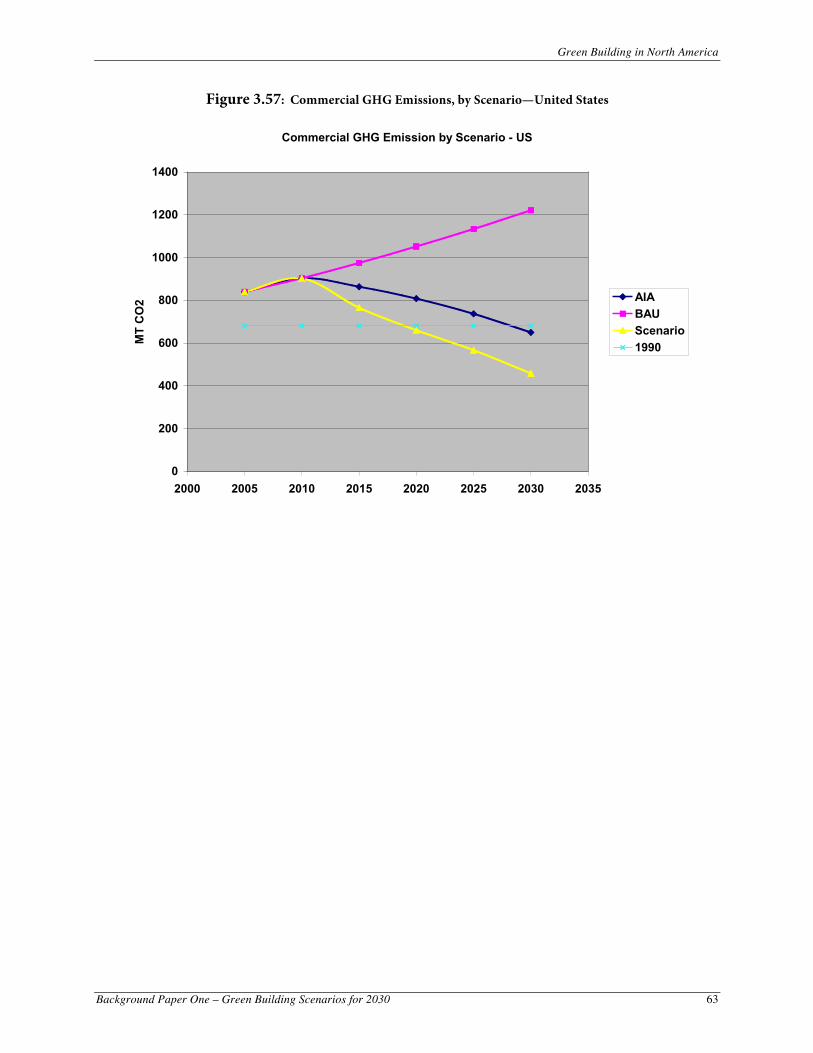
Green Building in North America
Background Paper One – Green Building Scenarios for 2030 63
Figure 3.57: Commercial GHG Emissions, by Scenario—United States
Commercial GHG Emission by Scenario - US
0
200
400
600
800
1000
1200
1400
2000 2005 2010 2015 2020 2025 2030 2035
MT
CO
2 AIABAUScenario1990
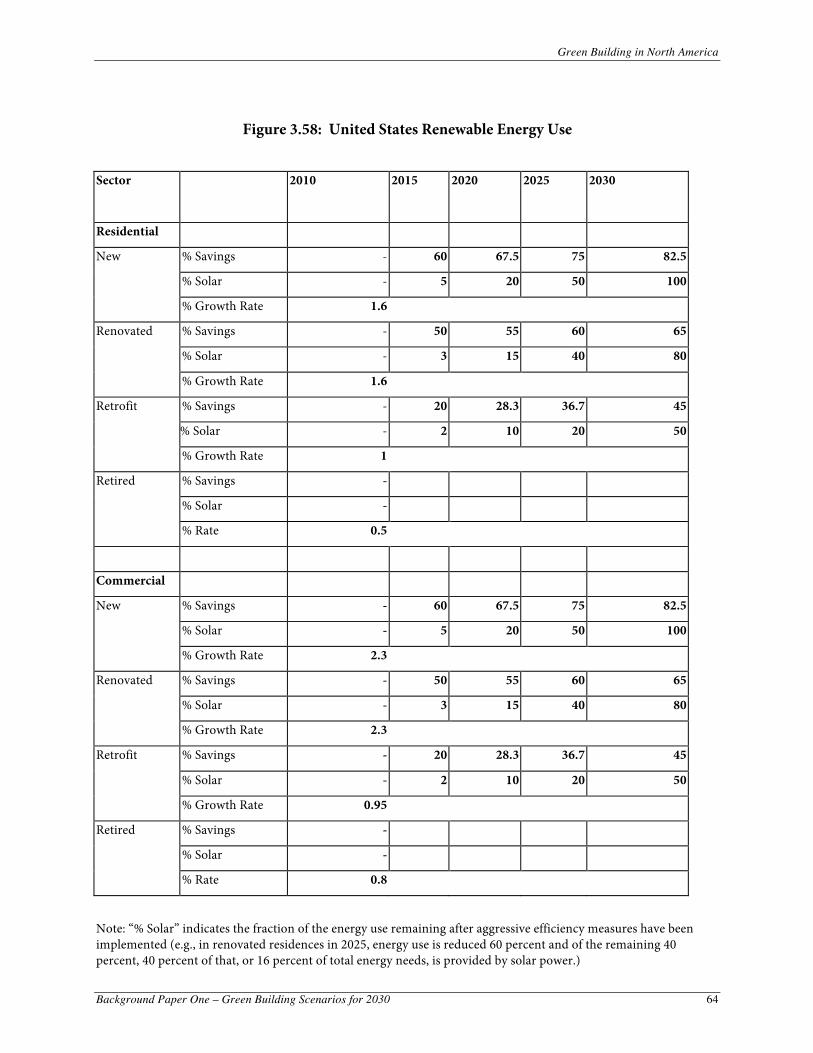
Green Building in North America
Background Paper One – Green Building Scenarios for 2030 64
Figure 3.58: United States Renewable Energy Use
Sector 2010 2015 2020 2025 2030
Residential
New % Savings - 60 67.5 75 82.5
% Solar - 5 20 50 100
% Growth Rate 1.6
Renovated % Savings - 50 55 60 65
% Solar - 3 15 40 80
% Growth Rate 1.6
Retrofit % Savings - 20 28.3 36.7 45
% Solar - 2 10 20 50
% Growth Rate 1
Retired % Savings -
% Solar -
% Rate 0.5
Commercial
New % Savings - 60 67.5 75 82.5
% Solar - 5 20 50 100
% Growth Rate 2.3
Renovated % Savings - 50 55 60 65
% Solar - 3 15 40 80
% Growth Rate 2.3
Retrofit % Savings - 20 28.3 36.7 45
% Solar - 2 10 20 50
% Growth Rate 0.95
Retired % Savings -
% Solar -
% Rate 0.8
Note: “% Solar” indicates the fraction of the energy use remaining after aggressive efficiency measures have been implemented (e.g., in renovated residences in 2025, energy use is reduced 60 percent and of the remaining 40 percent, 40 percent of that, or 16 percent of total energy needs, is provided by solar power.)
Green Building in North America
Background Paper One – Green Building Scenarios for 2030 65
3.3 Implications of Results
This paper presents a Deep Green scenario for achieving the AIA/RAIC targets, as outlined in earlier sections of this report. The North American residential and commercial building stocks were analyzed by building type for various climate zones, and building archetypes were developed that represent aggressive yet technically achievable building construction methods which would lead to significant overall improvements in energy performance of the projected building stocks to 2030. Although the focus of the analysis has been on improving energy performance, as a means to reduce GHG emissions, we believe the outcomes are also indicative of the significant reductions that could be attained related to other resources and pollutants, including water.
The Deep Green scenario analysis confirms that the AIA/RAIC targets are indeed technically achievable. More broadly, the results signal that the advanced market penetration of green building in North America can help improve the environmental and economic well-being of North America through reduced energy operating costs, improved energy security and reliability, and improved productivity.
As previously noted, there are two important pathways in which overall energy performance in the building stock can be achieved: i) improving the unit performance of buildings; we have analyzed aggressive but defensible unit performance upgrades; and ii) accelerating the market penetration of the advanced performance buildings; we have considered aggressive yet plausible roll-out schedules. Neither of these pathways is attainable in the absence of aggressive policy measures. The enormous challenge facing policy makers is how to establish the market conditions under which these significant changes can take place over what is a relatively short time span. These conditions include:
appropriate costing and valuation of energy efficiency, capacity and competencies to transact market-based energy efficiency investments, energy prices that reflect the full societal costs of energy supply, and research, development and demonstration capacity, to ensure that technical performance improvements are
sustained over the long term.
In looking forward, it is incumbent upon policy makers to also carefully consider where and when these performance achievements can be realized. First and foremost, there should be very little time lost in capturing the enormous performance gains associated with new construction over the study time-period. Yet, at the same time, policy makers should not overlook the fact that, overall, it is the current building stock that contains the majority of the possible energy efficiency gains.

Green Building in North America
Background Paper One – Green Building Scenarios for 2030 66
APPENDIX A: North American Residential Sector
Deep Green Scenario Archetypes and Roll-out Schedule–Residential
It should be understood that this by no means defines the only way to achieve such results; it merely represents one of many possibilities, which will depend on numerous factors such as budget, time, effort, climate region, site characteristics, etc. The upgrade performance levels are presented in terms of the EnerGuide for Houses (EGH) energy efficiency rating system used in Canada.12 The EnergGuide rating system is supported by Natural Resources Canada and home inspectors working in Canada are affiliated with the Canadian Association of Home and Property Inspectors. A typical home built in Canada will have an EGH rating of 72. Conversely, an R-2000-compliant home will have an EGH of at least 80 and an Energy Star-compliant home will have an EGH rating of at least 78.
Table A1: SE1 Archetype - Residential
(Achieves between 80 and 85 percent savings relative to baseline new home, or an EnerGuide rating of approximately 95)
Furnace Efficiency A/C SEER Ventilation HVAC
Electricity: • Heat Pump • Heating COP: 6 • Cooling COP: 10
N/A • Fans on automatic control using ECM motor
• HRV (90% efficiency, 75W motor)
• Forced ventilation to achieve 0.3 air changes/hour (ach)
Air Tightness 1.0 ach
DHW Primary: • Solar hot water, 2 panels, CSIA-rating according to Enerworks Solar Calculator
Secondary: • Natural Gas: instantaneous heater, 0.83 energy factor • 150 L/day @ 55oC
Doors Steel polyurethane, 2 standard-size doors
Windows • Triple-glazed, 2 low-e, argon, insulated spacer, vinyl faming, insulated shutters (RSI 1), 50% operable (slider with sash), 50% fixed
• BC North WWR reduced from 25% to 10% • AB North WWR reduced from 20% to 10%
Internal Loads • 50% of R-2000 defaults (Appliances–5 kWh/day, Lighting–1.5 kWh/day, Other electric–1.5 kWh/day, Exterior–2 kWh/day
• 2 adults and 2 children at home 50% of the time
Thermostat 21oC heating set point (19oC basement), 25oC cooling set point
Walls Ceiling Foundation Headers Building Envelope RSI Values (m2oC/W) 7.5 12 3.52+1.76 (walls),
1.4 (floor) 3.52
12 See <http://oee.nrcan.gc.ca/residential/personal/new-homes/upgrade-packages/rating.cfm?attr=4>.

Green Building in North America
Background Paper One – Green Building Scenarios for 2030 67
Residential archetype SE1 Assumptions:
• 50% savings in appliance electricity use breakdown: Fridge/freezer–1 kWh/day, stove–1.4 kWh/day, clothes washer–0.5 kWh/day, dishwasher–0.82 kWh/day, dryer (counts towards exterior)–2 kWh/day
• Details on how to achieve insulation values:
o Foundation: 2” rigid insulation outside, R-20 batt inside, 2” rigid below slab
o Wall: 2” rigid insulation outside, 5.5” polyurethane spray-foam insulation inside
o Ceiling: R70 blown cellulose insulation (approximately 20”)
• 150 L/day hot water use @ 55ºC (assuming low-flow shower heads (1 GPM) and a more efficient washing machine and dishwasher)
• Solar hot water: CSIA remains the same as for 200L/day of hot water consumption, meaning collector efficiency must improve by 15 percent
• Air tightness of 1.0 ach @ 50 Pa should not be difficult to achieve when assuming spray foam insulation is used since it cuts down dramatically on unwanted air infiltration through the building envelope.

Green Building in North America
Background Paper One – Green Building Scenarios for 2030 68
Table A2: SE2 Archetype - Residential
(High Efficiency home (achieves between 50 and 60 percent savings relative to Baseline new home or EnerGuide rating of approximately 88)
Furnace Efficiency A/C SEER Ventilation HVAC
Natural Gas: • High efficiency
condensing • 95% efficiency
Oil: • High efficiency
condensing • 95% efficiency
Electricity: • Heat Pump • Heating COP: 4 • Cooling COP: 5
N/A • Fans on automatic control using ECM motor
• HRV (85% efficiency, 100W motor)
• Forced ventilation to achieve 0.3 ach
Air Tightness 1.0 ach
DHW Primary: • Solar hot water, 2 panels, CSIA rating according to Enerworks Solar Calculator
Secondary: • 40 US gal tank • Natural Gas: condensing, 0.86 energy factor • Oil: 0.7 energy factor • Electricity: 0.822 energy factor • 200 L/day @ 55oC
Doors Steel polyurethane, 2 standard size doors
Windows • Triple-glazed, 2 low-e, argon, insulated spacer, vinyl faming, 50% operable (slider with sash), 50% fixed
• Window areas same as baseline except Yukon (see Table 1: Window Specifications)
• Yukon North windows reduced from 15% to 10% WWR, North and South windows have insulated shutters (RSI 1) that are closed at night
Internal Loads • 80% of R-2000 defaults (Appliances–11.2 kWh/day, Lighting–2.4 kWh/day, Other Electric–2.4 kWh/day, Exterior–3.2 kWh/day
• 2 adults and 2 children at home 50% of the time
Thermostat 21oC heating set point (19oC basement), 25oC cooling set point
Walls Ceiling Foundation Headers Building Envelope RSI Values (m2oC/W) 5.3 10.6 2.11+1.76 (wall),
1.4 (floor) 3.52

Green Building in North America
Background Paper One – Green Building Scenarios for 2030 69
Residential archetype SE2 Assumptions:
• Explanation of electrical load reduction: 20 percent savings should be achievable simply through gradual improvements in appliance motor and insulation technology, improvements in lighting technology (i.e., increasing use of LEDs), and through improvements to the power consumption and standby power of electronics.
• Details on how to achieve insulation values:
o Foundation: 2” rigid insulation outside, R-12 batt inside, 2” rigid below slab o Wall: 2” rigid insulation outside, R-20 batt inside o Ceiling: R60 blown cellulose insulation (approximately 17”)
Roll-out Schedule
The Deep Green scenario assumes SE2 fully penetrates the eligible market beginning the next construction year (2008) and starts to ramp down between 2015 and 2020, representing about 50 percent of the eligible market. SE1 begins to penetrate the eligible market between 2015 and 2020 representing the other 50 percent, and fully penetrates the eligible market through to the end of the study period (2030). The penetration schedule for the Deep Green scenario can be found in Table 3.1.4.
Table A3: Deep Green Scenario Residential Archetype Roll-out Schedule
Archetype 2010 2015 2020 2025 2030
New SE1 5% 20% 40% 75% 100%
New SE2 95% 80% 60% 25% 0%
Reno SE1 0% 10% 20% 25% 35%
Reno SE2 100% 90% 80% 75% 65%
Retro SE1 0% 0% 5% 10% 15%
Retro SE2 100% 100% 95% 90% 85%
The roll-out schedule also represents the penetration of ground-source heat pumps (or similar) in renovated and retrofitted homes. Since it is understood that not all homes will be able to accommodate the infrastructure required for a ground-source heat pump, the more efficient archetype, SE1, is assumed to not noticeably penetrate the existing home market, except for the assumption that 10 percent of renovations and retrofits in Quebec will involve the installed of a GSHP between 2015 and 2030.
Natural Replacement of Equipment
The following turnover rates and improvements in energy consumption have been assumed for the Deep Green scenario:

Green Building in North America
Background Paper One – Green Building Scenarios for 2030 70
Table A4: Deep Green Scenario Natural Replacement of Equipment
Replacement Frequency* (Years)
Annual Portion of Stock (%)
Energy Reduction (%)
2010 2015 2020 2025 2030
Appliances 15 6.7 30 20 15 10 10
Heating System 15 6.7 20 20 30 35 40
Cooling System 15 6.7 15 15 15 15 15
DHW 10 10 30 10 10 10 10
Lighting 5 20 75 10 10 10 10
*replacement frequency from ASHRAE Applications 2003, Chapter 36, Table 3
Note that energy reductions are relative to the building stock of the previous milestone year, so in effect the reductions are additive when comparing to the existing building stock of 2005.
Reductions in the energy consumption of appliances include refrigerators, dishwashers, and clothes washers for the most part. Improvements to the heating system include moving from a vented furnace to a high-efficiency condensing furnace, and then a portion of the population moving to ground-source heat pumps. Improvements to the cooling system result simply from replacing air conditioners with a unit with a higher SEER, and eventually combining this with the ground source loop used for heating. Savings to DHW energy come from reductions in hot water use in the home as well as technologies such as drain water heat recovery. Changes to the DHW system include moving toward instantaneous natural gas water heaters and solar hot water collectors. For lighting, it was the desire to model the impact of eliminating, for the most part, incandescent lighting in homes by 2010, and then introducing less drastic energy savings through to 2030, such as LED lighting, digital dimming, daylight harvesting, and occupancy sensors.

Green Building in North America
Background Paper One – Green Building Scenarios for 2030 71
APPENDIX B: North American Commercial Building Sector
Scenario Archetypes and Roll-out Schedule–Commercial
Two high efficiency building archetypes were defined for commercial buildings as well. The archetypes can be compared relative to the CBIP standard as well as the C-2000 standard in Canada. A typical new commercial building built today will consume about 15 percent more energy than a building built to the CBIP standard. See Appendix A for additional assumptions regarding end-use savings.
The following scaling factors were used for new, renovated, or retrofitted buildings. All reductions are relative to the Baseline new building.
Table B1: SE1 Archetype - Commercial
(Achieves approximately 60 percent savings relative to Baseline new building or 10 percent better than C-2000)
Boiler Efficiency A/C SEER Ventilation HVAC
Electricity: • Heat Pump • Heating COP: 3 • Cooling SEER: 14
Natural Gas: • 95% condensing boiler
N/A • Heat recovery (40–80% efficiency)
• Demand-controlled ventilation (DCV)
• Variable speed fans
• Displacement ventilation
DHW • 0–70% hot water reduction
Primary: • Solar hot water (solar fraction: 60%)
Secondary: • Natural Gas: 85–95% condensing boilers
Windows • Usi 0.94–1.68
• 30–50% shading coefficient
• 40–60% FWR
Walls Ceiling Building Envelope RSI Values (m2oC/W) 3.5–5.0 3.5–5.5
Lighting • Daylighting and occupancy controls
• LPD: 4.0–7.0 W/m2

Green Building in North America
Background Paper One – Green Building Scenarios for 2030 72
Table B2: SE2 Archetype - Commercial
(Achieves approximately 35 percent savings relative to Baseline new building or 20 percent better than CBIP)
Furnace Efficiency A/C SEER Ventilation HVAC
Natural Gas, electric: • 82–100% modulating,
condensing, or electric boilers
Heat pump: SEER 14
• Heat recovery (40% efficiency)
• Some variable speed fans
DHW Primary: • Solar hot water (solar fraction: 50%)
Secondary: • 80–100% gas or electric boiler
Windows • Usi 1.6–1.9, 40–56% shading coefficient
• 40–60% FWR
Walls Ceiling Building Envelope RSI Values (m2oC/W) 2.5–4.5 2.5–4.0
Lighting • LPD: 9.0–10.0 W/m2
Commercial Archetype Assumptions:
• Reductions in the energy consumption of ventilation and pumping are due mostly to the increased use of ECM motors.
• Improvements to the heating system include moving from a vented furnace to a high efficiency condensing furnace or condensing boiler, and then moving to ground-source heat pumps.
• Improvement to the cooling system result simply from replacing air conditioners with a unit with a higher SEER, and eventually combining this with the ground source loop used for heating.
• Savings to DHW energy come from reductions in hot water use as well as technologies such as drain water heat recovery. Changes to the DHW system include moving toward condensing boilers and solar hot water collectors.
• Savings in lighting involve migrating towards high efficiency T5 or T8 technology and eventually LED lighting, digital dimming, daylight harvesting, and occupancy sensors.
Baseline Building Archetypes
Growth in commercial buildings varies widely by sector. The most significant growth is in hotels, restaurants, office buildings, retail, and entertainment. Negative growth is observed in the education sector. Hospitals and religious structures observe minor growth.
Growth trends in Mexico are similar to Canada in terms of where the majority of growth is, however there is also significant growth in the education sector. Religious structures were not considered for Mexico due to a lack of data.

Green Building in North America
Background Paper One – Green Building Scenarios for 2030 73
Table B3: BAU Improvement of Existing and Renovated Stock
BAU Improvement of Existing and Renovated Stock
Change in Energy Intensity (GJ/m2)–By End-Use
Sector 2005 2010 2015 2020 2025 2030
Space Heating -1.75% -0.62% -0.35% -0.35% -0.35%
Water Heating -3.84% -1.38% -0.68% -0.68% -0.68%
Auxiliary Equipment 4.92% 11.24% 10.74% 10.74% 10.74%
Auxiliary Motors 2.11% 4.81% 4.63% 4.63% 4.63%
Lighting -5.36% -3.42% 0.91% 0.91% 0.91%
Space Cooling -2.91% -1.93% -1.68% -1.68% -1.68%
Fuel-share ratios come from the NRCan Comprehensive Energy Use Database (CEUD) for all provinces except for British Columbia and Ontario. For those two provinces, fuel-share ratios come from in-house files and ongoing in-depth studies. This basically caused the electricity fuel share to increase for British Columbia and Ontario for space heating and DHW, since it was felt that the NRCan data underestimated electricity use for those two provinces.
The renovation rate comes from the typical useful service life of commercial buildings by sector, where the service life is defined as the typical time a building will deliver the services and benefits for which is was constructed. The service life therefore could be construed as the amount of time in between major renovations of the building itself as well as the equipment inside of it.
Table B4: Renovation Rates for Canada and Mexico
Sector Renovation Rate (%)
Warehouse 4.27
Hotels & Restaurants 2.66
Office Buildings 2.89
Wholesale & Retail 4.27
Theatres & Recreational Facilities 2.66
Religious Structures 1.94
Hospitals & Health Facilities 2.28
Elementary & Secondary Schools 2.25
Other Institutional 2.59
To determine the energy consumption of new buildings, data was used from studies done for Enbridge Gas and the Ontario Power Authority (OPA) with regards to the typical energy intensity reduction by end-use between new buildings constructed in Ontario and the existing building stock in Ontario, focusing on large offices and retail. This representative fraction was then applied to all commercial building across Canada.

Green Building in North America
Background Paper One – Green Building Scenarios for 2030 74
Table B5: End-use Reduction between Existing Stock and New Buildings
End-use reduction between existing building stock and new buildings
Sector Space Heating
Water Heating
Auxiliary Equipment
Auxiliary Motors Lighting
Space Cooling
end-use savings -31% -23% -34% -29% -25% -22%
In order to predict the change in the energy intensity of new buildings up to 2030, some data from the NRCan outlook was used as well as some informed assumptions. Since new buildings are heavily affected by changes in the building code, it was assumed that a more aggressive reduction in end-use intensity would be found in new buildings, namely in the areas of space heating, space cooling, and lighting. Improvements in the areas of water heating and auxiliary motors would also increase slightly, however auxiliary equipment is assumed to remain somewhat static.
Table B6: BAU Improvement of New Buildings
BAU Improvement of New Buildings
Change in Energy Intensity (GJ/m2) - By End-Use
Sector 2005 2010 2015 2020 2025 2030
Space Heating -1.75% -
15.00% -
0.35% -
0.35% -10.00%
Water Heating -3.84% -10% -
0.68% -
0.68% -5.00%
Auxiliary Equipment 4.92% 0.00% 0.00% 0.00% 0.00%
Auxiliary Motors 2.11% -5% 0.00% 0.00% -5.00%
Lighting -5.36% -20% 0.00% 0.00% -10.00%
Space Cooling -2.91% -10% -
1.68% -
1.68% -10.00%
Roll-out Schedule
The Deep Green scenario assumes SE2 full penetrates the eligible market between the next construction year (2008) and starts to ramp down between 2015 and 2020, representing about 50 percent of the eligible market. SE1 begins to penetrate the eligible market between 2015 and 2020 representing the other 50 percent, and full penetrates the eligible market through to the end of the study period (2030). The penetration schedule for the Deep Green scenario can be found in Table 3.3.8.

Green Building in North America
Background Paper One – Green Building Scenarios for 2030 75
Table B7: Deep Green Scenario Commercial Archetype Roll-out Schedule
Archetype 2010 2015 2020 2025 2030
New SE1 5% 20% 40% 75% 100%
New SE2 95% 80% 60% 25% 0%
Reno SE1 5% 15% 25% 35% 50%
Reno SE2 95% 85% 75% 65% 50%
Retro SE1 0% 0% 5% 10% 15%
Retro SE2 100% 100% 95% 90% 85%
The roll-out schedule also represents the penetration of ground-source heat pumps (or similar) in renovated and retrofitted buildings. Since it is understood that not all building will be able to accommodate the infrastructure required for a ground-source heat pump, the more efficient archetype, SE1, is assumed to penetrate up to a maximum of 50 percent of the existing market (25 percent of retrofits and renovations between 2015 and 2020, 50 percent between 2020 and 2030).
Natural Replacement of Equipment
The following turnover rates and improvements in energy consumption have been assumed:
Table B8: Natural Replacement of Equipment
Replacement Frequency* (Years)
Annual Portion of Stock (%)
Energy Reduction (%)
2010 2015 2020 2025 2030
Ventilation, pumping
20 5.0 10 10 10 10 10
Heating System 30 3.3 20 20 30 35 40
Cooling System 20 5.0 15 15 15 15 15
DHW 30 3.3 30 10 10 10 10
Lighting 15 6.7 30 10 10 10 10
*replacement frequency from ASHRAE Applications 2003, Chapter 36, Table 3
Note that energy reductions are relative to the building stock of the previous milestone year, so in effect the reductions are additive when comparing to the existing building stock of 2005.