marston's plc interim results for the 26 weeks ended 31 ... · and mcewan’s to its brand...
TRANSCRIPT

16 May 2018
MARSTON’S PLC INTERIM RESULTS FOR THE 26 WEEKS ENDED 31 MARCH 2018
Strong revenue and underlying PBT growth, dividend maintained, asset value underpinned
Revenue and underlying PBT growth with underlying EPS and dividend maintained
Underlying Statutory
2018 2017
Revenue £528.1m Up 20% £529.0m £451.5m
Profit/(loss) before tax £36.3m Up 8% £(13.4)m £36.7m
Earnings/(loss) per share 4.8p In line (2.0)p 5.2p
- Underlying profit growth in Taverns, Leased and Brewing
- Destination and Premium (D&P) profits in line with last year despite poor weather
Managed and franchise like-for-like sales in line with last year
- Taverns like-for-like sales up 2.9%, D&P like-for-like -1.8% (drive-to destinations weather
impacted)
- Average profit per pub up 1%
Strong organic growth in Brewing and from CWBB acquisition
- Total volume +74%, market share growth in premium cask ale to 23% and premium
packaged ale to 24%
- On track to deliver at least £4 million target synergies from CWBB acquisition
- CWBB brands have helped us penetrate new markets/geographies
Operating cash flow up 6%, pro-forma leverage and pension deficit reduced
- Pro-forma leverage down 0.2x to 4.8x, fixed charge cover unchanged at 2.6x
- Triennial pension valuation – funding deficit reduced by £10 million to £40 million
Net asset value of 142 pence per share supported by estate revaluation
- Three year estate revaluation at £2.2 billion
Statutory loss principally reflects write-downs in income statement
Interim dividend maintained at 2.7 pence per share
New openings on track, modest reduction to capital plans for 2019
- Six pubs and bars opened; on target to open 15 for the financial year
- Six lodges opened, taking estate to over 1,500 rooms
- 2018 openings performing strongly
- Target 10 pubs and bars, five lodges in 2019, a net capital reduction of £25 million
Outlook
- Expect to deliver growth in both revenue and underlying PBT in 2018
Commenting, Ralph Findlay, CEO said: “We are pleased to report another period of good growth in revenue and underlying profit before tax. Strong trading in Brewing and Taverns and Leased pubs offsets the adverse impact of poor weather on ‘drive-to’ pubs in our Destination estate, further validating the resilience of our model. We have made modest and prudent adjustments to our capital plans to reflect the current economic and consumer climate. However, Marston’s is a balanced business and we are confident that the medium-term outlook for the eating-out and wet-led pub sectors remains good and that targeting an increased profitable share of a growing market through an unremitting focus on quality, service, standards and value for money remains key.”
Forthcoming Events Please find below the forthcoming reporting dates for the Group, which are also available on the investor calendar on our website - www.marstons.co.uk/investors July trading update 25 July 2018 2018 Preliminary results 2019 Interim results
21 November 2018 15 May 2019
ENQUIRIES:
Marston’s PLC Tel: 01902 329516 Instinctif Partners Tel: 020 7457 2020
Ralph Findlay, Chief Executive Officer Justine Warren
Andrew Andrea, Chief Financial and Corporate Development Officer
Matthew Smallwood
An audio webcast of the results presentation will be available at
http://webcast.instinctif.tv/886-1178-19760/en on 16 May 2018
NOTES TO EDITORS
Marston’s is a leading pub operator and independent brewer.
It has an estate of 1,564 pubs situated nationally, comprising managed, franchised and leased pubs.
It is the UK’s leading brewer of premium cask and packaged ales, including Marston’s Pedigree, Wainwright,
Lancaster Bomber and Hobgoblin. The beer portfolio also includes Banks’s, Jennings, Wychwood, Ringwood,
Brakspear and Mansfield beers. Following the acquisition of CWBB, Marston’s has added Bombardier, Courage
and McEwan’s to its brand portfolio, as well as a range of licensed brands including Young’s, Founders and Estrella
Damm.
Marston’s employs around 14,500 people.
Leverage is defined as the ratio of net debt before lease financing to underlying EBITDA. The calculation has been
adjusted to reflect the proforma earnings from the acquisition of CWBB in the second half of the prior financial year.
The underlying results reflect the performance of the Group before exceptional and other adjusting items. The
Directors consider that these figures provide a useful indication of the underlying performance of the Group.

GROUP OVERVIEW
We are pleased to report growth in underlying revenue and profit before tax, despite the impact of
poor weather on our Destination business.
Total underlying revenue increased by 19.8% with growth in all trading segments principally driven by
the acquisition of the Charles Wells Beer Business (“CWBB”), the contribution from new openings
and pub acquisitions and positive like-for-like sales in our Taverns business. Total managed and
franchised like-for-like sales were in line with last year with growth in Taverns offset by weaker sales
in Destination and Premium, which were impacted by the poor weather in the period.
Group operating margins were 2% behind last year reflecting increased costs in Destination and
Premium, the continued impact of converting pubs from tenancy to franchise, the short-term dilution
impact of the distribution contracts in Brewing and the CWBB acquisition which operate at a lower
margin than our existing beer business.
Underlying operating profit of £74.3 million (2017: £71.0 million) was up 4.6%.
Underlying profit before tax was up 7.7% to £36.3 million (2017: £33.7 million), principally reflecting
the strong Brewing and Taverns performance, including CWBB. Basic underlying earnings per share
for the period of 4.8 pence per share (2017: 4.8 pence per share) were in line with last year, reflecting
the strong growth in profit before tax and the equity placing undertaken to finance the CWBB
acquisition.
On a statutory basis, the loss before tax was £13.4 million principally reflecting accounting
adjustments relating to the estate valuation and changes in the fair value of interest rate swaps, both
of which are non-cash items. The basic loss per share was 2.0 pence per share.
Operating cash flow of £63.3 million was 6% higher than last year reflecting higher profits in the period.
Net debt at the period end was £1,393 million. Net debt excluding lease financing of £1,059 million
is £2 million below last year. Excluding property leases with freehold reversion entitlement, and on a
pro-forma basis (incorporating the post-synergy benefits of CWBB) the ratio of net debt to underlying
EBITDA was 4.8 times at the period end (2017: 5.0 times). Fixed charge cover was unchanged at
2.6 times.
The three-yearly external valuation of our property portfolio was £2.2 billion, broadly in line with book
value. There is an associated non-underlying charge of £40 million accounted for in the income
statement.
Including the adoption of the property valuation, net asset value is £1.42 per share.
We have also concluded the triennial pension valuation for the three years to 30 September 2017.
The £40 million funding deficit is a £10 million improvement despite the adverse impact of lower gilt
yields, reflecting a consistent level of funding and a sensible investment strategy. We have agreed
with the trustees to maintain current pension ‘top-up’ contributions of around £8 million per annum,
but that the Group will not be obliged to maintain them once the deficit is cleared. On the basis of the
existing investment strategy and assuming no favourable movement in gilt yields, we are targeting to
clear the deficit position by financial year 2022 at the latest.
Outlook, dividend and Board structure
We expect to deliver growth in both revenue and underlying profit before tax in 2018 despite the
impact of weather on our first-half results. Our drinks-led businesses are in growth and the
forthcoming World Cup presents a further opportunity. In Destination, we anticipate an improvement
in like-for-like sales trends over the second half-year against softer comparatives.
With regard to cost guidance for 2018 there are no material changes to the cost trends highlighted
previously. We have protected a significant proportion of our cost base through long-term
relationships with suppliers and fixed price contracts, actively managing the risk to our margins.
We propose to maintain the interim dividend at 2.7 pence per share reflecting underlying earnings per
share in line with last year. It remains our policy to target dividend progression commensurate with
earnings growth and achieving dividend cover of 2 times over the medium term.
As announced previously our Chairman, Roger Devlin, will step down from the Board at the end of
May. A search process to find his successor is underway, and in the meantime Carolyn Bradley,
Senior Independent Director, will be appointed Interim Chair from 1 June 2018.
We are in the process of combining the Taverns and Leased operational teams so that area managers
will now manage a range of tenancy, lease and franchise-style agreements. This is intended to create
even more flexibility in choice of operating models, and we will merge the two segments for reporting
purposes in the 2018 full-year results.
Allocation of growth capital
In 2018, we expect to open 15 pubs and bars and six lodges.
We believe that investment in new pubs, lodges and bars in chosen locations continues to create
shareholder value through generating high return on capital, and it is the main component of our
strategy to achieve organic growth. To date we have opened six pubs and bars and six lodges. New
openings in 2018 have performed strongly, and we continue to see good opportunities for further
expansion.
Given recent sector trends, including high levels of new openings and investment in the eating-out
sector, we are adopting a more cautious approach to new openings in the short term. The market is
beginning to respond to recent over-supply and we expect that competition for new sites will reduce.
In the meantime we expect to open 10 pubs and five lodges in 2019 representing a £25 million
reduction in capital investment from the original programme.
Our site pipeline remains strong and we expect to maintain the current level of site acquisition.
Market position
We invest across the wider eating-out drinking and accommodation sectors, protecting against
cyclical trends in any one part of the market. We operate wet-led community pubs (Taverns), food-
led destination and premium pubs and bars (Destination and Premium), and offer accommodation
(pubs with rooms and lodges). In Brewing we have significant market shares in on-trade, off-trade
and export markets.

At heart we are a pubs and beer business. Whilst we are not immune from the pressures affecting
the wider eating-out market, pubs have performed better than restaurants this year. In developing our
new-build pubs in recent years we have continued to ensure that pub values remain a core part of
our offer, even in the more food-led pub-restaurants and we have sought sites away from competitive
‘hot-spots’. These factors have contributed to our resilient performance.
Well invested wet-led community pubs continue to offer good opportunity. Those that remain are
better pubs, in stronger locations, and have benefited from a surge of interest in craft beers and spirits
as well as engagement with local communities and effective use of social media.
Similarly, although the wider eating-out market has been challenging, this market is still in growth in
the UK and is expected to continue to grow. There remains opportunity to continue to increase market
share in a highly competitive, but growing market.
In terms of pricing, value for money is important in our pubs. The sector has faced significant cost
challenges in recent years as property, people and input costs have increased, and our ability to offset
those while remaining affordable is testament to the quality, service and standards experienced by
customers in our pubs and bars.
Strategy and market
Our focus is on delivering sustainable growth and maximising return on capital, with six key
components to our strategy as outlined below:
1. Operating a high quality pub estate.
We operate a pub estate that caters for a broad range of customers, with flexible operating
models. This allows us to ensure that we have the right consumer offer and the most appropriate
operating model to maximise sales and profits for each pub. The key elements are as follows:
Destination and Premium – 402 pubs. Our Destination pubs offer family dining and great
value in a relaxed pub environment.
Our Pitcher & Piano bars and Revere pubs and bars offer premium food and drink in
‘flagship’ town centre and suburban locations.
Taverns – 806 pubs. Our community pubs are great ‘locals’ with a more traditional pub
ambience. Success is driven by good licensees and community engagement.
Leased – 356 pubs. These distinctive pubs benefit from a high degree of independence
and committed licensees operated under longer-term leases. Lessees have a choice of
tied or free-of-tie agreements.
2. Targeting pub growth.
New pubs and bars. In our Destination and Premium business, we have opened over 200 pub-
restaurants in the last 10 years, representing around 60% of the current Destination estate. These
pubs offer family dining at reasonable prices and generate high turnover, with target sales of
around £25,000 per week and a food sales mix of around 60%.
We also target growth in our Premium pub business, comprising Pitcher & Piano and Revere,
aiming to selectively expand the estate through both new site development and acquisition.
Development of the franchise model. The majority of our pubs in the Taverns business are
operated using franchise-style agreements. These offer flexibility and reduced risk for licensees,
and incentivise local and customer engagement. The entrepreneurial nature of licensees attracted
by this model has proven to be successful in generating growth in community pubs.
3. Increased investment in rooms.
We operate over 1,500 rooms across our Destination and Premium pub estate, including 27
lodges. The combination of pub-restaurant with an adjacent lodge is attractive in the context of
increasing business and leisure travel. We aim to open 5-10 new lodges per year, mainly on sites
adjacent to new-build pub-restaurants.
4. Offering the best consumer experience: quality, service, value and innovation.
Our range of Destination pub food offers includes Pizza Kitchens, Milestone Rotisserie, Carvery, Smokehouse, Generous George, and Grill & Pizza, as well as traditional pubs with food. ‘Two-for-One’, a price-leader format, has been steadily repositioned over the last 18 months to provide an enhanced customer experience and improved service style: spend per head and customer feedback have both improved. Having converted 45 pubs to date, we expect a further 100 conversions in the next two years at an additional cost of £5 million per annum. In our Premium pubs, food quality is underlined by the use of local ingredients, more fresh meat and produce, and the best kitchen equipment available, including Josper grills and wood-fired pizza ovens.
In drinks, we continue to see growth in premium drinks with strong interest in new brands and
tastes including non-alcoholic drinks. In our pubs we continue to evolve our drinks offer ensuring
we meet the needs of both existing and new customers. We also leverage the benefit of our
market leading beer business, offering an outstanding range of traditional and craft beers as
described below.
This year, we are targeting service improvements from investment in high-speed broadband and
a new EPOS system which will provide us with better customer information, improved service,
and improved efficiencies in our pubs. This is expected to contribute to profit improvement from
the second half of 2018.
Continuous improvement in each of these areas is an essential component in the perceived value
of our offer, and is particularly important against a backdrop of increasing property, people and
other costs. The sector is experiencing tighter operating margins, and our strategy has been to
focus on improving our offers and to avoid the intense price competition and discounting which
characterises much of the market. Our aim is to generate customer visits based on “best
experience” rather than “lowest price”.
5. Leadership in the UK beer market.
The UK beer market is evolving with consumers seeking a wider choice of beers with local
provenance and taste, including craft beers. The off-trade continues to grow, with the strongest
growth in premium bottled ale and craft beer. Non-alcoholic beers are in significant growth from a
small base.
We have a wide portfolio of beers which account for 1 in 4 premium bottled ales and around 1 in
4 premium cask ales sold in the UK. The portfolio was enhanced in 2017 by the acquisition of
CWBB which included Bombardier, Youngs, McEwans and the Courage brands. Of our volume,
premium ales represent 72%, 50% is sold in the off-trade, and 8% is exported. 88% of sales are
outside Marston’s own pubs.

In April 2018 we were awarded The Best Ale Supplier 2018 in the Morning Advertiser Reader's
Choice Awards for the 4th year running.
Our largest brand, Hobgoblin, is the most followed beer brand on social media, recently being
awarded Digital and Social Media Campaign of the Year at the PRCA Dare Awards. Hobgoblin
has won numerous industry awards, most notably Hobgoblin Gold being awarded gold medals at
both the World Beer Awards and International Beer Festival.
We revitalised the Marston’s beer brand in 2017 to attract younger consumers under the marketing
banner “From Burton with Love”. The success of this initiative is such that both 61 Deep and
Pedigree have received industry awards this year and consumer feedback has been strong.
Our commitment to local beers with strong heritage was also recognised with the brewery tours
of Wychwood and Ringwood receiving tourist awards in the period.
Collaboration and licensed brands also form part of our portfolio. We own exclusive UK beer
licences for Estrella Damm, Shipyard, Warsteiner, Kirin, Erdinger, Krusovice and Founders, as
well as Kingstone Press Cider. This portfolio has performed extremely well in the half year and,
of particular note, Estrella Damm is the fastest growing premium lager and Shipyard is the number
1 craft beer in the UK.
Our highly experienced brewing and logistics teams continue to operate the business at maximum
efficiency and to a high standard with our three largest breweries all BRC “A” rated or above. This
enables us to undertake extensive contract services work with customers who recognise the
benefits of working in partnership with us, and we constantly pursue additional opportunities. Last
year we entered into new agreements to become the exclusive distributor to c.1,600 Punch ‘B’
pubs, Hawthorn Leisure and Brakspear pubs. We recently announced our intention to invest in a
new canning line in Burton which will open up further customer opportunities and reduce our own
costs.
6. Our people – ‘The Place to Be’.
Marston’s employs around 14,500 people and, although many businesses claim that ‘people are
our most important asset’, it is the case that nothing makes a bigger difference to our business
than our people.
At Marston’s we know that if we develop and inspire our people, they will grow our business. It is
their passion for customer service and quality products that makes our business successful – that
is why our shared ambition is to keep our people at the heart of all we do.
The key to unlocking the potential of our people is to engage and unite them through our Ways of
Working, while also enabling them by providing skills, tools and environments so they can play
their part and contribute. As such, we measure both engagement and enablement of our people
through our employee survey and whilst our scores are significantly above the comparator group,
we continually develop our work in this critical area.
We continue to strive to make Marston’s ‘The Place to Be’ for our existing and prospective
employees by providing an experience that is attractive and fulfilling for our people and beneficial
for our business.
PERFORMANCE AND FINANCIAL REVIEW
Underlying revenue
Underlying operating profit
Margin
2018
2017
2018
2017
2018
2017
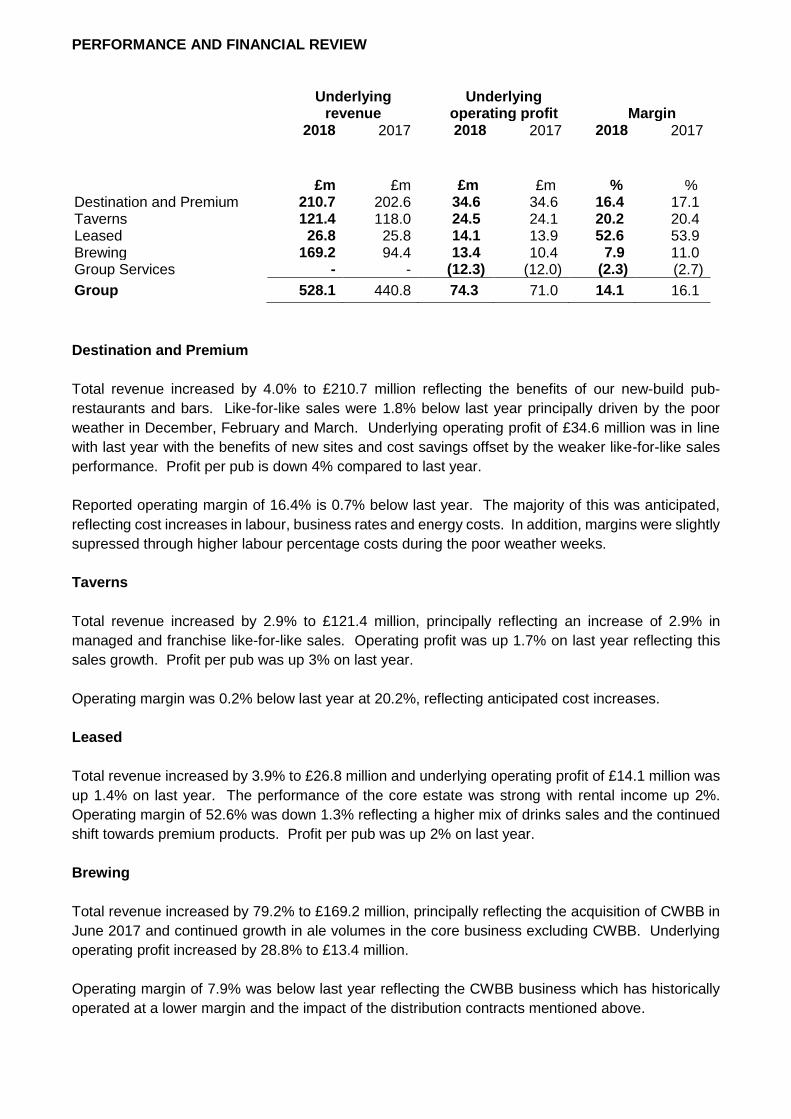
£m £m £m £m % % Destination and Premium 210.7 202.6 34.6 34.6 16.4 17.1 Taverns 121.4 118.0 24.5 24.1 20.2 20.4 Leased 26.8 25.8 14.1 13.9 52.6 53.9 Brewing 169.2 94.4 13.4 10.4 7.9 11.0 Group Services - - (12.3) (12.0) (2.3) (2.7)
Group 528.1 440.8 74.3 71.0 14.1 16.1
Destination and Premium
Total revenue increased by 4.0% to £210.7 million reflecting the benefits of our new-build pub-
restaurants and bars. Like-for-like sales were 1.8% below last year principally driven by the poor
weather in December, February and March. Underlying operating profit of £34.6 million was in line
with last year with the benefits of new sites and cost savings offset by the weaker like-for-like sales
performance. Profit per pub is down 4% compared to last year.
Reported operating margin of 16.4% is 0.7% below last year. The majority of this was anticipated,
reflecting cost increases in labour, business rates and energy costs. In addition, margins were slightly
supressed through higher labour percentage costs during the poor weather weeks.
Taverns
Total revenue increased by 2.9% to £121.4 million, principally reflecting an increase of 2.9% in
managed and franchise like-for-like sales. Operating profit was up 1.7% on last year reflecting this
sales growth. Profit per pub was up 3% on last year.
Operating margin was 0.2% below last year at 20.2%, reflecting anticipated cost increases.
Leased
Total revenue increased by 3.9% to £26.8 million and underlying operating profit of £14.1 million was
up 1.4% on last year. The performance of the core estate was strong with rental income up 2%.
Operating margin of 52.6% was down 1.3% reflecting a higher mix of drinks sales and the continued
shift towards premium products. Profit per pub was up 2% on last year.
Brewing
Total revenue increased by 79.2% to £169.2 million, principally reflecting the acquisition of CWBB in
June 2017 and continued growth in ale volumes in the core business excluding CWBB. Underlying
operating profit increased by 28.8% to £13.4 million.
Operating margin of 7.9% was below last year reflecting the CWBB business which has historically
operated at a lower margin and the impact of the distribution contracts mentioned above.

Taxation The underlying rate of taxation of 16.8% in 2018 (2017: 18.1%) is below the standard rate of
corporation tax due to (i) significant deferred tax movements in the year at the future enacted rate of
17%, and (ii) the deferred tax benefit of property disposals.
Non-underlying items There is a net non-underlying charge of £43.0 million after tax. This primarily reflects the external
estate valuation undertaken in the period, which resulted in a £39.8 million charge to the income
statement. A net revaluation increase of £8.6 million has also been recognised in the revaluation
reserve in respect of property revaluations undertaken in the period. Other non-underlying items
comprise a charge of £0.7 million in respect of the change in the rate assumptions used in calculating
our onerous lease provisions, reorganisation and integration costs of £3.6 million, principally from the
integration of CWBB, a charge of £0.1 million in respect of the net interest on the net defined benefit
pension liability and a £4.1 million loss in respect of the mark-to-market movement in the fair value of
certain interest rate swaps. The revenue of £0.9 million and expenses of £2.3 million in respect of
the management of the remaining pubs from the portfolio disposal in December 2013 have also been
included within non-underlying items. These charges are offset by a credit of £6.7 million relating to
the tax on non-underlying items.
Capital expenditure and disposals Capital expenditure was £83.1 million in the period (2017: £79.7 million), including £37 million on new
pubs and bars. We expect that capital expenditure will be around £155 million in 2018, including
around £75 million for the construction of 15 pubs and bars and six lodges.
Cash proceeds of £26.3 million have been raised through the disposal of assets, including £18.6
million of leasing transactions. Disposal proceeds of around £45-50 million are anticipated in 2018.
Financing
The Group has a £320 million bank facility to March 2023, with an additional £40 million accordion
facility. This facility, together with a long-term securitisation of approximately £791 million and the
lease financing arrangements described below, provide us with an appropriate level of financing
headroom for the medium term. The Group has sufficient headroom on both the banking and
securitisation covenants and also has flexibility to transfer pubs between the banking and
securitisation groups.
In recent years, the Group has entered into lease financing arrangements which have a total value of
£334 million as at 31 March 2018. This financing is a form of sale and leaseback agreement whereby
the freehold reverts to the Group at the end of the term at nil cost, consistent with our preference for
predominantly freehold asset tenure. The agreements range from 35 to 40 years and provide the
Group with an extended debt maturity profile at attractive rates of interest. Unlike a traditional sale
and leaseback, the associated liability is recognised as debt on the balance sheet due to the reversion
of the freehold.
Net debt excluding lease financing of £1,059 million at 31 March 2018 is £2 million below last year.
Operating cash flow of £63.3 million is 6% ahead of last year reflecting higher profits in the period.
For the period ended 31 March 2018 the ratio of net debt before lease financing to underlying EBITDA
was 4.9 times (2017: 5.0 times). On a pro-forma basis (incorporating the post synergy EBITDA from
CWBB) the leverage figure is 4.8 times. It remains our intention to reduce this ratio over time,
principally through EBITDA growth generated from our new-build investment programme.

Pensions The deficit on our final salary scheme was £2.0 million at 31 March 2018 which compares to the £5.4
million deficit at last year end. As described above we have concluded our triennial pension valuation
to 30 September 2017 which concluded an improvement in the funding deficit.

Independent review report to Marston's PLC
Report on the condensed consolidated interim financial statements
Our conclusion
We have reviewed Marston's PLC's condensed consolidated interim financial statements (the "interim
financial statements") in the Interim Results of Marston's PLC for the 26 week period ended 31 March
2018. Based on our review, nothing has come to our attention that causes us to believe that the
interim financial statements are not prepared, in all material respects, in accordance with International
Accounting Standard 34, ‘Interim Financial Reporting’, as adopted by the European Union and the
Disclosure Guidance and Transparency Rules sourcebook of the United Kingdom’s Financial Conduct
Authority.
What we have reviewed
The interim financial statements comprise:
the Group balance sheet as at 31 March 2018;
the Group income statement and Group statement of comprehensive income for the period
then ended;
the Group cash flow statement for the period then ended;
the Group statement of changes in equity for the period then ended; and
the explanatory notes to the interim financial statements.
The interim financial statements included in the Interim Results have been prepared in accordance
with International Accounting Standard 34, ‘Interim Financial Reporting’, as adopted by the European
Union and the Disclosure Guidance and Transparency Rules sourcebook of the United Kingdom’s
Financial Conduct Authority.
As disclosed in note 1 to the interim financial statements, the financial reporting framework that has
been applied in the preparation of the full annual financial statements of the Group is applicable law
and International Financial Reporting Standards (IFRS) as adopted by the European Union.
Responsibilities for the interim financial statements and the review
Our responsibilities and those of the Directors
The Interim Results, including the interim financial statements, is the responsibility of, and has been
approved by, the Directors. The Directors are responsible for preparing the Interim Results in
accordance with the Disclosure Guidance and Transparency Rules sourcebook of the United
Kingdom’s Financial Conduct Authority.
Our responsibility is to express a conclusion on the interim financial statements in the Interim Results
based on our review. This report, including the conclusion, has been prepared for and only for the
Company for the purpose of complying with the Disclosure Guidance and Transparency Rules
sourcebook of the United Kingdom’s Financial Conduct Authority and for no other purpose. We do
not, in giving this conclusion, accept or assume responsibility for any other purpose or to any other
person to whom this report is shown or into whose hands it may come save where expressly agreed
by our prior consent in writing.
What a review of interim financial statements involves
We conducted our review in accordance with International Standard on Review Engagements (UK
and Ireland) 2410, ‘Review of Interim Financial Information Performed by the Independent Auditor of
the Entity’ issued by the Auditing Practices Board for use in the United Kingdom. A review of interim
financial information consists of making enquiries, primarily of persons responsible for financial and
accounting matters, and applying analytical and other review procedures.

A review is substantially less in scope than an audit conducted in accordance with International
Standards on Auditing (UK) and, consequently, does not enable us to obtain assurance that we would
become aware of all significant matters that might be identified in an audit. Accordingly, we do not
express an audit opinion.
We have read the other information contained in the Interim Results and considered whether it
contains any apparent misstatements or material inconsistencies with the information in the interim
financial statements.
PricewaterhouseCoopers LLP
Chartered Accountants
Birmingham
16 May 2018
a) The maintenance and integrity of the Marston's PLC website is the responsibility of the Directors;
the work carried out by the auditors does not involve consideration of these matters and,
accordingly, the auditors accept no responsibility for any changes that may have occurred to the
interim financial statements since they were initially presented on the website.
b) Legislation in the United Kingdom governing the preparation and dissemination of financial
statements may differ from legislation in other jurisdictions.

Responsibility Statement of the Directors in respect of the Interim Results
The Directors confirm that these condensed consolidated interim financial statements have been
prepared in accordance with IAS 34 as adopted by the European Union and that the interim
management report includes a fair review of the information required by DTR 4.2.7R and DTR 4.2.8R,
namely:
an indication of important events that have occurred during the first six months of the financial
year and their impact on the condensed set of financial statements, and a description of the
principal risks and uncertainties for the remaining six months of the financial year; and
material related party transactions in the first six months of the financial year and any material
changes in the related party transactions described in the last Annual Report and Accounts.
The Directors of Marston’s PLC are listed in the Marston’s PLC Annual Report and Accounts for 30
September 2017 with the exception of the following changes in the period: Nick Backhouse retired
from the Board on 23 January 2018. A list of current Directors is maintained on the Marston’s PLC
website: www.marstons.co.uk.
By order of the Board:
Ralph Findlay Andrew Andrea
Chief Executive Officer Chief Financial and Corporate Development Officer
16 May 2018 16 May 2018

GROUP INCOME STATEMENT (UNAUDITED) for the 26 weeks ended 31 March 2018
26 weeks to 31 March 2018 26 weeks to 1 April 2017
52 weeks to 30 September
2017
Note
Underlying
£m
Non- underlying
£m
Total
£m
Underlying
£m
Non- underlying
£m
Total
£m Total
£m
Revenue 2, 3 528.1 0.9 529.0 440.8 10.7 451.5 1,011.3
Operating expenses (453.8) (46.4) (500.2) (369.8) (10.0) (379.8) (840.9)
Operating profit 2, 3 74.3 (45.5) 28.8 71.0 0.7 71.7 170.4
Finance costs 4 (38.2) (0.1) (38.3) (37.6) (1.7) (39.3) (76.9)
Finance income 4 0.2 - 0.2 0.3 - 0.3 0.4
Movement in fair value of interest rate swaps
3, 4 - (4.1) (4.1) - 4.0 4.0 6.4
Net finance costs 3, 4 (38.0) (4.2) (42.2) (37.3) 2.3 (35.0) (70.1)
Profit/(loss) before taxation 36.3 (49.7) (13.4) 33.7 3.0 36.7 100.3
Taxation 3, 5 (6.1) 6.7 0.6 (6.1) (0.5) (6.6) (15.6)
Profit/(loss) for the period attributable to equity shareholders
30.2 (43.0) (12.8) 27.6 2.5 30.1 84.7
(Loss)/earnings per share: Basic (loss)/earnings per share 6 (2.0)p 5.2p 14.2p
Basic underlying earnings per share 6 4.8p 4.8p 14.2p
Diluted (loss)/earnings per share 6 (2.0)p 5.2p 14.1p
Diluted underlying earnings per share 6 4.7p 4.7p 14.0p
GROUP STATEMENT OF COMPREHENSIVE INCOME (UNAUDITED) for the 26 weeks ended 31 March 2018
26 weeks to 31 March
2018
26 weeks to 1 April 2017
52 weeks to 30 September
2017
£m £m £m
(Loss)/profit for the period (12.8) 30.1 84.7
Items of other comprehensive income that may subsequently be reclassified to profit or loss
(Losses)/gains arising on cash flow hedges (3.2) 25.4 35.7
Transfers to the income statement on cash flow hedges 5.4 5.5 10.7
Tax on items that may subsequently be reclassified to profit or loss (0.3) (5.3) (7.9)
1.9 25.6 38.5
Items of other comprehensive income that will not be reclassified to profit or loss
Remeasurement of retirement benefits (0.1) 11.5 21.8
Unrealised surplus on revaluation of properties 170.3 2.3 2.3
Reversal of past revaluation surplus (161.7) (0.8) (0.8)
Tax on items that will not be reclassified to profit or loss (0.2) (1.0) 0.2
8.3 12.0 23.5
Other comprehensive income for the period 10.2 37.6 62.0
Total comprehensive (expense)/income for the period (2.6) 67.7 146.7

GROUP CASH FLOW STATEMENT (UNAUDITED) for the 26 weeks ended 31 March 2018
26 weeks to 31 March
2018
26 weeks to 1 April 2017
52 weeks to 30 September
2017
Note £m £m £m
Operating activities
Underlying operating profit 74.3 71.0 174.5
Depreciation and amortisation 20.7 19.6 39.2
Underlying EBITDA 95.0 90.6 213.7
Non-underlying operating items 3 (45.5) 0.7 (4.1)
EBITDA 49.5 91.3 209.6
Working capital movement (10.9) (14.7) 38.8
Non-cash movements 34.6 (3.7) (7.9)
Decrease in provisions and other non-current liabilities (2.4) (5.4) (9.1)
Difference between defined benefit pension contributions paid and amounts charged (4.0) (3.9) (8.3)
Income tax paid (3.5) (3.6) (9.5)
Net cash inflow from operating activities 63.3 60.0 213.6
Investing activities
Interest received 0.3 0.2 0.3
Sale of property, plant and equipment and assets held for sale 26.3 33.2 61.2
Purchase of property, plant and equipment and intangible assets (83.1) (79.7) (196.3)
Acquisition of subsidiary - - (90.5)
Movement in other non-current assets 0.2 0.6 0.7
Transfer to other cash deposits - - (120.0)
Net cash outflow from investing activities (56.3) (45.7) (344.6)
Financing activities
Equity dividends paid (30.4) (27.0) (44.1)
Interest paid (40.2) (38.1) (70.2)
Arrangement costs of bank facilities - (3.1) (3.3)
Arrangement costs of other lease related borrowings (2.6) (1.7) (4.6)
Issue of shares - - 75.5
Purchase of own shares (0.6) - -
Proceeds from sale of own shares - 0.1 0.3
Repayment of securitised debt (14.7) (13.8) (28.4)
Repayment of bank borrowings - (263.0) (263.0)
Advance of bank borrowings 34.0 290.0 280.0
Capital element of finance leases repaid (0.1) (0.1) (0.1)
Advance of other lease related borrowings 35.8 22.6 57.9
Net cash outflow from financing activities (18.8) (34.1) -
Net decrease in cash and cash equivalents 8 (11.8) (19.8) (131.0)
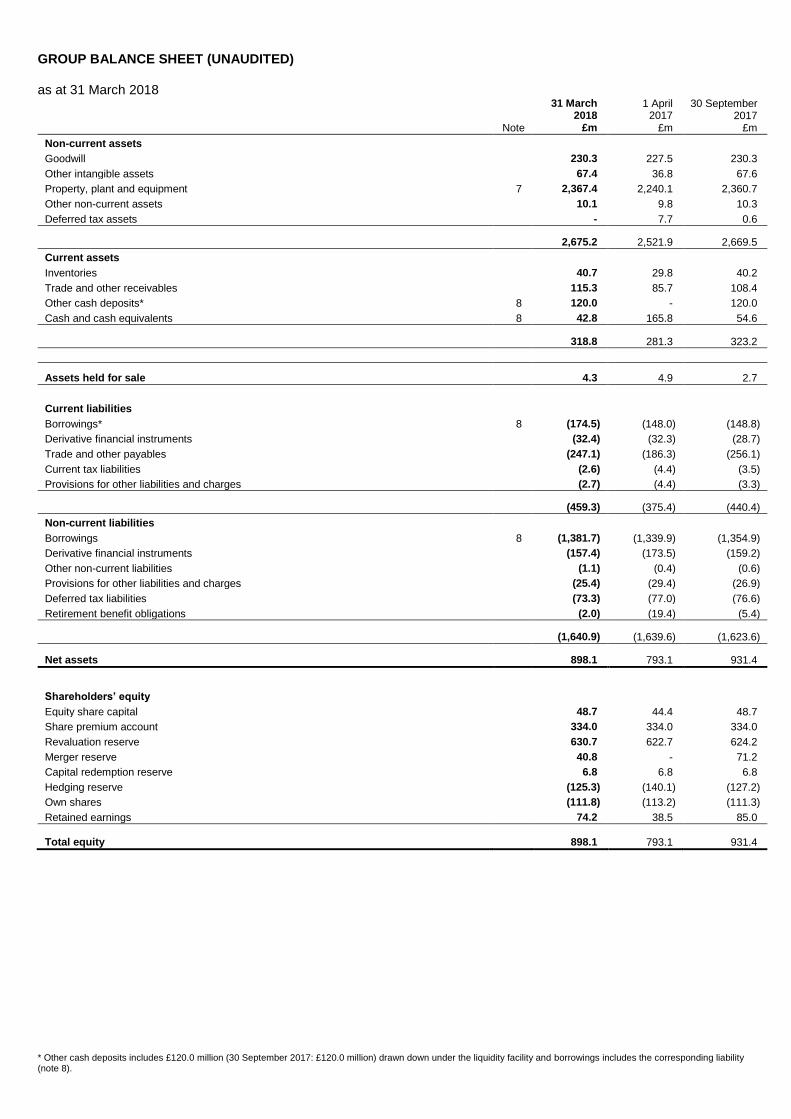
GROUP BALANCE SHEET (UNAUDITED) as at 31 March 2018
31 March 2018
1 April 2017
30 September 2017
Note £m £m £m
Non-current assets
Goodwill 230.3 227.5 230.3
Other intangible assets 67.4 36.8 67.6
Property, plant and equipment 7 2,367.4 2,240.1 2,360.7
Other non-current assets 10.1 9.8 10.3
Deferred tax assets - 7.7 0.6
2,675.2 2,521.9 2,669.5
Current assets
Inventories 40.7 29.8 40.2
Trade and other receivables 115.3 85.7 108.4
Other cash deposits* 8 120.0 - 120.0
Cash and cash equivalents 8 42.8 165.8 54.6
318.8 281.3 323.2
Assets held for sale 4.3 4.9 2.7
Current liabilities
Borrowings* 8 (174.5) (148.0) (148.8)
Derivative financial instruments (32.4) (32.3) (28.7)
Trade and other payables (247.1) (186.3) (256.1)
Current tax liabilities (2.6) (4.4) (3.5)
Provisions for other liabilities and charges (2.7) (4.4) (3.3)
(459.3) (375.4) (440.4)
Non-current liabilities
Borrowings 8 (1,381.7) (1,339.9) (1,354.9)
Derivative financial instruments (157.4) (173.5) (159.2)
Other non-current liabilities (1.1) (0.4) (0.6)
Provisions for other liabilities and charges (25.4) (29.4) (26.9)
Deferred tax liabilities (73.3) (77.0) (76.6)
Retirement benefit obligations (2.0) (19.4) (5.4)
(1,640.9) (1,639.6) (1,623.6)
Net assets 898.1 793.1 931.4
Shareholders’ equity
Equity share capital 48.7 44.4 48.7
Share premium account 334.0 334.0 334.0
Revaluation reserve 630.7 622.7 624.2
Merger reserve 40.8 - 71.2
Capital redemption reserve 6.8 6.8 6.8
Hedging reserve (125.3) (140.1) (127.2)
Own shares (111.8) (113.2) (111.3)
Retained earnings 74.2 38.5 85.0
Total equity 898.1 793.1 931.4
* Other cash deposits includes £120.0 million (30 September 2017: £120.0 million) drawn down under the liquidity facility and borrowings includes the corresponding liability (note 8).

GROUP STATEMENT OF CHANGES IN EQUITY (UNAUDITED) for the 26 weeks ended 31 March 2018
Equity share
capital
Share premium account
Revaluation reserve
Merger reserve
Capital redemption
reserve
Hedging reserve
Own
shares Retained earnings
Total
equity
£m £m £m £m £m £m £m £m £m
At 1 October 2017 48.7 334.0 624.2 71.2 6.8 (127.2) (111.3) 85.0 931.4
Loss for the period - - - - - - - (12.8) (12.8)
Remeasurement of retirement benefits - - - - - - - (0.1) (0.1)
Losses on cash flow hedges - - - - - (3.2) - - (3.2)
Transfers to the income statement on cash flow hedges - - - - - 5.4 - - 5.4
Tax on hedging reserve movements - - - - - (0.3) - - (0.3)
Property revaluation - - 170.3 - - - - - 170.3
Property impairment - - (161.7) - - - - - (161.7)
Deferred tax on properties - - (0.2) - - - - - (0.2)
Total comprehensive income/(expense) - - 8.4 - - 1.9 - (12.9) (2.6)
Share-based payments - - - - - - - 0.3 0.3
Purchase of own shares - - - - - - (0.6) - (0.6)
Sale of own shares - - - - - - 0.1 (0.1) -
Disposal of properties - - (1.9) - - - - 1.9 -
Tax on disposal of properties - - 0.4 - - - - (0.4) -
Transfer to retained earnings - - (0.4) - - - - 0.4 -
Dividends paid - - - (30.4) - - - - (30.4)
Total transactions with owners - - (1.9) (30.4) - - (0.5) 2.1 (30.7)
At 31 March 2018 48.7 334.0 630.7 40.8 6.8 (125.3) (111.8) 74.2 898.1
for the 26 weeks ended 1 April 2017
Equity share
capital
Share premium account
Revaluation reserve
Capital redemption
reserve
Hedging reserve
Own
shares Retained earnings
Total
equity
£m £m £m £m £m £m £m £m
At 2 October 2016 44.4 334.0 623.1 6.8 (165.7) (113.7) 23.2 752.1
Profit for the period - - - - - - 30.1 30.1
Remeasurement of retirement benefits - - - - - - 11.5 11.5
Tax on remeasurement of retirement benefits - - - - - - (1.9) (1.9)
Gains on cash flow hedges - - - - 25.4 - - 25.4
Transfers to the income statement on cash flow hedges - - - - 5.5 - - 5.5
Tax on hedging reserve movements - - - - (5.3) - - (5.3)
Property revaluation - - 2.3 - - - - 2.3
Property impairment - - (0.8) - - - - (0.8)
Deferred tax on properties - - 0.9 - - - - 0.9
Total comprehensive income - - 2.4 - 25.6 - 39.7 67.7
Share-based payments - - - - - - 0.2 0.2
Sale of own shares - - - - - 0.5 (0.4) 0.1
Disposal of properties - - (2.9) - - - 2.9 -
Tax on disposal of properties - - 0.6 - - - (0.6) -
Transfer to retained earnings - - (0.5) - - - 0.5 -
Dividends paid - - - - - - (27.0) (27.0)
Total transactions with owners - - (2.8) - - 0.5 (24.4) (26.7)
At 1 April 2017 44.4 334.0 622.7 6.8 (140.1) (113.2) 38.5 793.1
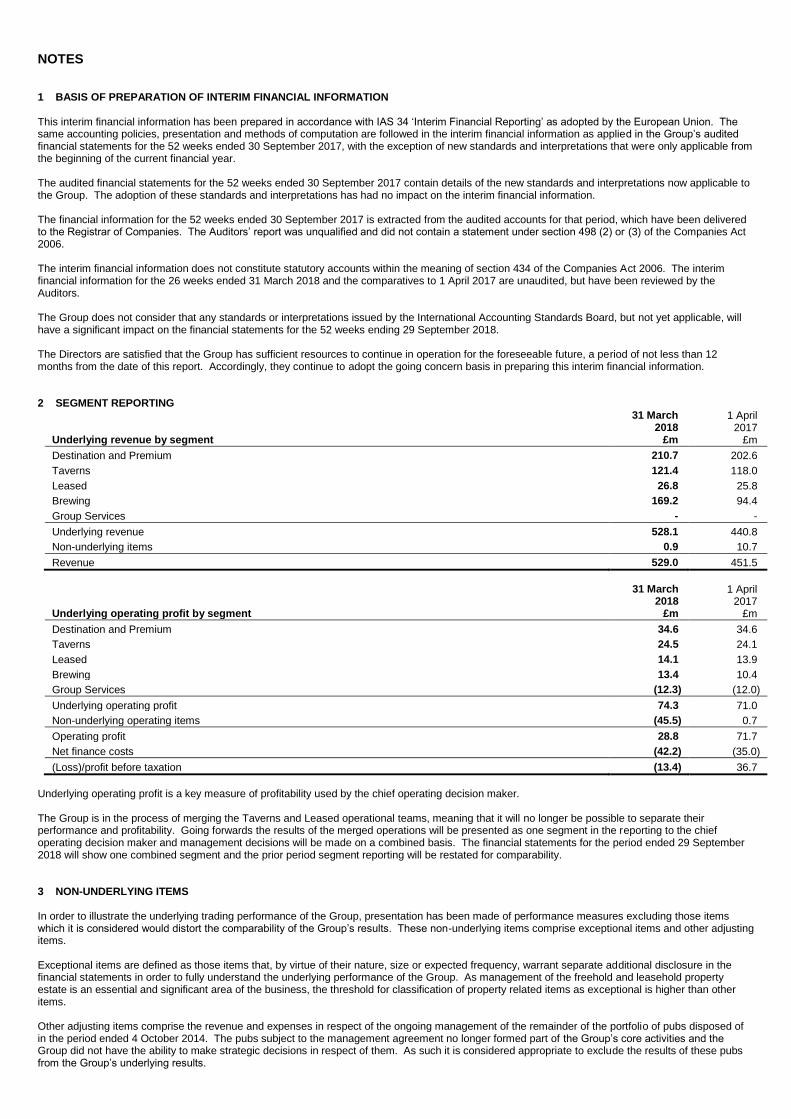
NOTES 1 BASIS OF PREPARATION OF INTERIM FINANCIAL INFORMATION This interim financial information has been prepared in accordance with IAS 34 ‘Interim Financial Reporting’ as adopted by the European Union. The same accounting policies, presentation and methods of computation are followed in the interim financial information as applied in the Group’s audited financial statements for the 52 weeks ended 30 September 2017, with the exception of new standards and interpretations that were only applicable from the beginning of the current financial year. The audited financial statements for the 52 weeks ended 30 September 2017 contain details of the new standards and interpretations now applicable to the Group. The adoption of these standards and interpretations has had no impact on the interim financial information. The financial information for the 52 weeks ended 30 September 2017 is extracted from the audited accounts for that period, which have been delivered to the Registrar of Companies. The Auditors’ report was unqualified and did not contain a statement under section 498 (2) or (3) of the Companies Act 2006. The interim financial information does not constitute statutory accounts within the meaning of section 434 of the Companies Act 2006. The interim financial information for the 26 weeks ended 31 March 2018 and the comparatives to 1 April 2017 are unaudited, but have been reviewed by the Auditors. The Group does not consider that any standards or interpretations issued by the International Accounting Standards Board, but not yet applicable, will have a significant impact on the financial statements for the 52 weeks ending 29 September 2018. The Directors are satisfied that the Group has sufficient resources to continue in operation for the foreseeable future, a period of not less than 12 months from the date of this report. Accordingly, they continue to adopt the going concern basis in preparing this interim financial information. 2 SEGMENT REPORTING
31 March
2018 1 April 2017
Underlying revenue by segment £m £m
Destination and Premium 210.7 202.6
Taverns 121.4 118.0
Leased 26.8 25.8
Brewing 169.2 94.4
Group Services - -
Underlying revenue 528.1 440.8
Non-underlying items 0.9 10.7
Revenue 529.0 451.5
31 March
2018 1 April 2017
Underlying operating profit by segment £m £m
Destination and Premium 34.6 34.6
Taverns 24.5 24.1
Leased 14.1 13.9
Brewing 13.4 10.4
Group Services (12.3) (12.0)
Underlying operating profit 74.3 71.0
Non-underlying operating items (45.5) 0.7
Operating profit 28.8 71.7
Net finance costs (42.2) (35.0)
(Loss)/profit before taxation (13.4) 36.7
Underlying operating profit is a key measure of profitability used by the chief operating decision maker. The Group is in the process of merging the Taverns and Leased operational teams, meaning that it will no longer be possible to separate their performance and profitability. Going forwards the results of the merged operations will be presented as one segment in the reporting to the chief operating decision maker and management decisions will be made on a combined basis. The financial statements for the period ended 29 September 2018 will show one combined segment and the prior period segment reporting will be restated for comparability. 3 NON-UNDERLYING ITEMS In order to illustrate the underlying trading performance of the Group, presentation has been made of performance measures excluding those items which it is considered would distort the comparability of the Group’s results. These non-underlying items comprise exceptional items and other adjusting items. Exceptional items are defined as those items that, by virtue of their nature, size or expected frequency, warrant separate additional disclosure in the financial statements in order to fully understand the underlying performance of the Group. As management of the freehold and leasehold property estate is an essential and significant area of the business, the threshold for classification of property related items as exceptional is higher than other items. Other adjusting items comprise the revenue and expenses in respect of the ongoing management of the remainder of the portfolio of pubs disposed of in the period ended 4 October 2014. The pubs subject to the management agreement no longer formed part of the Group’s core activities and the Group did not have the ability to make strategic decisions in respect of them. As such it is considered appropriate to exclude the results of these pubs from the Group’s underlying results.

NOTES 3 NON-UNDERLYING ITEMS (CONTINUED)
31 March
2018 1 April 2017
£m £m
Exceptional operating items
Impact of change in rate assumptions used for onerous lease provisions 0.7 (0.9)
Reorganisation and integration costs 3.6 -
Impairment of freehold and leasehold properties 39.8 -
44.1 (0.9)
Other adjusting operating items
Results in respect of the ongoing management of pubs in the portfolio disposal 1.4 0.2
1.4 0.2
Non-underlying operating items 45.5 (0.7)
Exceptional non-operating items
Net interest on net defined benefit asset/liability 0.1 0.3
Write-off of unamortised finance costs - 1.4
Movement in fair value of interest rate swaps 4.1 (4.0)
4.2 (2.3)
Total non-underlying items 49.7 (3.0)
Impact of change in rate assumptions used for onerous lease provisions The update of the discount rate assumptions used in the calculation of the Group’s onerous property lease provisions at the current period end resulted in an increase of £0.7 million (2017: decrease of £0.9 million) in the total provision. Reorganisation and integration costs During the current period the Group incurred reorganisation and integration costs of £3.5 million (2017: £nil) as a result of the acquisition of the beer business of Charles Wells in the period ended 30 September 2017. A head office restructuring exercise also continued in the current period incurring costs of £0.1 million (2017: £nil). Impairment of freehold and leasehold properties At 28 January 2018 the Group’s freehold and leasehold properties were revalued by independent chartered surveyors on an open market value basis. The resulting revaluation adjustments have been recognised in the revaluation reserve or income statement as appropriate. The amount recognised in the income statement comprises:
31 March 2018
£m
Impairment of other intangible assets 0.1
Reversal of impairment of other intangible assets (0.3)
Impairment of property, plant and equipment 70.6
Reversal of impairment of property, plant and equipment (31.4) Impairment of assets held for sale 0.4 Valuation fees 0.4
39.8
Portfolio disposal of pubs During the period ended 4 October 2014 the Group disposed of a portfolio of 202 pubs and subsequently entered into a four year lease and five year management agreement in respect thereof. During the prior period the Group entered into new 15 year leases in respect of 22 of the properties and these were removed from the management agreement. All of the other pubs were removed from the arrangements by the purchaser before the end of the four year lease term in December 2017. The Group no longer had strategic control of the pubs whilst they were subject to the management agreement and they did not form part of its core activities. As such the results in respect of the ongoing operation and management of these pubs have been classified as a non-underlying item, comprised as follows:
31 March
2018 1 April 2017
£m £m
Revenue 0.9 10.7
Operating expenses (2.3) (10.9)
(1.4) (0.2)
Net interest on net defined benefit asset/liability The net interest on the net defined benefit asset/liability in respect of the Group’s defined benefit pension plan was a charge of £0.1 million (2017: £0.3 million). Movement in fair value of interest rate swaps The Group’s interest rate swaps are revalued to fair value at each balance sheet date. The movement in fair value of interest rate swaps which are not designated as part of a hedging relationship, and the ineffective portion of the movement in fair value of interest rate swaps which are accounted for as hedging instruments, are both recognised in the income statement. The net loss of £4.1 million (2017: gain of £4.0 million) is shown as an exceptional item. In addition to this, a gain of £2.2 million (2017: £30.9 million) has been recognised in the hedging reserve, in relation to the effective portion of the movement in fair value of interest rate swaps which are accounted for as hedging instruments.

NOTES 3 NON-UNDERLYING ITEMS (CONTINUED) Impact of taxation The current tax credit relating to the above non-underlying items amounts to £1.0 million (2017: £0.1 million). The deferred tax credit relating to the above non-underlying items amounts to £5.7 million (2017: charge of £0.6 million). Prior period non-underlying items During the prior period the Group entered into a new bank facility. As such the unamortised finance costs relating to the previous facility were written off. 4 FINANCE COSTS AND INCOME
31 March
2018 1 April 2017
£m £m
Finance costs
Unsecured bank borrowings 5.6 5.9
Securitised debt 22.9 23.3
Finance leases 0.7 0.5
Other lease related borrowings 8.2 7.1
Other interest payable and similar charges 0.8 0.8
38.2 37.6
Exceptional finance costs
Net interest on net defined benefit asset/liability 0.1 0.3
Write-off of unamortised finance costs - 1.4
0.1 1.7
Total finance costs 38.3 39.3
Finance income
Deposit and other interest receivable (0.2) (0.3)
Total finance income (0.2) (0.3)
Movement in fair value of interest rate swaps
Gain on movement in fair value of interest rate swaps - (5.7)
Loss on movement in fair value of interest rate swaps 4.1 1.7
4.1 (4.0)
Net finance costs 42.2 35.0
5 TAXATION The underlying taxation charge for the 26 weeks ended 31 March 2018 has been calculated by applying an estimate of the underlying effective tax rate for the 52 weeks ending 29 September 2018 of approximately 16.8% (26 weeks ended 1 April 2017: approximately 18.1%).
31 March
2018 1 April 2017
£m £m
Current tax 2.6 4.4
Deferred tax (3.2) 2.2
(0.6) 6.6
The taxation (credit)/charge includes a current tax credit of £1.0 million (2017: £0.1 million) and a deferred tax credit of £5.7 million (2017: charge of £0.6 million) relating to the tax on non-underlying items. 6 EARNINGS PER ORDINARY SHARE Basic earnings per share are calculated by dividing the profit/(loss) attributable to equity shareholders by the weighted average number of ordinary shares in issue during the period, excluding treasury shares and those held on trust for employee share schemes. For diluted earnings per share, the weighted average number of ordinary shares in issue is adjusted to assume conversion of all dilutive potential ordinary shares. These represent share options granted to employees where the exercise price is less than the weighted average market price of the Company’s shares during the period. Underlying earnings per share figures are presented to exclude the effect of exceptional and other adjusting items. The Directors consider that the supplementary figures are a useful indicator of performance.

NOTES 6 EARNINGS PER ORDINARY SHARE (CONTINUED)
31 March 2018 1 April 2017
Earnings Per share
amount Earnings Per share
amount £m p £m p
Basic (loss)/earnings per share (12.8) (2.0) 30.1 5.2
Diluted (loss)/earnings per share* (12.8) (2.0) 30.1 5.2
Underlying earnings per share figures
Basic underlying earnings per share 30.2 4.8 27.6 4.8
Diluted underlying earnings per share 30.2 4.7 27.6 4.7
*The 2018 diluted loss per share is the same as the basic loss per share as the inclusion of the dilutive potential ordinary shares would reduce the loss per share and as such is not dilutive in accordance with IAS 33 ‘Earnings per Share’.
31 March
2018 1 April 2017
m m
Basic weighted average number of shares 633.4 575.4
Dilutive options 7.6 5.8
Diluted weighted average number of shares 641.0 581.2
7 PROPERTY, PLANT AND EQUIPMENT
£m
Net book amount at 1 October 2017 2,360.7
Additions 85.9
Net transfers to assets held for sale and disposals (28.5)
Depreciation, revaluation and other movements (50.7)
Net book amount at 31 March 2018 2,367.4
£m
Net book amount at 2 October 2016 2,199.4
Additions 86.7
Net transfers to assets held for sale and disposals (24.5)
Depreciation, revaluation and other movements (21.5)
Net book amount at 1 April 2017 2,240.1
The net profit on disposal of property, plant and equipment, intangible assets and assets held for sale was £5.0 million (2017: £7.8 million). A profit on disposal of £5.5 million (2017: £7.8 million) has been included within the Group’s underlying results. Revaluation/impairment At 28 January 2018 independent chartered surveyors revalued the Group’s freehold and leasehold properties on an open market value basis. These valuations have been incorporated into the financial statements and the resulting revaluation adjustments have been taken to the revaluation reserve or income statement as appropriate. During the current and prior period various properties were reviewed for impairment and/or material changes in value. The impact of the revaluations/impairments described above is as follows:
31 March
2018 1 April 2017
£m £m
Income statement:
Impairment (70.6) (4.0)
Reversal of past impairment 31.4 -
(39.2) (4.0)
Revaluation reserve:
Unrealised revaluation surplus 170.3 2.3
Reversal of past revaluation surplus (161.7) (0.8)
8.6 1.5
Net decrease in shareholders’ equity/property, plant and equipment (30.6) (2.5)
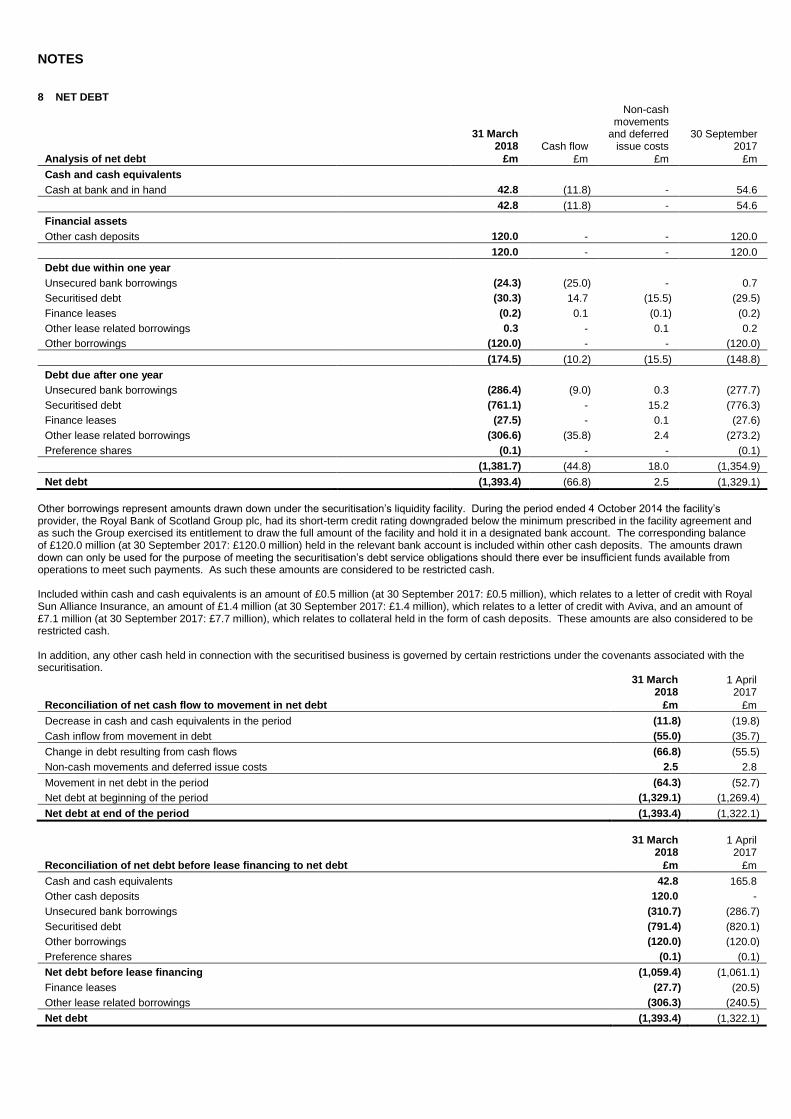
NOTES 8 NET DEBT
31 March 2018 Cash flow
Non-cash movements
and deferred issue costs
30 September 2017
Analysis of net debt £m £m £m £m
Cash and cash equivalents
Cash at bank and in hand 42.8 (11.8) - 54.6
42.8 (11.8) - 54.6
Financial assets
Other cash deposits 120.0 - - 120.0
120.0 - - 120.0
Debt due within one year
Unsecured bank borrowings (24.3) (25.0) - 0.7
Securitised debt (30.3) 14.7 (15.5) (29.5)
Finance leases (0.2) 0.1 (0.1) (0.2)
Other lease related borrowings 0.3 - 0.1 0.2
Other borrowings (120.0) - - (120.0)
(174.5) (10.2) (15.5) (148.8)
Debt due after one year
Unsecured bank borrowings (286.4) (9.0) 0.3 (277.7)
Securitised debt (761.1) - 15.2 (776.3)
Finance leases (27.5) - 0.1 (27.6)
Other lease related borrowings (306.6) (35.8) 2.4 (273.2)
Preference shares (0.1) - - (0.1)
(1,381.7) (44.8) 18.0 (1,354.9)
Net debt (1,393.4) (66.8) 2.5 (1,329.1)
Other borrowings represent amounts drawn down under the securitisation’s liquidity facility. During the period ended 4 October 2014 the facility’s provider, the Royal Bank of Scotland Group plc, had its short-term credit rating downgraded below the minimum prescribed in the facility agreement and as such the Group exercised its entitlement to draw the full amount of the facility and hold it in a designated bank account. The corresponding balance of £120.0 million (at 30 September 2017: £120.0 million) held in the relevant bank account is included within other cash deposits. The amounts drawn down can only be used for the purpose of meeting the securitisation’s debt service obligations should there ever be insufficient funds available from operations to meet such payments. As such these amounts are considered to be restricted cash. Included within cash and cash equivalents is an amount of £0.5 million (at 30 September 2017: £0.5 million), which relates to a letter of credit with Royal Sun Alliance Insurance, an amount of £1.4 million (at 30 September 2017: £1.4 million), which relates to a letter of credit with Aviva, and an amount of £7.1 million (at 30 September 2017: £7.7 million), which relates to collateral held in the form of cash deposits. These amounts are also considered to be restricted cash. In addition, any other cash held in connection with the securitised business is governed by certain restrictions under the covenants associated with the securitisation.
31 March
2018 1 April 2017
Reconciliation of net cash flow to movement in net debt £m £m
Decrease in cash and cash equivalents in the period (11.8) (19.8)
Cash inflow from movement in debt (55.0) (35.7)
Change in debt resulting from cash flows (66.8) (55.5)
Non-cash movements and deferred issue costs 2.5 2.8
Movement in net debt in the period (64.3) (52.7)
Net debt at beginning of the period (1,329.1) (1,269.4)
Net debt at end of the period (1,393.4) (1,322.1)
31 March
2018 1 April 2017
Reconciliation of net debt before lease financing to net debt £m £m
Cash and cash equivalents 42.8 165.8
Other cash deposits 120.0 -
Unsecured bank borrowings (310.7) (286.7)
Securitised debt (791.4) (820.1)
Other borrowings (120.0) (120.0)
Preference shares (0.1) (0.1)
Net debt before lease financing (1,059.4) (1,061.1)
Finance leases (27.7) (20.5)
Other lease related borrowings (306.3) (240.5)
Net debt (1,393.4) (1,322.1)
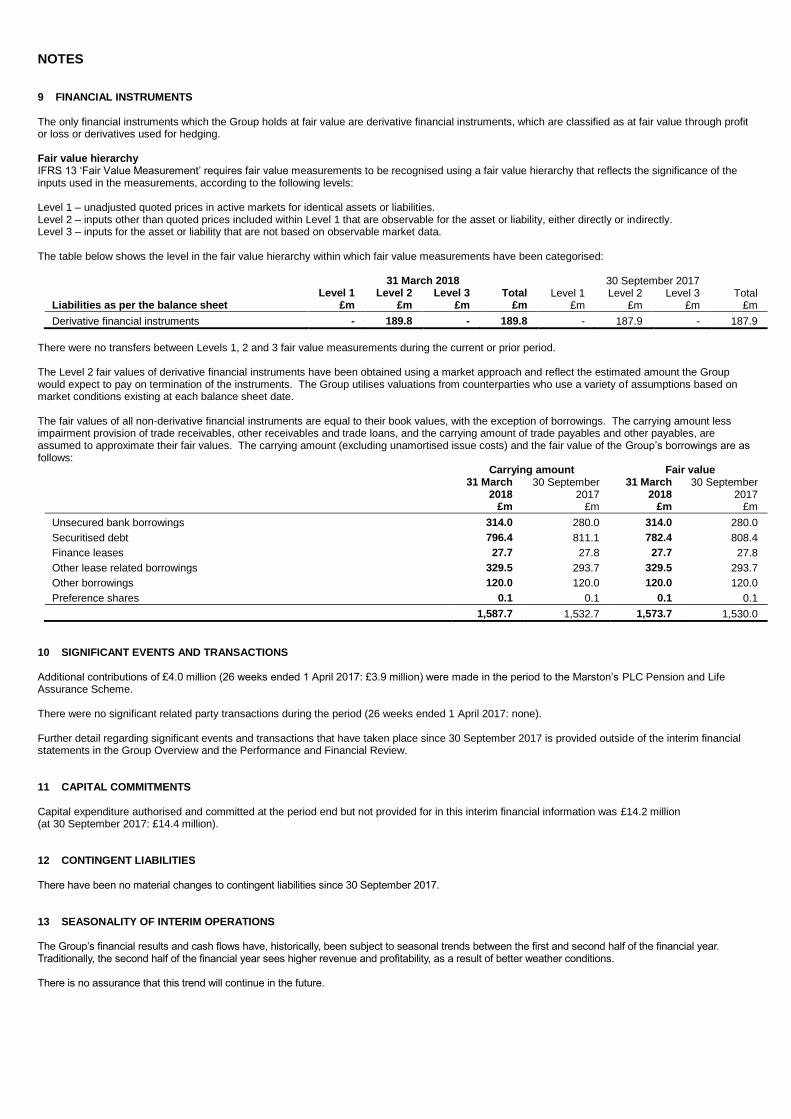
NOTES 9 FINANCIAL INSTRUMENTS The only financial instruments which the Group holds at fair value are derivative financial instruments, which are classified as at fair value through profit or loss or derivatives used for hedging. Fair value hierarchy IFRS 13 ‘Fair Value Measurement’ requires fair value measurements to be recognised using a fair value hierarchy that reflects the significance of the inputs used in the measurements, according to the following levels: Level 1 – unadjusted quoted prices in active markets for identical assets or liabilities. Level 2 – inputs other than quoted prices included within Level 1 that are observable for the asset or liability, either directly or indirectly. Level 3 – inputs for the asset or liability that are not based on observable market data. The table below shows the level in the fair value hierarchy within which fair value measurements have been categorised:
31 March 2018 30 September 2017 Level 1 Level 2 Level 3 Total Level 1 Level 2 Level 3 Total Liabilities as per the balance sheet £m £m £m £m £m £m £m £m
Derivative financial instruments - 189.8 - 189.8 - 187.9 - 187.9
There were no transfers between Levels 1, 2 and 3 fair value measurements during the current or prior period. The Level 2 fair values of derivative financial instruments have been obtained using a market approach and reflect the estimated amount the Group would expect to pay on termination of the instruments. The Group utilises valuations from counterparties who use a variety of assumptions based on market conditions existing at each balance sheet date. The fair values of all non-derivative financial instruments are equal to their book values, with the exception of borrowings. The carrying amount less impairment provision of trade receivables, other receivables and trade loans, and the carrying amount of trade payables and other payables, are assumed to approximate their fair values. The carrying amount (excluding unamortised issue costs) and the fair value of the Group’s borrowings are as follows:
Carrying amount Fair value 31 March
2018 30 September
2017 31 March
2018 30 September
2017 £m £m £m £m
Unsecured bank borrowings 314.0 280.0 314.0 280.0
Securitised debt 796.4 811.1 782.4 808.4
Finance leases 27.7 27.8 27.7 27.8
Other lease related borrowings 329.5 293.7 329.5 293.7
Other borrowings 120.0 120.0 120.0 120.0
Preference shares 0.1 0.1 0.1 0.1
1,587.7 1,532.7 1,573.7 1,530.0
10 SIGNIFICANT EVENTS AND TRANSACTIONS Additional contributions of £4.0 million (26 weeks ended 1 April 2017: £3.9 million) were made in the period to the Marston’s PLC Pension and Life Assurance Scheme. There were no significant related party transactions during the period (26 weeks ended 1 April 2017: none). Further detail regarding significant events and transactions that have taken place since 30 September 2017 is provided outside of the interim financial statements in the Group Overview and the Performance and Financial Review. 11 CAPITAL COMMITMENTS Capital expenditure authorised and committed at the period end but not provided for in this interim financial information was £14.2 million (at 30 September 2017: £14.4 million). 12 CONTINGENT LIABILITIES There have been no material changes to contingent liabilities since 30 September 2017. 13 SEASONALITY OF INTERIM OPERATIONS The Group’s financial results and cash flows have, historically, been subject to seasonal trends between the first and second half of the financial year. Traditionally, the second half of the financial year sees higher revenue and profitability, as a result of better weather conditions. There is no assurance that this trend will continue in the future.

NOTES 14 EVENTS AFTER THE BALANCE SHEET DATE An interim dividend of £17.1 million, being 2.7p (2017: 2.7p) per ordinary share, has been proposed and will be paid on 3 July 2018 to those shareholders on the register at the close of business on 25 May 2018. This interim financial information does not reflect this dividend payable. 15 PRINCIPAL RISKS AND UNCERTAINTIES The Group set out on pages 25 to 27 of its 2017 Annual Report and Accounts the principal risks and uncertainties that could impact its performance. These remain unchanged since the Annual Report and Accounts was published and are expected to remain unchanged for the second half of the financial year. These risks and uncertainties are summarised as follows:
The Group’s pubs, brands or services fail to attract customers, do not reflect changing customer preferences or offer poor service or quality Prices become uncompetitive Disruption to key suppliers, particularly those involved with day-to-day activities (logistics, food, drink), or shortage of commodities Changes in regulation impacting upon the cost of business or obstructing growth Breaches of health and safety or food hygiene regulations Network outage or denial of service Loss, theft or corruption of data Failure to attract or retain the best people Breach of covenants with lenders Inadequate funding of the pension scheme Incorrect reporting of financial results Unauthorised transactions
16 INTERIM RESULTS The interim results were approved by the Board on 16 May 2018. 17 COPIES Copies of these results are available on the Marston’s PLC website (www.marstons.co.uk) and on request from the Group Secretary, Marston’s PLC, Marston’s House, Brewery Road, Wolverhampton, WV1 4JT.