marketing channels compete for u.s. stocker cattle
TRANSCRIPT
Journal of Agribusiness 21,2(Fall 2003):131S148© 2003 Agricultural Economics Association of Georgia
Marketing Channels Compete forU.S. Stocker Cattle
Troy G. Schmitz, Charles B. Moss, and Andrew Schmitz
This study investigates the underlying reasons for a producer’s choice of marketingchannels for stocker cattle in the United States. In addition to traditional publicauctions, private sales, video auctions, and Internet auctions have been recentlyused in the marketing of stocker cattle. Findings show that while the number ofmarketing options may have increased in recent years, only relatively large pro-ducers can actually take advantage of these options. The marketing options forsmaller producers are still limited due to their relative size. Also, the number ofcattle marketed privately and through video and Internet auctions is found to bepositively correlated with herd size. In addition, the New Institutional Economics(NIE) provides insights into how herd size influences the choice of marketingchannels.
Key Words: internet sales, livestock, marketing channels, New InstitutionalEconomics, transaction costs
The number of marketing outlets available through which farmers can market stockercattle has increased in recent years. As Schmitz, Schmitz, and Moss (2002) point outin their study of the marketing of stocker cattle in Florida, there are now at least fouroutlets available: public auctions, private sales, video auctions, and Internet auctions(Internet sales). In this analysis, we focus on the marketing of stocker cattle in theUnited States. While the number of marketing options has increased, the marketingchoices available for smaller producers are still limited due to their relative size.There are economies of scale in marketing stocker cattle.
The marketing channels for stocker cattle in the top 15 U.S. cow-calf producingstates are briefly described below. Based on personal interviews with cattle marketingexperts, there are four major outlets through which stocker cattle are marketed:
Troy G. Schmitz is assistant professor, the Morrison School of Agribusiness, Arizona State University; Charles B.Moss is professor and Andrew Schmitz is professor and the Ben-Hill Griffin Eminent Scholar, both in the Departmentof Food and Resource Economics, the University of Florida. This is Florida Agricultural Experiment Station JournalSeries No. R-09835.
The authors thank Jill Hobbs for comments on an earlier version of this paper, and the excellent comments fromtwo anonymous referees are gratefully acknowledged. Also, we thank Professor Bruce Babcock at CARD for financialsupport on a related project on marketing stocker cattle in Florida. The comments from the various attendees at theCARD E-Commerce Symposium in San Diego, California, February 10, 2002, are also greatly appreciated. Finally,we thank the more than 50 experts from the top 15 U.S. cow-calf producing states who talked to us via telephone onthe significance of the various marketing channels for U.S. stocker cattle.

132 Fall 2003 Journal of Agribusiness
1 Public sales also include individual producers’ calf sales, whereby their entire calf crops are marketed throughpublic auctions. However, these sales represent a small percentage of total public auction sales. Often, the volume ofsales is sufficient to market outside a public auction channel through private and other mechanisms. Moreover, publicauctions do not necessarily imply herd sizes of less than 100 head.
2 Many private sales are not direct from producer to buyer. Often, order buyers perform the function of an inter-mediary, bringing the buyer and seller together.
3 Telephone interviews were conducted in early 2002. The experts were given four marketing outlets and askedthe percentage of stockers marketed through each. The average of the two estimates (one from the state’s Cattlemen’sAssociation or state’s Stock Growers Association, and one from a state academic institution, including cooperativeextension) for each state was used in this analysis. Some of the individuals interviewed wished to remain anonymous.Those who did not are acknowledged here: (a) J. Brinkmeyer, Iowa Cattlemen’s Association, and Daryl Strohbehn,Extension Beef Specialist, Iowa State University; (b) Tonya Ness, South Dakota Cattlemen’s Association, and ScottBosse, University of South Dakota; (c) Jim Magana, Wyoming Stock Growers Association, and Dale Menkaus, Uni-versity of Wyoming; (d) Chris Buechle, Missouri Cattlemen’s Association, and Vern Pierce, University of Missouri;and (e) Steve McKinley, Oklahoma Cattlemen’s Association, and Clem Ward, Oklahoma State University. This listingdoes not imply that these individuals are the only experts in the respective states having expertise in the marketing ofstocker cattle.
traditional public auctions, private sales, video auctions, and Internet auctions.However, in aggregate, over 50% of stocker cattle continue to be marketed throughtraditional public auctions. A theoretical model is then developed to explain a pro-ducer’s choice of various marketing channels using transaction costs analysis, alongthe lines of the New Institutional Economics (NIE) (Williamson, 1975, 1979, 1985,1998). Our statistical analysis supports the hypothesis that public auctions are lesspopular in states with cowherd sizes equal to or greater than 500 head, which is con-sistent with the NIE transaction costs framework.
What is somewhat surprising is that Internet sales are not used extensively inmarketing stocker cattle. In many states, the percentage of stocker cattle marketedthrough Internet sales is less than 5%. We provide reasons why this is the case with-in the NIE framework.
Stocker Marketing Channels by State
The breakdown of stocker cattle marketed through local/public livestock auctions,1video auctions, Internet auctions, and private sales2 in the United States for the top15 beef cow producing states is detailed in table 1. The largest beef cow producingstate is Texas, with over five million head, followed by Missouri and Oklahoma. Ofthe top 15 cow-calf producing states, Wyoming is ranked 15th with a total of 825,000head. The top 15 states produce roughly 72% of all beef cattle in the United States.
To obtain a breakdown of the marketing mechanisms used for stocker cattle in theUnited States, we interviewed at least two livestock marketing experts in each of thetop 15 beef cow producing states—one from the state Cattlemen’s Association or onefrom the state’s Stock Growers Association, and one from a state academic institu-tion, including cooperative extension.
Each expert was asked to estimate the share of stocker cattle marketed in each stateusing each marketing channel (local livestock auctions, private sales, video auctions,and the Internet). Public auctions are the most common marketing outlet, followedby private sales, video sales, and finally Internet sales (table 1).3 When weighted by

Schmitz, Moss, and Schmitz Marketing Channels Compete for U.S. Stocker Cattle 133
4 In personal conversation with John Van Dyke (USDA/Agricultural Marketing Service), he estimates that for theentire United States, roughly 50% to 55% of stocker cattle are marketed through public auctions, 30% through privatesales (direct sales), 15% through video auctions, and less than 5% by Internet sales. These rankings, by marketingchannel, are consistent with our rankings, even though the actual percentages differ slightly—in part because wefocused only on 15 states, whereas Van Dyke’s assessment included the entire nation. (Note: Our analysis is for stockercattle actually sold, not for all calves, since we have no provision for retained ownership.)
Table 1. Marketing Mechanism and Herd Size for Stocker Cattle by StateMarketing Mechanism
Top 15 Cow-CalfProducing States
Herd Size a
(000 head)
LocalAuctions
(%)
VideoAuctions
(%)
InternetSales(%)
PrivateSales(%)
1 Texas 5,465 61.00 16.50 9.00 13.502 Missouri 2,070 72.50 4.00 4.00 19.503 Oklahoma 1,950 60.00 9.00 3.50 27.504 Nebraska 1,910 60.00 5.00 4.50 30.505 South Dakota 1,809 72.50 5.00 2.50 20.006 Montana 1,531 12.50 15.00 5.00 67.507 Kansas b 1,524 55.00 15.00 10.00 20.008 Kentucky 1,060 88.00 1.50 3.00 7.509 Tennessee 1,035 77.50 11.50 0.00 11.00
10 North Dakota 1,002 72.50 8.80 3.80 15.0011 Iowa 985 72.00 2.00 1.50 24.5012 Florida c 975 55.30 19.80 7.30 17.7013 Arkansas 929 82.50 4.00 1.00 12.5014 Colorado 840 47.50 24.50 3.00 25.0015 Wyoming 825 30.00 30.00 5.00 35.00
Weighted by No. of Beef Operations: Average (Std. Deviation)
65.80(25.769)
10.50(12.319)
5.00 (6.160)
18.70(18.987)
Weighted by No. of Calves Marketed: Average (Std. Deviation)
60.80(6.907)
11.40(2.834)
5.10 (1.162)
22.70(5.553)
Source: Authors’ interviews, with marketing mechanism percentages based on averages of experts’ opinions.a Herd size as of January 2001 (taken from “Livestock, Dairy, and Poultry Summary,” Florida Agricultural Statistics).b The Kansas Livestock Association did not respond.c Results taken from a more detailed survey conducted in Florida (Schmitz, Schmitz, and Moss, 2002).
the number of cow-calf operations, roughly 66% of the stocker cattle are marketedthrough local public auctions, 19% are sold privately, 11% are sold through videoauctions, and 5% are marketed through Internet sales. When weighted by the numberof calves marketed, the respective percentages are 61%, 23%, 11%, and 5%.4 How-ever, there are significant differences among states with respect to the use of market-ing channels. For example, in Montana, 67.5% of the stockers are marketed privately,while in South Dakota, 72.5% are marketed through public auctions.

134 Fall 2003 Journal of Agribusiness
5 One reviewer raised the point concerning the extent to which video and Internet sales compete with public auctionsor with private sales or both. The reviewer suggested private sales are more at risk for a loss of market share as a resultof electronic marketing. While this is an interesting area of inquiry, we do not explore this issue.
Supply and Demand of Marketing Services for Stocker Cattle
Marketing mechanisms and their selection by producers are modeled below. Figure1 presents the demand for and supply of marketing services in the stocker cattlemarket before the emergence of video and Internet auctions (for simplicity, we ex-clude private sales).5 Figure 1(a) depicts the demand for marketing services by largeproducers, at local livestock auctions, and figure 1(b) presents the demand curveD A
L ,for small producers, Horizontally adding the demand curve for large and smallD A
S .producers yields the total demand curve for marketing services of stocker cattlefacing the local livestock auction houses, shown in figure 1(c). The intersectionD A
T ,of the supply curve for marketing services by local livestock auctions (SA) with thetotal demand curve for these services gives an equilibrium price of pA (the per unitprice of marketing services). At this price, large producers sell cattle throughq A
L ,local livestock facilities, and at small producers sell cattle through local livestockq A
S ,facilities.
Figure 2 presents the stocker cattle market after the introduction of video andInternet auctions. Figure 2(a) depicts the demand from large producers for cattlemarketing services through video and Internet auctions, The location and slopeD V
L .of this demand curve is dependent on transaction costs, which include transportationcosts. To examine the implications of the location and slope of the demand curve formarketing services, consider the demand curve for marketing services for cattle soldthrough video and Internet auctions for small producers, depicted in figure 2(b).D V
S ,The demand curve for services through video and Internet auctions is much lowerfor small producers because, for these producers, cattle marketed through video andInternet auctions entail significant costs over public auctions. Specifically, smallerlots would be offered a lower price due to the diseconomies associated with shippingless than truckload lots if these auction houses allowed small lots to be listed at all.
Alternatively, joining with other producers to offer truckload lots could be costly.In most cases, the total supply of marketing services offered through video andInternet auctions [SV in figure 2(c)] and the demand for such services through thoseauctions in figure 2(c)] will generate a price above the choke point (the point[D V
Tat which demand becomes zero) for the participation of smaller producers in theseauctions. Thus, only larger producers will market cattle through video and Internetauctions, offering quantity at price pV, where pV is the price for marketing servicesq V
Loffered by video and Internet auctions.
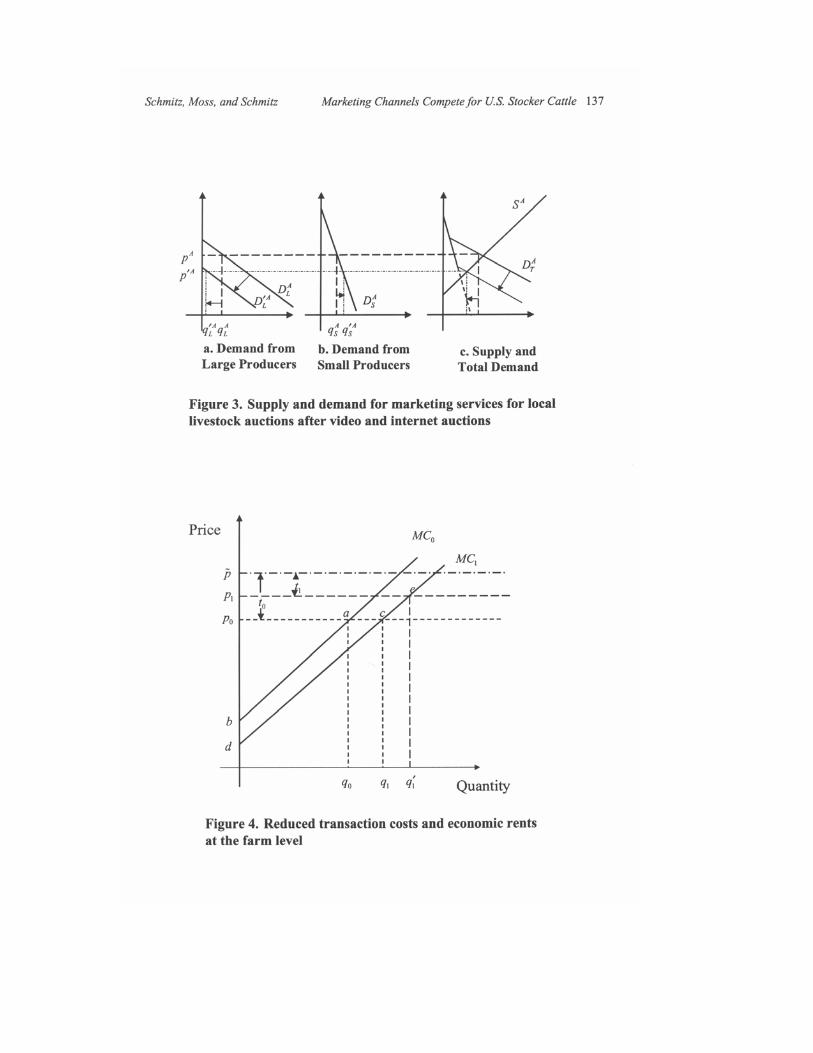
The introduction of video and Internet auctions reduces the demand for cattle mar-keted through live auctions. As shown in figure 3(a), the use of video and Internetauctions causes the demand for marketing services through local livestock auctionsto shift inward from for large producers, shifting the total demand forD A
L to DNAL


136 Fall 2003 Journal of Agribusiness
marketing services in figure 3(c) from Given that the supply curve forD AT to DNAT .
marketing services is held constant at S A, the corresponding price falls from pA topNA. Larger producers still market cattle through local livestock auctions (thequantity of stocker and feeder cattle sold by large producers through local livestockauctions falls from but these cattle represent “odd lots” cattle that do notq A
L to qNAL ),fit the truckload lots for whatever reason. Further, the reduction in commissionscauses the quantity of cattle marketed by smaller producers through local auctionfacilities to increase from However, this increase may be short-lived asq A
S to qNAS .auction facilities continue to close.
In the preceding analysis, the supply of services was modeled as upward sloping.Given this assumption, the transaction costs of selling cattle through public auctionsfall as more and more producers sell through other marketing channels. Whether ornot this is actually the case is an empirical question and is not dealt with here.Clearly, we could adapt the model to employ perfectly elastic or perfectly inelasticsupply curves in order to adjust for different margins related to different types ofauctions. Some may argue that the supply curve for marketing services is perfectlyelastic (at least in the long run). If the supply of marketing services were perfectlyelastic, there would be no long-run change in the quantity of marketing servicesdemanded by small producers At the same time, a perfectly elastic supply(qNAS ' q A
S ).of marketing services means the price of marketing services in the local livestockauctions will not fall. Hence, the larger producers will market even fewer cattlethrough public auctions (as they shift to video or Internet auctions or private salesbecause of reduced transaction costs).
We now introduce the effect of scale economies that can reduce transaction costs.Figure 4 presents the marginal cost of production for two groups of producers. MC0is the marginal cost of production for smaller producers (producers with smallcowherds), while MC1 is the marginal cost of production for larger producers. Weassume that larger producers obtain economies of scale in production, and thereforetheir marginal cost curve lies to the right of the marginal cost curve of the smallerproducers (assuming a U-shaped, long-run cost curve). Next, it is assumed that p isthe value of stocker cattle sold to backgrounders and/or feedlots.
Smaller producers incur a transaction cost of t0 for sales through local auctionhouses. The final price realized by these smaller producers is p0 ' p – t0. Per unittransaction costs for larger producers are lower than per unit transaction costs forsmall producers (Bailey, Peterson, and Brorsen, 1991). Larger producers incur alower transaction cost (t1), and receive a higher final realized price ( p1) for theircattle because they can take advantage of lower transaction costs offered by marketswhich are non-public in nature.
This scenario implies two distinct advantages to size. The first advantage is thetypical increased returns to scale. If the prices were, in fact, the same for smaller andlarger producers, the economic rent to larger producers (p0cd in figure 4) is greaterthan the economic rent for smaller producers ( p0ab). The second advantage is adecrease in transaction costs. When larger producers market a portion of their cattlethrough alternative market outlets with lower transaction costs, the rents to larger
138 Fall 2003 Journal of Agribusiness
6 As pointed out by a reviewer, the cause for price differences found by McPherson and others may not be attrib-uted to the small supply effects on cost, but rather to the smaller supply effects on prices paid, which is dependent onthe number of buyers and sellers. In this context, prices paid are more important for many producers than are directmarketing costs.
producers increase to p1ed. Hence, the increased rents due to reduced transactioncosts become p1ecp0.
In addition to the direct transaction costs, the alternative marketing mechanismsfor stocker cattle have associated indirect transaction costs such as quality differen-tiation and reputation effects (taking advantage of positive reputation effects is notconfined to private sales). The theoretical analysis above can easily be adapted to in-clude these indirect transaction costs. Our discussion of direct transaction costs sug-gests larger farmers have a significant advantage in marketing stocker cattle becausethey can access several markets, including video and Internet auctions with lowerdirect transaction costs. Smaller producers generally can only access public auctions.
When one adds indirect transaction costs, there also may be savings for large pro-ducers who can market outside of public auctions. In this case, the transaction costssavings t0 in figure 4 contains two positive components. On the other hand, there isa possibility that the savings in direct transaction costs by going outside of publicauctions is opposite in sign to the savings in indirect transaction costs. This possi-bility can be incorporated into figure 4 by viewing t0 as the net savings in transactioncosts (both direct and indirect). For example, Bailey, Peterson, and Brorsen (1991)compared prices received for cattle sold through video auctions with prices receivedfor cattle in three large, traditional regional auctions. They argue that the most obviousdifference affecting prices is in transaction costs (transportation, shrink, and commis-sions). Cattle sold through video auctions do not need to be shipped to a centrallocation as they do for regional auctions, saving on both trucking costs and shrink.
One final issue involves the indirect transaction costs associated with auctionsthemselves. One conjecture from auction theory (Milgrom, 1989) is that the exist-ence of different types of livestock auctions expands the number of potential buyersover what is available from other existing marketing mechanisms. However,McPherson (1956) found local livestock auctions in Florida yielded lower prices thanother mechanisms. Price differences were also found to exist in a study by Hamm,Purcell, and Hudson (1985), where prices received through video auction sales ex-ceeded those from traditional auctions. Again, Bailey, Peterson, and Brorsen (1991)reported price differences when they compared cattle marketed through video totraditional regional markets.
McPherson attributes his result to limited supplies and higher variability in thenumber of quality cattle offered at local livestock auctions. If a particular type oflivestock auction is characterized as having small numbers of cattle or if the numberof cattle offered at a given sale is highly uncertain, then buyers will not rely on thesesales. As the number of buyers declines, consistent with auction theory, the pricingefficiency and expected price both decline. McPherson concludes larger auctionsyield higher prices and are more efficient at price discovery. These findings are alsoconsistent with more recent results documented by Troxel et al. (2002).6

Schmitz, Moss, and Schmitz Marketing Channels Compete for U.S. Stocker Cattle 139
7 A reviewer noted the predominance of private sales in Montana may be partially attributed to other factors uniqueto Western states. For example, cattle producers are less geographically concentrated in the West, contributing to greaterdistances between livestock auctions. This increased distance between markets also makes private sales more attractive.
8 The USDA keeps track of producer size by breaking producers up into several categories. Two of the categoriesused by the USDA are ranches with between 500 and 1,000 head, and ranches with more than 1,000 head. Therefore,based on USDA data, our definition of a large cowherd size, for the purposes of this analysis, includes the aggregateof both categories.
Producers maximize profits by choosing the mechanisms that yield the highest netprice. This net price is determined by direct transaction costs (e.g., commissions andtransportation costs) and indirect transaction costs [e.g., the effect of increased num-bers of bidders as developed by Milgrom (1989) and Hobbs (1997)]. As depicted infigure 4, this net price received by small producers is p0, while the net price receivedby large producers is p1. The indirect transaction costs determine the market pricep. The price received by large producers is then determined by lower direct trans-action costs t1, and the net price received by smaller producers is determined by thelarger direct transaction cost t0. As described by Koontz and Ward (1993), electronicmarketing yields lower indirect transaction costs, resulting in a higher observedmarket price (p). Koontz and Ward also point out that for sheep producers usingelectronic markets, selling price is reported to be an important factor affecting theirchoice of marketing outlets. The market price in each marketing mechanism is influ-enced more by indirect transaction costs than by direct transaction costs. However,direct transaction costs also affect farmers’ incomes.
Herd Size and the Choice of Market Outlets:An Empirical Model
A minimum number of animals are required for producers of stocker cattle to be ableto access video and Internet market channel options. Due to transportation costs andother considerations, 100 calf-size lots of the same sex are usually required. Thisleads to our hypothesis that as herd size increases, the greater will be the use of mar-keting channels other than live auctions. Figure 5 shows the distribution of cowherdsize and the percentage of cattle marketed for the 15 states under study. Montanamarkets only 12.5% of its stocker cattle through local livestock auctions, whileNorth Dakota farmers market 72.5% of their stockers through the public auction(table 1). In Montana, 51% of the cattle are from herds of 500 or greater head, where-as only 24.4% of the cattle in North Dakota are from large herds.7 Consequently, thedifference in the choice of marketing channels can be attributed, at least in part, todifferences in herd size. The relationship between the choice of marketing channelsand herd size is demonstrated by the correlation coefficients in table 2. The correla-tion between herd size and the share of private sales is negative, indicating that asthe number of beef operations increases, the share of private sales declines.
In order to formally test the relationship between cowherd size and choice ofmarketing outlet, we regress the share of cattle sold in each marketing mechanismon the share of cattle in cowherd sizes of 500 or greater in each state.8 This modeltakes the following form:

140 Fall 2003 Journal of Agribusiness
9 We recognize that the dependent variable is limited between zero and one, but given the small sample size, therelative gain in efficiency from a limited dependent variable technique is dubious.
0
10
20
30
40
50
60
70
80
Texas
Missou
ri
Oklaho
ma
Nebras
ka
S. Dak
ota
Montan
a
Kansa
s
Kentuc
ky
Tenne
ssee
N. Dak
otaIow
aFlor
ida
Arkans
as
Colorad
o
Wyoming
Perc
ent
Herds > 500 Herds > 1,000
(1) Yij ' αij % βij Sj % eij ,
where Yij is the proportion of stocker cattle in state j sold through marketing channeli, αij is the constant associated with market i in state j, Sj represents the share ofproducers in state j with a cowherd size of 500 or greater, βij is the slope associatedwith market i in state j, and eij is a random error term. Performing ordinary leastsquares, one for each marketing channel i, yields estimates as follows:
(2) Yi ' αi % βi S,
where αi is the constant associated with marketing channel i, is the slope associ-βiated with marketing channel i, and S is the average share of producers with cowherdsizes of 500 or greater.9
The ordinary least squares results for each of these four regressions are reportedin table 3 (all 15 states are used in the estimation). The regression results based onrelative numbers of cattle operations are presented in the first numeric column, whilethe second column presents the results when the data have been weighted by thenumber of calves marketed in each state. Weighted least squares analysis was chosenso that the regression results would reflect the marketing decisions at the producerlevel. Two alternative weighting methods are used in order to account for differencesin the relative cattle numbers in each state. In the first method, the states are weighted
Figure 5. Distribution of herd size and stocker cattle marketed by state

Schmitz, Moss, and Schmitz Marketing Channels Compete for U.S. Stocker Cattle 141
Table 2. Simple Correlation Coefficients: Market Shares and Herd SizeMarketing Mechanism Herd Size
VariableLocal
AuctionsVideo
Auctions Internet
SalesPrivateSales
No. of BeefOperations
No. of Beef Cattle
Local Auctions 1.000 !0.713*** !0.419 !0.874*** 0.261 !0.034 Video Auctions 1.000 0.438 0.305 !0.120 !0.012 E-Commerce 1.000 0.124 0.317 0.496 Private Sales 1.000 !0.349 !0.042 Beef Operations 1.000 0.880*** Beef Cattle 1.000
Source: Authors’ computations from table 1. *** Denotes statistical significance at the 0.01 level of confidence.
Table 3. Regression Results: Effect of Herd Size on Choice of MarketingMechanism, All 15 States Under Study (% of cattle in herds $$$$ 500)
Weighted by No. ofBeef Operations
Weighted by No. ofCalves Marketed
Description Coefficient Std. Error Coefficient Std. Error
Sold Using Local Auctions: Constant 0.843*** 0.049 0.851*** 0.088 Share of Herds $ 500 Head !0.542*** 0.125 !0.608*** 0.198 0.560 0.375R 2
Sold Using Video Auctions: Constant 0.027 0.027 0.019 0.037 Share of Herds $ 500 Head 0.228*** 0.069 0.236** 0.084 0.418 0.327R 2
Sold Using Internet Sales: Constant 0.010 0.013 0.017 0.016 Share of Herds $ 500 Head 0.118*** 0.034 0.085** 0.037 0.442 0.239R 2
Sold Using Private Contract: Constant 0.120*** 0.052 0.112 0.085 Share of Herds $ 500 Head 0.196 0.133 0.287 0.194 0.077 0.078R 2
Source: Authors’ computations.Notes: Single, double, and triple asterisks (*) denote statistical significance at the 0.10, 0.05, and 0.01 levels ofconfidence, respectively.
by number of beef operations. This method disregards differences in herd size andimplicitly places a disproportional emphasis on smaller herds. In the second method,the states are weighted by calf numbers. This method places more emphasis on largeroperations. The results are fairly consistent regardless of the weighting.

142 Fall 2003 Journal of Agribusiness
10 To examine the influence of Montana, we applied Cook’s test (Cook, 1977, 1979). The Cook’s D-statistic forthe regression on the share of cattle marketed through public auctions for Montana was 0.181, distributed F1,14 . Thus,the hypothesis that Montana has a detrimental effect on the regression results is rejected.
0.00
0.10
0.20
0.30
0.40
0.50
0.60
0.70
0.80
0.90
1.00
0.00 0.10 0.20 0.30 0.40 0.50 0.60 0.70 0.80Share of Cattle Inventory in Herds of More than 500 Head
Shar
e M
kt'd
thru
Loc
al A
uctio
ns
Marketed Through Local AuctionsPredicted (Weighted by Beef Operations)Predicted (Weighted by Number of Calves)
Based on the regression results, the share of cattle marketed through local livestockauctions decreases as the share of large herds in a particular state increases (table 3).These results support the conjecture that owners of larger herds prefer truckload-marketing outlets. The empirical relationship between herd size and share of stockercattle marketed through local auction houses is presented graphically in figure 6.This relationship appears to be fairly robust, with the possible exception of a singleoutlier (Montana).10
The results also indicate that the share of cattle marketed through video andInternet auctions increases as herd size increases. While both results are statisticallysignificant, the estimated parameter for video auctions is roughly three times largerthan for Internet auctions. This finding supports the preference of producers for videoauctions over Internet auctions. However, a time series is needed to determine if thispreference is stable, or whether farmers will increase their use of Internet auctionsover time.
Table 3 also reports the results of the effect of herd size on the share of privatesales. Unlike the results for the other marketing mechanisms, the relationship betweenherd size and the share of cattle marketed by private sales is not statistically signifi-cant at the 0.10 confidence level. Two possible explanations can be suggested forthis lack of significance. The first explanation is purely statistical. Specifically, theprevalence of private sales in Montana negatively impacts the statistical relationship,which is somewhat counterintuitive since Montana has both the largest herd size andlevel of private sales observed in the sample. The Cook’s D-statistic for Montana is
Figure 6. Herd size and the share of stocker cattle marketedthrough local auctions

Schmitz, Moss, and Schmitz Marketing Channels Compete for U.S. Stocker Cattle 143
0.169 when the sample is weighted by the number of beef operations, and is 0.534when the sample is weighted by the number of stockers marketed. Another potentialexplanation for the statistically insignificant relationship between herd size and privatesales is that, unlike video and Internet auctions, private sales entail a fairly diversegroup of marketing relationships which vary across herd size. At one extreme, privatesales occur through truckload sales by large producers based on reputation. At theother extreme, private sales can also represent a small-scale transaction between neigh-boring producers. Historically, these small, direct producer-to-producer sales probablyrepresent the majority of the sales observed by Williams and Stout (1964) that dom-inated the stocker cattle market in the 1950s. Undoubtedly, these small producer-to-producer sales have become less important through time, but the existence of thesetypes of transactions introduces additional noise to the regression results.
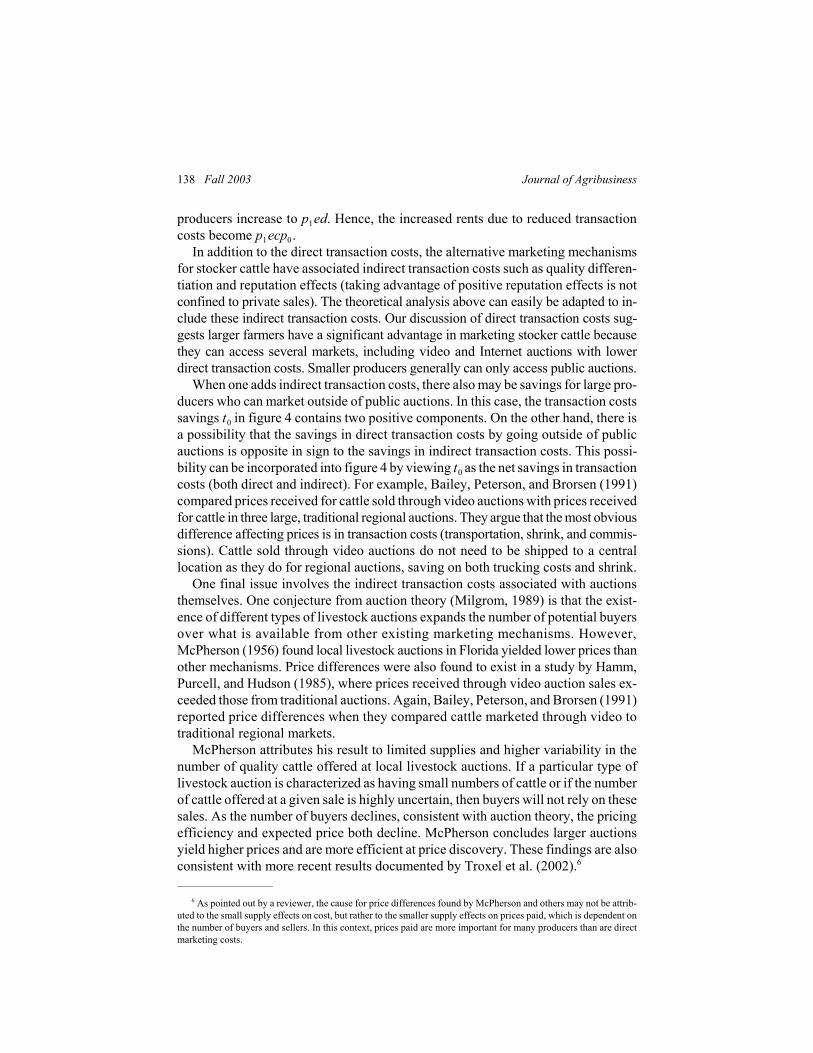
Table 4 presents the regression results, excluding Montana. Despite the Cook’sD-statistic, once Montana is excluded from the data, the above specification yieldsa positive coefficient on herd size which is statistically significant at the 0.10 levelof confidence.
Transaction Costs and the New Institutional Economics (NIE)
The theory developed earlier focused on the role of transaction costs in the choiceof market selection. As shown above, the larger the herd, the greater is the tendencyfor farmers to market cattle privately and through Internet and video mechanisms.In this context, transaction costs play a major role. For example, in order for a pro-ducer to be able to participate in video or Internet auctions, 100 calf-size lots of thesame sex are usually desired because efficient transportation of cattle requires thenumber of calves be large enough to completely fill a large truck. Thus, even thoughmarketing outside of public auctions may reduce marketing costs, these markets arenot available to small producers.
D. Gale Johnson (1989), in his study on the efficiency of the U.S. cattle industry,predicts that the level of beef production and consumption in the United States at theturn of the century will be determined by the beef producers in reducing theirproduction costs, and the ability of processors and merchandisers to reduce theircosts. Hence, the relative competitiveness of the beef sector is dependent in part onthe technical efficiency of its marketing mechanisms, recognizing that, for live cattle,marketing costs are a relatively small portion of total industry costs (i.e., production,marketing, processing, and distribution costs).
Economic efficiency is contingent upon transaction costs. The NIE distinguishesbetween direct and indirect transaction costs (Williamson, 1975, 1979, 1985, 1998).Direct costs include transportation costs and commission charges, while indirectcosts include quality and reputation effects. As we have argued, transaction costs areimportant in the selection by producers of a marketing channel for selling stockercattle. The NIE provides a framework for separating those factors determining themarket price versus additional factors impacting the net producer price.
144 Fall 2003 Journal of Agribusiness
Table 4. Regression Results: Effect of Herd Size on Choice of MarketingMechanism, Excluding Montana (% of cattle in herds $$$$ 500)
Weighted by No. ofBeef Operations
Weighted by No. ofCalves Marketed
Description Coefficient Std. Error Coefficient Std. Error
Sold Using Local Auctions: Constant 0.838*** 0.031 0.843*** 0.045 Share of Herds $ 500 Head !0.493*** 0.079 !0.506*** 0.103 0.744 0.638R 2
Sold Using Video Auctions: Constant 0.027 0.028 0.020 0.039 Share of Herds $ 500 Head 0.228*** 0.072 0.233** 0.089 0.407 0.311R 2
Sold Using Internet Sales: Constant 0.009 0.014 0.017 0.017 Share of Herds $ 500 Head 0.120*** 0.035 0.088** 0.039 0.453 0.244R 2
Sold Using Private Contract: Constant 0.126*** 0.035 0.121** 0.041 Share of Herds $ 500 Head 0.145 0.089 0.185* 0.093 0.113 0.185R 2
Source: Authors’ computations.Notes: Single, double, and triple asterisks (*) denote statistical significance at the 0.10, 0.05, and 0.01 levels ofconfidence, respectively.
In a study applying the transaction costs paradigm to slaughter cattle markets inthe United Kingdom, Hobbs (1997, p. 1083) states, “Transaction cost economics,unlike traditional neoclassical theory, recognizes that commercial activity does notoccur in a frictionless environment.” (Note that part of this friction entails the costof information associated with determining a price for the good.) She develops a listof transaction cost variables, divided into three parts: information costs, negotiationcosts, and monitoring costs.
Hobbs looks at slaughter cattle markets in the United Kingdom, which are dif-ferent than the markets for stocker cattle in the United States. However, severaltransaction costs developed in Hobbs’ work are relevant for our purposes. In termsof information costs, price uncertainty, auction price information costs, and direct-sale price information costs apply to the choice of marketing channel for stockercattle in the United States. Negotiation costs include auction transportation costs,auction transportation effort, direct sale transportation effort, sales commissions,speed of payment, the risk of non-sale at auction, unequal bargaining power in privatesales from small producers to large buyers, frequency of auction sales, time spent atthe auction, and adequate number of buyers at the auction. Monitoring costs includeshrinkage losses, carcass damage, and quality information uncertainty.
The differences in direct marketing (transaction) costs associated with each marketoutlet are primarily the result of differences in transportation costs and commissioncharges. One of the largest direct marketing costs associated with local livestock

Schmitz, Moss, and Schmitz Marketing Channels Compete for U.S. Stocker Cattle 145
11 As indicated by one reviewer, Superior Livestock Auction (the nation’s largest video auction house) does notlimit the number of animals sold in a lot, but lots of 48,000 pounds are recommended to minimize shipping costs. Thisweight is equivalent to roughly 100 stocker cattle.
12 Within traditional local auction houses, commissions vary significantly by region. For example, at the OcalaLivestock Auction in Ocala, Florida, the commission is 4% per head. However, other auction facilities have slidingscales depending on the number of cattle sold.
auctions is the cost of transportation. When producers market cattle through a locallivestock auction, they transport cattle to the auction facility. Cattle are then unloaded,sold, and reloaded for shipment to some final destination. Stockers purchased aremoved from the auction facility to the purchaser’s facility. These transportation costscan be much higher than under private sales where cattle move directly from sellerto buyer with only one load-and-unload transaction.
The actual freight charge may be a minor part of the shipping cost. As cattle areshipped and sorted, they lose weight (suffer shrinkage) and have a higher probabilityof disease (Nyamusika et al., 1994). Pollreisz et al. (1986) note feedlot operatorsoften perceive cattle sold through traditional auctions as being “severely stressed andbreaking with disease immediately upon or soon after arrival” at the feedlot. Also,as pointed out by Pate and Crockett (2002), cattle bought directly from farmers tendto have fewer health problems than cattle sold at regional auctions. When sold viavideo or Internet auctions in truckload lots, cattle are only moved once, eliminatingone source of shrinkage and minimizing the exposure to disease. Hence, ceterisparibus, cattle marketed through video or Internet auctions as truckload lots shouldearn a higher price.
The differences in commissions charged in different marketing outlets demonstratethe advantages to marketing by truckload lots. Cattle marketed through video orInternet auctions receive a better price if the lot weights are approximately 48,000pounds.11 Cattle are delivered from the producer’s ranch and trucked directly to thebuyer’s facilities. A pen of cattle sold through a video auction in Florida can beloaded onto a truck from the farm and shipped directly to a feedlot hundreds of milesaway (e.g., the Texas Panhandle), thus avoiding many of the commission chargesassociated with public auctions. Commissions charged by video or Internet auctionsare lower than commissions charged when selling stocker cattle through traditionalpublic auctions, at least in Florida (Schmitz, Schmitz, and Moss, 2002).12
Video auctions typically charge a catalogue fee. For example, the Superior Live-stock Auction of Denver, Colorado, and Dallas, Texas, charges a $2 per head fee forvideo advertising. If the cattle are actually sold, this fee is credited against a 2%sales commission. Superior Livestock Auction charges a 1.5% commission withouta catalogue fee for Internet sales. In contrast, Florida’s Ocala Livestock Auction, forexample, charges 4% commission per head. This finding is consistent with Bailey,Peterson, and Brorsen (1991) who found that the net prices paid by buyers, andreceived by sellers, in video auctions exceeded the prices paid in live cattle auctions.
We do not perform a detailed assessment of the indirect transaction costsassociated with marketing feeder cattle. It may well be, for example, that privatesales have larger indirect costs than public auctions. However, even though indirect

146 Fall 2003 Journal of Agribusiness
13 In Tennessee, 20% of stockers were marketed in 2001 using video auctions, but this percentage is expected toincrease. Efforts are being made to group cattle so that minimum sized lots can be achieved, and sold through video.This objective has been facilitated through various institutions, including the Giles County Alliance.
costs may be higher for a particular marketing outlet, they may not outweigh thesavings in direct costs from using this marketing channel. A complete examinationof price discovery and related efficiencies in the marketing of stocker cattle requiresa knowledge of the indirect transaction costs associated with each marketing outlet.This also must be linked to price discovery through the Chicago futures market.
Conclusions
Significant differences exist in the use of stocker cattle marketing outlets in theUnited States. States with relatively large cowherd sizes generally use non-publicauctions in the marketing of stocker cattle, including private sales. Using thetransaction cost approach from the New Institutional Economics, we presentarguments why this is the case. However, the focus here has been largely on directtransaction costs. More work is needed on indirect costs by marketing outlet todetermine the degree to which current marketing arrangements for stocker cattle areefficient. For example, even though the direct transaction costs are greater for publicauctions versus video sales, the associated indirect costs may tip the scale in favorof either public auctions or video sales. Direct transaction costs alone are insufficientto determine the efficiency of various marketing channels.
One interesting observation is the small role played by Internet sales in the market-ing of stocker cattle. In order for Internet sales to grow, this channel must competewith video and private sales, given that producers with relatively smaller herds tendto market their cattle through public auctions. Internet sales are at a disadvantage toprivate sales and video auctions because a certain level of technological competencyis required in order to participate in an Internet auction. Not all U.S. farmers activelyuse computer technology for their farm businesses. Moreover, the slow speed ofdial-up internet connections used by most producers makes the use of Internetauctions technologically infeasible in many instances due to a disruption in serviceand/or the extensive delay from the time a bid is sent to the time it takes to reach theauction site, be processed, and the results sent back to the producer.
Reputation effects may impact prices received for stocker cattle. However, it isunclear which marketing mechanism will generate the greatest benefit from a positivereputation effect (recognizing that cattle ranchers and order buyers may have negativereputation effects as well). A rancher with a positive reputation effect will realize ahigher price across all marketing channels, and thus is not confined to the private salesmarket. But the relative impact of this reputation effect through the various marketingchannels is beyond the scope of the current study and is left to future research.
The much larger prevalence of video auctions as opposed to Internet auctions maybe attributed to the fact that the technology required to participate in video auctionsis less expensive and has been proven over time.13 However, quality uncertainty

Schmitz, Moss, and Schmitz Marketing Channels Compete for U.S. Stocker Cattle 147
remains an important issue for both video and Internet auctions, due to the limitedamount of information available in video clips employed in both types of auctions.This may be one explanation for the relatively slow rate of adoption of these mar-keting channels when compared to the traditional live cattle auction. Nevertheless,Bailey, Peterson, and Brorsen (1991) argue that additional information, not availablein traditional auctions, may be available in video auctions (e.g., vaccination records,place of origin, and current feed regimen). This information could be used to improveanimal health and feed lot efficiency.
There are additional factors which explain the relatively low percentage of cattlesold through Internet auctions. These include several types of indirect transactioncosts, such as: (a) slow and unreliable Internet connections cause unacceptable delaysbetween the time the producer submits a bid and the time the results are received;(b) the relatively low level of computer literacy among cattle producers; (c) minimumherd size lots are needed; (d) the uncertainty in the degree of security involved witha given transaction; (e) uncertainty in the ability to actually collect payment; ( f ) thequality and reputation of the cattle sold by sellers in many cases are unknownto buyers; and (g) if there are not a large number of buyers and sellers involved inan Internet auction, the price discovery mechanism will not be efficient andproducers would receive a lower price than they would through other marketingchannels.
References
Bailey, D. V., M. C. Peterson, and B. W. Brorsen. (1991). “A comparison of video cattleauction and regional market prices.” American Journal of Agricultural Economics 73,465S475.
Cook, R. D. (1977). “Detection of influential observations in linear regression.” Techno-metrics 19, 15S18.
———. (1979). “Influential observations in linear regression.” Journal of the AmericanStatistical Association 74(365), 169S174.
Hamm, S. R., W. D. Purcell, and M. A. Hudson. (1985). “A framework for analyzing theimpact of anonymous bidding on prices and competition in a computerized auction.”North Central Journal of Agricultural Economics 7, 109S117.
Hobbs, J. E. (1997). “Measuring the importance of transaction costs in cattle marketing.”American Journal of Agricultural Economics 79, 1083S1095.
Johnson, D. G. (1989, October 25). “Competitive position of beef in the U.S. meatsector.” In D. G. Johnson, J. M. Connor, T. Josling, A. Schmitz, and G. E. Schuh(eds.), Beef in a Competitive World: Final Report of the NCA Beef Industry Concen-tration/Integration Task Force (Chapter III). Report prepared for the National Cattle-men’s Association Executive Committee, Englewood, CO.
Koontz, S. R., and C. E. Ward. (1993). “Electronic market use by Oklahoma lamb pro-ducers.” Journal of Agricultural and Resource Economics 18(1), 70S85.
McPherson, W. K. (1956). “How well do auctions discover the price of cattle.” Journalof Farm Economics 37, 30S43.

148 Fall 2003 Journal of Agribusiness
Milgrom, P. (1989). “Auctions and bidding: A primer.” Journal of Economic Perspec-tives 3, 3S22.
Nyamusika, N., T. H. Spreen, O. Rae, and C. B. Moss. (1994). “A bioeconomic modelof bovine respiratory disease complex.” Review of Agricultural Economics 16, 39S53.
Pate, F. M., and J. R. Crockett. (2002). “Value of preconditioning beef calves.” BulletinNo. 799 (EDIS document AN042), Department of Animal Sciences, University ofFlorida, Gainesville. Online. Available at http://edis.ifas.ufl.edu/AN042.
Pollreisz, J. P., T. Jordan, D. T. Bechtol, and R. N. Ballinger. (1986). “Arrival proceduresfor incoming feedyard cattle.” Animal Health and Nutrition 67, 23S27.
Schmitz, T. G., A. Schmitz, and C. B. Moss. (2002, February 10). “The potential role ofE-commerce in Florida’s cattle market: Theory and application.” Paper presented atthe CARD Symposium on E-Commerce in Agriculture, San Diego, CA.
Troxel, T. R., M. S. Gadberry, S. Cline, J. Foley, G. Ford, D. Urell, and R. Wiedower.(2002). “Factors affecting the selling price of feeder cattle sold at Arkansas livestockauctions.” Working paper, University of Arkansas Cooperative Extension Service,Little Rock.
Williams, W. F., and T. T. Stout. (1964). Economics of the Livestock-Meat Industry.New York: The Macmillan Company.
Williamson, O. E. (1975). Markets and Hierarchies: Analysis and Antitrust Implications.New York: The Free Press.
———. (1979). “Transaction-cost economics: The governance of contractual relation-ships.” Journal of Law and Economics 22(2), 233S261.
———. (1985). The Economic Institutions of Capitalism. New York: The Free Press.———. (1998). “The institutions of governance.” American Economics Review 88,
75S79.