market within a market - may 2012
DESCRIPTION
Market Within A Market Report - May 2012TRANSCRIPT

WHAT IS A MARKET WITHIN A MARKET?
Just as the weather is different from Los Feliz to Santa Monica so is the Real Estate climate. While it
may be cloudy & overcast in Marina del Rey, at the same exact time, it may be warm & sunny in
the Mid Wilshire area. The Real Estate market works the same way. Year-to-year there may be a
significant sales increase in Venice while at the same time there is an alarming drop in sales price
from the Palms – Mar Vista area even though they are literally blocks from one another.
With our vast years of experience, we at Keller Williams have come to notice that like the need for
a sweater by the beach and a T-shirt in the Valley, every market within a market has a very different
climate and therefore requires its own set of statistics for you to truly understand what is going on in
your neighborhood. Although you can easily access the broad national, state, and/or country
trends published by the media, they may not have anything to do with what is occurring in your
own backyard. After all, you wouldn’t watch a weather channel report for Seattle to decide if you
need an umbrella that day would you?

WHY THIS BENEFITS YOU – OUR CLIENT
Our extensive experience & knowledge has led us to notice that markets within
markets may be performing in a different way from one another and from national
averages.
With the current stringent lending situation, having knowledge of the specialized
market trends for the neighborhood you are contemplating is vital for true success in
your transaction.
Don’t be mislead by ideas that are not actual facts.
What is in fact occurring in the markets of those areas may be counterintuitive of
notions or ideas you may have perceived from national averages. Knowledge is
power and knowing all the facts will give you the power to make the most educated
choice.
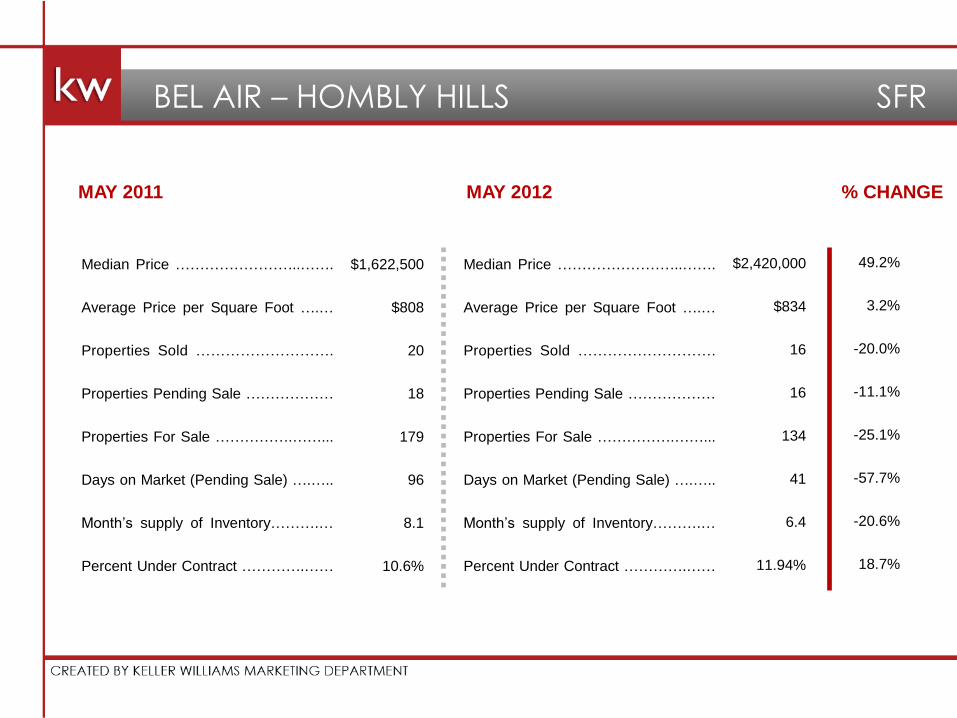
$1,622,500
$808
20
18
179
96
8.1
10.6%
$2,420,000
$834
16
16
134
41
6.4
11.94%
49.2%
3.2%
-20.0%
-11.1%
-25.1%
-57.7%
-20.6%
18.7%
BEL AIR – HOMBLY HILLS SFR
Median Price ……………………..…….
Average Price per Square Foot ….…
Properties Sold ……………………….
Properties Pending Sale ………………
Properties For Sale …………….……...
Days on Market (Pending Sale) ….…..
Month’s supply of Inventory……….…
Percent Under Contract ………….……
Median Price ……………………..…….
Average Price per Square Foot ….…
Properties Sold ……………………….
Properties Pending Sale ………………
Properties For Sale …………….……...
Days on Market (Pending Sale) ….…..
Month’s supply of Inventory……….…
Percent Under Contract ………….……
MAY 2011 MAY 2012 % CHANGE

$841,750
$494
8
17
114
62
5.1
14.91%
$934,000
$492
20
21
76
27
2.2
27.63%
11.0%
-0.4%
150.0%
23.5%
-33.3%
-56.2%
-55.8%
85.3%
BEVERLY CENTER – MIRACLE MILE SFR
Median Price ……………………..…….
Average Price per Square Foot ….…
Properties Sold ……………………….
Properties Pending Sale ………………
Properties For Sale …………….……...
Days on Market (Pending Sale) ….…..
Month’s supply of Inventory……….…
Percent Under Contract ………….……
Median Price ……………………..…….
Average Price per Square Foot ….…
Properties Sold ……………………….
Properties Pending Sale ………………
Properties For Sale …………….……...
Days on Market (Pending Sale) ….…..
Month’s supply of Inventory……….…
Percent Under Contract ………….……
MAY 2011 MAY 2012 % CHANGE

$400,000
$353
5
5
42
49
6.6
11.90%
$480,000
$359
7
8
28
46
2.1
28.57%
20.0%
1.7%
40.0%
60.0%
-33.3%
-6.4%
-67.8%
140.0%
BEVERLY CENTER – MIRACLE MILE CONDO
Median Price ……………………..…….
Average Price per Square Foot ….…
Properties Sold ……………………….
Properties Pending Sale ………………
Properties For Sale …………….……...
Days on Market (Pending Sale) ….…..
Month’s supply of Inventory……….…
Percent Under Contract ………….……
Median Price ……………………..…….
Average Price per Square Foot ….…
Properties Sold ……………………….
Properties Pending Sale ………………
Properties For Sale …………….……...
Days on Market (Pending Sale) ….…..
Month’s supply of Inventory……….…
Percent Under Contract ………….……
MAY 2011 MAY 2012 % CHANGE

$2,395,000
$790
10
13
159
76
10.5
8.18%
$6,975,000
$1,022
10
16
144
151
6.4
11.11%
191.2%
29.4%
0.0%
23.1%
-9.4%
97.4%
-39.1%
35.9%
BEVERLY HILLS SFR
Median Price ……………………..…….
Average Price per Square Foot ….…
Properties Sold ……………………….
Properties Pending Sale ………………
Properties For Sale …………….……...
Days on Market (Pending Sale) ….…..
Month’s supply of Inventory……….…
Percent Under Contract ………….……
Median Price ……………………..…….
Average Price per Square Foot ….…
Properties Sold ……………………….
Properties Pending Sale ………………
Properties For Sale …………….……...
Days on Market (Pending Sale) ….…..
Month’s supply of Inventory……….…
Percent Under Contract ………….……
MAY 2011 MAY 2012 % CHANGE

$1,030,000
$1,162
6
8
101
79
10.5
7.92%
$1,030,000
$791
14
16
76
99
3.1
21.05%
0.0%
-31.9%
133.3%
100.0%
-24.8%
26.2%
-70.8%
165.8%
BEVERLY HILLS CONDO
Median Price ……………………..…….
Average Price per Square Foot ….…
Properties Sold ……………………….
Properties Pending Sale ………………
Properties For Sale …………….……...
Days on Market (Pending Sale) ….…..
Month’s supply of Inventory……….…
Percent Under Contract ………….……
Median Price ……………………..…….
Average Price per Square Foot ….…
Properties Sold ……………………….
Properties Pending Sale ………………
Properties For Sale …………….……...
Days on Market (Pending Sale) ….…..
Month’s supply of Inventory……….…
Percent Under Contract ………….……
MAY 2011 MAY 2012 % CHANGE

$1,607,500
$521
12
13
182
107
11.9
7.14%
$2,475,000
$599
19
15
130
96
6.6
11.54%
54.0%
15.0%
58.3%
15.4%
-28.6%
-10.6%
-44.6%
61.5%
BEVERLY HILLS P.O. SFR
Median Price ……………………..…….
Average Price per Square Foot ….…
Properties Sold ……………………….
Properties Pending Sale ………………
Properties For Sale …………….……...
Days on Market (Pending Sale) ….…..
Month’s supply of Inventory……….…
Percent Under Contract ………….……
Median Price ……………………..…….
Average Price per Square Foot ….…
Properties Sold ……………………….
Properties Pending Sale ………………
Properties For Sale …………….……...
Days on Market (Pending Sale) ….…..
Month’s supply of Inventory……….…
Percent Under Contract ………….……
MAY 2011 MAY 2012 % CHANGE

$805,000
$446
18
12
80
30
5.3
15.0%
$779,000
$442
16
30
75
46
1.3
40.0%
-3.2%
-0.9%
-11.1%
150.0%
-6.2%
53.5%
-76.2%
166.7%
BEVERLYWOOD SFR
Median Price ……………………..…….
Average Price per Square Foot ….…
Properties Sold ……………………….
Properties Pending Sale ………………
Properties For Sale …………….……...
Days on Market (Pending Sale) ….…..
Month’s supply of Inventory……….…
Percent Under Contract ………….……
Median Price ……………………..…….
Average Price per Square Foot ….…
Properties Sold ……………………….
Properties Pending Sale ………………
Properties For Sale …………….……...
Days on Market (Pending Sale) ….…..
Month’s supply of Inventory……….…
Percent Under Contract ………….……
MAY 2011 MAY 2012 % CHANGE

$2,262,500
$694
12
17
164
56
8.1
10.37%
$1,838,000
$809
15
25
157
43
4.4
15.92%
-18.8%
16.6%
25.0%
47.1%
-4.3%
-22.8%
-45.9%
53.6%
BRENTWOOD SFR
Median Price ……………………..…….
Average Price per Square Foot ….…
Properties Sold ……………………….
Properties Pending Sale ………………
Properties For Sale …………….……...
Days on Market (Pending Sale) ….…..
Month’s supply of Inventory……….…
Percent Under Contract ………….……
Median Price ……………………..…….
Average Price per Square Foot ….…
Properties Sold ……………………….
Properties Pending Sale ………………
Properties For Sale …………….……...
Days on Market (Pending Sale) ….…..
Month’s supply of Inventory……….…
Percent Under Contract ………….……
MAY 2011 MAY 2012 % CHANGE
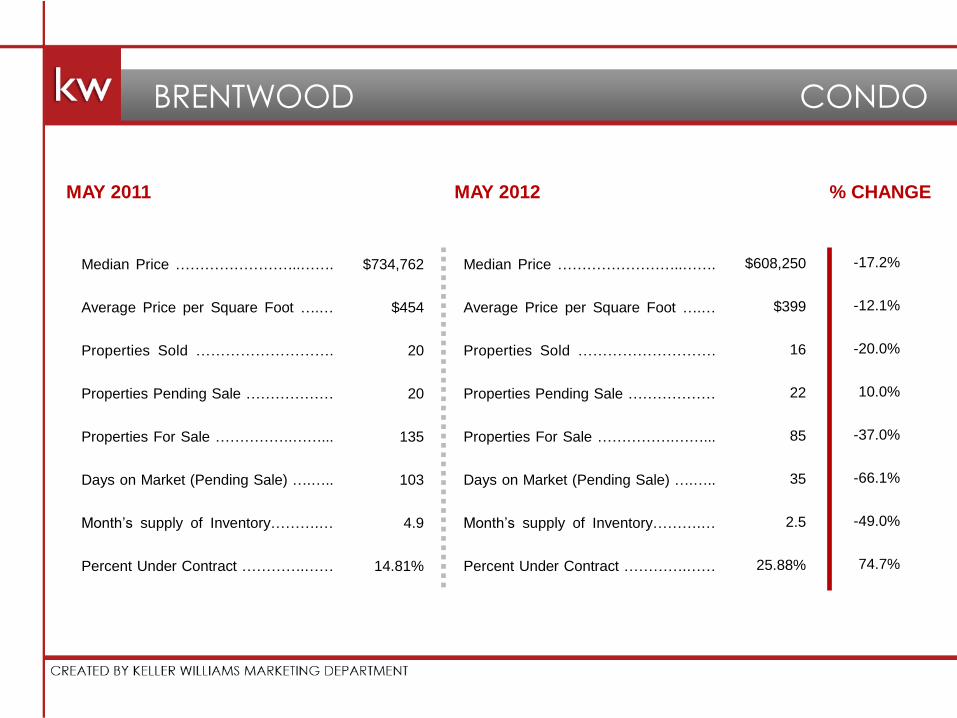
$734,762
$454
20
20
135
103
4.9
14.81%
$608,250
$399
16
22
85
35
2.5
25.88%
-17.2%
-12.1%
-20.0%
10.0%
-37.0%
-66.1%
-49.0%
74.7%
BRENTWOOD CONDO
Median Price ……………………..…….
Average Price per Square Foot ….…
Properties Sold ……………………….
Properties Pending Sale ………………
Properties For Sale …………….……...
Days on Market (Pending Sale) ….…..
Month’s supply of Inventory……….…
Percent Under Contract ………….……
Median Price ……………………..…….
Average Price per Square Foot ….…
Properties Sold ……………………….
Properties Pending Sale ………………
Properties For Sale …………….……...
Days on Market (Pending Sale) ….…..
Month’s supply of Inventory……….…
Percent Under Contract ………….……
MAY 2011 MAY 2012 % CHANGE
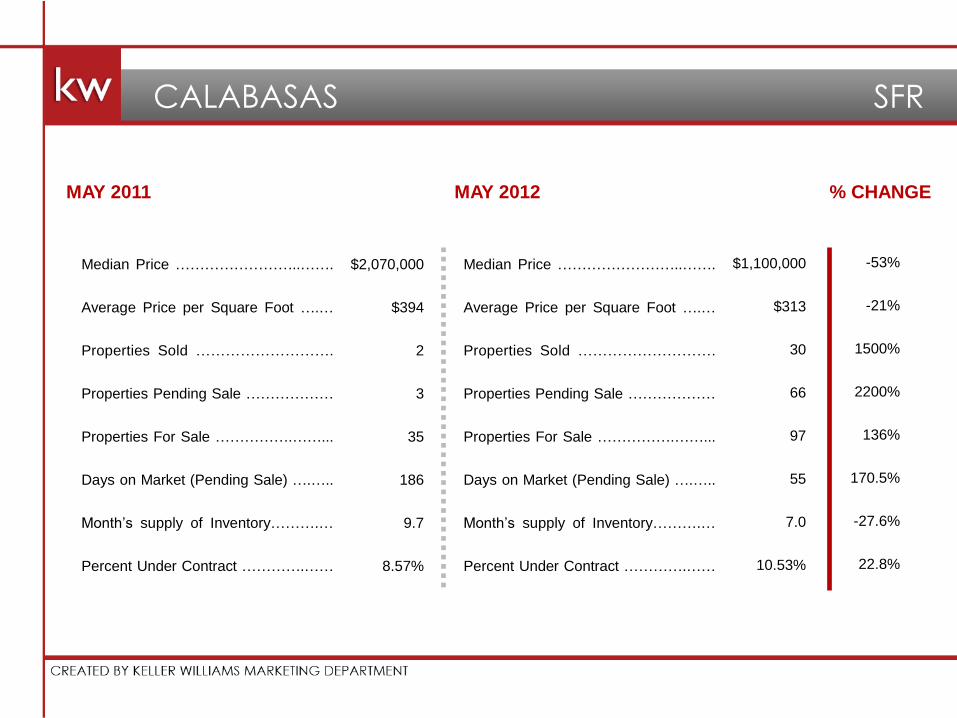
$2,070,000
$394
2
3
35
186
9.7
8.57%
$1,100,000
$313
30
66
97
55
7.0
10.53%
-53%
-21%
1500%
2200%
136%
170.5%
-27.6%
22.8%
CALABASAS SFR
Median Price ……………………..…….
Average Price per Square Foot ….…
Properties Sold ……………………….
Properties Pending Sale ………………
Properties For Sale …………….……...
Days on Market (Pending Sale) ….…..
Month’s supply of Inventory……….…
Percent Under Contract ………….……
Median Price ……………………..…….
Average Price per Square Foot ….…
Properties Sold ……………………….
Properties Pending Sale ………………
Properties For Sale …………….……...
Days on Market (Pending Sale) ….…..
Month’s supply of Inventory……….…
Percent Under Contract ………….……
MAY 2011 MAY 2012 % CHANGE

$1,585,000
$515
7
2
40
20
17.5
5.0%
$1,296,000
$503
4
6
27
46
2.7
22.22%
-18.2%
-2.3%
-42.9%
200.0%
-32.5%
122.0%
-84.8%
344.4%
CHEVIOT HILLS-RANCH PARK SFR
Median Price ……………………..…….
Average Price per Square Foot ….…
Properties Sold ……………………….
Properties Pending Sale ………………
Properties For Sale …………….……...
Days on Market (Pending Sale) ….…..
Month’s supply of Inventory……….…
Percent Under Contract ………….……
Median Price ……………………..…….
Average Price per Square Foot ….…
Properties Sold ……………………….
Properties Pending Sale ………………
Properties For Sale …………….……...
Days on Market (Pending Sale) ….…..
Month’s supply of Inventory……….…
Percent Under Contract ………….……
MAY 2011 MAY 2012 % CHANGE

$655,655
$401
13
9
64
88
5.7
14.06%
$672,000
$449
12
18
53
40
1.8
33.96%
2.5%
12.0%
7.7%
100.0%
-17.2%
-54.4%
-68.6%
141.5%
CULVER CITY SFR
Median Price ……………………..…….
Average Price per Square Foot ….…
Properties Sold ……………………….
Properties Pending Sale ………………
Properties For Sale …………….……...
Days on Market (Pending Sale) ….…..
Month’s supply of Inventory……….…
Percent Under Contract ………….……
Median Price ……………………..…….
Average Price per Square Foot ….…
Properties Sold ……………………….
Properties Pending Sale ………………
Properties For Sale …………….……...
Days on Market (Pending Sale) ….…..
Month’s supply of Inventory……….…
Percent Under Contract ………….……
MAY 2011 MAY 2012 % CHANGE

$299,000
$298
17
14
92
47
5.1
15.22%
$299,500
$282
20
14
35
46
1.2
40.00%
0.2%
-5.4%
17.6%
0.0%
-62.0%
-1.1%
-76.1%
162.9%
CULVER CITY CONDO
Median Price ……………………..…….
Average Price per Square Foot ….…
Properties Sold ……………………….
Properties Pending Sale ………………
Properties For Sale …………….……...
Days on Market (Pending Sale) ….…..
Month’s supply of Inventory……….…
Percent Under Contract ………….……
Median Price ……………………..…….
Average Price per Square Foot ….…
Properties Sold ……………………….
Properties Pending Sale ………………
Properties For Sale …………….……...
Days on Market (Pending Sale) ….…..
Month’s supply of Inventory……….…
Percent Under Contract ………….……
MAY 2011 MAY 2012 % CHANGE

$129,950
$138
4
10
45
27
3.3
22.22%
$180,000
$130
4
11
32
41
1.6
34.38%
38.5%
-5.8%
0.0%
10.0%
-28.9%
51.2%
-50.4%
54.7%
DOWNTOWN SFR
Median Price ……………………..…….
Average Price per Square Foot ….…
Properties Sold ……………………….
Properties Pending Sale ………………
Properties For Sale …………….……...
Days on Market (Pending Sale) ….…..
Month’s supply of Inventory……….…
Percent Under Contract ………….……
Median Price ……………………..…….
Average Price per Square Foot ….…
Properties Sold ……………………….
Properties Pending Sale ………………
Properties For Sale …………….……...
Days on Market (Pending Sale) ….…..
Month’s supply of Inventory……….…
Percent Under Contract ………….……
MAY 2011 MAY 2012 % CHANGE

$330,000
$392
29
36
210
68
4.4
17.14%
$329,500
$376
26
41
131
46
1.8
31.30%
-0.2%
-4.1%
-10.3%
13.9%
-37.6%
-32.1%
-58.9%
82.6%
DOWNTOWN CONDO
Median Price ……………………..…….
Average Price per Square Foot ….…
Properties Sold ……………………….
Properties Pending Sale ………………
Properties For Sale …………….……...
Days on Market (Pending Sale) ….…..
Month’s supply of Inventory……….…
Percent Under Contract ………….……
Median Price ……………………..…….
Average Price per Square Foot ….…
Properties Sold ……………………….
Properties Pending Sale ………………
Properties For Sale …………….……...
Days on Market (Pending Sale) ….…..
Month’s supply of Inventory……….…
Percent Under Contract ………….……
MAY 2011 MAY 2012 % CHANGE
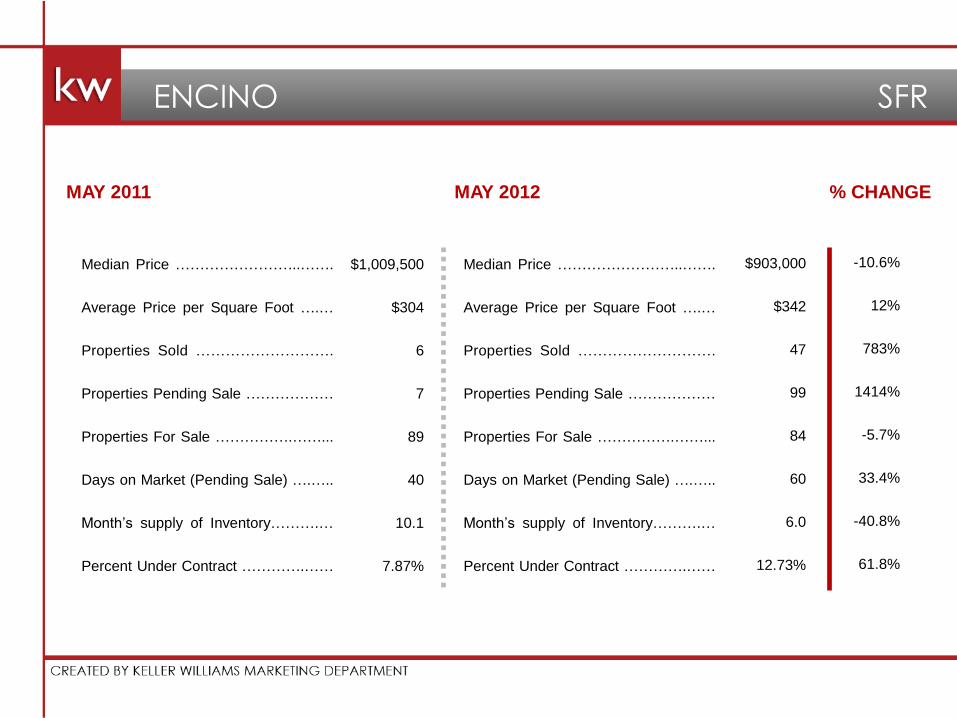
$1,009,500
$304
6
7
89
40
10.1
7.87%
$903,000
$342
47
99
84
60
6.0
12.73%
-10.6%
12%
783%
1414%
-5.7%
33.4%
-40.8%
61.8%
ENCINO SFR
Median Price ……………………..…….
Average Price per Square Foot ….…
Properties Sold ……………………….
Properties Pending Sale ………………
Properties For Sale …………….……...
Days on Market (Pending Sale) ….…..
Month’s supply of Inventory……….…
Percent Under Contract ………….……
Median Price ……………………..…….
Average Price per Square Foot ….…
Properties Sold ……………………….
Properties Pending Sale ………………
Properties For Sale …………….……...
Days on Market (Pending Sale) ….…..
Month’s supply of Inventory……….…
Percent Under Contract ………….……
MAY 2011 MAY 2012 % CHANGE

$
$
2
21
65
8.0
9.52%
$195,000
$188
16
56
30
76
0.4
71.43%
%
%
%
2800%
30%
14.5%
-95.0%
650.0%
ENCINO CONDO
Median Price ……………………..…….
Average Price per Square Foot ….…
Properties Sold ……………………….
Properties Pending Sale ………………
Properties For Sale …………….……...
Days on Market (Pending Sale) ….…..
Month’s Supply of Inventory……….…
Percent Under Contract ………….……
Median Price ……………………..…….
Average Price per Square Foot ….…
Properties Sold ……………………….
Properties Pending Sale ………………
Properties For Sale …………….……...
Days on Market (Pending Sale) ….…..
Month’s supply of Inventory……….…
Percent Under Contract ………….……
MAY 2011 MAY 2012 % CHANGE
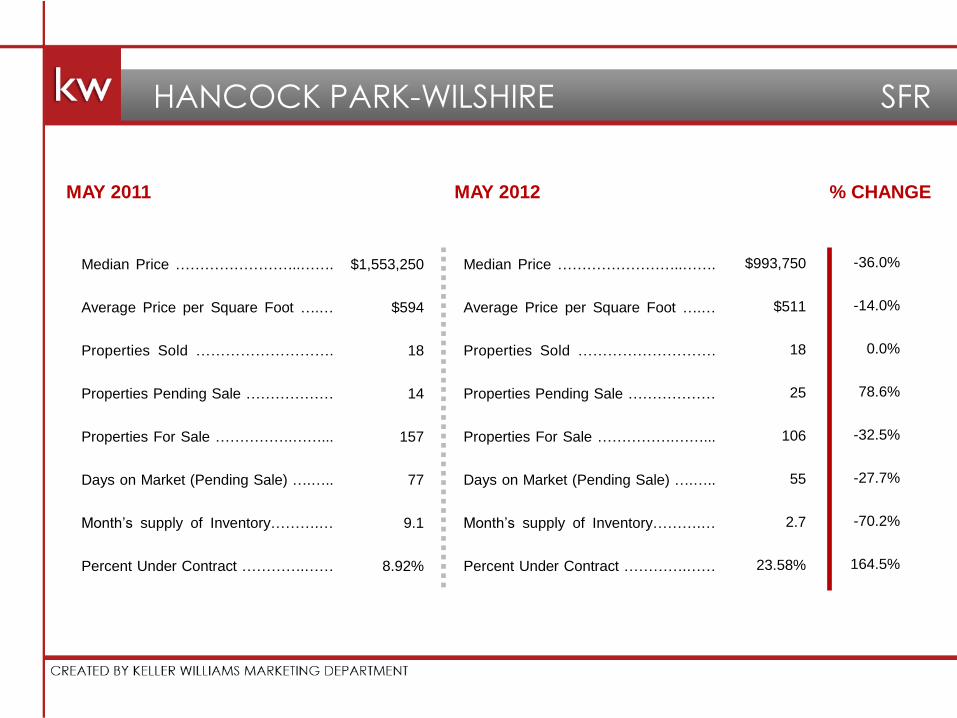
$1,553,250
$594
18
14
157
77
9.1
8.92%
$993,750
$511
18
25
106
55
2.7
23.58%
-36.0%
-14.0%
0.0%
78.6%
-32.5%
-27.7%
-70.2%
164.5%
HANCOCK PARK-WILSHIRE SFR
Median Price ……………………..…….
Average Price per Square Foot ….…
Properties Sold ……………………….
Properties Pending Sale ………………
Properties For Sale …………….……...
Days on Market (Pending Sale) ….…..
Month’s supply of Inventory……….…
Percent Under Contract ………….……
Median Price ……………………..…….
Average Price per Square Foot ….…
Properties Sold ……………………….
Properties Pending Sale ………………
Properties For Sale …………….……...
Days on Market (Pending Sale) ….…..
Month’s supply of Inventory……….…
Percent Under Contract ………….……
MAY 2011 MAY 2012 % CHANGE

$520,000
$404
5
6
34
95
4.3
17.65%
$361,000
$266
8
4
21
64
3.0
19.05%
-30.6%
-34.2%
60.0%
-33.3%
-38.2%
-32.2%
-30.8%
7.9%
HOLLYWOOD SFR
Median Price ……………………..…….
Average Price per Square Foot ….…
Properties Sold ……………………….
Properties Pending Sale ………………
Properties For Sale …………….……...
Days on Market (Pending Sale) ….…..
Month’s supply of Inventory……….…
Percent Under Contract ………….……
Median Price ……………………..…….
Average Price per Square Foot ….…
Properties Sold ……………………….
Properties Pending Sale ………………
Properties For Sale …………….……...
Days on Market (Pending Sale) ….…..
Month’s supply of Inventory……….…
Percent Under Contract ………….……
MAY 2011 MAY 2012 % CHANGE

$484,000
$369
6
7
70
128
7.4
10.0%
$654,000
$390
6
10
62
71
4.4
16.13%
35.0%
5.7%
0.0%
42.9%
-11.4%
-44.3%
-40.8%
61.3%
HOLLYWOOD CONDO
Median Price ……………………..…….
Average Price per Square Foot ….…
Properties Sold ……………………….
Properties Pending Sale ………………
Properties For Sale …………….……...
Days on Market (Pending Sale) ….…..
Month’s supply of Inventory……….…
Percent Under Contract ………….……
Median Price ……………………..…….
Average Price per Square Foot ….…
Properties Sold ……………………….
Properties Pending Sale ………………
Properties For Sale …………….……...
Days on Market (Pending Sale) ….…..
Month’s supply of Inventory……….…
Percent Under Contract ………….……
MAY 2011 MAY 2012 % CHANGE

$742,500
$496
8
17
105
64
4.7
16.19%
$870,000
$437
16
16
73
26
2.7
21.92%
7.2%
-11.9%
100.0%
-5.9%
-30.5%
-59.1%
-42.9%
35.4%
HOLLYWOOD HILLS EAST SFR
Median Price ……………………..…….
Average Price per Square Foot ….…
Properties Sold ……………………….
Properties Pending Sale ………………
Properties For Sale …………….……...
Days on Market (Pending Sale) ….…..
Month’s supply of Inventory……….…
Percent Under Contract ………….……
Median Price ……………………..…….
Average Price per Square Foot ….…
Properties Sold ……………………….
Properties Pending Sale ………………
Properties For Sale …………….……...
Days on Market (Pending Sale) ….…..
Month’s supply of Inventory……….…
Percent Under Contract ………….……
MAY 2011 MAY 2012 % CHANGE

$960,000
$445
20
18
116
38
5.2
15.52%
$929,000
$488
21
16
80
60
3.5
20.00%
-3.2%
9.7%
5.0%
-11.1%
-31.0%
56.3%
-33.0%
28.9%
LOS FELIZ SFR
Median Price ……………………..…….
Average Price per Square Foot ….…
Properties Sold ……………………….
Properties Pending Sale ………………
Properties For Sale …………….……...
Days on Market (Pending Sale) ….…..
Month’s supply of Inventory……….…
Percent Under Contract ………….……
Median Price ……………………..…….
Average Price per Square Foot ….…
Properties Sold ……………………….
Properties Pending Sale ………………
Properties For Sale …………….……...
Days on Market (Pending Sale) ….…..
Month’s supply of Inventory……….…
Percent Under Contract ………….……
MAY 2011 MAY 2012 % CHANGE

$243,250
$260
4
2
18
44
7.5
11.11%
$
$
2
13
30
5.0
15.38%
%
%
%
0.0%
-27.8%
-33.0%
-33.3%
38.5%
LOS FELIZ CONDO
Median Price ……………………..…….
Average Price per Square Foot ….…
Properties Sold ……………………….
Properties Pending Sale ………………
Properties For Sale …………….……...
Days on Market (Pending Sale) ….…..
Month’s supply of Inventory……….…
Percent Under Contract ………….……
Median Price ……………………..…….
Average Price per Square Foot ….…
Properties Sold ……………………….
Properties Pending Sale ………………
Properties For Sale …………….……...
Days on Market (Pending Sale) ….…..
Month’s supply of Inventory……….…
Percent Under Contract ………….……
MAY 2011 MAY 2012 % CHANGE

$2,575,000
$715
9
17
305
223
16.1
5.57%
$1,455,000
$500
16
13
221
105
14.3
5.88%
-43.5%
-30.1%
77.8%
-23.5%
-27.5%
-53.0%
-10.9%
5.5%
MALIBU SFR
Median Price ……………………..…….
Average Price per Square Foot ….…
Properties Sold ……………………….
Properties Pending Sale ………………
Properties For Sale …………….……...
Days on Market (Pending Sale) ….…..
Month’s supply of Inventory……….…
Percent Under Contract ………….……
Median Price ……………………..…….
Average Price per Square Foot ….…
Properties Sold ……………………….
Properties Pending Sale ………………
Properties For Sale …………….……...
Days on Market (Pending Sale) ….…..
Month’s supply of Inventory……….…
Percent Under Contract ………….……
MAY 2011 MAY 2012 % CHANGE

$6,562,500
$3,640
3
5
116
477
20.8
4.31%
$4,367,500
$1,257
5
8
95
600
9.8
8.42%
-33.4%
-65.5%
66.7%
60.0%
-18.1%
25.8%
-53.1%
95.4%
MALIBU BEACH SFR
Median Price ……………………..…….
Average Price per Square Foot ….…
Properties Sold ……………………….
Properties Pending Sale ………………
Properties For Sale …………….……...
Days on Market (Pending Sale) ….…..
Month’s supply of Inventory……….…
Percent Under Contract ………….……
Median Price ……………………..…….
Average Price per Square Foot ….…
Properties Sold ……………………….
Properties Pending Sale ………………
Properties For Sale …………….……...
Days on Market (Pending Sale) ….…..
Month’s supply of Inventory……….…
Percent Under Contract ………….……
MAY 2011 MAY 2012 % CHANGE

$990,000
$436
5
3
44
75
12.3
6.82%
$1,355,000
$436
6
4
33
105
5.8
12.12%
36.9%
0.00%
20.0%
33.3%
-25.0%
40.3%
-53.4%
77.8%
MARINA DEL REY SFR
Median Price ……………………..…….
Average Price per Square Foot ….…
Properties Sold ……………………….
Properties Pending Sale ………………
Properties For Sale …………….……...
Days on Market (Pending Sale) ….…..
Month’s supply of Inventory……….…
Percent Under Contract ………….……
Median Price ……………………..…….
Average Price per Square Foot ….…
Properties Sold ……………………….
Properties Pending Sale ………………
Properties For Sale …………….……...
Days on Market (Pending Sale) ….…..
Month’s supply of Inventory……….…
Percent Under Contract ………….……
MAY 2011 MAY 2012 % CHANGE

$590,000
$363
19
19
238
71
10.5
7.98%
$534,000
$361
22
37
177
64
3.2
20.90%
-9.4%
-0.6%
15.8%
94.7%
-25.6%
-9.9%
-69.3%
161.8%
MARINA DEL REY CONDO
Median Price ……………………..…….
Average Price per Square Foot ….…
Properties Sold ……………………….
Properties Pending Sale ………………
Properties For Sale …………….……...
Days on Market (Pending Sale) ….…..
Month’s supply of Inventory……….…
Percent Under Contract ………….……
Median Price ……………………..…….
Average Price per Square Foot ….…
Properties Sold ……………………….
Properties Pending Sale ………………
Properties For Sale …………….……...
Days on Market (Pending Sale) ….…..
Month’s supply of Inventory……….…
Percent Under Contract ………….……
MAY 2011 MAY 2012 % CHANGE

$299,000
$198
19
28
142
61
3.7
19.72%
$278,300
$207
18
19
68
34
2.3
27.94%
-6.9%
4.5%
-5.3%
-32.1%
-52.1%
-44.8%
-37.0%
41.7%
MID LOS ANGELES SFR
Median Price ……………………..…….
Average Price per Square Foot ….…
Properties Sold ……………………….
Properties Pending Sale ………………
Properties For Sale …………….……...
Days on Market (Pending Sale) ….…..
Month’s supply of Inventory……….…
Percent Under Contract ………….……
Median Price ……………………..…….
Average Price per Square Foot ….…
Properties Sold ……………………….
Properties Pending Sale ………………
Properties For Sale …………….……...
Days on Market (Pending Sale) ….…..
Month’s supply of Inventory……….…
Percent Under Contract ………….……
MAY 2011 MAY 2012 % CHANGE

$471,375
$292
2
31
%
$357,500
$273
4
7
22
30
1.7
31.82%
-24.2%
-6.5%
100.0%
%
-29.0%
%
%
%
MID WILSHIRE SFR
Median Price ……………………..…….
Average Price per Square Foot ….…
Properties Sold ……………………….
Properties Pending Sale ………………
Properties For Sale …………….……...
Days on Market (Pending Sale) ….…..
Month’s supply of Inventory……….…
Percent Under Contract ………….……
Median Price ……………………..…….
Average Price per Square Foot ….…
Properties Sold ……………………….
Properties Pending Sale ………………
Properties For Sale …………….……...
Days on Market (Pending Sale) ….…..
Month’s supply of Inventory……….…
Percent Under Contract ………….……
MAY 2011 MAY 2012 % CHANGE

$470,000
$287
1
5
47
46
6.6
10.64%
$593,000
$194
6
6
22
86
2.2
27.27%
26.2%
-32.4%
500.0%
20.0%
-53.2%
85.4%
-67.2%
156.4%
NORTHRIDGE SFR
Median Price ……………………..…….
Average Price per Square Foot ….…
Properties Sold ……………………….
Properties Pending Sale ………………
Properties For Sale …………….……...
Days on Market (Pending Sale) ….…..
Month’s supply of Inventory……….…
Percent Under Contract ………….……
Median Price ……………………..…….
Average Price per Square Foot ….…
Properties Sold ……………………….
Properties Pending Sale ………………
Properties For Sale …………….……...
Days on Market (Pending Sale) ….…..
Month’s supply of Inventory……….…
Percent Under Contract ………….……
MAY 2011 MAY 2012 % CHANGE

$319,000
$205
1
5
%
$
$
5
6
44
0.2
83.33%
%
%
%
%
20.0%
%
%
%
NORTHRIDGE CONDO
Median Price ……………………..…….
Average Price per Square Foot ….…
Properties Sold ……………………….
Properties Pending Sale ………………
Properties For Sale …………….……...
Days on Market (Pending Sale) ….…..
Month’s supply of Inventory……….…
Percent Under Contract ………….……
Median Price ……………………..…….
Average Price per Square Foot ….…
Properties Sold ……………………….
Properties Pending Sale ………………
Properties For Sale …………….……...
Days on Market (Pending Sale) ….…..
Month’s supply of Inventory……….…
Percent Under Contract ………….……
MAY 2011 MAY 2012 % CHANGE

$1,627,500
$614
24
26
215
52
6.7
12.09%
$1,730,000
$651
23
22
169
43
5.8
13.02%
6.3%
6.0%
-4.2%
-15.4%
-21.4%
-17.9%
-14.2%
7.6%
PACIFIC PALISADES SFR
Median Price ……………………..…….
Average Price per Square Foot ….…
Properties Sold ……………………….
Properties Pending Sale ………………
Properties For Sale …………….……...
Days on Market (Pending Sale) ….…..
Month’s supply of Inventory……….…
Percent Under Contract ………….……
Median Price ……………………..…….
Average Price per Square Foot ….…
Properties Sold ……………………….
Properties Pending Sale ………………
Properties For Sale …………….……...
Days on Market (Pending Sale) ….…..
Month’s supply of Inventory……….…
Percent Under Contract ………….……
MAY 2011 MAY 2012 % CHANGE

$719,000
$495
23
16
106
26
5.5
15.09%
$673,000
$522
18
35
90
19
1.3
38.89%
-6.4%
5.5%
-21.7%
118.8%
-15.1%
-27.8%
-76.1%
157.6%
PALMS – MAR VISTA SFR
Median Price ……………………..…….
Average Price per Square Foot ….…
Properties Sold ……………………….
Properties Pending Sale ………………
Properties For Sale …………….……...
Days on Market (Pending Sale) ….…..
Month’s supply of Inventory……….…
Percent Under Contract ………….……
Median Price ……………………..…….
Average Price per Square Foot ….…
Properties Sold ……………………….
Properties Pending Sale ………………
Properties For Sale …………….……...
Days on Market (Pending Sale) ….…..
Month’s supply of Inventory……….…
Percent Under Contract ………….……
MAY 2011 MAY 2012 % CHANGE

$1,555,000
$688
13
22
143
37
5.1
15.38%
$2,360,057
$787
18
28
112
58
2.7
25.0%
51.8%
14.4%
38.5%
27.3%
-21.7%
55.6%
-47.9%
62.5%
SANTA MONICA SFR
Median Price ……………………..…….
Average Price per Square Foot ….…
Properties Sold ……………………….
Properties Pending Sale ………………
Properties For Sale …………….……...
Days on Market (Pending Sale) ….…..
Month’s supply of Inventory……….…
Percent Under Contract ………….……
Median Price ……………………..…….
Average Price per Square Foot ….…
Properties Sold ……………………….
Properties Pending Sale ………………
Properties For Sale …………….……...
Days on Market (Pending Sale) ….…..
Month’s supply of Inventory……….…
Percent Under Contract ………….……
MAY 2011 MAY 2012 % CHANGE

$710,000
$579
25
28
227
83
6.4
12.33%
$853,000
$706
32
45
146
76
1.9
30.82%
20.1%
21.9%
28.0%
60.7%
-35.7%
-8.1%
-70.6%
149.9%
SANTA MONICA CONDO
Median Price ……………………..…….
Average Price per Square Foot ….…
Properties Sold ……………………….
Properties Pending Sale ………………
Properties For Sale …………….……...
Days on Market (Pending Sale) ….…..
Month’s supply of Inventory……….…
Percent Under Contract ………….……
Median Price ……………………..…….
Average Price per Square Foot ….…
Properties Sold ……………………….
Properties Pending Sale ………………
Properties For Sale …………….……...
Days on Market (Pending Sale) ….…..
Month’s supply of Inventory……….…
Percent Under Contract ………….……
MAY 2011 MAY 2012 % CHANGE
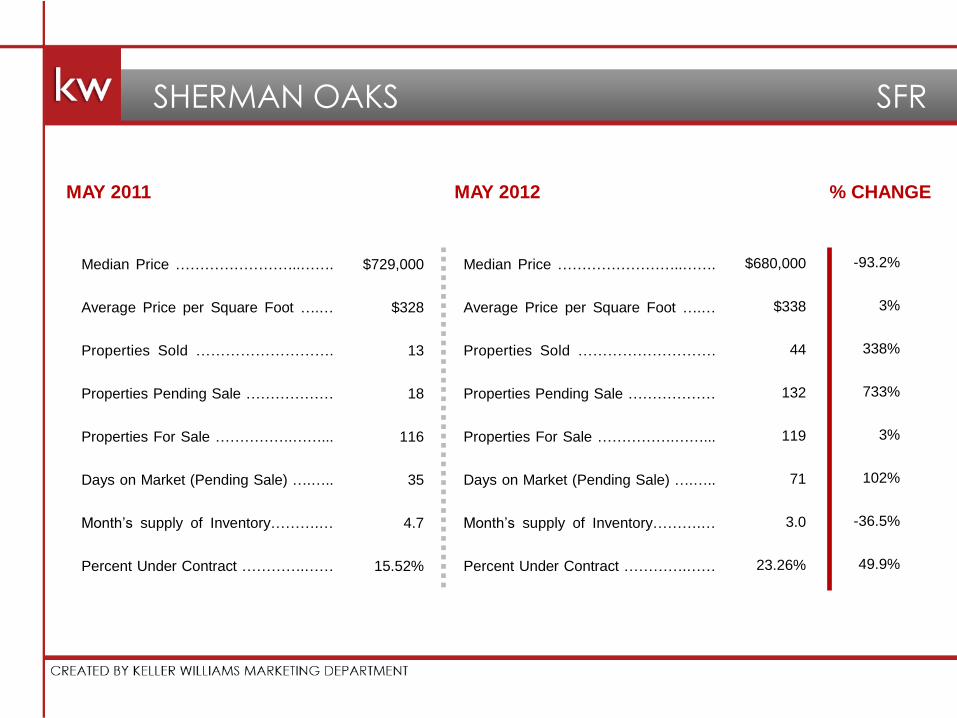
$729,000
$328
13
18
116
35
4.7
15.52%
$680,000
$338
44
132
119
71
3.0
23.26%
-93.2%
3%
338%
733%
3%
102%
-36.5%
49.9%
SHERMAN OAKS SFR
Median Price ……………………..…….
Average Price per Square Foot ….…
Properties Sold ……………………….
Properties Pending Sale ………………
Properties For Sale …………….……...
Days on Market (Pending Sale) ….…..
Month’s supply of Inventory……….…
Percent Under Contract ………….……
Median Price ……………………..…….
Average Price per Square Foot ….…
Properties Sold ……………………….
Properties Pending Sale ………………
Properties For Sale …………….……...
Days on Market (Pending Sale) ….…..
Month’s supply of Inventory……….…
Percent Under Contract ………….……
MAY 2011 MAY 2012 % CHANGE

$390,000
$283
4
2
44
63
17.0
4.55%
$261,000
$226
26
82
43
87
3.0
23.81%
-34.1%
-21%
650%
4,100%
-3%
276%
-82.4%
423.8%
SHERMAN OAKS CONDO
Median Price ……………………..…….
Average Price per Square Foot ….…
Properties Sold ……………………….
Properties Pending Sale ………………
Properties For Sale …………….……...
Days on Market (Pending Sale) ….…..
Month’s supply of Inventory……….…
Percent Under Contract ………….……
Median Price ……………………..…….
Average Price per Square Foot ….…
Properties Sold ……………………….
Properties Pending Sale ………………
Properties For Sale …………….……...
Days on Market (Pending Sale) ….…..
Month’s supply of Inventory……….…
Percent Under Contract ………….……
MAY 2011 MAY 2012 % CHANGE

$675,000
$412
12
22
117
40
3.9
18.80%
$480,250
$357
18
25
77
35
1.7
32.47%
-28.9%
-13.3%
50.0%
13.6%
-34.2%
-12.6%
-56.5%
72.7%
SILVER LAKE – ECHO PARK SFR
Median Price ……………………..…….
Average Price per Square Foot ….…
Properties Sold ……………………….
Properties Pending Sale ………………
Properties For Sale …………….……...
Days on Market (Pending Sale) ….…..
Month’s supply of Inventory……….…
Percent Under Contract ………….……
Median Price ……………………..…….
Average Price per Square Foot ….…
Properties Sold ……………………….
Properties Pending Sale ………………
Properties For Sale …………….……...
Days on Market (Pending Sale) ….…..
Month’s supply of Inventory……….…
Percent Under Contract ………….……
MAY 2011 MAY 2012 % CHANGE

$1,077,400
$392
10
14
82
38
4.1
17.07%
$908,000
$400
17
60
64
61
2.2
28.33%
-16%
2%
70%
428%
-22%
62%
-46.5%
66.0%
STUDIO CITY SFR
Median Price ……………………..…….
Average Price per Square Foot ….…
Properties Sold ……………………….
Properties Pending Sale ………………
Properties For Sale …………….……...
Days on Market (Pending Sale) ….…..
Month’s supply of Inventory……….…
Percent Under Contract ………….……
Median Price ……………………..…….
Average Price per Square Foot ….…
Properties Sold ……………………….
Properties Pending Sale ………………
Properties For Sale …………….……...
Days on Market (Pending Sale) ….…..
Month’s supply of Inventory……….…
Percent Under Contract ………….……
MAY 2011 MAY 2012 % CHANGE

$400,000
$248
3
29
%
$383,000
$298
13
30
21
88
2.0
28.57%
-5%
17%
330%
%
27.6%
%
%
%
STUDIO CITY CONDO
Median Price ……………………..…….
Average Price per Square Foot ….…
Properties Sold ……………………….
Properties Pending Sale ………………
Properties For Sale …………….……...
Days on Market (Pending Sale) ….…..
Month’s supply of Inventory……….…
Percent Under Contract ………….……
Median Price ……………………..…….
Average Price per Square Foot ….…
Properties Sold ……………………….
Properties Pending Sale ………………
Properties For Sale …………….……...
Days on Market (Pending Sale) ….…..
Month’s supply of Inventory……….…
Percent Under Contract ………….……
MAY 2011 MAY 2012 % CHANGE

$1,515,000
$601
29
30
323
75
8.9
9.29%
$1,279,000
$627
37
43
292
63
4.9
14.73%
-15.6%
4.3%
27.6%
43.3%
-9.6%
-14.9%
-44.4%
58.6%
SUNSET STRIP – HOLLYWOOD HILLS WEST SFR
Median Price ……………………..…….
Average Price per Square Foot ….…
Properties Sold ……………………….
Properties Pending Sale ………………
Properties For Sale …………….……...
Days on Market (Pending Sale) ….…..
Month’s supply of Inventory……….…
Percent Under Contract ………….……
Median Price ……………………..…….
Average Price per Square Foot ….…
Properties Sold ……………………….
Properties Pending Sale ………………
Properties For Sale …………….……...
Days on Market (Pending Sale) ….…..
Month’s supply of Inventory……….…
Percent Under Contract ………….……
MAY 2011 MAY 2012 % CHANGE

$1,550,000
$533
1
5
51
81
8.6
9.80%
$605,000
$630
7
10
32
106
1.7
31.25%
-61.0%
18.2%
600.0%
100.0%
-37.3%
31.1%
-80.2%
218.8%
SUNSET STRIP – HOLLYWOOD HILLS WEST CONDO
Median Price ……………………..…….
Average Price per Square Foot ….…
Properties Sold ……………………….
Properties Pending Sale ………………
Properties For Sale …………….……...
Days on Market (Pending Sale) ….…..
Month’s supply of Inventory……….…
Percent Under Contract ………….……
Median Price ……………………..…….
Average Price per Square Foot ….…
Properties Sold ……………………….
Properties Pending Sale ………………
Properties For Sale …………….……...
Days on Market (Pending Sale) ….…..
Month’s supply of Inventory……….…
Percent Under Contract ………….……
MAY 2011 MAY 2012 % CHANGE

$980,000
$424
9
6
84
98
12.2
7.14%
$841,250
$486
6
6
64
53
8.2
9.38%
-14.2%
14.6%
-33.3%
0.00%
-23.8%
-46.2%
-32.9%
31.3%
TOPANGA SFR
Median Price ……………………..…….
Average Price per Square Foot ….…
Properties Sold ……………………….
Properties Pending Sale ………………
Properties For Sale …………….……...
Days on Market (Pending Sale) ….…..
Month’s supply of Inventory……….…
Percent Under Contract ………….……
Median Price ……………………..…….
Average Price per Square Foot ….…
Properties Sold ……………………….
Properties Pending Sale ………………
Properties For Sale …………….……...
Days on Market (Pending Sale) ….…..
Month’s supply of Inventory……….…
Percent Under Contract ………….……
MAY 2011 MAY 2012 % CHANGE

$1,040,000
$702
14
13
134
54
8.5
9.7%
$850,000
$637
18
22
97
50
2.6
22.68%
-18.3%
-9.3%
28.6%
69.2%
-27.6%
-8.2%
-68.8%
133.8%
VENICE SFR
Median Price ……………………..…….
Average Price per Square Foot ….…
Properties Sold ……………………….
Properties Pending Sale ………………
Properties For Sale …………….……...
Days on Market (Pending Sale) ….…..
Month’s supply of Inventory……….…
Percent Under Contract ………….……
Median Price ……………………..…….
Average Price per Square Foot ….…
Properties Sold ……………………….
Properties Pending Sale ………………
Properties For Sale …………….……...
Days on Market (Pending Sale) ….…..
Month’s supply of Inventory……….…
Percent Under Contract ………….……
MAY 2011 MAY 2012 % CHANGE
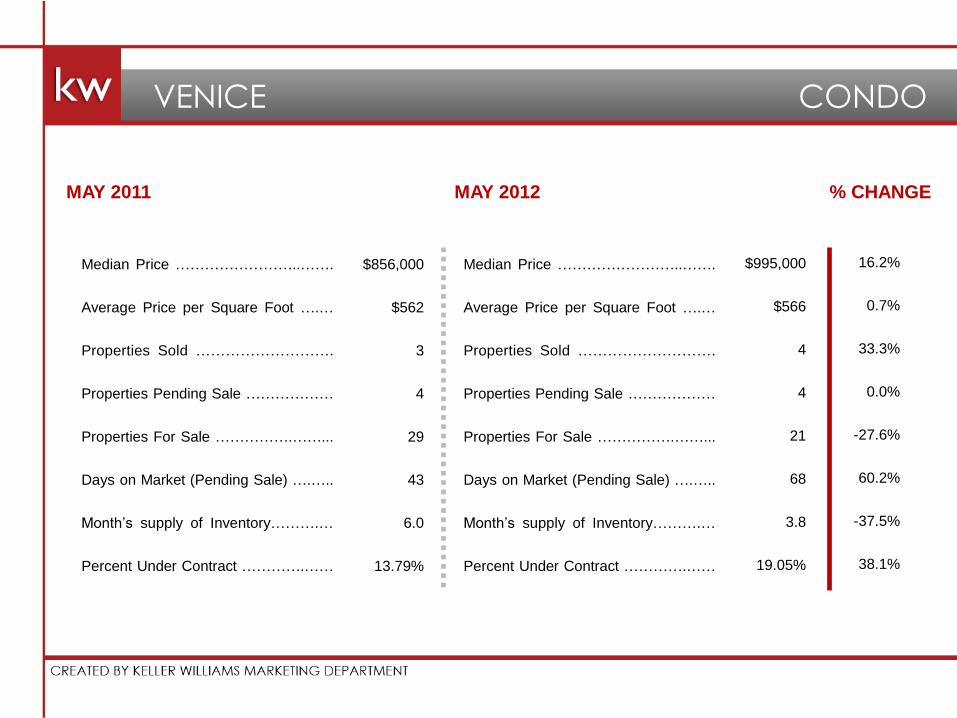
$856,000
$562
3
4
29
43
6.0
13.79%
$995,000
$566
4
4
21
68
3.8
19.05%
16.2%
0.7%
33.3%
0.0%
-27.6%
60.2%
-37.5%
38.1%
VENICE CONDO
Median Price ……………………..…….
Average Price per Square Foot ….…
Properties Sold ……………………….
Properties Pending Sale ………………
Properties For Sale …………….……...
Days on Market (Pending Sale) ….…..
Month’s supply of Inventory……….…
Percent Under Contract ………….……
Median Price ……………………..…….
Average Price per Square Foot ….…
Properties Sold ……………………….
Properties Pending Sale ………………
Properties For Sale …………….……...
Days on Market (Pending Sale) ….…..
Month’s supply of Inventory……….…
Percent Under Contract ………….……
MAY 2011 MAY 2012 % CHANGE

$1,327,500
$688
9
7
67
44
8.0
10.45%
$905,000
$582
12
10
43
68
3.1
23.26%
-31.8%
-15.4%
33.3%
42.9%
-35.8%
52.9%
-61.3%
122.6%
WEST HOLLYWOOD SFR
Median Price ……………………..…….
Average Price per Square Foot ….…
Properties Sold ……………………….
Properties Pending Sale ………………
Properties For Sale …………….……...
Days on Market (Pending Sale) ….…..
Month’s supply of Inventory……….…
Percent Under Contract ………….……
Median Price ……………………..…….
Average Price per Square Foot ….…
Properties Sold ……………………….
Properties Pending Sale ………………
Properties For Sale …………….……...
Days on Market (Pending Sale) ….…..
Month’s supply of Inventory……….…
Percent Under Contract ………….……
MAY 2011 MAY 2012 % CHANGE

$592,000
$411
26
24
249
84
8.7
9.64%
$395,000
$432
32
43
135
82
1.7
31.85%
-33.3%
5.1%
23.1%
79.2%
-45.8%
-2.6%
-80.5%
230.5%
WEST HOLLYWOOD CONDO
Median Price ……………………..…….
Average Price per Square Foot ….…
Properties Sold ……………………….
Properties Pending Sale ………………
Properties For Sale …………….……...
Days on Market (Pending Sale) ….…..
Month’s supply of Inventory……….…
Percent Under Contract ………….……
Median Price ……………………..…….
Average Price per Square Foot ….…
Properties Sold ……………………….
Properties Pending Sale ………………
Properties For Sale …………….……...
Days on Market (Pending Sale) ….…..
Month’s supply of Inventory……….…
Percent Under Contract ………….……
MAY 2011 MAY 2012 % CHANGE

$530,000
$456
7
7
49
45
5.4
14.29%
$580,000
$546
5
8
34
72
2.6
23.53%
9.4%
19.7%
-28.6%
14.3%
-30.6%
60.0%
-51.6%
64.7%
WEST LOS ANGELES SFR
Median Price ……………………..…….
Average Price per Square Foot ….…
Properties Sold ……………………….
Properties Pending Sale ………………
Properties For Sale …………….……...
Days on Market (Pending Sale) ….…..
Month’s supply of Inventory……….…
Percent Under Contract ………….……
Median Price ……………………..…….
Average Price per Square Foot ….…
Properties Sold ……………………….
Properties Pending Sale ………………
Properties For Sale …………….……...
Days on Market (Pending Sale) ….…..
Month’s supply of Inventory……….…
Percent Under Contract ………….……
MAY 2011 MAY 2012 % CHANGE

$664,000
$446
18
18
89
28
3.7
20.22%
$611,325
$390
22
24
71
26
1.7
33.80%
-7.9%
-12.6%
22.2%
33.3%
-20.2%
-7.1%
-54.1%
67.1%
WESTCHESTER SFR
Median Price ……………………..…….
Average Price per Square Foot ….…
Properties Sold ……………………….
Properties Pending Sale ………………
Properties For Sale …………….……...
Days on Market (Pending Sale) ….…..
Month’s supply of Inventory……….…
Percent Under Contract ………….……
Median Price ……………………..…….
Average Price per Square Foot ….…
Properties Sold ……………………….
Properties Pending Sale ………………
Properties For Sale …………….……...
Days on Market (Pending Sale) ….…..
Month’s supply of Inventory……….…
Percent Under Contract ………….……
MAY 2011 MAY 2012 % CHANGE

$
$
6
29
42
3.7
20.69%
$110,000
$159
1
3
16
45
4.3
18.75%
%
%
%
-50.0%
-44.8%
6.3%
18.2%
-9.4%
WESTCHESTER CONDO
Median Price ……………………..…….
Average Price per Square Foot ….…
Properties Sold ……………………….
Properties Pending Sale ………………
Properties For Sale …………….……...
Days on Market (Pending Sale) ….…..
Month’s supply of Inventory……….…
Percent Under Contract ………….……
Median Price ……………………..…….
Average Price per Square Foot ….…
Properties Sold ……………………….
Properties Pending Sale ………………
Properties For Sale …………….……...
Days on Market (Pending Sale) ….…..
Month’s supply of Inventory……….…
Percent Under Contract ………….……
MAY 2011 MAY 2012 % CHANGE

$1,199,500
$602
10
13
95
25
5.8
13.68%
$1,165,250
$602
22
18
78
32
2.7
23.08%
-2.9%
0.0%
120.0%
38.5%
-17.9%
28.9%
-54.4%
68.6%
WESTWOOD – CENTURY CITY SFR
Median Price ……………………..…….
Average Price per Square Foot ….…
Properties Sold ……………………….
Properties Pending Sale ………………
Properties For Sale …………….……...
Days on Market (Pending Sale) ….…..
Month’s supply of Inventory……….…
Percent Under Contract ………….……
Median Price ……………………..…….
Average Price per Square Foot ….…
Properties Sold ……………………….
Properties Pending Sale ………………
Properties For Sale …………….……...
Days on Market (Pending Sale) ….…..
Month’s supply of Inventory……….…
Percent Under Contract ………….……
MAY 2011 MAY 2012 % CHANGE

$541,250
$458
22
27
413
91
13.2
6.54%
$520,250
$434
48
33
279
92
6.5
11.83%
-3.9%
-5.2%
118.2%
22.2%
-32.4%
1.3%
-50.4%
80.9%
WESTWOOD – CENTURY CITY CONDO
Median Price ……………………..…….
Average Price per Square Foot ….…
Properties Sold ……………………….
Properties Pending Sale ………………
Properties For Sale …………….……...
Days on Market (Pending Sale) ….…..
Month’s supply of Inventory……….…
Percent Under Contract ………….……
Median Price ……………………..…….
Average Price per Square Foot ….…
Properties Sold ……………………….
Properties Pending Sale ………………
Properties For Sale …………….……...
Days on Market (Pending Sale) ….…..
Month’s supply of Inventory……….…
Percent Under Contract ………….……
MAY 2011 MAY 2012 % CHANGE

Glossary of Terms
Median Price: A value that separates the upper
half of prices from the lower half of prices. It can
be interpreted like an average, however the
extreme prices (high and low) don’t hold
undue.
Average Price per Square Foot: The price per
each property divided by their respective
square footage then averaged across all
properties sold in the area for a given time
period.
Properties Sold: The number of property
transactions that closed and transferred
ownership.
Properties Pending Sale: The number of
properties that entered escrow in preparation
for sale.
Properties For Sale: The number of properties on
the market and seeking buyers.
Days on Market (Pending Sale): The number of
days that properties currently in escrow were on
the market.
Absorption Rate: The rate at which the inventory
of home for sale are being sold.
Percent Under Contract: The ratio of properties
to properties sale.

Disclaimer
The Market Within A Market Report is brought to you by Regional Marketing Director, Michael Lewis.
Information obtained from Broker Metrics and DataQuick. Broker Metrics and DataQuick statistics are subject to change due to individual real estate company reporting disciplines.
The information provided herein is from sources we believe to be reliable. While we do not doubt its accuracy, we have not verified it and make no representations, guarantees or warranties about it. For More Information, Contact:
Michael Lewis Regional Marketing Director Keller Williams Realty 11812 San Vicente Blvd. Suite 100 Los Angeles, CA 90049 [email protected]