market price study cover - oregon state university
TRANSCRIPT

Independent. Healthy. Safe.
DHS: CHILDREN, ADULTS AND FAMILIES DIVISION
2010 OREGONCHILD CAREMARKET PRICE STUDYPrepared for Oregon Department of Human Services
Oregon State University Family Policy Program December 2010Oregon Child Care Research Partnership
Deana GrobeRoberta B. Weber

Acknowledgments
2010 Child Care Market Price Study has benefi ted greatly from the guidance and commitment of thesteering committee, comprised of the Oregon Child Care Research Partnership members. We gratefullyacknowledge the members of this committee. A special thanks goes to Becky Vorpagel for her expertiseand assistance with the OCCRRN database.
ContentsExecutive summary ......................................................................................................................................................IIntroduction ................................................................................................................................................................. 1
Data .......................................................................................................................................................................... 2Data selection ....................................................................................................................................................... 2Study population ................................................................................................................................................... 2Data source ........................................................................................................................................................... 2CCR&R 2010 database characteristics ................................................................................................................ 3
Data validity ............................................................................................................................................................. 4Methodological issues ................................................................................................................................................. 5
What is included in the data analysis ....................................................................................................................... 5Elimination of records without price data ............................................................................................................ 5Elimination of records not meeting the data currency standard .......................................................................... 5Combining certifi ed family care and center care ................................................................................................. 6Part-time preschool program prices .................................................................................................................... 6School-age school year and school-age summer prices ...................................................................................... 6Converted prices ................................................................................................................................................... 6
Price per child care slots .......................................................................................................................................... 7Geographically defi ned rate areas ............................................................................................................................ 7Child care accessibility .......................................................................................................................................... 10
Findings..................................................................................................................................................................... 13Year 2010 statewide child care prices .................................................................................................................... 13Year 2010 prices in geographic rate areas .............................................................................................................. 14
Comparison of statewide prices and prices in three rate areas ......................................................................... 14Comparison of rural-urban patterns in child care prices .................................................................................. 17Comparison of child care facility prices and child care slot prices ................................................................... 17
Comparison of 2010 market price data with previous market price data .............................................................. 21Comparison of geographic rate areas for 2008 and 2010 ................................................................................. 21Comparison of year 2010 data with previous market price data ....................................................................... 21
Child care accessibility .......................................................................................................................................... 23Percent of child care slots statewide that can be purchased at the licensed rate maximums ............................. 24Percent of facility care that can be purchased at the licensed rate maximums by ZIP code .............................. 24
Conclusions ............................................................................................................................................................... 26References ................................................................................................................................................................. 27
Appendices:A Glossary ......................................................................................................................................................... 29B Figures comparing 2010 rate areas and Oregon statewide prices .................................................................. 30C Statewide prices ............................................................................................................................................. 33D 2010 rate area prices ...................................................................................................................................... 36E Rate area maps ............................................................................................................................................... 45F Median county prices ..................................................................................................................................... 49G 2010, 2008, 2006, 2004, 2002 and 2000 rate areas for Oregon cities, counties and ZIP codes, sorted by city .................................................................................................................................................. 50H 2010, 2008, 2006, 2004, 2002 and 2000 rate areas for Oregon counties, cities and ZIP codes, sorted by county.............................................................................................................................................. 60


2010 OREGON CHILD CARE MARKET PRICE STUDYEXECUTIVE SUMMARY
Starting with the Family Support Act of 1988, federal funding requirements have stipulated that child caresubsidy rates be informed by market rates. In 1990 the federal government began a major investment inchild care with the passage of the Child Care and Development Block Grant Act. Support of parentalchoice was a key component of this block grant program that sent new money to states to support childcare. Parental choice and state control of policy remained central when the program was expanded in1996 as a part of welfare reform legislation. At that time, child care funding became known as the ChildCare and Development Fund (CCDF).
The present federal regulatory framework for market rate surveys was made public in the FederalRegister in August 1998 (45 CFR Parts 98 and 99). As part of this rule, states are required to conduct achild care “market rate survey” within two years of the effective date of their currently approved CCDFplan. Although these surveys are described as market rate surveys by the federal government, we use theterm market price survey because the title clearly distinguishes the process of collecting price data fromsetting maximum rates.
The purpose of federal policy in having states conduct a market price survey is to have states establishmaximum child care payment rates high enough to enable subsidy families to enter the child care marketin a competitive position to fi nd and afford care. A market price survey is a tool to be used by states tocollect up-to-date information on what facilities, within given geographic areas, charge parents forvarious types of child care. This information is then considered during the state budget process whenestablishing state subsidy rate policies for facilities that serve CCDF-eligible families. It should be notedthat the federal CCDF Final Rule is for a survey of the prices charged for child care, not a survey of thecosts of child care.
The 2010 Oregon Market Price Study identifi es child care prices and thegeographic distribution of these prices across the state. Prices vary by severalfactors including the age of child served, type of care (family child care, center,certifi ed family care), the local supply and demand for child care, and facilities’perceptions of the capacity of families to pay for care.
The 2010 Oregon Market Price Study examines geographic patterns in theprices charged by facilities by age of child served, type of care and pricingmodes (hourly, monthly, etc.). This study fulfi lls the federal requirement thatthe state complete a market price survey every two years.
Prior studies were completed in 1990, 1992, 1994, 1999, 2000, 2002, 2004, 2006 and 2008. As in past years, data collected through the local Child Care Resource and Referral (CCR&R) were used as the source of data. The data were created when local CCR&Rs collected price data from enrolled child care facilities for the price study. CCR&Rs also use price data to inform parents of facility charges as part of a referral process. The Oregon Child Care Resource and Referral Network (OCCRRN) compiles the data into a single database. In 1999, a sample of facilities were pulled from the OCCRRN database and surveyed by phone. In 2010 (as in years other than 1999) the price data from the OCCRRN database were analyzed. Prices charged by 4,107 family child care facilities, 891 centers and 458 certifi ed family facilities from every part of the state are included in the database.
Purpose of theMarket Price Study
Data source
2010 Oregon Child Care Market Price Study I
Executive summary

Between 1994 and 2010 statewide prices increased for most ages and types ofcare. In family child care the hourly price of toddler care has increased 71percent since 1994 while the center care monthly price increased 83 percent inthe same time period. Trends in child care prices are graphed below. Alsographed are the same trends in prices, but adjusted for infl ation (second graphfor each type of care). The family care graph shows no consistent pattern inprices after taking into consideration cost of infl ation. For center care, however,prices increased faster than infl ation between 1999 and 2004; for the most part,prices kept pace with infl ation from 2004 through 2008, and have increasedfaster than infl ation since 2008.
Trends in family child care prices (75th percentile)
Trends in family child care prices (75th percentile)adjusted for infl ation (all prices in 2010 dollars)
II 2010 Oregon Child Care Market Price Study
Findings
Sources: Market Price Surveys 1994, 1999, 2000, 2002, 2004, 2006, 2008, 2010.Note: The majority of family child care facilities charge by the hour.
Executive summary

2010 Oregon Child Care Market Price Study III
Findings(continued)
Trends in center child care prices (75th percentile)
Trends in center child care prices (75th percentile) adjustedfor infl ation (all prices in 2010 dollars)
Child care markets are local with variation among communities. Whenprices were analyzed by ZIP codes across Oregon, patterns around the stateappeared. Urban areas and university communities have higher prices than domore rural communities in the state. Some ZIP code areas have moved up ordown in child care prices over time. As in past studies, however, child careprices fall into three clusters or areas. The map of 2010 rate areas graphicallydepicts how the prices vary across the state (See map in Appendix E). Thesethree rate areas capture three distinct sets of prices regardless of type of care orage of child served.
Sources: Market Price Surveys 1994, 1999, 2000, 2002, 2004, 2006, 2008, 2010.Note: The majority of centers charge by the month.
Executive summary

The percent of slots that can be purchased with the value of DHS paymentrates decreased from 68 percent to 64 percent between 2008 and 2010. Theprimary explanation for this decrease is an increase in market prices as licensedrate maximums have remained at the 75th percentile of 2006 market prices formost licensed facilities. As authorized by the Oregon Legislature, DHS increased maximum subsidy rates to the 75th percentile of 2006 prices for most licensed facilities and authorized a copay reduction of 24 percent for parents asof October 2007.
The state subsidy or maximum payment rate affects parents’ access to all typesof child care in the community. The study explored access in two ways: (1)percent of slots statewide that can be purchased at the subsidy rate; and (2)percent of facility care by ZIP code that can be purchased at the subsidy rate.The second measure was created to determine if the amount of access varied bygeographic location. Findings include:
In Oregon, current licensed rate maximums are adequate to purchase • approximately 64 percent of child care toddler slots statewide (see Tablebelow). This was down 4 percent from the 2008 market price study, butsignifi cantly greater than years prior to 2008.
In much of Oregon now, current licensed rate maximums are adequate to• purchase a larger percentage of market child care (see table on p. V).
Findings on access by geographic location are shown in the table on page. Vand in the two maps on pages VI and VII.
“Percent of child care facilities where price is less than or equal to the• DHS licensed rate maximums, family care for toddlers, by ZIP code”
“Percent of child care facilities where price is less than or equal to the• DHS licensed rate maximums, center care for toddlers, by ZIP code”
In 19 percent of Oregon ZIP code areas that have prices, no care from family orcenter child care facilities can be purchased at the licensed rate maximums. In59 percent of ZIP code areas families can purchase over 50 percent of familychild care in the community at the licensed rate maximums, and in 60 percent ofZIP code areas families can purchase over 50 percent of center child care.
IV 2010 Oregon Child Care Market Price Study
Findings(continued)
Full-time, toddler,family and centercare
2000 2002 2004 2006 2008 2010
38% 24% 21% 26% 68% 64%
Percent of child care toddler slots that can bepurchased at the licensed rate maximums
Executive summary

2010 Oregon Child Care Market Price Study V
Percent of child care facilities where price is less thanor equal to the DHS licensed rate maximums
The DHS licensed rate maximums include both the amount families’ pay incopay and the DHS child care subsidy amount. As the maps on pages VI and VII show, the value of a child care subsidy, when combined with the family copay, does cover child care prices in the market in most parts of the state. Deeper colorsdesignate geographic areas in which the subsidy value is enough to cover theprices of few, if any, community child care facilities. Examination of themaps indicates that this is a statewide phenomenon rather than one limitedto urban areas.
The geographic price analysis identifi ed three geographic market area boundaries that are generally similar to those identifi ed in the previousmarket price studies.
DHS licensed rate maximums are adequate to purchase almost two-thirds (64 percent) of market child care slots statewide. In approximately 19 percent of ZIP code areas the DHS licensed rate maximums are not high enough topurchase market child care.
CCR&R data continues to provide a reliable and cost-effective source of datafor statewide market price studies.
Prices should continue to be reported for both child care facilities and slots.Analysis should be based on slots since this most accurately represents whatfamilies experience when purchasing care.
CCR&Rs should continue to collect price information in the mode(s) thatrefl ect how facilities charge.
Executive summary
Conclusions
Number ofZIP codes
459446578
Percent ofZIP codes
19%4%18%27%32%
Number ofZIP codes
222211058
Percent ofZIP codes
19%2%19%9%51%
Family care Center care
0%1% to 25%26% to 50%51% to 75%Greater than 75%
Note: The number of ZIP codes for center care is lower than family care because a larger number of ZIP code areas have family child care facilities than have centers.

Perc
ent o
f chi
ld c
are
faci
litie
s whe
re p
rice
is le
ss th
an o
r eq
ual t
o th
e D
HS
licen
sed
rate
max
imum
s,fa
mily
car
e fo
r to
ddle
rs, b
y Z
IP c
ode
VI
2010
Ore
gon
Chi
ld C
are
Mar
ket P
rice
Stud
y
Exec
utiv
e su
mm
ary

2010
Ore
gon
Chi
ld C
are
Mar
ket P
rice
Stud
y V
II
Exec
utiv
e su
mm
ary
Perc
ent o
f chi
ld c
are
faci
litie
s whe
re p
rice
is le
ss th
an o
r eq
ual t
o th
e D
HS
licen
sed
rate
max
imum
s,ce
nter
car
e fo
r to
ddle
rs, b
y Z
IP c
ode

INTRODUCTION
Starting with the Family Support Act of 1988, federal funding requirements have stipulated that child caresubsidy rates be informed by market rates.i In 1990 the federal government began a major investment inchild care with the passage of the Child Care and Development Block Grant Act of 1990 (42 U.S.C. 9858et seq). Support of parental choice was a key component of this block grant program that sent new moneyto states to support child care. Parental choice and state control of policy remained central when theprogram was expanded in 1996 as a part of welfare reform legislation. At that time, child care fundingbecame known as the Child Care and Development Fund (CCDF).
The present federal regulatory framework for market price surveys can be found in the CCDF Final Rule.This rule was made public in the Federal Register in August 1998 (45 CFR Parts 98 and 99). As part ofthis rule, states are required to conduct a child care market price survey within two years of the effectivedate of their currently approved CCDF plan.
Federal policy requires states to conduct market price surveys to establish maximum child care paymentrates high enough to enable subsidy families to enter in a competitive position in the child care market tofi nd and afford care. A market price survey is a tool to be used by states to collect up-to-date informationon what facilities, within given geographic areas, charge parents for various types of child care. Thisinformation is then considered during the state budget process when establishing state subsidy ratepolicies for providers who serve CCDF eligible families. It should be noted that the federal CCDF FinalRule is for a survey of the prices charged for child care, not a survey of the cost of child care.
In Oregon, the Department of Human Services (DHS) oversees the market price survey and recommendsa budget for establishing subsidy policies. As authorized by the 2007 Oregon Legislature, DHSimplemented a signifi cant policy change by increasing maximum subsidy rates to the 75th percentile of2006 prices for most licensed facilities and authorized a copay reduction of 24 percent for parents. Thispolicy change went into effect in October 2007.
DHS has undertaken market price studies in 1990, 1992, 1994, 1999, 2000, 2002, 2004, 2006 and 2008that furthered our knowledge of how the child care market operates.ii The objectives of the year 2010 Market Price Study were to use the methodology documented from previous market price studies to:
Identify current prices charged for child care (i.e., current market prices),1. Identify the geographic distribution of current child care market prices across the state, and2. Calculate the accessibility of child care for those receiving child care subsidies.3.
As a precursor to the current geographic price analysis, a steering committee was formed consisting ofDHS analysts and administrators, Oregon Employment Department Child Care Division administrators,child care resource and referral (CCR&R) representatives, and child care researchers. This committeeworked with the researchers to design and implement the study. This report also details the data sourceand methodology, reports on the 2010 market price analysis, identifi es geographic price areas, andcalculates child care accessibility.
1 2010 Oregon Child Care Market Price Study
Introduction
i Throughout this report, the term “market prices” or “price” is used to describe prices that are set in the open market by child care facilities. This is distinguished from the rate of payment established by DHS for reimbursing child care facilities.ii Ref. 1-9.

2010 Oregon Child Care Market Price Study 2
DATA
DATA SELECTION
Study population
The population of interest is the priced child care market in Oregon. Facilities within the priced child care market have two characteristics: (1) they charge parents a price; and (2) the price is established through an arm’s length transaction. In an arm’s length transaction the buyer and seller do not have a prior relationship or shared membership that is likely to affect the price charged.iii The priced market does not include facilities that limit their care to persons they know, as is commonly the case with family or friend caregivers.
Three major types of child care are included in the market price study: family child care homes, certifi ed family care and centers. Family child care facilities offer care to a small group of children in the caregiver’s own home. Certifi ed family care facilities provide care to a larger group of children, typically in a family home. In Oregon, these facilities must be certifi ed under state law and are required to meet certain standards not required of a registered family child care facility. Child care centers operate in a non-residential facility and must be certifi ed by the Employment Department’s Child Care Division unless they meet exemption criteria.
Data source
The study universe includes all child care facilities in the priced child care market. The majority offamily, friend and neighbor caregivers have a prior relationship with the parent; thus, if they do chargea price, it is not established at arm’s length. The price is likely to be infl uenced by the prior relationship.The vast majority of family, friends and neighbors are not part of the priced child care market.
Given that almost all centers, certifi ed family child care and family child care homes are captured inthe CCR&R database, the decision was made to use it for the 2010 Market Price Study. The ChildCare Divisions (CCD) child care licensing database was not considered because it is not designed tocapture facility price data. DHS’s provider database contains data on facilities that serve families whoreceive DHS child care subsidies. Some of these providers are enrolled with a CCR&R and/or regulatedby CCD. Most, however, provide care only to family members or friends who receive DHS subsidies forchild care. These facilities probably would not otherwise provide care, do not meet the arm’s lengthcriteria, and thus are not part of the priced child care market. The DHS facility database does not accuratelyrepresent the priced market and those facilities that are part of the priced market are likely to be includedin the CCR&R database.
In contrast, the vast majority of facilities in the CCR&R database offer care in the priced child caremarket. The CCR&R database was used in the 1992, 1994, 2000, 2002, 2004, 2006, and 2008 Oregonmarket price studies and has proven to be a reasonable source of price data in most communities.iv Thesample of facilities contacted for the 1999 telephone survey was also drawn from the CCR&R database.
Data
iii Grobe, et al.: 2008 (ref. 10).iv The 1992 Oregon Child-Care Rates: 1992 (ref. 2); Market Rate, 1994: 1995 (ref. 3); 2000 Oregon Child Care Market Rate Study: 2000 (ref. 5); 2002 Oregon Child Care Market Rate Study: 2003 (ref. 6); 2004 Oregon Child Care Market Rate Study: 2004 (ref.7); 2006 Oregon Child Care Market Rate Study: 2006 (ref. 8); 2008 Oregon Child Care Market Price Study: 2008 (ref. 9).

Data
3 2010 Oregon Child Care Market Price Study
Data include facility reports of their actual charges, thus it can be assumed that these data accuratelyrefl ect prices for child care. Finally, in preparation for the download of data for the price survey,CCR&R, call facilities to assure current information on prices and other facility characteristics. Giventhese characteristics, the 13 CCR&R databases were selected and combined to serve as the data sourcefor the current 2010 market price study.
The statewide CCR&R database of child care facilities is an aggregate of 13 local CCR&R databasesrepresenting all counties in Oregon. Child Care Resource and Referral (CCR&R) services in Oregonare provided by 13 independent, local agencies designated by the state. Each CCR&R is contracted toprovide services in one of 13 Service Delivery Areas (SDA). Most agencies are housed within a largerparent agency, such as a community action program or a community college. All Oregon CCR&Rs aremembers of the Oregon Child Care Resource and Referral Network (OCCRRN), which coordinates andsupports them in their efforts.
Each CCR&R uses a software program called NACCRRAware. As of January 2005 all CCR&Rs hadconverted from the previous database, CareFinder, to NACCRRAware. This database allows CCR&Rsto collect and store information on facilities and parents, and to match up parents seeking child care withcomplementary child care facilities. Each facility enrolled with a CCR&R is entered into the database.Information collected about facilities includes:
Basic data such as name, address, telephone number.•
Type of care, days and hours of care, numbers and ages of children served, license and/or registration • status, training and education of the family child care facility, and information on the care environment and curriculum.
Care charges (prices) for ages served.•
Information such as funding in addition to parent fees, in-kind space or grant support.•
These data elements are entered into the database. There is a major update of the database each year andminor updates each quarter. In addition, the database is updated whenever a facility notifi es the CCR&Rsof changes in prices or other information.
Every quarter, copies of the data in all local CCR&R databases are sent to the OCCRRN. For the marketprice survey, the CCR&Rs contact all facilities within a three-month period to collect current price data.The OCCRRN checks the data for accuracy, and then merges all of the data into one large database, fromwhich various statistical reports can be drawn. Each year, the OCCRRN fi nds additional uses for thiscentralized database. Currently, this database provides data for various research needs including the DHSMarket Price Survey, the child care benchmarks, and the Oregon Child Care Research Partnershipcommunity planning publication.
CCR&R 2010 database characteristics
The data for the year 2010 Market Price Study were downloaded from the 13 local CCR&R databasesin March 2010, and compiled into a single database by OCCRRN. These data contained 5,753 facilityrecords; 4,236 (74 percent) were family child care facilities, 1,050 (18 percent) centers, and 467 (8percent) certifi ed family care. After facility records without price data were eliminated, the fi nalstudy sample was 5,456 including 4,107 family care facilities, 891 centers and 458 certifi ed familycare. (See Methodological Issues for discussion of data that were and were not included in the marketprice study data analysis).

Data
2010 Oregon Child Care Market Price Study 4
DATA VALIDITY
Data are valid if they measure what they are intended to measure.v Basic to the validity of market pricestudy fi ndings is the extent to which the facilities from which price data are collected represent allfacilities with child care prices. Factors that affect the representativeness of market price study fi ndingsinclude: completeness of data, geographic representativeness, response rate, and currency of the data.On each of these indicators, the CCR&R 2010 database was assessed to be valid.
Data completeness. Data were very complete with few missing data points for critical variables. For • example, of the total sample of facilities, approximately 5 percent had no price data. Of this 5 percent, 42 percent were facilities (such as Head Start programs) who do not directly charge consumers and thus have no prices to report. The balance of missing price data resulted from facility refusal to submit prices for a variety of reasons. Reasons for refusals include complicated, variable prices or preferring to discuss prices directly with parents (see page 5 for further discussion). Overall, the price data were complete for 95 percent of the facilities in the CCR&R database.
Geographic representativeness. The CCR&R database included information gathered from all 36 Oregon • counties. By any measure, the geographic detail and sample size are adequate to represent the population of Oregon facilities that offer care in the priced child care market.vi
Response rate. Ninety-three percent of the prices in the R&R administrative dataset used for the • market price survey had been updated within a three-month period. (The response rate was 96 percent with a six-month standard).
Data currency. The data are gathered or updated by the state’s CCR&Rs each quarter and were downloaded • by OCCRRN for this study in March 2010, the end of the quarter prior to the market price study analysis. These data are based on complete declared prices that facilities are offering in the marketplace. Of the price data collected by the R&Rs and stored in the R&Rs’ database, 93 percent were collected between Jan. 1 and March 31, 2010, meeting a standard of three-month currency.
The CCR&R database provides data that are relevant to policy decision-making and facilitatescomparison of market prices over time. Use of the CCR&R database provides a fi nancially feasiblesource of price data that is large enough and comprehensive enough to reliably produce prices at bothlocal and state levels. CCR&R data have been used in previous market price surveys both in Oregon andin other states. Consistency in data source facilitates comparing market prices over time. Use of existingdatasets, such as the CCR&R database, decreases the costs and thus increases the feasibility of periodicdata collection and analysis.
In addition, the CCR&R database refl ects the complexity of the child care market. Less complexitywould oversimplify the market and the fi ndings. However, complexity is often confusing. It fallsto the analysis to ensure that fi ndings related to key policy variables can be easily understoodand interpreted.
v Building Results III: 1998 (ref. 11).vi Grobe, et al.: 2008 (ref. 10).

Methodological issues
5 2010 Oregon Child Care Market Price Study
METHODOLOGICAL ISSUES
WHAT IS INCLUDED IN THE DATA ANALYSIS
This section describes the data that were included in the market price study data analysis, discussing the following:
Elimination of records without price data;• Elimination of records not meeting the data currency standard;• Combining certifi ed family care and center care;• Part-time preschool program prices;• School-age school year and school-age summer prices;• Converted prices.•
Elimination of records without price data
Of the 5,750 records provided by the CCR&R database, atotal of 285 (5 percent) facility records were dropped fromthe study because these facilities had not reported any pricedata to the local CCR&Rs. Seven records were droppedbecause they were not a type of care being considered inthis study. Of the 285 facilities eliminated because of noprice data, 157 were centers; many of the excluded centerswere classifi ed as free programs to income eligible (such asHeart Start programs). In addition to the excluded centers,119 family child care homes and nine certifi ed family carehomes were eliminated because of no price data.
Omitted facilities had given several reasonsvii for not reporting price data (Table 1) to the CCR&R.
The most common reason was that the facility offered a free program for families who met specifi ed • income eligibility requirements. Head Start programs are examples of a no-fee program. Centers that do not have fees may require the parent to work at the center or participate in a program, or may have their costs reimbursed by grants or other agencies.
Facilities with variable prices are the third most frequently given reason for not submitting price data. • Facilities that have a variable price structure either negotiate prices with parents or use a sliding scale based on income or the parent’s ability to work at the center.
Not knowing the specifi c reason for missing price data was the second most frequent category.•
Elimination of records not meeting the data currency standard
In accordance with national guidance on market price surveys to states (Grobe et al., 2008), prices collected prior to the six-month data collection period were removed from the analyses fi le because these older prices could skew fi ndings. A total of 186 facility prices were updated prior to October 2009, six months before the data was downloaded for analysis.
vii The OCCRRN supplied specifi c reasons for no price data. When a reason for the no price data could not be determined, OCCRRN referred those providers back to the CCR&Rs for clarifi cation.
Category
Free program to income eligible
Negotiated prices or sliding scale
Specifi c reason unknown
Categorytotal
120
47
118
Table 1. Facilities not reporting price data (N=285)

Methodological issues
2010 Oregon Child Care Market Price Study 6
After records without price data and data not meeting the currency standard were eliminated, thefi nal study sample was 5,272 including 4,045 family care facilities, 773 centers and 454 certifi edfamily care facilities.
Combining certifi ed family care and center care
A central question when conducting the market price analysis was how to represent data for larger familychild care facilities known as certifi ed family care. Should there be a separate price category for certifi edfamily care? Or should certifi ed family care be combined with family or center care?
The decision on how to represent data for certifi ed family care is based on two factors: (1) the sample sizeof certifi ed family prices, and (2) the similarity of certifi ed family prices to family and center care prices.Similar to previous years, certifi ed family prices were separated from center and family care in the 2010data analysis. A suffi cient number of certifi ed family care homes (458) were included in the database tosupport separation of certifi ed family from other care settings for data analysis. In addition, becausecertifi ed family prices tend to be lower than the prices reported by centers, there was concern thatmerging the data for the two types of care may affect the price fi ndings for both certifi ed family careand centers (See Appendix C for detailed prices by facility type).
Part-time preschool program prices
Because part-time preschool programs are a different market from full-day centers for preschool-agechildren and have a different price structure, their prices should be calculated separately. However, thereare two issues regarding part-time preschool prices: the identifi cation of part-time prices in the CCR&Rdatabase, and the ability to interpret the prices when identifi ed. Recently, the CCR&Rs updated theirdatabases so that part-time preschool program prices could be identifi ed; however, the ability to interpretthe prices is still a concern. For example, part-time preschool program prices may have been based on twodays a week for 3-year-olds, three days a week for 4-year-olds, or only one day a week for someprograms regardless of age. Because of this issue, the current market price study did not examine parttimepreschool program prices. These prices are not included in the analysis of full-day program prices.
School-age school year and school-age summer prices
Because of improved data collection, the 2010 Market Price Study reports both school-age school yearand school-age summer prices. Prior to 2002, only school-age school year prices were reported. School-ageschool year prices are considered inherently part-time prices since they are typically based on before andafter-school care for 20 to 30 hours or less a week. School-age summer prices are full-time prices thatare most similar to preschool-age prices. CCR&R databases were reconfi gured to accurately capture bothschool year and summer prices.
Converted prices
One signifi cant change with the use of the NACCRRAware database is that facilities are able to reportprices in all the modes that they charge: hourly, daily, weekly, or monthly. In previous studies facilitieswere able to report in only one mode. The result is four independent, non-equivalent price modes. In the1992, 1994, and 1999 market price studies, formulas were used to convert all reported prices into onemode. For example, all hourly, daily, and weekly prices were converted into a monthly price usingconversion formulas. The intent was to simplify reporting and facilitate comparison of prices. Problemwith converted prices is their inability to convert accurately.viii There is no basis for assuming the length
viii Market Rates, 1994: 1995 (ref. 3).

Methodological issues
7 2010 Oregon Child Care Market Price Study
of a day or number of days that would be considered full-time. Further, converted prices do not recognizethat facilities who report only hourly prices may have systematically different prices than facilities whoreport prices by the day, week or month. In other words, facilities who charge on an hourly basis verylikely form a different child care market than those facilities who charge by the month, week or day.
Because of concerns with the accuracy of converted price data, no prices were converted in the year2010 data analysis. Rather, the prices were analyzed in the mode(s) that facilities reported them.
PRICE PER CHILD CARE SLOTS
The price per child care slots was calculated by weighting the reported prices by total facility capacity. The maximum number of children desired by the facility is used rather than regulated capacity, as many programs do not enroll to their legal capacity. Total age-group capacity was defi ned as the total capacity for a given age group — infants, toddlers, preschool-age, school-age school year, or school-age summer. The purpose of calculating the price per child care slot was to represent the actual prices available to consumers in the community, regardless of whether it was a large or small facility.
For centers and certifi ed family care homes, total age group capacity was used to weight care prices. Weighting prices by capacity is most important for centers, which vary extremely by size. Total agegroup capacity data were used because: (1) it is possible to collect data on total age group capacity for centers and certifi ed family care, and (2) age-group capacity used in conjunction with the prices of that age group most accurately refl ects weighted prices for that particular age group. For centers and certifi ed family care with missing age capacity data, age group capacity was estimated by calculating the proportion of total capacity from the available age group capacity data.
For family care providers, total capacity regardless of age of child served was used to weight care prices. Unlike centers licensed for a set capacity for each age group, family child care homes are licensed for a total capacity (with some restrictions such as no more than two children under age 2).
GEOGRAPHICALLY DEFINED RATE AREAS
One of the goals for the year 2010 Market Price Study was to identify the geographic distribution ofprices across the state. DHS seeks to set its allowable maximum subsidy rates so that families eligible forchild care subsidies have access comparable to other families in the general population. It is presumedthis access would be assured if the subsidy rates were set at the 75th percentileix of the market price withina geographically defi ned area.x
Geographic rate areas were initially established in the 1992 child care market price study by grouping ZIPcode areas in which facilities reported similar prices. These geographic rate areas were revised since thenusing methodology similar to that used in 1992. The basic ZIP code methodology used in previous marketprice studies was replicated again in the current year 2010 study. The steps used to identify geographicrate areas are summarized below and further detailed in Figure 1.
ix The preamble to the CCDF Final Rule suggests as a benchmark that rates established at least at the 75th percentile “would be regarded as providing equal access.” Ensuring equal access is one of three components outline in the federal regulations.
x Child Care and Development Fund Plan for the State of Oregon: FFY 2008-2009 (ref. 11); Child Care and Development Fund Final Rule: 1998 (ref. 12).

Methodological issues
2010 Oregon Child Care Market Price Study 8
Figure 1Steps to identify geographic rate areas
Step 1: Determine the age group price that best represents all age group prices.
1A Using family care data, the average hourly and monthly prices were calculated for each ZIP code, they were calculated separately for infants, toddlers, and preschool-age children in full-time care.
1B Using family care data, the average combined price for infants, toddlers, and preschool-age children in full-time care was calculated for each ZIP code.
1C The average combined price for the three age groups (1B), were compared to the average prices for each of the individual age groups (1A). Toddler prices were found to be the most representative of all age groups.
Step 2: For each ZIP code, calculate the 75th percentile toddler rate for both family and center care rate data. Repeat this process for all reporting modes (hourly, monthly, daily, weekly).
Step 3: For each pricing mode, sort data by the 75th percentile price and then rank.
Step 4: Group ZIP codes into rate areas based on similarity of prices.
4A 75th percentile hourly toddler price data, along with frequency distributions of the 75th percentile toddler price data, were used to classify ZIP codes into one of ten rate groups.
4B The ranking results for daily, weekly, and monthly toddler prices by ZIP code were reviewed. 75th percentile price data was replicated for other age groups. Detailed maps were produced exhibiting prices by ZIP code.
4C Other considerations in the identifi cation of geographic rate areas were sample size and the desire for consistency within city limits and counties.
Step 5: Information in Step 4 was used to identify geographically defi ned rate areas.

Methodological issues
9 2010 Oregon Child Care Market Price Study
Step 1 was to determine which age group prices were most representative of all age group prices. Usingfamily care data for each ZIP code area, a combined average price for infant, toddler and preschool agecare was calculated and compared to the average prices for each separate age group. (See Table 2 for asample of this comparison).
Toddler prices were found to be closest to thecombined price, and most representative of all agegroup prices. Thus toddler prices were selected as thebasis for grouping ZIP codes by price data. Toddlerprices were also used as the basis for grouping pricedata in previous studies.
Once toddler prices were selected to represent all agegroup prices, Step 2 was to calculate the 75th percentilefor toddler prices in each ZIP code area using familyand center care toddler price data. Certifi ed family carewas not used because of limited sample sizes by ZIPcode. This process was replicated for all pricing modes(hourly, monthly, daily, weekly).
Step 3 involved ranking the 75th percentile prices byZIP code for each pricing mode. These rankings madeit possible to identify ZIP codes with similar 75th
percentile prices. Table 3 provides an example of thefi ndings obtained from Steps 2 and 3 for ZIP code areasin the Portland metropolitan area.
Step 4 used the rankings found in Step 3 to groupsimilar prices for all ZIP code areas. Specifi cally,using the 75th percentile rankings, hourly toddlerprices were classifi ed into several price groups.
City
Table 2. Comparison of the average price combined for infants, toddlers andpreschool age to average prices by child age group, using family care data
ZIP code Averagea
hourlyprices
Averagefamilyinfanthourly
Averagefamilytoddlerhourly
Averagefamily
preschoolhourly
Averagea
monthlyprices
Averagefamilyinfant
monthly
Averagefamilytoddlermonthly
Averagefamily
preschoolmonthly
AuroraBeavercreekBeavertonAlohaAlohaBeaverton
970029700497005970069700797008
$2.00$2.63$2.85$2.26$2.32$2.50
13519113
$2.00$2.63$3.10$2.36$2.36$2.75
Nb Avg.price
13522134
$2.00$2.63$2.75$2.22$2.37$2.56
Nb Avg.price
13523145
$2.00$2.63$2.70$2.22$2.23$2.20
Nb Avg.price
$325$325$463$396$439$488
105673
$325-
$508$399$461$542
Nb Avg.price
105775
$325-
$478$396$446$480
Nb Avg.price
113776
$325$325$401$394$411$442
Nb Avg.price
a Average price across age groups (infants, toddlers, and preschool age children in full-time care) using family care data.b Sample size of providers with prices for that particular ZIP code.
Table 3. Example of ZIP codes ranked on 75th percentile for toddler hourly
prices, family care data
City ZIP code Toddler hourly prices at75th percentile, family care data
PortlandTigardb
PortlandTualatinBeavercreekBoringClackamasSherwoodPortlandTigardb
97219972249721497062970049700997015971409720497223
12345678910
Rankhourly
3364336418
Na
$4.70$4.00$3.50$3.25$3.00$3.00$3.00$3.00$3.00$3.00
75th
price
a Sample size of facilities with prices for that particular ZIP code. A single city may have several ZIP codes.b The city of Tigard has more than one ZIP code.

Methodological issues
2010 Oregon Child Care Market Price Study 10
To examine prices by geographic area, detailed color-coded maps exhibiting prices by ZIP code wereproduced from the data. The ranking procedures were repeated for daily, weekly, and monthly toddlerprices by ZIP code. This process was then replicated for all age groups.
Based on analysis of the resulting maps, the rate areas were further combined into one of three rate areas— Area A, the highest rate area; Area B, the moderate rate area; and Area C, the lowest rate area. RateAreas A, B, and C were then mapped by color-coding.
Following visual inspection of the color-coded rate maps of areas A, B, and C, areas were refi ned toassure consistency within cities. Price consistency within geographic or political boundaries was desiredto avoid “islands” of price discrepancy. For example, based on prices alone, one northeast Portland ZIPcode was originally assigned to Rate Area C. However, this ZIP code was fully surrounded by the balanceof Portland ZIP codes that were in Rate Area A. Child care markets are made up of parents and providerswho have access to one another. Within a city, a ZIP code does not operate as its own market as parentscommonly live in one ZIP code and access care in another ZIP code. A city represents a better option forapproximating a child care market. To refl ect Portland as a single child care market, this northeastPortland ZIP code is reassigned to Rate Area A. Similar decisions were made for ZIP codes in theEugene, Salem, and Bend areas.
In some geographic areas, very small sample sizes or records without price data limited reliability of thedata. In these cases, price patterns for neighboring ZIP codes and from previous market price studies wereused to identify current rate areas. For example, in eastern Oregon two ZIP codes originally identifi ed tobe in Rate Area B were surrounded by ZIP codes assigned to area C. The sample sizes for the discrepantZIP code areas were small, thus these ZIP code areas were reassigned to Rate Area C, to be consistentwith surrounding communities.
Step 5 was to propose the three geographic rate areas. These areas were then used as the basis for allsubsequent analyses.
CHILD CARE ACCESSIBILITY
In 2002, 2004, 2006, and 2008 the Oregon market price study was expanded to examine the relationshipbetween current market prices and state subsidy rates. This analysis was repeated in the 2010 study.There was interest in better understanding the accessibility of child care for those receiving child caresubsidies. Market price data were used to determine:
(1) percentage of slots statewide that can be purchased at or below the maximum subsidy rate, and(2) percentage of facility care by ZIP code that can be purchased at or below the maximum
subsidy rate. This measure was created to determine whether the amount of access varied by geographic location.
Percentage of slots statewide that can be purchased at or below the maximum subsidy rate
The data for this analysis included all of the facility data for rate areas identifi ed in Step 5 above (thisincluded all three rate areas: A, B, and C). Prices were included for toddler care, full-time hourly ormonthly, for both family and center care. Because toddler prices have been found to be the mostrepresentative of all age-group prices, they were selected as the basis for calculating child careaccessibility (see Table 4, Box A).

Methodological issues
11 2010 Oregon Child Care Market Price Study
Step 1 is to create a column of data to indicate the licensed rate maximums (LRM)xi for each facilitybased on the facility’s particular rate area (A, B, C), type of care (family or center), and mode of reportingprices (hourly or monthly) (see Table 4, Box A). This LRM was increased by 5 percent to provide a rangeof prices around the subsidy rate that would be considered accessible.
Step 2 involves creating an indicator variable (0, 1) for each observation to indicate whether the facilitiesprices are equal to, less than, or greater than the licensed rate maximums. Use 1 to indicate prices that areequal to or less than the licensed rate maximums; and 0 otherwise (see Table 4, Box B).
Step 3 is to create a weighted licensed rate maximum variable that multiplies the licensed rate maximumindicator variable by the number of child care slots for that particular facility (see Table 4, Box C).
In step 4, calculate the percentage of child care slots that can be purchased at the current state maximumpayment rate with the following formula (see Table 4, Box D):
1 – [(sum of total capacity – sum of licensed rate maximums (weighted))/sum of total capacity]
Percentage of facility care by ZIP code that can be purchased at or below the maximum subsidy rate
Using the same data that was created above, determine the sample size and mean of the licensed ratemaximum indicator variable by ZIP code. An example of a SAS statistical code to calculate the samplesize and mean by ZIP code is:
proc sort; by ZIP;run;
proc univariate noprint;by ZIP;var licensed_rate_maximum;output out=new n=ne mean=meane;run;
proc print data=new;run;
This will produce a percentage of facilities who are at or below the licensed rate maximum by ZIP code.
ix TAs authorized by the Oregon Legislature, DHS increased maximum subsidy rates to the 75th percentile of 2006 prices for most licensed facilities. This policy went into effect October 2007.

Prov
ider
ID
Tabl
e 4.
Exa
mpl
e of
met
hods
use
d to
cal
cula
te c
hild
car
e ac
cess
ibili
ty
Geo
grap
hic
rate
are
aTy
pe o
fca
reTo
tal
child
capa
city
Full-
Tim
eto
ddle
rpr
ice
Full-
Tim
eto
ddle
r pr
ice
unit
Lic
ense
d ra
tem
axim
um(L
RM
)su
bsid
y +
5%
LR
Min
dica
tor
LR
M(w
eigh
ted)
C10
5I8
49M
766
A63
2M
635
N32
8S1
72T9
52T4
45Z7
49X
979
A31
4I8
79O
258
P289
M29
1M
280
B68
9D
365
E786
F156
F157
A A A A A A A A A A B B B B B B C C C C C C
Fam
ilyFa
mily
Fam
ilyFa
mily
Fam
ilyFa
mily
Fam
ilyFa
mily
Fam
ilyFa
mily
Fam
ilyFa
mily
Fam
ilyFa
mily
Fam
ilyFa
mily
Cen
ter
Cen
ter
Cen
ter
Cen
ter
Cen
ter
Cen
ter
3 5 8 6 7 3 9 3 10 7 5 2 10 6 9 10 26 24 32 18 40 17 260
$7.0
0$6
.00
$5.0
0$5
.00
$5.0
0$5
.00
$5.0
0$5
.00
$2.2
5$2
.25
$3.5
0$3
.50
$3.5
0$2
22$2
40$2
50$3
90$3
90$3
92$4
00$4
19$4
19
hour
lyho
urly
hour
lyho
urly
hour
lyho
urly
hour
lyho
urly
hour
lyho
urly
hour
lyho
urly
hour
lym
onth
lym
onth
lym
onth
lym
onth
lym
onth
lym
onth
lym
onth
lym
onth
lym
onth
ly
$3.1
5$3
.15
$3.1
5$3
.15
$3.1
5$3
.15
$3.1
5$3
.15
$3.1
5$3
.15
$2.6
3$2
.63
$2.6
3$4
73$4
73$4
73$5
66$5
66$5
66$5
66$5
66$5
66
0 0 0 0 0 0 0 0 1 1 0 0 0 1 1 1 1 1 1 1 1 1
0 0 0 0 0 0 0 0 10 7 0 0 0 6 0 10 26 24 32 18 40 17 199
A B C$2.0
2 is
the
stat
e lic
ense
d ra
te
max
imum
(LR
M) s
ubsi
dy fo
r fa
mily
, ful
l-tim
e, h
ourly
todd
ler
care
in R
ate A
rea
B. T
his r
ate
incl
udes
a 5
per
cent
incr
ease
.
1 =
LRM
is g
reat
er th
an o
r equ
alto
faci
lity
full-
time
todd
ler r
ate
(e.g
., $4
73 >
$24
0)
LRM
(wei
ghte
d) =
[tot
al c
hild
capa
city
] * [L
RM
indi
cato
r]. F
orex
ampl
e, 4
0 *
1 =
40.
D
LRM
(wei
ghte
d) =
[tot
al c
hild
capa
city
] * [L
RM
indi
cato
r]. F
orex
ampl
e, 4
0 *
1 =
40.
2010
Ore
gon
Chi
ld C
are
Mar
ket P
rice
Stud
y 12
Met
hodo
logi
cal i
ssue
s

Findings
13 2010 Oregon Child Care Market Price Study
FINDINGS
YEAR 2010 STATEWIDE CHILD CARE PRICES
Statewide, full-time child care prices are shown in Table 5. These prices are based on the charges reportedby child care facilities to their local CCR&Rs. Specifi cally, Table 5 shows the full-time prices at the 75th
percentile of child care slots by type of care (family, center, certifi ed family), age of child served (infant,toddler, preschool-age, school-age school year, school-age summer), and by pricing modes (hourly, monthly).
The 75th percentile of prices is the price level at which 75 percent of child care slots may be purchased.For example, the 75th percentile of infant care prices is $560 for full-time, monthly family child care. Thismeans that statewide 75 percent of the infant slots may be purchased for $560 a month or less in familychild care settings.
Several trends in statewide child care prices are apparent in Table 5. Among these are the following:
Prices are generally lower for family child care than for centers and certifi ed family care regardless of age of • child served or pricing mode.
For all types of care, preschool and school-age prices are lower than infant and toddler care prices.•
Certifi ed family prices are more consistent with centers than family prices, especially for infant, toddler, and • preschool-age monthly prices. Although certifi ed family care homes are considered a type of family care, they are like centers in terms of regulation and policies.
These statewide fi gures are informative but do not capture the substantial range of prices found acrossOregon. Child care markets are local and prices differ substantially across the state. The next sectiondescribes the fi ndings of the geographic rate analysis that explored price differences across communities.
See Appendix C for complete results.
Table 5. Statewide full time pricesat the 75th percentile for child care slots
InfantTYPE OF CHILD CARE &PRICING MODE
Toddler Preschool-age School-age school year
School-age summer
$3.00$560
$5.00$1,044
$4.25$880
Family Hourly Monthly
Center Hourly Monthly
Certifi ed family Hourly Monthly
$3.00$528
$5.00$998
$4.00$800
$3.00$500
$4.10$807
$4.00$700
$3.00$450
$5.25$425
$4.00$500
$3.00$500
$4.00$718
$4.00$600

Findings
2010 Oregon Child Care Market Price Study 14
YEAR 2010 PRICES IN GEOGRAPHIC RATE AREAS
As described earlier, an analysis of prices by ZIP code was used to identify similar child care markets(see methodology in previous chapter). The result was the identifi cation of three rate areas:
These areas included ZIP codes that were similar to those identifi ed in the 1994, 2000, 2002, 2004, 2006 and 2008 market price studies. Rate areas A and B included a slight expansion; as these areas were expanded, Rate Area C was proportionally reduced.
Comparison of statewide prices and prices in three rate areas
To test the validity of the three rate areas (A, B, C), two different analyses were conducted. The fi rst measured the association of the geographic rate areas with demographic characteristics of Oregon counties. Overall, the results shown in Table 6 indicate that child care prices are most highly correlated with median housing costs (0.81) and median gross rent (0.78); with Area A prices being consistently associated with higher housing and rent costs, Area C are the lowest, and Area B ranges fall between areas A and C. These patterns continue but to a lesser extent for household income, urban/rural classifi cation, population and percent urban.
The second analysis compared Oregon statewide prices to prices in the three rate areas. If the areas were valid, within care type and age group served, Area A prices should exceed the statewide price, Area C prices should be lower than the statewide price, and Area B rates should approximate the statewide price. Figure 2 graphs compare the 75th percentile monthly prices per child care slot, across type of care, and age group (See Appendix B for complete fi gures).
Prices consistently differ by rate areas regardless of type of care or age of child served.• Area A rates are consistently the highest prices in the state; Area C prices are the lowest; and Area B prices fall between rates in areas A and C.
The greatest differences in prices by rate area were found for center care and certifi ed family care.• This is especially true for infant and toddler care prices. For example, in Area A the 75th percentile center care for infant care is $1,096 per month while in Area C this percentile price is $586 per month, a difference of $510 per month. Similarly, the 75th percentile price for infant care in certifi ed family homes is $1,000 in Area A while in Area C this price is $500 per month, a difference of $500 per month.
Family care prices showed only small differences by prices, by geographic areas.• Family care prices ranged from $600 in Area A to $450 in rate Area C for infant care. These price differences are approximately $150 per month, substantially less than the $510 to $500 differences observed in center and certifi ed care prices by rate area (reported above).
These patterns validated the rate areas and provide evidence of three different child care markets inOregon; these markets are also infl uenced by type of care provided.
Area A (higher range prices)
Area B (middle range prices)
Area C (lower range prices)
$2.77 up to $10.00
$2.41 up to $2.75
$1.00 up to $2.40
Hourly, 75th percentile toddler price range

15
2010
Ore
gon
Chi
ld C
are
Mar
ket P
rice
Stud
y
Tabl
e 6.
Geo
grap
hic
rate
are
as: A
ssoc
iatio
n w
ith d
emog
raph
ic c
hara
cter
istic
s of O
rego
n co
untie
s
Find
ings
Cou
nty
Ben
ton,
Cla
ckam
as, C
olum
bia,
Des
chut
es,
Hoo
d R
iver
, Lan
e, M
ultn
omah
, Was
hing
ton
Cla
tsop
, Coo
s, C
urry
, Dou
glas
, Jac
kson
, Lin
coln
,Li
nn, M
ario
n, P
olk,
Till
amoo
k, W
asco
, Yam
hill
Bak
er, C
rook
, Gill
iam
, Gra
nt, H
arne
y, Je
ffers
on,
Jose
phin
e, K
lam
ath,
Lak
e, M
alhe
ur, M
orro
w,
Sher
man
, Um
atill
a, U
nion
, Wal
low
a, W
heel
er
2008
rate
area
1=M
etro
2=M
icro
3=N
onco
re
% u
rban
Popu
latio
nM
edia
nm
onth
lyho
usin
g co
sts
Med
ian
mon
thly
rent
Med
ian
hous
ehol
din
com
e
A B C
1 to
2
1 to
3
2 to
3
43%
to 9
8%
24%
to 8
5%
0% to
70%
21,7
25 to
72
4,68
0
21,3
40 to
31
8,17
0
1,58
5 to
83
,665
$1,4
22 to
$1,
847
$1,1
36 to
$1,
534
$657
to $
1,39
7
$675
to $
878
$566
to $
794
$390
to $
743
$43,
614
to
$65,
862
$36,
454
to
$54,
868
$32,
231
to
$50,
173
Cor
rela
tion
fi ndi
ngs:
Chi
ld c
are
pric
es a
re m
ost h
ighl
y co
rrel
ated
with
hou
sing
cos
ts (0
.81)
and
rent
(0.7
8).
• C
hild
car
e pr
ices
are
less
hig
hly
corr
elat
ed w
ith m
etro
polit
an/m
icro
polit
an/n
onco
re (0
.72)
, •
hous
ehol
d in
com
e (0
.64)
, pop
ulat
ion
(0.6
1), a
nd p
erce
nt u
rban
(0.5
6).

2010
Ore
gon
Chi
ld C
are
Mar
ket P
rice
Stud
y 16
Find
ings
Figu
re 2
a
Com
pari
son
of 2
010
rate
are
as a
nd O
rego
n st
atew
ide
pric
es b
y ch
ild c
are
slot
s
Fam
ily c
are,
mon
thly
, 75th
per
cent
ileC
ente
r ca
re, m
onth
ly, 7
5th p
erce
ntile
Cer
tifi e
d fa
mily
car
e, m
onth
ly, 7
5th p
erce
ntile
Rate
are
asRa
te a
reas
Rate
are
as
a S
ee A
ppen
dix
B fo
r com
plet
e fi g
ures
.
Not
e: S
choo
l-age
scho
ol y
ear p
rices
are
inhe
rent
ly p
art-t
ime
pric
es b
ecau
se
they
typi
cally
refl e
ct 2
0-30
hou
rs o
f car
e pe
r wee
k, b
efor
e an
d af
ter s
choo
l.

Findings
17 2010 Oregon Child Care Market Price Study
Comparison of rural-urban patterns in child care prices
Overall, the geographic analysis showed the child care prices to be lower in rural areas of the state and higher in the Portland metropolitan area, parts of the Mid-Willamette Valley, and parts of Deschutes and Jackson counties.
- Rate Area A contains ZIP codes with the highest prices and has 53 percent of all child care facilities. Area A includes the Portland metropolitan area, Mt. Hood, Corvallis, Independence, Monmouth, Seal Rock, Eugene, Springfi eld, Ashland, Bend and Gold Hill.
- Rate Area B costs are most consistent with statewide average prices. Area B has 34 percent of all child care facilities, and includes the cities of Salem, Stayton, Astoria, Hammond, Coos Bay, Coquille, Lincoln City, Sweet Home, Sisters, Redmond, Medford, Roseburg, Albany, Woodburn, Halsey, Philomath, and areas outside the Portland metropolitan area and the Mid- Willamette Valley. Communities in Rate Area B, especially those around metropolitan areas, have experienced substantial population and economic growth since 1994. Several ZIP codes previously classifi ed in Area C have moved to Area B because of price increases.
- Rate Area C includes all communities not in Area A or Area B, including all of Oregon’s rural areas. Rate Area C includes 14 percent of all child care facilities.
Comparison of child care facility prices and child care slot prices
Tables 7, 8, and 9 compare statewide prices and prices in the three rate areas by type of care, by age ofchild served, and by price type (child care facility price or child care slot price). Slot prices weredetermined by multiplying the facility price by the maximum number of children desired by the facility(slots). This comparison was made to determine if the facility price or slot price differed systematically.
The 75th percentile levels for child care facility prices and child care slot prices were compared. Thiscomparison revealed that the prices are similar within age groups and facility type, whether these pricesare by facility or by child care slot.
Among family care, monthly facility prices and monthly slot prices were identical in 12 of the 15 • comparisons (Table 7, monthly 75th percentile prices, areas A, B and C, by child age). Where price differences were observed, slot prices were higher in two of the three cases than unweighted facility prices.
Among center care facilities in areas A and B, monthly prices for child care slots were higher than monthly • facility prices in four of the 10 comparisons (Table 8, monthly 75th percentile prices, areas A and B, by child age). Slot prices (four of the 10 comparisons) averaged $50 higher than the unweighted prices.
Among center care facilities in Area C, monthly prices for child care facilities were higher than monthly • slot prices in three (toddler, preschool-age, school-age school year, and school-age summer care) of the fi ve comparisons.
Among certifi ed family care, monthly facility prices and monthly slot prices were identical in seven of the • 15 comparisons (Table 9, monthly 75th percentile prices, areas A, B and C, by child age). In fi ve cases, slot prices were slightly higher than unweighted facility prices; in three cases, the slots prices were slightly lower than the unweighted facility price.

Findings
2010 Oregon Child Care Market Price Study 18
Table 7. 2010 rate areas compared to Oregon statewide prices for family child care
Rate Area A Rate Area B Rate Area C Oregon
Childcare
facilities
N=973$3.50$3.00
N=493$600$550
N=1101$3.25$3.00
N=539$600$522
N=1146$3.00$3.00
N=561$550$500
N=1128$3.00$3.00
N=322$500$402
N=701$3.00$3.00
N=360$529$495
Childcareslots
N=6111$3.50$3.00
N=3207$600$560
N=6881$3.50$3.00
N=3480$600$528
N=7197$3.25$3.00
N=3625$560$500
N=7155$3.00$3.00
N=2131$500$400
N=4364$3.10$3.00
N=2407$530$495
Childcare
facilities
N=900$3.00$2.50
N=529$500$450
N=963$3.00$2.50
N=566$480$450
N=977$2.85$2.50
N=588$458$425
N=943$2.75$2.50
N=371$400$350
N=597$2.85$2.50
N=348$450$400
Childcareslots
N=5321$3.00$2.50
N=3305$500$450
N=5693$3.00$2.50
N=3537$480$450
N=5809$3.00$2.50
N=3696$455$425
N=5735$2.85$2.50
N=2448$400$350
N=3662$3.00$2.50
N=2186$450$400
Childcare
facilities
N=416$2.75$2.50
N=123$450$425
N=449$2.50$2.25
N=138$450$400
N=461$2.50$2.25
N=137$425$400
N=471$2.50$2.00
N=82$400$349
N=348$2.50$2.25
N=97$400$395
Childcareslots
N=2438$2.75$2.50
N=759$450$425
N=2653$2.50$2.25
N=868$450$400
N=2728$2.50$2.25
N=861$425$400
N=2840$2.50$2.25
N=540$400$348
N=2158$2.50$2.25
N=633$400$395
Childcareslots
N=13,873$3.00$3.00
N=7271$560$500
N=15,230$3.00$2.70
N=7888$528$470
N=15,737$3.00$2.50
N=8185$500$450
N=15,736$3.00$2.50
N=5119$450$375
N=10,187$3.00$2.50
N=5226$500$450
INFANT
Hourly75th
50th
Monthly75th
50th
Hourly75th
50th
Monthly75th
50th
Hourly75th
50th
Monthly75th
50th
Hourly75th
50th
Monthly75th
50th
Hourly75th
50th
Monthly75th
50th
TODDLER
PRESCHOOL-AGE
SCHOOL-AGE SCHOOL YEAR
SCHOOL-AGE SUMMER
See Appendix D for complete results.

Findings
19 2010 Oregon Child Care Market Price Study
Table 8. 2010 rate areas compared to Oregon statewide prices for center care
Rate Area A Rate Area B Rate Area C Oregon
Childcare
facilities
N=19$7.25$5.00
N=132$1,039$903
N=24$6.50$4.58
N=179$992$880
N=47$5.30$4.00
N=243$788$690
N=45$5.75$4.30
N=157$430$350
N=22$5.75$4.00
N=102$704$605
Childcareslots
N=140$7.63$5.15
N=1290$1,096$940
N=271$7.00$4.95
N=2364$1,038$900
N=1482$6.00$4.00
N=9515$840$718
N=1442$5.75$5.00
N=5130$430$350
N=720$5.75$4.00
N=3416$750$625
Childcare
facilities
N=18$4.00$3.80
N=27$700$665
N=22$3.96$3.50
N=37$675$600
N=43$3.68$3.15
N=59$560$500
N=36$3.75$3.25
N=28$369$253
N=19$3.68$3.23
N=19$510$493
Childcareslots
N=95$3.96$3.50
N=179$700$665
N=166$3.96$3.50
N=298$675$600
N=1056$3.75$3.25
N=1375$550$495
N=637$3.75$3.40
N=729$280$199
N=436$3.75$3.40
N=399$510$493
Childcare
facilities
N=13$3.65$3.35
N=17$585$530
N=17$3.50$3.00
N=19$575$475
N=23$2.80$2.75
N=21$479$435
N=19$2.95$2.75
N=11$350$170
N=17$2.80$2.75
N=10$475$464
Childcareslots
N=82$4.50$3.50
N=167$586$460
N=136$3.70$3.50
N=232$555$483
N=431$3.00$2.75
N=449$479$430
N=460$2.95$2.85
N=271$185$170
N=374$2.95$2.75
N=312$472$350
Childcareslots
N=317$5.00$4.00
N=1636$1044$895
N=573$5.00$3.75
N=2894$998$866
N=2969$4.10$3.60
N=11,339$807$690
N=2539$5.25$3.75
N=6130$425$335
N=1530$4.00$3.25
N=4127$718$600
INFANT
Hourly75th
50th
Monthly75th
50th
Hourly75th
50th
Monthly75th
50th
Hourly75th
50th
Monthly75th
50th
Hourly75th
50th
Monthly75th
50th
Hourly75th
50th
Monthly75th
50th
TODDLER
PRESCHOOL-AGE
SCHOOL-AGE SCHOOL YEAR
SCHOOL-AGE SUMMER
See Appendix D for complete results.

Findings
2010 Oregon Child Care Market Price Study 20
Table 9. 2010 rate areas compared to Oregon statewide prices for certifi ed family care
Rate Area A Rate Area B Rate Area C Oregon
Childcare
facilities
N=47$5.00$4.00
N=117$925$860
N=50$4.00$4.00
N=150$845$745
N=57$4.50$4.00
N=156$745$680
N=61$4.00$4.00
N=63$600$450
N=40$4.00$3.75
N=61$600$588
Childcareslots
N=100$5.00$4.00
N=311$1,000$860
N=133$4.00$4.00
N=478$858$745
N=345$5.00$4.00
N=1201$750$688
N=340$4.00$4.00
N=363$600$450
N=241$4.00$4.00
N=357$600$600
Childcare
facilities
N=43$3.50$3.00
N=70$550$500
N=51$3.25$3.00
N=76$507$460
N=55$3.00$3.00
N=84$480$450
N=48$3.00$3.00
N=55$450$375
N=23$3.25$3.00
N=24$500$450
Childcareslots
N=95$3.50$3.00
N=151$550$500
N=125$3.00$3.00
N=176$534$475
N=347$3.00$3.00
N=537$500$450
N=229$3.25$3.00
N=243$450$375
N=142$3.25$3.00
N=156$500$450
Childcare
facilities
N=13$3.50$3.00
N=14$500$450
N=18$3.25$3.00
N=14$500$445
N=15$3.25$2.50
N=14$440$400
N=17$3.25$2.50
N=11$425$400
N=11$2.75$2.50
N=8$430$400
Childcareslots
N=35$3.50$3.00
N=40$500$450
N=55$3.50$3.00
N=44$500$450
N=75$3.00$2.50
N=79$425$400
N=90$3.25$2.50
N=60$420$268
N=65$3.00$2.50
N=45$420$400
Childcareslots
N=230$4.25$3.25
N=502$880$700
N=313$4.00$3.00
N=698$800$675
N=767$4.00$3.00
N=1817$700$575
N=659$4.00$3.00
N=666$500$400
N=448$4.00$3.00
N=558$600$500
INFANT
Hourly75th
50th
Monthly75th
50th
Hourly75th
50th
Monthly75th
50th
Hourly75th
50th
Monthly75th
50th
Hourly75th
50th
Monthly75th
50th
Hourly75th
50th
Monthly75th
50th
TODDLER
PRESCHOOL-AGE
SCHOOL-AGE SCHOOL YEAR
SCHOOL-AGE SUMMER
See Appendix D for complete results.

Findings
21 2010 Oregon Child Care Market Price Study
These fi ndings suggest that prices do not vary substantially whether reported as facility prices orweighted by the capacity (slots). Facilities with larger care capacity (those with more slots) did notcharge systematically higher or lower prices for care at the monthly, 75th percentile.
Given the relatively small and non-systematic differences found between facility prices and slot pricesat the 75th percentile monthly price, either could be used to represent costs of care. Because child careslot prices most accurately represent the prices available to consumers in the community, child careslot prices were used as the basis for graphs of prices as well as the basis for fi nal identifi cation ofgeographic rate areas.
COMPARISON OF 2010 MARKET PRICE DATA WITH PREVIOUS MARKET PRICE DATA
Comparison of geographic rate areas for 2008 and 2010
Two maps in Appendix E show (1) the year 2010 rate areas, and (2) the areas that have changedbetween the 2008 and 2010 market price studies. Overall, these maps indicate that based on analysisof current prices:
The majority (99 percent; 459) of Oregon ZIP code areas remain in the same rate area in 2010 as they • were in 2008. This refl ects stability in the geographic distribution of prices.
One percent (5) of ZIP codes moved into a higher rate area (i.e., from B to A, or from C to B) from 2008 • to 2010. These ZIP code areas include parts of the counties of Columbia, Coos, Douglas, Lincoln and the cities of St. Helens, Scappoose, Waldport, Myrtle Creek and North Bend.
No ZIP codes moved into a lower rate area based on prices in 2010.•
Appendix F provides the median toddler prices for all counties in Oregon by type of care and pricingmodes. Also available (see Appendix G) is a complete listing of Oregon ZIP codes, towns and cities, andcounties classifi ed by 2000, 2002, 2004, 2006, 2008 and 2010 rate areas. This information is fi rst sortedby cities, then by counties (see Appendix H).
Again it should be noted that the geographic rate areas are based on analytical fi ndings regardingcurrent prices. Other considerations, such as the possible effect on supply in ZIP code areas that fallfrom a higher to a lower rate area, were not considered.
Comparison of year 2010 data with previous market price data
To examine in more detail the changes in facility prices over the years, market price data in 1994, 1999,2000, 2002, 2004, 2006, 2008 and 2010 were compared (Table 10). Table 10 presents the statewide 50th
and 75th percentile full-time prices, by type of care, and by age groups served.

Findings
2010 Oregon Child Care Market Price Study 22
Table 10. Comparison: full-time prices at the 50th and 75th percentilesamong Oregon statewide child care slots
Infant
$1.75$2.00$2.00$2.25$2.50$2.50$3.00
$2.00$2.50$2.25$2.50$2.50$2.80$3.00$3.00
$475$540$610$675$749$828$895
$550$584$645$750$828$865$935
$1,044
Family care hourly50th percentilea
CCR&R 1994CCR&R 2000CCR&R 2002CCR&R 2004CCR&R 2006CCR&R 2008CCR&R 2010
75th percentileCCR&R 1994Survey 1999b
CCR&R 2000CCR&R 2002CCR&R 2004CCR&R 2006CCR&R 2008CCR&R 2010
Center care monthly50th percentilea
CCR&R 1994CCR&R 2000CCR&R 2002CCR&R 2004CCR&R 2006CCR&R 2008CCR&R 2010
75th percentileCCR&R 1994Survey 1999b
CCR&R 2000CCR&R 2002CCR&R 2004CCR&R 2006CCR&R 2008CCR&R 2010
Toddler Preschool-age
School-ageschool year
School-agesummer
$1.50$2.00$2.00$2.00$2.25$2.50$2.70
$1.75$2.25$2.05$2.35$2.50$2.50$3.00$3.00
$455$525$610$670$751$820$866
$544$571$640$745$820$865$938$998
$1.50$2.00$2.00$2.00$2.25$2.50$2.50
$1.75$2.00$2.00$2.25$2.50$2.50$3.00$3.00
$330$410$475$510$540$625$690
$383$440$495$565$625$667$737$807
$1.50c
$2.00$2.00$2.00$2.25$2.50$2.50
$1.65c
$2.00c
$2.00$2.25$2.50$2.50$3.00$3.00
$200c
$235$250$255$295$328$335
$285c
$252c
$295$305$315$395$410$425
-$1.75$2.00$2.00$2.25$2.50$2.50
--
$2.00$2.25$2.35$2.50$3.00$3.00
-$325$490$510$539$600$600
--
$370$535$600$666$700$718
a 50th percentile statewide prices were not available for the 1999 survey.b Child care facilities (unweighted facility prices).c Primarily school-age school year prices.

Findings
23 2010 Oregon Child Care Market Price Study
Similar data were not available for all years. Thus, to facilitate comparison across years, Table 10 usedthe following defi nitions and data:
“CCR&R” refers to data obtained in 1994 (5,889 providers), 2000 (6,504 providers), 2002 (6,308 providers), • 2004 (6,232), 2006 (5,882), 2008 (5,597), and 2010 (5,272) market price studies using price data given by facilities to their local CCR&R. “Survey 1999” refers to data collected from a random sample of 1,201 CCR&R enrolled providers, interviewed by telephone.
Child care slot prices are shown for 1994, 2000, 2002, 2004, 2006, 2008 and 2010 CCR&R studies only facility • data were available in 1999. Use of slot data facilitates the comparison of prices in those fi ve years.
For the 1999 telephone survey, only the 75• th percentile statewide prices for child care facilities (not weighted by capacity/child care slot prices) are available.
Hourly data is shown for family care; monthly prices are shown for center care. (The majority of family • facilities charge on an hourly basis for full-time care; most centers charge by the month.)
The complexity of the child care market and the variability of data and data reporting in past studiescomplicate defi ning patterns in costs of child care over time. Nevertheless, some patterns in statewidechild care prices are apparent in Table 10.
From 1994 to 2010, statewide prices rose for all ages and types of care.•
From 1994 to 2010, statewide prices increased more for center care than in family child care.•
For example, based on the 75th percentile of prices for infant care:
CCR&R reported monthly prices for center infant care rose from $550 (1994) to $1,044 (2010), a total ✔rise of $494 per month or 90 percent.
CCR&R reported hourly prices for family infant care rose from $2.00 (1994) to $3.00 (2010), an increase ✔of 50 percent. Compared to 2008 CCR&R data, 2010 price data remained the same for family, infant care.
Compared to 2008 CCR&R data, 2010 price data indicate a 12 percent increase in center care for infants ✔(from $935 in 2008 to $1,044 in 2010); family care hourly, 75th percentile price data did not change.
CHILD CARE ACCESSIBILITY
Findings show that from 1994 to 2010, statewide prices rose for most ages and types of care. Price increases ranged from a low of 49 percent to a high of 111 percent from 1994 to 2010. Since the 2008 Market Price Study the Oregon minimum wage has increased once from $7.95 to $8.40, a 45 cent increase.
The 2010 prices at the 75th percentile for the identifi ed rate areas were found to be more similar to DHS licensed rate maximums for all ages and types of care than in previous market price surveys besides 2008 (see Appendix D). This is primarily the result of policy changes in maximum rates effective Oct. 1, 2007.
To examine the relationship between current market prices and DHS subsidy rates in more detail, market price data were used to determine: (1) percent of slots statewide that can be purchased at or below the maximum subsidy rate, and (2) percent of facility care by ZIP code that can be purchased at or below the maximum subsidy rate. The second measure was created to determine if the amount of access varied by geographic location. Because toddler prices have been found to be the most representative of all age group prices, they were selected as the basis for calculating child care accessibility.

Findings
2010 Oregon Child Care Market Price Study 24
Percent of child care slots statewide that can be purchased at or below the licensed rate maximums
Table 11 shows that, currently, 64 percent of toddler, family and center care slots can be purchased at theDHS licensed rate maximums. This means that DHS subsidy rates give access to approximately two–thirdsof slots in the toddler care market. The percent of slots that can be purchased with the value of DHSpayment rates decreased from 68 percent to 64 percent between 2008 and 2010. The primary explanationfor this decrease is an increase in market prices as maximum subsidy rates have remained at the 75th
percentile of 2006 market prices for most licensed facilities.
Table 11. Percent of child care slots that can be purchased at the licensed rate maximums
Percent of facility care that can be purchased at or below the licensed rate maximums by ZIP code
Findings on access by geographic location are shown in Table 12 and on the last two maps in AppendixE. In 19 percent of Oregon ZIP code areas that have prices, no care from family child care facilities canbe purchased at the licensed rate maximums. Similarly in 19 percent of Oregon ZIP code areas that haveprices, the licensed rate maximums are not high enough to purchase any center child care. In about 59percent of ZIP code areas, families can purchase more than 50 percent of family child care in thecommunity at the licensed rate maximums, and in 60 percent of ZIP code areas families can purchasemore than 50 percent of center child care.
Table 12. Percent of child care facilities whose price is less thanor equal to the DHS licensed rate maximums
Full-time, toddler, familyand center care
2000 2002 2004 2006 2008 2010
38% 24% 21% 26% 68% 64%
Percent of child care toddler slots that can bepurchased at the licensed rate maximums
Number ofZIP codes
459446578
Percent ofZIP codes
19%4%18%27%32%
Number ofZIP codes
222211058
Percent ofZIP codes
19%2%19%9%51%
Family care Center care
0%1% to 25%26% to 50%51% to 75%Greater than 75%
Note: The number of ZIP codes for center care is lower than family care because of fewer centers throughout the state.

Findings
25 2010 Oregon Child Care Market Price Study
The DHS licensed rate maximums include both the amount families pay in copay and the DHS child caresubsidy amount. As can be seen on the maps in Appendix E, the value of a child care subsidy, when combined with the family copay, covers child care prices in the market in most parts of the state. Deeper colors designate geographic areas in which the enhanced subsidy value is enough to cover the prices of few, if any, community child care providers. Examination of the maps indicates that this is a statewide phenomenon rather than one limited to urban areas.

Conclusions
2010 Oregon Child Care Market Price Study 26
CONCLUSIONS
The geographic price analysis identifi ed three geographic market area boundaries that are generallysimilar to those identifi ed in the previous market price studies.
The market survey validates the existence of three different child care markets in Oregon. The areasincluded ZIP codes that were similar to those identifi ed in the 1994, 2000, 2002, 2004, 2006 and2008 market price studies. Based on overall market price increases, there are more ZIP codes in AreaA and Area B, and fewer for market rate Area C than found in the 2008 Market Price Study. Althoughthere are few changes to the rate areas in 2010, there is evidence of two trends: (a) the price range forrate Area A is widening, and (b) statewide prices are more closely representing Rate Area A thanArea B for some types of care. Future analyses may be needed to better understand these fi ndings.
DHS enhanced subsidy rates are adequate to purchase almost two-thirds (64 percent) of market childcare slots statewide. In approximately 19 percent of ZIP code areas, the DHS licensed rate maximumsare not high enough to purchase market child care.
The percent of slots that can be purchased with the value of DHS payment rates decreased from68 percent to 64 percent between 2008 and 2010. The primary explanation for this decrease is anincrease in market prices as maximum subsidy rates have remained at the 75th percentile of 2006market prices for most licensed facilities. The current market price study shows that 64 percent oftoddler, family and center care slots can be purchased at the DHS licensed rate maximums. Toassure that families eligible for child care subsidies have access to the child care market, Congressrecommended that payment rates be set at the 75th percentile of the market price. Currently, DHSenhanced subsidy rates are adequate to purchase almost two-thirds of market child care slotsstatewide. In 19 percent of family and center ZIP code areas, the DHS licensed rate maximums arenot adequate to purchase any market child care.
CCR&R data continue to provide a reliable and cost-effective source of data for statewide market price studies.
The statewide CCR&R database remains the most feasible source of data for the child care market price studies. First, the database is suffi ciently large and comprehensive to support analysis of statewide market prices. Second, it is representative of the child care priced market. Finally, it is a convenient, inexpensive and accessible data source.
Prices should continue to be reported for both child care facilities and slots. Analysis should bebased on slots since this most accurately represents what families experience when purchasing care.
Analysis demonstrated non-systematic differences between facility prices and child care slot(weighted) prices at the 75th percentile. Thus, either could be used to represent prices of care.However, because child care slots are believed to most accurately represent the prices available toconsumers in the community, they are recommended as the preferred method to report price data.
CCR&Rs should continue to collect price information in the mode(s) that refl ect how facilities charge.
The prices for the year 2010 market price study were reported for four independent, non-equivalentprice samples. Having only one common mode of reporting prices would simplify reporting andfacilitate comparison of prices. However, in reality, facilities charge in four different modes (hourly,daily, weekly, monthly). This diversity represents different child care markets and should be refl ected in the database and in the market price report. Other analyses have shown that conversions distortprice fi ndings (Grobe et al., 2008).

References
27 2010 Oregon Child Care Market Price Study
REFERENCES
Emlen, Arthur C. 1. Analysis of Child Care Rates in Oregon. Report for Adult & Family Services Division, Oregon Department of Human Resources. Portland, OR: Arthur Emlen & Associates, Inc. in cooperation with the Regional Research Institute for Human Services, Portland State University, March 1990.
Emlen, Arthur C. 2. The 1992 Oregon Child-Care Rates. Report for Adult & Family Services Division, Oregon Department of Human Resources. Portland, OR: Arthur Emlen & Associates, Inc. in cooperation with the Regional Research Institute for Human Services, Portland State University, September 30, 1992.
Emlen, Arthur C. 3. Market Rate, 1994: Sampling the Price of Child Care in Oregon. Report for Adult and Family Services Division, Oregon Department of Human Resources. Portland, OR: Arthur Emlen & Associates, Inc. in cooperation with the Regional Research Institute for Human Services, Portland State University, April 1995.
Tvedt, Karen, & Emlen, Arthur C. 4. 1999 Oregon Child Care Market Rate Study. Report for Adult and Family Services Division, Oregon Department of Human Resources. Portland, OR: Regional Research Institute for Human Services, Portland State University, March 1999.
Grobe, Deana, & Pratt, Clara C. 5. 2000 Oregon Child Care Market Rate Study. Report for Adult and Family Services Division, Oregon Department of Human Resources. Corvallis, OR: Family Policy Program, Oregon State University, September 2000.
Grobe, Deana, Pratt, Clara C., & Weber, Roberta B. 6. 2002 Oregon Child Care Market Rate Study. Report for Oregon Department of Human Services. Corvallis, OR: Family Policy Program, Oregon State University, January 2003.
Grobe, Deana, Pratt, Clara C., & Weber, Roberta B. 7. 2004 Oregon Child Care Market Rate Study. Report for Oregon Department of Human Services. Corvallis, OR: Family Policy Program, Oregon State University, August 2004.
Grobe, Deana, Weber, Roberta B., & Pratt, Clara C. 8. 2006 Oregon Child Care Market Rate Study. Report for Oregon Department of Human Services. Corvallis, OR: Family Policy Program, Oregon State University, August 2006.
Grobe, Deana, & Weber, Roberta B. 9. 2008 Oregon Child Care Market Rate Study. Report for Oregon Department of Human Services. Corvallis, OR: Family Policy Program, Oregon State University, August 2008.
Grobe, Deana, Weber, Roberta B., Davis, Elizabeth, E., Kreader, J. Lee, & Pratt, Clara C. 10. Study of Market Prices: Validating Child Care Market Rate Surveys. Technical Report. Corvallis, OR: Family Policy Program, Oregon State University, September 2008.
Pratt, C., Katzev, A., Ozretich, R. Henderson, T, & McGuigan, W. 11. Building Results III: Measuring Outcomes for Oregon’s Children, Youth, and Families. Prepared for The Oregon Commission on Children and Families, January 1998.
Child Care and Development Fund Plan for the State of Oregon. FFY 2008-2009. http://www.oregon.gov/12. EMPLOY/CCD/08-09StatePlan-Final100407.pdf.
Child Care and Development Fund; Final Rule. 45 CFR Parts 98 and 99, § 98.43, Comments. July 24, 1998.13.

APPENDICES

Glossary
29 2010 Oregon Child Care Market Price Study
Age of care — Age of child receiving care; the four different age groups are infant (under a year),toddler (12 - 24 months for family care, 12 - 30 months for center or group home care), preschool-age(2 - 5 years old for family care, 2 ½ - 5 years old for center or certifi ed family care), and school-age(5 years old and up).
Child care facility prices — Facility prices for care as reported to their local CCR&R.
Child care slots — Represents the cost per child care slot.
Total facility capacity — Maximum number of children desired by the facility.Total age group capacity — Total capacity for a given age group (infants, toddlers,preschool-age, school-age school year or school-age summer).
Cost of care — Facilities’ costs to provide child care that are often greater than the pricecharged to parents.
Family copay – The portion of the child care fee paid by parents.
Market price or prices — Prices that are set in the priced child care market by facilities.
Priced child care market — Facilities within the priced child care market have two characteristics: (1)they charge parents a price, and (2) the price is established through an arm’s length transaction. In anarm’s length transaction the buyer and seller do not have a prior relationship or shared membership thatis likely to affect the price charged. The priced market does not include facilities that limit care topersons they know, as is commonly the case with family or friend caregivers.
Pricing modes — The various ways prices can be reported: hourly, daily, weekly, monthly.
75th percentile — The price level at which 75 percent of child care slots may be purchased.
Licensed rate maximums — The DHS maximum subsidy rates that have been in effect since October 2007.
Type of care — Care setting or facility.
Family child care — Provided in the provider’s home; small group of children; relative or nonrelative provider.Center care — Full or part-time care and education; provided by caregivers/teachers always located in building other than home.Certifi ed family care — One or more caregivers; no more than 16 children at any one time; care provided in home setting.
A

2010
Ore
gon
Chi
ld C
are
Mar
ket P
rice
Stud
y 30
Figu
res
Figu
re I.
Com
pari
son
of 2
010
rate
are
as a
nd O
rego
n st
atew
ide
pric
es b
y ch
ild c
are
slot
s for
fam
ily c
are
Hou
rly,
50th
per
cent
ileH
ourl
y, 7
5th p
erce
ntile
Mon
thly
, 50th
per
cent
ile
Rate
are
asRa
te a
reas
Rate
are
as
Mon
thly
, 75th
per
cent
ile
Rate
are
as
B

31
2010
Ore
gon
Chi
ld C
are
Mar
ket P
rice
Stud
y
Figu
res
Figu
re II
.C
ompa
riso
n of
201
0 ra
te a
reas
and
Ore
gon
stat
ewid
e pr
ices
by
child
car
e sl
ots f
or c
ente
r ca
re
Hou
rly,
50th
per
cent
ileH
ourl
y, 7
5th p
erce
ntile
Mon
thly
, 50th
per
cent
ile
Rate
are
asRa
te a
reas
Rate
are
as
Mon
thly
, 75th
per
cent
ile
Rate
are
as
B

2010
Ore
gon
Chi
ld C
are
Mar
ket P
rice
Stud
y 32
Figu
res
Figu
re II
I.C
ompa
riso
n of
201
0 ra
te a
reas
and
Ore
gon
stat
ewid
e pr
ices
by
child
car
e sl
ots f
or c
ertifi
ed
fam
ily c
are
Hou
rly,
50th
per
cent
ileH
ourl
y, 7
5th p
erce
ntile
Mon
thly
, 50th
per
cent
ile
Rate
are
asRa
te a
reas
Rate
are
as
Mon
thly
, 75th
per
cent
ile
Rate
are
as
B

Statewide prices
33 2010 Oregon Child Care Market Price Study
2010 prices for family child care
Child care facilities(Unweighted)
Child care slots(Weighted by total capacity)
Hourly
N=2290$3.75$3.00$3.00$2.75$2.50$2.20
N=2514$3.50$3.00$3.00$2.64$2.50$2.00
N=2585$3.50$3.00$2.75$2.50$2.25$2.00
N=2544$3.50$3.00$2.75$2.50$2.25$2.00
N=1647$3.50$3.00$2.85$2.50$2.40$2.00
INFANT
90th
75th
60th
50th
25th
10th
TODDLER
90th
75th
60th
50th
25th
10th
PRESCHOOL-
AGE
90th
75th
60th
50th
25th
10th
SCHOOL-AGE
SCHOOL YEAR
90th
75th
60th
50th
25th
10th
SCHOOL-AGE
SUMMER
90th
75th
60th
50th
25th
10th
C
Daily
N=697$36$30$30$28$25$20
N=749$35$30$29$25$25$20
N=762$35$30$25$25$22$20
N=553$30$25$22$20$15$10
N=508$30$30$25$25$20$18
Weekly
N=311$175$150$135$125$113$100
N=351$175$150$130$125$108$100
N=380$160$140$125$125$100$ 93
N=248$140$120$100$100$70$50
N=245$150$125$125$120$100$90
Monthly
N=1145$600$550$500$493$432$400
N=1244$600$525$500$466$425$400
N=1287$600$500$475$450$400$375
N=775$500$450$400$375$290$200
N=805$550$500$450$440$400$350
Hourly
N=13,873$4.00$3.00$3.00$3.00$2.50$2.20
N=15,230$3.50$3.00$3.00$2.70$2.50$2.00
N=15,737$3.50$3.00$3.00$2.50$2.27$2.00
N=15,736$3.50$3.00$2.75$2.50$2.25$2.00
N=10,187$3.50$3.00$3.00$2.50$2.50$2.00
Daily
N=4853$35$30$30$28$25$20
N=5183$35$30$29$25$25$20
N=5295$35$30$25$25$22$20
N=3935$30$25$22$20$15$10
N=3561$30$30$25$25$20$20
Weekly
N=2123$175$150$135$125$110$100
N=2370$175$150$130$125$106$100
N=2621$160$140$125$125$100$90
N=1750$135$120$100$95$65$50
N=1717$150$125$125$120$100$90
Monthly
N=7271$625$560$500$500$450$400
N=7888$600$528$500$470$425$400
N=8185$600$500$475$450$400$380
N=5119$500$450$400$375$280$200
N=5226$550$500$450$450$400$350

Statewide prices
2010 Oregon Child Care Market Price Study 34
2010 prices for center care
Child care facilities(Unweighted)
Child care slots(Weighted by total capacity)
Hourly
N=50$7.13$5.00$4.25$3.96$3.50$2.78
N=63$6.00$4.50$3.90$3.71$3.00$2.75
N=113$5.30$4.00$3.68$3.50$2.85$2.50
N=100$5.88$4.30$3.75$3.50$2.85$2.50
N=58$5.75$3.95$3.40$3.12$2.75$2.50
INFANT
90th
75th
60th
50th
25th
10th
TODDLER
90th
75th
60th
50th
25th
10th
PRESCHOOL-
AGE
90th
75th
60th
50th
25th
10th
SCHOOL-AGE
SCHOOL YEAR
90th
75th
60th
50th
25th
10th
SCHOOL-AGE
SUMMER
90th
75th
60th
50th
25th
10th
Daily
N=23$75$60$42$40$35$30
N=28$70$45$40$38$30$25
N=45$50$37$35$30$25$21
N=45$38$27$25$20$12$7
N=38$40$34$31$30$25$21
Weekly
N=54$312$265$255$238$195$155
N=58$308$260$250$236$190$150
N=71$226$203$185$178$150$112
N=59$143$120$108$97$78$71
N=79$217$188$175$160$135$106
Monthly
N=176$1,155$995$900$866$675$550
N=235$1,096$931$880$800$621$500
N=323$883$750$675$645$510$435
N=196$541$425$365$335$262$170
N=131$760$685$605$575$455$376
Hourly
N=317$8.00$5.00$4.50$4.00$3.50$3.00
N=573$7.00$5.00$3.96$3.75$3.15$3.00
N=2969$6.00$4.10$3.75$3.60$3.00$2.63
N=2539$8.00$5.25$4.00$3.75$2.95$2.50
N=1530$7.00$4.00$3.50$3.25$2.80$2.50
Daily
N=158$75$60$42$42$35$35
N=298$70$60$40$39$33$28
N=1179$50$40$35$30$26$20
N=1162$37$28$25$21$12$7
N=899$40$35$33$30$25$21
Weekly
N=585$316$270$260$255$228$187
N=1031$312$268$256$245$210$155
N=3602$233$214$195$185$162$125
N=2107$180$121$115$100$85$75
N=3577$224$195$185$175$145$120
Monthly
N=1636$1,200$1,044$940$895$699$575
N=2894$1,159$998$900$866$650$530
N=11,339$950$807$725$690$575$449
N=6130$605$425$355$335$232$125
N=4127$883$718$625$600$472$375
C

Statewide prices
35 2010 Oregon Child Care Market Price Study
2010 prices for certifi ed family care
Child care facilities(Unweighted)
Child care slots(Weighted by total capacity)
Hourly
N=103$5.00$4.25$4.00$3.25$2.75$2.50
N=119$5.00$4.00$3.25$3.00$2.75$2.50
N=127$5.00$4.00$3.25$3.00$2.50$2.25
N=126$5.00$4.00$3.25$3.00$2.50$2.25
N=74$5.00$4.00$3.25$3.00$2.75$2.50
INFANT
90th
75th
60th
50th
25th
10th
TODDLER
90th
75th
60th
50th
25th
10th
PRESCHOOL-
AGE
90th
75th
60th
50th
25th
10th
SCHOOL-AGE
SCHOOL YEAR
90th
75th
60th
50th
25th
10th
SCHOOL-AGE
SUMMER
90th
75th
60th
50th
25th
10th
C
Daily
N=98$45$40$35$34$28$25
N=115$45$36$35$32$27$25
N=125$40$35$33$30$25$25
N=83$35$30$25$25$16$15
N=74$40$33$30$25$25$20
Weekly
N=49$225$200$175$160$135$115
N=115$45$36$35$32$27$25
N=61$180$160$150$140$125$111
N=37$173$125$100$100$85$70
N=33$177$150$135$125$115$ 00
Monthly
N=201$975$860$725$600$500$450
N=240$875$750$698$600$475$427
N=254$775$688$615$550$450$400
N=129$600$500$450$400$300$220
N=93$620$600$550$500$425$375
Hourly
N=230$5.00$4.25$4.00$3.25$2.75$2.50
N=313$5.00$4.00$3.25$3.00$2.75$2.50
N=767$5.00$4.00$3.25$3.00$2.75$2.50
N=659$5.00$4.00$3.50$3.00$2.75$2.50
N=448$5.00$4.00$3.50$3.00$2.75$2.50
Daily
N=230$45$40$35$35$30$25
N=329$45$38$35$35$28$25
N=874$40$35$34$30$25$25
N=471$35$30$25$25$17$15
N=446$40$33$29$25$25$20
Weekly
N=116$225$200$180$168$135$125
N=175$200$180$175$170$130$124
N=451$175$160$150$140$125$111
N=228$158$125$100$100$85$75
N=208$177$150$135$125$110$100
Monthly
N=502$1,100$880$770$700$500$450
N=698$1,100$800$745$675$500$450
N=1817$817$700$650$575$475$400
N=666$600$500$450$400$275$220
N=558$620$600$550$500$440$375

2010
pri
ces b
y 20
10 r
ate
area
s for
fam
ily c
hild
car
e
Rat
e Are
a A
Rat
e Are
a B
Rat
e Are
a C
Faci
litie
s
N=9
73$4
.50
$3.5
0$3
.00
$3.0
0$2
.75
$2.5
0
N=4
93$7
00$6
00$5
60$5
50$5
00$4
50
N=1
101
$4.0
0$3
.25
$3.0
0$3
.00
$2.6
4$2
.17
Slot
s
N=6
111
$4.5
0$3
.50
$3.0
0$3
.00
$2.8
5$2
.50
N=3
207
$700
$600
$560
$560
$500
$450
N=6
881
$4.5
0$3
.50
$3.0
0$3
.00
$2.6
4$2
.00
Lic
ense
d ra
tem
axim
ums
$3.0
0
$560
$3.0
0
Faci
litie
s
INFA
NT
Hou
rly
90th
75th
60th
50th
25th
10th
Mon
thly
90th
75th
60th
50th
25th
10th
TO
DD
LE
R
Hou
rly
90th
75th
60th
50th
25th
10th
Lic
ense
d ra
tem
axim
ums
$2.5
0
$455
$2.5
0
Slot
s
N=5
321
$3.2
5$3
.00
$2.7
5$2
.50
$2.5
0$2
.20
N=3
305
$540
$500
$455
$450
$425
$400
N=5
693
$3.0
0$3
.00
$2.5
0$2
.50
$2.5
0$2
.00
Faci
litie
s
N=9
00$3
.25
$3.0
0$2
.73
$2.5
0$2
.50
$2.2
0
N=5
29$5
32$5
00$4
55$4
50$4
25$4
00
N=9
63$3
.00
$3.0
0$2
.50
$2.5
0$2
.50
$2.0
5
Lic
ense
d ra
tem
axim
ums
$2.5
0
$425
$2.2
5
Slot
s
N=2
438
$3.0
0$2
.75
$2.5
0$2
.50
$2.2
5$2
.00
N=7
59$5
00$4
50$4
25$4
25$4
00$3
60
N=2
653
$3.0
0$2
.50
$2.5
0$2
.25
$2.0
0$2
.00
Faci
litie
s
N=4
16$3
.00
$2.7
5$2
.50
$2.5
0$2
.25
$2.0
0
N=1
23$5
00$4
50$4
25$4
25$4
00$3
60
N=4
49$3
.00
$2.5
0$2
.50
$2.2
5$2
.00
$2.0
0
2010
Ore
gon
Chi
ld C
are
Mar
ket P
rice
Stud
y 36
2010
Rat
e ar
eas
D

2010
pri
ces b
y 20
10 r
ate
area
s for
fam
ily c
hild
car
e (c
ontin
ued)
Rat
e Are
a A
Rat
e Are
a B
Rat
e Are
a C
Faci
litie
s
N=5
39$7
00$6
00$5
30$5
22$4
80$4
25
N=1
146
$4.0
0$3
.00
$3.0
0$3
.00
$2.5
0$2
.00
N=5
61$6
50$5
50$5
00$5
00$4
50$4
00
N=1
128
$4.0
0$3
.00
$3.0
0$3
.00
$2.5
0$2
.00
Slot
s
N=3
480
$700
$600
$532
$528
$500
$425
N=7
197
$4.0
0$3
.25
$3.0
0$3
.00
$2.5
0$2
.00
N=3
625
$650
$560
$500
$500
$450
$400
N=7
155
$4.0
0$3
.00
$3.0
0$3
.00
$2.5
0$2
.00
Lic
ense
d ra
tem
axim
ums
$530
$3.0
0
$500
Faci
litie
s
Mon
thly
90th
75th
60th
50th
25th
10th
Hou
rly
90th
75th
60th
50th
25th
10th
Mon
thly
90th
75th
60th
50th
25th
10th
Hou
rly
90th
75th
60th
50th
25th
10th
Lic
ense
d ra
tem
axim
ums
$450
$2.5
0
$425
Slot
s
N=3
537
$500
$480
$450
$450
$400
$400
N=5
809
$3.0
0$3
.00
$2.5
0$2
.50
$2.5
0$2
.00
N=3
696
$500
$455
$450
$425
$400
$375
N=5
735
$3.0
0$2
.85
$2.5
0$2
.50
$2.5
0$2
.00
Faci
litie
s
N=5
66$5
00$4
80$4
50$4
50$4
00$3
96
N=9
77$3
.00
$2.8
5$2
.50
$2.5
0$2
.50
$2.0
0
N=5
88$5
00$4
58$4
50$4
25$4
00$3
74
N=9
43$3
.00
$2.7
5$2
.50
$2.5
0$2
.50
$2.0
0
Lic
ense
d ra
tem
axim
ums
$400
$2.0
0
$395
Slot
s
N=8
68$5
00$4
50$4
00$4
00$4
00$3
52
N=2
728
$3.0
0$2
.50
$2.5
0$2
.25
$2.0
0$2
.00
N=8
61$5
00$4
25$4
00$4
00$3
95$3
50
N=2
840
$3.0
0$2
.50
$2.5
0$2
.25
$2.0
0$2
.00
Faci
litie
s
N=1
38$4
80$4
50$4
00$4
00$4
00$3
52
N=4
61$3
.00
$2.5
0$2
.25
$2.2
5$2
.00
$1.9
0
N=1
37$4
50$4
25$4
00$4
00$3
75$3
48
N=4
71$3
.00
$2.5
0$2
.25
$2.0
0$2
.00
$1.9
0
PR
ES
CH
OO
L-A
GE
SC
HO
OL
-AG
E S
CH
OO
L Y
EA
R
37
2010
Ore
gon
Chi
ld C
are
Mar
ket P
rice
Stud
y
2010
Rat
e ar
eas
D
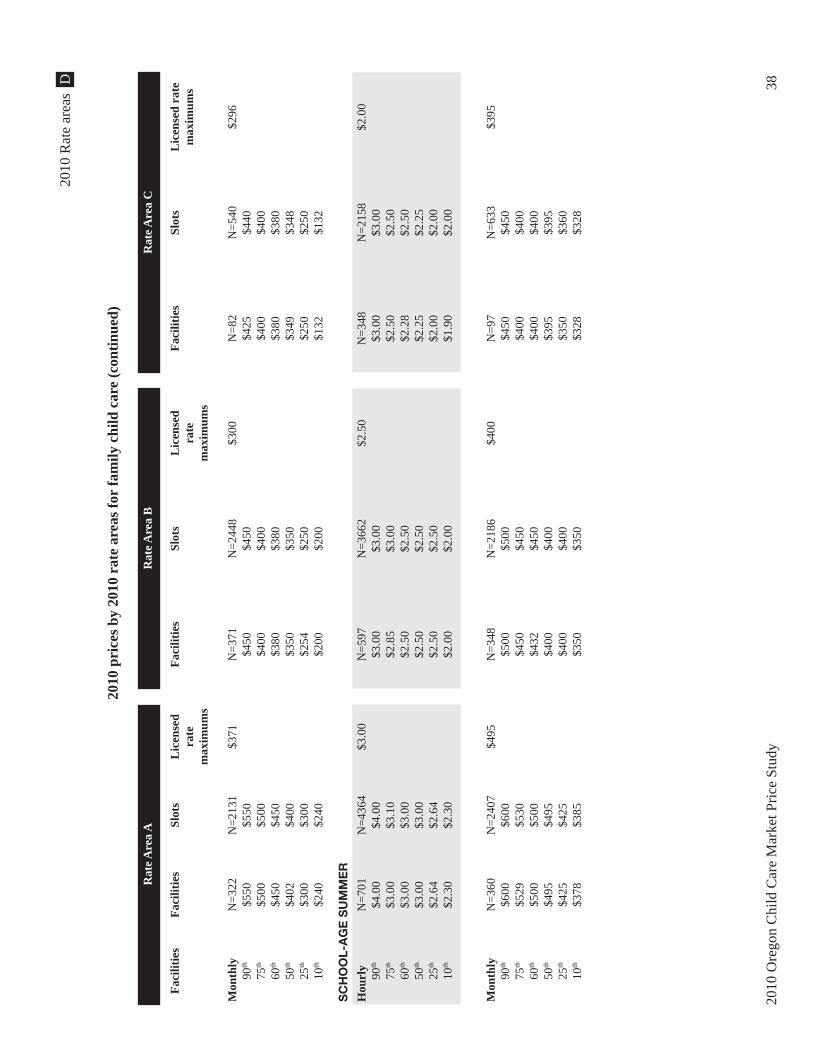
2010
Ore
gon
Chi
ld C
are
Mar
ket P
rice
Stud
y 38
2010
pri
ces b
y 20
10 r
ate
area
s for
fam
ily c
hild
car
e (c
ontin
ued)
Rat
e Are
a A
Rat
e Are
a B
Rat
e Are
a C
Faci
litie
s
N=3
22$5
50$5
00$4
50$4
02$3
00$2
40
N=7
01$4
.00
$3.0
0$3
.00
$3.0
0$2
.64
$2.3
0
N=3
60$6
00$5
29$5
00$4
95$4
25$3
78
Slot
s
N=2
131
$550
$500
$450
$400
$300
$240
N=4
364
$4.0
0$3
.10
$3.0
0$3
.00
$2.6
4$2
.30
N=2
407
$600
$530
$500
$495
$425
$385
Lic
ense
d ra
tem
axim
ums
$371
$3.0
0
$495
Faci
litie
s
Mon
thly
90th
75th
60th
50th
25th
10th
Hou
rly
90th
75th
60th
50th
25th
10th
Mon
thly
90th
75th
60th
50th
25th
10th
Lic
ense
d ra
tem
axim
ums
$300
$2.5
0
$400
Slot
s
N=2
448
$450
$400
$380
$350
$250
$200
N=3
662
$3.0
0$3
.00
$2.5
0$2
.50
$2.5
0$2
.00
N=2
186
$500
$450
$450
$400
$400
$350
Faci
litie
s
N=3
71$4
50$4
00$3
80$3
50$2
54$2
00
N=5
97$3
.00
$2.8
5$2
.50
$2.5
0$2
.50
$2.0
0
N=3
48$5
00$4
50$4
32$4
00$4
00$3
50
Lic
ense
d ra
tem
axim
ums
$296
$2.0
0
$395
Slot
s
N=5
40$4
40$4
00$3
80$3
48$2
50$1
32
N=2
158
$3.0
0$2
.50
$2.5
0$2
.25
$2.0
0$2
.00
N=6
33$4
50$4
00$4
00$3
95$3
60$3
28
Faci
litie
s
N=8
2$4
25$4
00$3
80$3
49$2
50$1
32
N=3
48$3
.00
$2.5
0$2
.28
$2.2
5$2
.00
$1.9
0
N=9
7$4
50$4
00$4
00$3
95$3
50$3
28
SC
HO
OL
-AG
E S
UM
ME
R
2010
Rat
e ar
eas
D

2010
pri
ces b
y 20
10 r
ate
area
s for
cen
ter
care
Rat
e Are
a A
Rat
e Are
a B
Rat
e Are
a C
Faci
litie
s
N=1
9$1
0.00
$7.2
5$7
.00
$5.0
0$4
.00
$3.7
5
N=1
32$1
,200
$1,0
39$9
47$9
03$8
03$6
85
N=2
4$8
.00
$6.5
0$5
.15
$4.5
8$3
.80
$3.5
0
Slot
s
N=1
40$1
0.00
$7.6
3$7
.00
$5.1
5$4
.00
$4.0
0
N=1
290
$1,2
50$1
,096
$1,0
00$9
40$8
50$7
20
N=2
71$8
.00
$7.0
0$5
.30
$4.9
5$3
.75
$3.0
0
Lic
ense
d ra
tem
axim
ums
$4.5
0
$900
$3.9
0
Faci
litie
s
INFA
NT
Hou
rly
90th
75th
60th
50th
25th
10th
Mon
thly
90th
75th
60th
50th
25th
10th
TO
DD
LE
R
Hou
rly
90th
75th
60th
50th
25th
10th
Lic
ense
d ra
tem
axim
ums
$3.6
0
$595
$3.5
2
Slot
s
N=9
5$5
.00
$3.9
6$3
.95
$3.5
0$3
.00
$2.0
0
N=1
79$8
00$7
00$6
75$6
65$6
31$5
70
N=1
66$5
.00
$3.9
6$3
.70
$3.5
0$3
.00
$2.0
0
Faci
litie
s
N=1
8$5
.00
$4.0
0$3
.95
$3.8
0$3
.00
$2.7
5
N=2
7$8
00$7
00$6
75$6
65$6
00$5
00
N=2
2$4
.00
$3.9
6$3
.71
$3.5
0$3
.00
$2.7
5
Lic
ense
d ra
tem
axim
ums
$3.5
2
$550
$3.0
0
Slot
s
N=8
2$5
.00
$4.5
0$3
.65
$3.5
0$3
.15
$3.0
0
N=1
67$6
50$5
86$5
35$4
60$3
50$2
30
N=1
36$5
.00
$3.7
0$3
.50
$3.5
0$3
.00
$2.5
0
Faci
litie
s
N=1
3$4
.50
$3.6
5$3
.50
$3.3
5$3
.00
$2.5
0
N=1
7$6
00$5
85$5
50$5
30$4
19$3
00
N=1
7$4
.50
$3.5
0$3
.50
$3.0
0$2
.75
$2.5
0
39
2010
Ore
gon
Chi
ld C
are
Mar
ket P
rice
Stud
y
2010
Rat
e ar
eas
D
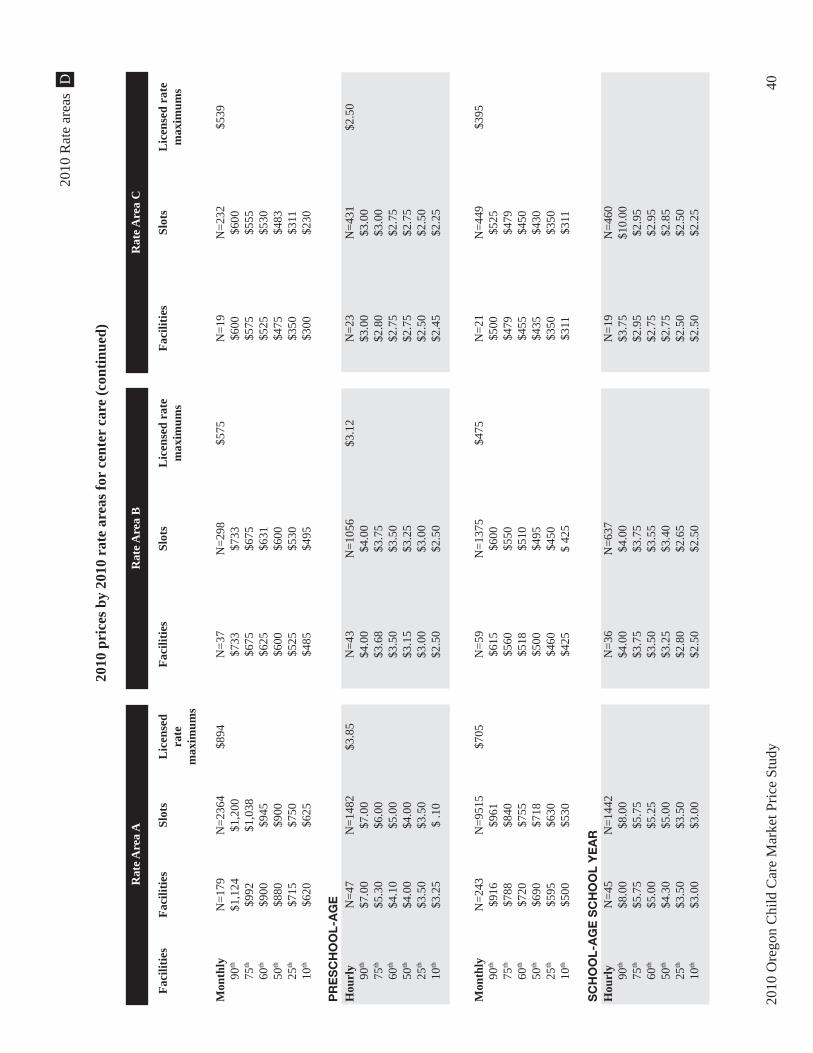
2010
Ore
gon
Chi
ld C
are
Mar
ket P
rice
Stud
y 40
2010
pri
ces b
y 20
10 r
ate
area
s for
cen
ter
care
(con
tinue
d)
Rat
e Are
a A
Rat
e Are
a B
Rat
e Are
a C
Faci
litie
s
N=1
79$1
,124
$992
$900
$880
$715
$620
N=4
7$7
.00
$5.3
0$4
.10
$4.0
0$3
.50
$3.2
5
N=2
43$9
16$7
88$7
20$6
90$5
95$5
00
N=4
5$8
.00
$5.7
5$5
.00
$4.3
0$3
.50
$3.0
0
Slot
s
N=2
364
$1,2
00$1
,038
$945
$900
$750
$625
N=1
482
$7.0
0$6
.00
$5.0
0$4
.00
$3.5
0$
.10
N=9
515
$961
$840
$755
$718
$630
$530
N=1
442
$8.0
0$5
.75
$5.2
5$5
.00
$3.5
0$3
.00
Lic
ense
d ra
tem
axim
ums
$894
$3.8
5
$705
Faci
litie
s
Mon
thly
90th
75th
60th
50th
25th
10th
Hou
rly
90th
75th
60th
50th
25th
10th
Mon
thly
90th
75th
60th
50th
25th
10th
Hou
rly
90th
75th
60th
50th
25th
10th
Lic
ense
d ra
tem
axim
ums
$575
$3.1
2
$475
Slot
s
N=2
98$7
33$6
75$6
31$6
00$5
30$4
95
N=1
056
$4.0
0$3
.75
$3.5
0$3
.25
$3.0
0$2
.50
N=1
375
$600
$550
$510
$495
$450
$ 42
5
N=6
37$4
.00
$3.7
5$3
.55
$3.4
0$2
.65
$2.5
0
Faci
litie
s
N=3
7$7
33$6
75$6
25$6
00$5
25$4
85
N=4
3$4
.00
$3.6
8$3
.50
$3.1
5$3
.00
$2.5
0
N=5
9$6
15$5
60$5
18$5
00$4
60$4
25
N=3
6$4
.00
$3.7
5$3
.50
$3.2
5$2
.80
$2.5
0
Lic
ense
d ra
tem
axim
ums
$539
$2.5
0
$395
Slot
s
N=2
32$6
00$5
55$5
30$4
83$3
11$2
30
N=4
31$3
.00
$3.0
0$2
.75
$2.7
5$2
.50
$2.2
5
N=4
49$5
25$4
79$4
50$4
30$3
50$3
11
N=4
60$1
0.00
$2.9
5$2
.95
$2.8
5$2
.50
$2.2
5
Faci
litie
s
N=1
9$6
00$5
75$5
25$4
75$3
50$3
00
N=2
3$3
.00
$2.8
0$2
.75
$2.7
5$2
.50
$2.4
5
N=2
1$5
00$4
79$4
55$4
35$3
50$3
11
N=1
9$3
.75
$2.9
5$2
.75
$2.7
5$2
.50
$2.5
0
PR
ES
CH
OO
L-A
GE
SC
HO
OL
-AG
E S
CH
OO
L Y
EA
R
2010
Rat
e ar
eas
D

2010
pri
ces b
y 20
10 r
ate
area
s for
cen
ter
care
(con
tinue
d)
Rat
e Are
a A
Rat
e Are
a B
Rat
e Are
a C
Faci
litie
s
N=1
57$6
00$4
30$3
76$3
50$2
80$2
10
N=2
2$7
.00
$5.7
5$5
.00
$4.0
0$3
.25
$3.0
0
N=1
02$8
00$7
04$6
30$6
05$4
85$3
76
Slot
s
N=5
130
$650
$430
$375
$350
$271
$156
N=7
20$7
.00
$5.7
5$5
.30
$4.0
0$3
.25
$2.9
0
N=3
416
$950
$750
$675
$625
$550
$390
Lic
ense
d ra
tem
axim
ums
$524
$4.3
0
$698
Faci
litie
s
Hou
rly
90th
75th
60th
50th
25th
10th
Mon
thly
90th
75th
60th
50th
25th
10th
Mon
thly
90th
75th
60th
50th
25th
10th
Lic
ense
d ra
tem
axim
ums
$345
$3.1
2
$460
Slot
s
N=7
29$3
78$2
80$2
10$1
99$1
30$8
5
N=4
36$3
.95
$3.7
5$3
.50
$3.4
0$2
.65
$2.6
5
N=3
99$5
25$5
10$4
93$4
93$4
50$4
15
Faci
litie
s
N=2
8$4
65$3
69$2
85$2
53$1
85$1
30
N=1
9$3
.95
$3.6
8$3
.50
$3.2
3$2
.75
$2.5
0
N=1
9$5
25$5
10$5
00$4
93$4
50$3
85
Lic
ense
d ra
tem
axim
ums
$270
$2.5
0
$360
Slot
s
N=2
71$4
00$1
85$1
70$1
70$1
20$1
20
N=3
74$2
.95
$2.9
5$2
.80
$2.7
5$2
.50
$2.2
5
N=3
12$4
75$4
72$4
50$3
50$2
10$2
10
Faci
litie
s
N=1
1$4
00$3
50$1
85$1
70$1
20$1
15
N=1
7$3
.00
$2.8
0$2
.75
$2.7
5$2
.50
$2.5
0
N=1
0$4
89$4
75$4
74$4
64$3
60$2
80
SC
HO
OL
-AG
E S
UM
ME
R
41
2010
Ore
gon
Chi
ld C
are
Mar
ket P
rice
Stud
y
2010
Rat
e ar
eas
D

2010
Ore
gon
Chi
ld C
are
Mar
ket P
rice
Stud
y 42
2010
Rat
e ar
eas
D
2010
pri
ces b
y 20
10 r
ate
area
s for
cer
tifi e
d fa
mily
car
e
Rat
e Are
a A
Rat
e Are
a B
Rat
e Are
a C
Faci
litie
s
N=4
7$7
.50
$5.0
0$4
.25
$4.0
0$3
.00
$3.0
0
N=1
17$1
,150
$925
$860
$860
$700
$580
N=5
0$6
.50
$4.0
0$4
.00
$4.0
0$3
.00
$3.0
0
Slot
s
N=1
00$7
.50
$5.0
0$4
.25
$4.0
0$3
.00
$3.0
0
N=3
11$1
,150
$1,0
00$8
80$8
60$7
20$6
00
N=1
33$6
.00
$4.0
0$4
.00
$4.0
0$3
.00
$3.0
0
Lic
ense
d ra
tem
axim
ums
$4.2
5
$860
$4.0
0
Faci
litie
s
INFA
NT
Hou
rly
90th
75th
60th
50th
25th
10th
Mon
thly
90th
75th
60th
50th
25th
10th
TO
DD
LE
R
Hou
rly
90th
75th
60th
50th
25th
10th
Lic
ense
d ra
tem
axim
ums
$3.0
0
$495
$3.0
0
Slot
s
N=9
5$4
.00
$3.5
0$3
.00
$3.0
0$2
.50
$2.0
5
N=1
51$6
00$5
50$5
25$5
00$4
50$4
00
N=1
25$4
.00
$3.0
0$3
.00
$3.0
0$2
.50
$2.2
5
Faci
litie
s
N=4
3$4
.00
$3.5
0$3
.00
$3.0
0$2
.50
$2.0
5
N=7
0$6
00$5
50$5
00$5
00$4
50$4
00
N=5
1$4
.00
$3.2
5$3
.00
$3.0
0$2
.50
$2.2
5
Lic
ense
d ra
tem
axim
ums
$2.5
0
$500
$2.5
0
Slot
s
N=3
5$4
.50
$3.5
0$3
.13
$3.0
0$2
.50
$2.2
5
N=4
0$5
63$5
00$4
88$4
50$3
90$3
60
N=5
5$4
.50
$3.5
0$3
.00
$3.0
0$2
.50
$2.2
5
Faci
litie
s
N=1
3$4
.50
$3.5
0$3
.00
$3.0
0$3
.00
$2.5
0
N=1
4$5
50$5
00$4
75$4
50$3
80$3
60
N=1
8$4
.50
$3.2
5$3
.00
$3.0
0$2
.50
$2.2
5

2010
pri
ces b
y 20
10 r
ate
area
s for
cer
tifi e
d fa
mily
car
e (c
ontin
ued)
Rat
e Are
a A
Rat
e Are
a B
Rat
e Are
a C
Faci
litie
s
N=1
50$1
,063
$845
$750
$745
$625
$540
N=5
7$7
.50
$4.5
0$4
.00
$4.0
0$3
.00
$2.7
5
N=1
56$8
36$7
45$6
88$6
80$5
50$5
00
N=6
1$6
.00
$4.0
0$4
.00
$4.0
0$3
.00
$3.0
0
Slot
s
N=4
78$1
,150
$858
$800
$745
$650
$550
N=3
45$8
.00
$5.0
0$4
.00
$4.0
0$3
.00
$2.7
5
N=1
201
$850
$750
$690
$688
$575
$500
N=3
40$6
.00
$4.0
0$4
.00
$4.0
0$3
.00
$3.0
0
Lic
ense
d ra
tem
axim
ums
$745
$4.0
0
$688
Faci
litie
s
Mon
thly
90th
75th
60th
50th
25th
10th
Hou
rly
90th
75th
60th
50th
25th
10th
Mon
thly
90th
75th
60th
50th
25th
10th
Hou
rly
90th
75th
60th
50th
25th
10th
Lic
ense
d ra
tem
axim
ums
$460
$3.0
0
$450
Slot
s
N=1
76$6
00$5
34$4
95$4
75$4
25$4
00
N=3
47$4
.00
$3.0
0$3
.00
$3.0
0$2
.50
$2.0
0
N=5
37$5
45$5
00$4
75$4
50$4
25$3
85
N=2
29$4
.00
$3.2
5$3
.00
$3.0
0$2
.50
$2.0
0
Faci
litie
s
N=7
6$5
50$5
07$4
75$4
60$4
39$4
00
N=5
5$4
.00
$3.0
0$3
.00
$3.0
0$2
.50
$2.0
0
N=8
4$5
25$4
80$4
50$4
50$4
23$3
80
N=4
8$4
.00
$3.0
0$3
.00
$3.0
0$2
.50
$2.0
0
Lic
ense
d ra
tem
axim
ums
$400
$2.2
5
$400
Slot
s
N=4
4$5
75$5
00$4
75$4
50$4
00$3
40
N=7
5$3
.50
$3.0
0$2
.63
$2.5
0$2
.25
$2.2
5
N=7
9$5
00$4
25$4
00$4
00$3
50$3
10
N=9
0$3
.50
$3.2
5$2
.75
$2.5
0$2
.50
$2.0
0
Faci
litie
s
N=1
4$5
50$5
00$4
50$4
45$4
00$3
40
N=1
5$3
.75
$3.2
5$2
.75
$2.5
0$2
.25
$2.0
0
N=1
4$5
00$4
40$4
20$4
00$3
60$3
40
N=1
7$3
.50
$3.2
5$2
.75
$2.5
0$2
.40
$2.0
0
PR
ES
CH
OO
L-A
GE
SC
HO
OL
-AG
E S
CH
OO
L Y
EA
R
43
2010
Ore
gon
Chi
ld C
are
Mar
ket P
rice
Stud
y
2010
Rat
e ar
eas
D

2010
Ore
gon
Chi
ld C
are
Mar
ket P
rice
Stud
y 44
2010
Rat
e ar
eas
D
2010
pri
ces b
y 20
10 r
ate
area
s for
cer
tifi e
d fa
mily
car
e (c
ontin
ued)
Rat
e Are
a A
Rat
e Are
a B
Rat
e Are
a C
Faci
litie
s
N=6
3$6
50$6
00$5
50$4
50$3
50$2
50
N=4
0$5
.00
$4.0
0$4
.00
$3.7
5$3
.00
$2.6
3
N=6
1$6
50$6
00$6
00$5
88$5
00$4
00
Slot
s
N=3
63$6
00$6
00$4
70$4
50$3
50$2
50
N=2
41$5
.00
$4.0
0$4
.00
$4.0
0$3
.00
$2.7
5
N=3
57$6
50$6
00$6
00$6
00$5
00$4
00
Lic
ense
d ra
tem
axim
ums
$450
$4.0
0
$600
Faci
litie
s
Mon
thly
90th
75th
60th
50th
25th
10th
Hou
rly
90th
75th
60th
50th
25th
10th
Mon
thly
90th
75th
60th
50th
25th
10th
Lic
ense
d ra
tem
axim
ums
$375
$2.6
5
$500
Slot
s
N=2
43$5
00$4
50$4
00$3
75$2
50$2
00
N=1
42$4
.00
$3.2
5$3
.00
$3.0
0$2
.75
$2.5
0
N=1
56$5
50$5
00$4
75$4
50$4
00$3
75
Faci
litie
s
N=5
5$5
00$4
50$4
00$3
75$2
50$2
00
N=2
3$4
.00
$3.2
5$3
.00
$3.0
0$2
.60
$2.5
0
N=2
4$5
50$5
00$4
75$4
50$4
00$3
75
Lic
ense
d ra
tem
axim
ums
$300
$2.4
0
$400
Slot
s
N=6
0$4
38$4
20$4
00$2
68$2
50$1
00
N=6
5$3
.50
$3.0
0$2
.50
$2.5
0$2
.25
$2.2
5
N=4
5$4
40$4
20$4
00$4
00$4
00$2
50
Faci
litie
s
N=1
1$4
50$4
25$4
00$4
00$2
50$2
50
N=1
1$3
.00
$2.7
5$2
.50
$2.5
0$2
.25
$2.0
0
N=8
$500
$430
$400
$400
$380
$250
SC
HO
OL
-AG
E S
UM
ME
R

2010
rat
e ar
eas
45
2010
Ore
gon
Chi
ld C
are
Mar
ket P
rice
Stud
y
Rat
e ar
ea m
aps
E

2010
Ore
gon
Chi
ld C
are
Mar
ket P
rice
Stud
y 46
Rat
e ar
ea m
aps
Rat
e ar
ea c
hang
e - 2
008
to 2
010
E

Perc
ent o
f chi
ld c
are
faci
litie
s whe
re p
rice
is le
ss th
an o
r eq
ual t
o th
e D
HS
licen
sed
rate
max
imum
s,fa
mily
car
e fo
r to
ddle
rs, b
y Z
IP c
ode
47
2010
Ore
gon
Chi
ld C
are
Mar
ket P
rice
Stud
y
Rat
e ar
ea m
aps
E

2010
Ore
gon
Chi
ld C
are
Mar
ket P
rice
Stud
y 48
Perc
ent o
f chi
ld c
are
faci
litie
s whe
re p
rice
is le
ss th
an o
r eq
ual t
o th
e D
HS
licen
sed
rate
max
imum
s,ce
nter
car
e fo
r to
ddle
rs, b
y Z
IP c
ode
Rat
e ar
ea m
aps
E

Median county prices
49 2010 Oregon Child Care Market Price Study
Median county prices for toddler care, by type of care and pricing mode
Numberof kids(slots)
172273
1,0611721853009427517677
-125265
1,16921916422130
1330121623227157445
2,789408
-10247037379250
1,1193
307
15,230
County
BakerBentonClackamasClatsopColumbiaCoosCrookCurryDeschutesDouglasGilliamGrantHarneyHood RiverJacksonJeffersonJosephineKlamathLakeLaneLincolnLinnMalheurMarionMorrowMultnomahPolkShermanTillamookUmatillaUnionWallowaWascoWashingtonWheelerYamhill
Oregon
F
Medianfamilytoddlerhourly
rate
$2.50$3.00$3.00$2.75$3.00$2.50$2.50$3.00$3.00$2.50
-$2.25$2.25$3.00$2.50$2.25$2.50$2.50$2.50$3.00$3.00$2.50$2.20$2.50$2.15$3.00$2.50
-$3.00$2.38$2.50$2.00$2.50$3.00$3.00$2.50
$2.70
Numberof kids(slots)
662854261934317332535253
-3-
273874081211106445650344
1,28513
1,387278
-6796100
-17689
-196
7,888
Medianfamilytoddlermonthly
rate
$400$500$530$300$550$400$400$428$475$450
-$460
-$285$450$425$400$400$375$450$490$450$400$450$350$530$435
-$400$450$400
-$400$540
-$450
$470
Numberof kids(slots)
-12933684876
11944----
76325063-
240-
495225-
100320-630---
587--
2,894
Mediancentertoddlermonthly
rate
-$900$858$495$560$600$455$575$645$585
----
$685$230$525$535
-$808
-$550$311$659
-$900$530
-$600$530
---
$962--
$866
Numberof kids(slots)
-1022--
16624814-6-92824--
6437686-
21410-36---
118-
14
698
Mediancertifi edfamilytoddlermonthly
rate
-$575$680
--
$450$500$375$575$488
-$575
-$745$475$440$440
--
$723$504$450$300$460
-$850$515
-$400$400
---
$745-
$468
$675
Note: A dash refl ects no price data for toddler care by that type of care and pricing mode for a particular county.

Rate areas by ZIP code sorted by city
2010 Oregon Child Care Market Price Study 50
2010, 2008, 2006, 2004, 2002 and 2000 rate areas for Oregon cities, counties and ZIP codes, sorted by city*
County
UmatillaLakeMalheurCurryLinnLinnCoosBentonBentonLaneYamhillWascoClatsopGilliamMalheurJacksonJeffersonClatsopUmatillaMarionMarionDouglasBakerCoosWashingtonClackamasGrantTillamookKlamathTillamookClackamasWashingtonWashingtonWashingtonWashingtonWashingtonDeschutesDeschutesDeschutesDeschutesLaneBentonKlamathMorrow
ZIP code
9781097620979019740697321973229740797408973249740997101970019710297812979029752097711971039781397325970029741097814974119710697003978179710797621971089700497005970069700797008971239770197702977089770997412973269762297818
2000rate area
CCCCC-CACCCCCCCACCCCCCCCACCBCCAAAAAABBBBCBCC
2002rate area
CCCCBBCACCCCCCCACBCCCCCCACCBCCAAAAAABBBBCBCC
2004rate area
CCCCBBCACCCCCBCACBCCBCCCACCBCCAAAAAAAAAACBCC
2006rate area
CCCCBBCACCCCCBCACBCCBCCCABCBCBAAAAAAAAAACBCC
2008rate area
CCCCBBCACCCCCBCACBCCBCCCABCBCBAAAAAAAAAACBCC
2010rate area
CCCCBBCACCCCCBCACBCCBCCCABCBCBAAAAAAAAAACBCC
G
City or town
AdamsAdelAdrianAgnessAlbanyAlbanyAlleganyAlpineAlseaAlvadoreAmityAntelopeArch CapeArlingtonArockAshlandAshwoodAstoriaAthenaAumsvilleAuroraAzaleaBakerBandonBanksBarlowBatesBay CityBeattyBeaverBeavercreekBeavertonBeavertonBeavertonBeavertonBeavertonBendBendBendBendBlachlyBlodgettBlyBoardman
* ZIP codes that changed rate area from 2008 to 2010 are indicated in bold.

Rate areas by ZIP code sorted by city
51 2010 Oregon Child Care Market Price Study
G
2010, 2008, 2006, 2004, 2002 and 2000 rate areas for Oregon cities, counties and ZIP codes, sorted by city* (continued)
County
KlamathClackamasMultnomahBakerClackamasCoosMalheurCurryDeschutesLinnHarneyLincolnJacksonWashingtonDouglasJeffersonClackamasClatsopGrantDouglasYamhillHood RiverLinnJosephineUmatillaMorrowJacksonKlamathLaneKlamathLakeClackamasTillamookClackamasColumbiaGilliamCoosCoosMultnomahWashingtonBentonBentonBentonBentonLaneUnionLinnHarneyKlamath
ZIP code
97623970099701097819970119741497903974159771297327977209732897522971099741697730970139711097820974179711197014973299752397821978229750297731974199762497641970159711297017970189782397420974239701997113973309733197339973339742497824973359773297604
2000rate area
CAACBCCCCCCBCACCACCCBCCBCCCCCCCAABBCCCAAAAAACCCCC
2002rate area
CAACBCCBCCCBCACCABCCBBCCCCCCCCCAACCCCCAAAAAABCCCC
2004rate area
CAACBCCBCCCBCACCABCCBBCCCCBCCCCAACCCCCAAAAAABCCCC
2006rate area
CAACBCCBCBCBCACCABCCBBCCCCBCCCCAABCCBBAAAAAABCCCC
2008rate area
CAACBCCBCBCBCACCABCCBACCCCBCCCCAABBCBBAAAAAABCCCC
2010rate area
CAACBCCBCBCBCACCABCCBACCCCBCCCCAABBCBBAAAAAABCCCC
City or town
BonanzaBoringBridal VeilBridgeportBrightwoodBroadbentBroganBrookingsBrothersBrownsvilleBurnsBurnt WoodsButte FallsBuxtonCamas ValleyCamp ShermanCanbyCannon BeachCanyon CityCanyonvilleCarltonCascade LocksCascadiaCave JunctionCayuseCecilCentral PointChemultCheshireChiloquinChristmas ValleyClackamasCloverdaleColtonColumbia CityCondonCoos BayCoquilleCorbettCorneliusCorvallis NWCorvallis OSUCorvallis POBCorvallis SWCottage GroveCoveCrabtreeCraneCrater Lake
* ZIP codes that changed rate area from 2008 to 2010 are indicated in bold.

Rate areas by ZIP code sorted by city
2010 Oregon Child Care Market Price Study 52
2010, 2008, 2006, 2004, 2002 and 2000 rate areas for Oregon cities, counties and ZIP codes, sorted by city* (continued)
G
County
LinnKlamathKlamathLaneLaneJeffersonDouglasKlamathUmatillaPolkClackamasDouglasYamhillGrantLaneColumbiaLincolnMarionLaneHarneyDouglasLaneMarionLaneDouglasHarneyWascoYamhillBakerClackamasJacksonUmatillaLincolnUnionDouglasLaneWallowaClackamasLaneLaneLaneLaneLaneMultnomahLanePolkHarneyLaneWashingtonKlamath
ZIP code
9733697733974259742697427977349742897625978809733897089974299711497825974309705497341973429743197722974329743397020974349743597904970219711597905970229752497826973439782797436974379782897023974019740297403974049740597024974389734497710974399711697626
2000rate area
CCCCCCCCCB-CBCCACCBCCCCCCCCBCABCBCCCCAAAAAAACBCCAC
2002rate area
CCCCCCCCCB-CBCCCBCBCCCCCCCCBCABCBCCCCAAAAAAACBCCAC
2004rate area
CCCBCCCCCB-CBCCCBCBCCCCCCCCBCACCBCCCCAAAAAAACBCCAC
2006rate area
BCCBCCCCCB- CBCCCBCBCCCCCCCCBCABCBCCCCAAAAAAACBCCAC
2008rate area
BCCBCCCCCBACBCCCBCBCCCCCCCCBCABCBCCCCAAAAAAACBCCAC
2010rate area
BCCBCCCCCBACBCCCBCBCCCCCCCCBCABCBCCCCAAAAAAACBCCAC
City or town
CrawfordsvilleCrescentCrescent LakeCreswellCulp CreekCulverCurtinDairyDaleDallasDamascusDays CreekDaytonDayvilleDeadwoodDeer IslandDepoe BayDetroitDexterDiamondDillardDisstonDonaldDorenaDrainDrewseyDufurDundeeDurkeeEagle CreekEagle PointEchoEddyvilleElginElktonElmiraEnterpriseEstacadaEugeneEugeneEugeneEugeneEugeneFairviewFall CreekFalls CityFieldsFlorenceForest GroveFort Klamath
* ZIP codes that changed rate area from 2008 to 2010 are indicated in bold.

53 2010 Oregon Child Care Market Price Study
2010, 2008, 2006, 2004, 2002 and 2000 rate areas for Oregon cities, counties and ZIP codes, sorted by city* (continued)
County
LakeWheelerLinnGrantHarneyWascoWashingtonDouglasTillamookWashingtonMarionMarionKlamathClackamasDouglasLincolnWashingtonDouglasCurryJacksonClackamasPolkJosephineJosephineShermanLaneMultnomahMultnomahBakerBakerLinnClatsopClackamasMalheurLinnTillamookUmatillaMorrowBakerUmatillaWashingtonHarneyHood RiverMarionBakerMarionDouglasUnionWallowa
ZIP code
97735978309734597831977369702197117974419711897119973469702697737970279744297388971169744397444975259702897347975269752797029974309703097080978339783497348971219708697906974469712297835978369783797838971249773897031970329790797350974479784197842
2000rate area
CCCCCCBCBACCCACCBCAAACCCCCAACCCC-CBACCCCACABCCCCC
2002rate area
CCCCCCBCBACCCACCBCBAACCCCCAACCCC-CBACCCCACACCCCCC
2004rate area
CCCCCCBCBACCCACCBCBAACCCCCAACCCC-CBBCCCCACACCCCCC
2006rate area
CCCCCCBCBACCCACCBCBAACCCCCAACCBC-CBBCCCCACACCCCCC
2008rate area
CCCCCCBCBACCCACCBCBAACCCCCAACCBBACBBCCCCACACCCCCC
2010rate area
CCCCCCBCBACCCACCBCBAACCCCCAACCBBACBBCCCCACACCCCCC
City or town
Fort RockFossilFosterFoxFrenchglenFriendGales CreekGardinerGaribaldiGastonGatesGervaisGilchristGladstoneGlendaleGleneden BeachGlenwoodGlideGold BeachGold HillGov’t CampGrande RondeGrants PassGrants PassGrass ValleyGreenleafGreshamGreshamHainesHalfwayHalseyHammondHappy ValleyHarperHarrisburgHeboHelixHeppnerHerefordHermistonHillsboroHinesHood RiverHubbardHuntingtonIdanhaIdleyld ParkImblerImnaha
* ZIP codes that changed rate area from 2008 to 2010 are indicated in bold.
Rate areas by ZIP code sorted by city G

2010 Oregon Child Care Market Price Study 54
2010, 2008, 2006, 2004, 2002 and 2000 rate areas for Oregon cities, counties and ZIP codes, sorted by city* (continued)
County
PolkMorrowMalheurMorrowJacksonMalheurMarionGrantMalheurWallowaLaneMalheurMarionKlamathShermanJosephineGrantBentonKlamathDeschutesYamhillUnionKlamathClackamasClackamasCoosLakeCurryHarneyLaneLinnMorrowLincolnLincolnGrantLaneWallowaLaneLinnJeffersonKlamathWashingtonTillamookLaneLaneMarionClackamasWascoLaneYamhill
ZIP code
9735197843979089784497530979099735297845979109784697448979119730797627970339753197848973539760197739971279785097603970349703597449976309745097740974899735597839973679735797856974519785797452973589774197632971259713097453974549735997036970379741397128
2000rate area
ACCCCCCCCCCC-CCCCBCCCCCAACCCCACCBBCCCCCCCACCACACCC
2002rate area
ACCCCCBCCCCCBCCCCBCCBCCAACCCCABCBBCCCBCCCACCACACCB
2004rate area
ACCCCCBCCCBCBCCCCBCCBCCAACCCCBBCBBCCCBCCCACCACACCB
2006rate area
ACCCCCBCCCBCBCCCCBCCBCCAACCCCBBCBBCCCBCCCACCACACCB
2008rate area
ACCCCCBCCCBCBCCCCBCCBCCAACCCCBBCBBCCCBCCCACCACACCB
2010rate area
ACCCCCBCCCBCBCCCCBCCBCCAACCCCBBCBBCCCBCCCACCACACCB
City or town
IndependenceIoneIronsideIrrigonJacksonvilleJamiesonJeffersonJohn DayJordon ValleyJosephJunction CityJunturaKeizerKenoKentKerbyKimberlyKings ValleyKlamath FallsLa PineLafayetteLaGrandeLake of WoodsLake OswegoLake OswegoLakesideLakeviewLangloisLawenLeaburgLebanonLexingtonLincoln CityLogsdenLong CreekLoraneLostineLowellLyonsMadrasMalinManningManzanitaMapletonMarcolaMarionMarylhurstMaupinMcKenzie BrdgMcMinnville
* ZIP codes that changed rate area from 2008 to 2010 are indicated in bold.
Rate areas by ZIP code sorted by city G

55 2010 Oregon Child Care Market Price Study
2010, 2008, 2006, 2004, 2002 and 2000 rate areas for Oregon cities, counties and ZIP codes, sorted by city* (continued)
County
UmatillaUmatillaJacksonJacksonMarionJosephineKlamathJeffersonKlamathGilliamLinnUmatillaClackamasClackamasWheelerClackamasPolkBentonGrantShermanWascoHood RiverGrantMarionClackamasJosephineDouglasCoosTillamookLincolnTillamookTillamookLakeYamhillLincolnCoosWashingtonUnionCoosLaneMalheurMultnomahDouglasLaneJosephineTillamookHood RiverMalheurCurryClackamas
ZIP code
9788297859975019750497384975329763397742976349786197360978629722297267977509703897361974569786497039970409704197865973629704297533974579745897131973649714997143976359713297365974599713397867974609746197913972689746297463975349713497044979149746497045
2000rate area
CCBBCCCCCCCCAACCACCCCACCCCCCCCACCACCACCCCACCBBCCCA
2002rate area
CCBBCCCCCCCCAACCACCCCACCCCCCCCACCABCACCCCACCBBBCCA
2004rate area
CCCCCCCCCCCCAACCABCCCACBCCCCCCACCABCACCCCACCBBBCCA
2006rate area
CCBBCCCCCCCCAACBABCCCACBBCCCBCABCABCACCCCACCBBBCCA
2008rate area
CCBBCCCCCCCCAACBABCCCACBBCCCBCABCABCACCCCACCBBBCCA
2010rate area
CCBBCCCCCCCCAACBABCCCACBBCBCBCABCABBACCCCACCBBBCCA
City or town
McNaryMeachamMedfordMedfordMehamaMerlinMerrillMetoliusMidlandMikkaloMill CityMilton-FreewaterMilwaukieMilwaukieMitchellMolallaMonmouthMonroeMonumentMoroMosierMt. HoodMount VernonMt. AngelMulinoMurphyMyrtle CreekMyrtle PointNehalemNeotsuNeskowinNetartsNew Pine CrkNewbergNewportNorth BendNorth PlainsNorth PowderNorwayNotiNyssaOak GroveOaklandOakridgeO’BrienOceansideOdellOntarioOphirOregon City
* ZIP codes that changed rate area from 2008 to 2010 are indicated in bold.
Rate areas by ZIP code sorted by city G

2010 Oregon Child Care Market Price Study 56
2010, 2008, 2006, 2004, 2002 and 2000 rate areas for Oregon cities, counties and ZIP codes, sorted by city* (continued)
County
LincolnLincolnBakerTillamookLakeCrookUmatillaBentonJacksonUmatillaLaneLakeCurryMultnomahMultnomahMultnomahMultnomahMultnomahMultnomahMultnomahMultnomahMultnomahMultnomahMultnomahMultnomahMultnomahMultnomahMultnomahMultnomahMultnomahMultnomahMultnomahMultnomahMultnomahMultnomahMultnomahMultnomahMultnomahMultnomahMultnomahMultnomahMultnomahMultnomahMultnomahMultnomahCrookCrookCoosGrantHarney
ZIP code
9736897369978409713597636977519780197370975359786897455976379746597236972429726697201972029720397204972059720697209972109721197212972139721497215972169721797218972199722097221972279723097231972329723397225972299729297239972869775297753974669786997721
2000rate area
CCCACCCBBCACBAAAAAAAAAAAAAAAAAAAAAAAAAAAAA---CCCCC
2002rate area
CCCACCCBBCACBAAAAAAAAAAAAAAAAAAAAAAAAAAAAAA--CCCCC
2004rate area
CCCACCBBBCACBAAAAAAAAAAAAAAAAAAAAAAAAAAAAAAA-CCCCC
2006rate area
CCCACCBBBCACBAAAAAAAAAAAAAAAAAAAAAAAAAAAAAAA-CCCCC
2008rate area
CCCACCBBBCACBAAAAAAAAAAAAAAAAAAAAAAAAAAAAAAA-CCCCC
2010rate area
CCBBCCCCCCCCAACBABCCCACBBCCCBCABCABCACCCCACCABBBCC
City or town
OtisOtter RockOxbowPacifi c CityPaisleyPaulinaPendletonPhilomathPhoenixPilot RockPleasant HillPlushPort OrfordPortlandPortlandPortlandPortlandPortlandPortlandPortlandPortlandPortlandPortlandPortlandPortlandPortlandPortlandPortlandPortlandPortlandPortlandPortlandPortlandPortlandPortlandPortlandPortlandPortlandPortlandPortlandPortlandPortlandPortlandPortlandPortlandPostPowell ButtePowersPrairie CityPrinceton
* ZIP codes that changed rate area from 2008 to 2010 are indicated in bold.
Rate areas by ZIP code sorted by city G

57 2010 Oregon Child Care Market Price Study
2010, 2008, 2006, 2004, 2002 and 2000 rate areas for Oregon cities, counties and ZIP codes, sorted by city* (continued)
County
CrookJacksonColumbiaDeschutesDeschutesDouglasCoosClackamasBakerPolkDouglasUmatillaHarneyGrantTillamookJacksonLincolnDouglasDouglasShermanLaneMarionMarionMarionMarionMarionMarionMarionMarionMarionClackamasColumbiaLinnMarionDouglasLincolnClatsopJosephineGrantJacksonWascoLinnYamhillWashingtonLincolnLakeMarionDeschutesCurryLincoln
ZIP code
9775497536970489775697760974679746897049978709737197469978719775897872971369753797372974709747197050974729730597306973019730397302973099731797310973049705597056973749737597473973769713897538978739753997057973779737897140973809763897381977599747697366
2000rate area
CCBCCCCBCACCCCCCBB-CCBBBBB--BBABCCCABCCCCCCABCBCCB
2002rate area
CCCCCCCBCACCCCCCBB-CCBBBBBB-BBACCCCABCCCCCCABCBCCB
2004rate area
CCBCCCCBCACCCCCCBC-CCBBBBBB-BBABBCCABCCCCCCABCBBCB
2006rate area
CCBBBCCBCACCCCCCBC-CCBBBBBB-BBABBCCABCCCCBBABCBBCB
2008rate area
CCBBBCCBCACCCCCCBB-CCBBBBBBBBBABBCCABCCCCBBABCBBCB
2010rate area
ACBBBCCBCACCCCCCBBBCCBBBBBBBBBAABCCABCCCCBBABCBBCB
City or town
PrinevilleProspectRainierRedmondRedmondReedsportRemoteRhododendronRichlandRickreallRiddleRiethRileyRitterRockaway BchRogue RiverRose LodgeRoseburgRoseburgRufusSaginawSalemSalemSalem NESalem NESalem Rt 3, 4SalemSalemSalem St InstSalem WestSandyScappooseScioScotts MillsScottsburgSeal RockSeasideSelmaSenecaShady CoveShanikoSheddSheridanSherwoodSiletzSilver LakeSilvertonSistersSixesSouth Beach
* ZIP codes that changed rate area from 2008 to 2010 are indicated in bold.
Rate areas by ZIP code sorted by city G

2010 Oregon Child Care Market Price Study 58
2010, 2008, 2006, 2004, 2002 and 2000 rate areas for Oregon cities, counties and ZIP codes, sorted by city* (continued)
County
KlamathWheelerLaneColumbiaMarionUmatillaMarionMarionLakeUnionBakerDeschutesJosephineDouglasLinnLaneJacksonLinnDouglasWascoLaneLincolnWashingtonWashingtonTillamookDouglasWashingtonLincolnClatsopJacksonMultnomahWashingtonMarionWascoUmatillaDouglasUnionBakerMalheurLaneColumbiaLaneLincolnWallowaLaneJeffersonColumbiaClatsopShermanCurry
ZIP code
9763997874974789705197137978759738397385976409787697877977079749797479973869748097540973899748197058974829739097223972249714197484971449739197145975419706097062973929706397882974869788397884979189748797064974889739497885974909776197053971469706597491
2000rate area
CCABCCCCCCCAACBCCBCCACAABCCBCCAAACCCCCCCACCCCCBCCC
2002rate area
CCABCCCCCCCAACBCBBCCACAABCCBCCAABCCCCCCBACCCCCBBCC
2004rate area
CCABCCCCCCCABCCCCBCBACAABCCBCCAABCCCCCCBACCCCCBBCC
2006rate area
CCABCCCCCCCABCBCCBCBACAABCCBCCAABCCCCCCBACCCCCBBCC
2008rate area
CCABCCBCCCCABCBCCBCBACAABCCBCCAABCCCCCCBACCCCCBBCC
2010rate area
CCAACCBCCCCABCBCCBCBACAABCCBCCAABCCCCCCBACBCCCBBCC
City or town
Sprague RiverSpraySpringfi eldSt. HelensSt. PaulStanfi eldStaytonSublimitySummer LakeSummervilleSumpterSunriverSunny ValleySutherlinSweet HomeSwiss HomeTalentTangentTenmileThe DallesThurstonTidewaterTigardTigardTillamookTillerTimberToledoTolovana ParkTrailTroutdaleTualatinTurnerTygh ValleyUmatillaUmpquaUnionUnityValeVenetaVernoniaVidaWaldportWallowaWaltonWarm SpringsWarrenWarrentonWascoWedderburn
* ZIP codes that changed rate area from 2008 to 2010 are indicated in bold.
Rate areas by ZIP code sorted by city G

59 2010 Oregon Child Care Market Price Study
2010, 2008, 2006, 2004, 2002 and 2000 rate areas for Oregon cities, counties and ZIP codes, sorted by city* (continued)
County
ClackamasClackamasMalheurLaneLaneUmatillaColumbiaTillamookJacksonDouglasJosephineYamhillJosephineMalheurClackamasDouglasDouglasJosephineMarionLincolnYamhillDouglas
ZIP code
97067970689792097492974939788697016971479750397494975439739697544979199707097495974969749797071974989714897499
2000rate area
BACCCCACCCCCCCACCCCCBC
2002rate area
BACCCCCCCCCCCCACCCCCBC
2004rate area
BACCCCCCBCCCCCACCCCCBC
2006rate area
BACCCCCCBCCCCCACCCBCBC
2008rate area
BACCCCBCBCCCCCACCCBCBC
2010rate area
BACCCCBCBCCCCCACCCBCBC
City or town
WemmeWest LinnWestfallWestfi rWestlakeWestonWestportWheelerWhite CityWilburWildervilleWillaminaWilliamsWillow CreekWilsonvilleWinchesterWinstonWolf CreekWoodburnYachatsYamhillYoncalla
* ZIP codes that changed rate area from 2008 to 2010 are indicated in bold.
Rate areas by ZIP code sorted by city G

Rate areas by ZIP code sorted by county
2010 Oregon Child Care Market Price Study 60
2010, 2008, 2006, 2004, 2002 and 2000 Rate Areas for Oregon counties, cities and ZIP codes, sorted by county*
H
City or town
BakerBridgeportDurkeeHainesHalfwayHerefordHuntingtonOxbowRichlandSumpterUnityAlpineAlseaBlodgettCorvallis NWCorvallis OSUCorvallisCorvallis SWKings ValleyMonroePhilomathBarlowBeavercreekBoringBrightwoodCanbyClackamasColtonDamascusEagle CreekEstacadaGladstoneGov’t CampLake OswegoHappy ValleyLake OswegoMarylhurstMilwaukieMilwaukieMolallaMulinoOregon CityRhododendronSandy
ZIP code
9781497819979059783397834978379790797840978709787797884974089732497326973309733197339973339735397456973709700397004970099701197013970159701797089970229702397027970289703497086970359703697222972679703897042970459704997055
2000rate area
CCCCCCCCCCCACBAAAABCBCAABAAB.AAAAA.AAAACCABA
2002rate area
CCCCCCCCCCCACBAAAABCBCAABAAC.AAAAA.AAAACCABA
2004rate area
CCCCCCCCCCCACBAAAABBBCAABAAC.AAAAA.AAAACCABA
2006rate area
CCCCCCCCCCCACBAAAABBBBAABAAB.AAAAA.AAAABBABA
2008rate area
CCCCCCCCCCCACBAAAABBBBAABAABAAAAAAAAAAABBABA
2010rate area
CCCCCCCCCCCACBAAAABBBBAABAABAAAAAAAAAAABBABA
County
BakerBakerBakerBakerBakerBakerBakerBakerBakerBakerBakerBentonBentonBentonBentonBentonBentonBentonBentonBentonBentonClackamasClackamasClackamasClackamasClackamasClackamasClackamasClackamasClackamasClackamasClackamasClackamasClackamasClackamasClackamasClackamasClackamasClackamasClackamasClackamasClackamasClackamasClackamas
* ZIP codes that changed rate area from 2008 to 2010 are indicated in bold.

Rate areas by ZIP code sorted by county
61 2010 Oregon Child Care Market Price Study
H
2010, 2008, 2006, 2004, 2002 and 2000 Rate Areas for Oregon counties, cities and ZIP codes, sorted by county* (continued)
City or town
WemmeWest LinnWilsonvilleArch CapeAstoriaCannon BeachHammondSeasideTolovana ParkWarrentonColumbia CityDeer IslandRainierScappooseSt. HelensVernoniaWarrenWestportAlleganyBandonBroadbentCoos BayCoquilleLakesideMyrtle PointNorth BendNorwayPowersRemotePaulinaPostPowell ButtePrinevilleAgnessBrookingsGold BeachLangloisOphirPort OrfordSixesWedderburnBendBendBendBendBrothersLa PineRedmondRedmond
ZIP code
97067970689707097102971039711097121971389714597146970189705497048970569705197064970539701697407974119741497420974239744997458974599746097466974689775197752977539775497406974159744497450974649746597476974919770197702977089770997712977399775697760
2000rate area
BAACCCCBCCBABBBABACCCCCCCCCCCCCCCCCACCBCCBBBBCCCC
2002rate area
BAACBBCBCBCCCCBABCCCCCCCCCCCCCCCCCBBCCBCCBBBBCCCC
2004rate area
BAACBBCBCBCCBBBABCCCCCCCCCCCCCCCCCBBCCBCCAAAACCCC
2006rate area
BAACBBCBCBCCBBBABCCCCBBCCCCCCCCCCCBBCCBCCAAAACCBB
2008rate area
BAACBBBBCBBCBBBABBCCCBBCCCCCCCCCCCBBCCBCCAAAACCBB
2010rate area
BAACBBBBCBBCBAAABBCCCBBCCBCCCCCCCCBBCCBCCAAAACCBB
County
ClackamasClackamasClackamasClatsopClatsopClatsopClatsopClatsopClatsopClatsopColumbiaColumbiaColumbiaColumbiaColumbiaColumbiaColumbiaColumbiaCoosCoosCoosCoosCoosCoosCoosCoosCoosCoosCoosCrookCrookCrookCrookCurryCurryCurryCurryCurryCurryCurryCurryDeschutesDeschutesDeschutesDeschutesDeschutesDeschutesDeschutesDeschutes
* ZIP codes that changed rate area from 2008 to 2010 are indicated in bold.

Rate areas by ZIP code sorted by county
2010 Oregon Child Care Market Price Study 62
2010, 2008, 2006, 2004, 2002 and 2000 Rate Areas for Oregon counties, cities and ZIP codes, sorted by county* (continued)
H
City or town
SistersSunriverAzaleaCamas ValleyCanyonvilleCurtinDays CreekDillardDrainElktonGardinerGlendaleGlideIdleyld ParkMyrtle CreekOaklandReedsportRiddleRoseburgRoseburgScottsburgSutherlinTenmileTillerUmpquaWilburWinchesterWinstonYoncallaArlingtonCondonMikkaloBatesCanyon CityDayvilleFoxJohn DayKimberlyLong CreekMonumentMount VernonPrairie CityRitterSenecaBurnsCraneDiamondDrewseyFieldsFrenchglen
ZIP code
9775997707974109741697417974289742997432974359743697441974429744397447974579746297467974699747097471974739747997481974849748697494974959749697499978129782397861978179782097825978319784597848978569786497865978699787297873977209773297722979049771097736
2000rate area
CACCCCCCCCCCCCCCCCB-CCCCCCCCCCCCCCCCCCCCCCCCCCCCCC
2002rate area
CACCCCCCCCCCCCCCCCB-CCCCCCCCCCCCCCCCCCCCCCCCCCCCCC
2004rate area
BACCCCCCCCCCCCCCCCC-CCCCCCCCCBCCCCCCCCCCCCCCCCCCCC
2006rate area
BACCCCCCCCCCCCCCCCC-CCCCCCCCCBCCCCCCCCCCCCCCCCCCCC
2008rate area
BACCCCCCCCCCCCCCCCB-CCCCCCCCCBCCCCCCCCCCCCCCCCCCCC
2010rate area
BACCCCCCCCCCCCBCCCBBCCCCCCCCCBCCCCCCCCCCCCCCCCCCCC
County
DeschutesDeschutesDouglasDouglasDouglasDouglasDouglasDouglasDouglasDouglasDouglasDouglasDouglasDouglasDouglasDouglasDouglasDouglasDouglasDouglasDouglasDouglasDouglasDouglasDouglasDouglasDouglasDouglasDouglasGilliamGilliamGilliamGrantGrantGrantGrantGrantGrantGrantGrantGrantGrantGrantGrantHarneyHarneyHarneyHarneyHarneyHarney
* ZIP codes that changed rate area from 2008 to 2010 are indicated in bold.

63 2010 Oregon Child Care Market Price Study
2010, 2008, 2006, 2004, 2002 and 2000 Rate Areas for Oregon counties, cities and ZIP codes, sorted by county* (continued)
City or town
HinesLawenPrincetonRileyCascade LocksHood RiverMt. HoodOdellAshlandButte FallsCentral PointEagle PointGold HillJacksonvilleMedfordMedfordPhoenixProspectRogue RiverShady CoveTalentTrailWhite CityAshwoodCamp ShermanCulverMadrasMetoliusWarm SpringsCave JunctionGrants PassGrants PassKerbyMerlinMurphyO’BrienSelmaSunny ValleyWildervilleWilliamsWolf CreekBeattyBlyBonanzaChemultChiloquinCrater LakeCrescentCrescent Lake
ZIP code
97738977409772197758970149703197041970449752097522975029752497525975309750197504975359753697537975399754097541975039771197730977349774197742977619752397526975279753197532975339753497538974789754397544974979762197622976239773197624976049773397425
2000rate area
CCCCCAACACCBACBBBCCCCCCCCCCCCBCCCCCBCACCCCCCCCCCC
2002rate area
CCCCBAABACCBACBBBCCCBCCCCCCCCCCCCCCBCACCCCCCCCCCC
2004rate area
CCCCBAABACBCACCCBCCCCCBCCCCCCCCCCCCBCBCCCCCCCCCCC
2006rate area
CCCCBAABACBBACBBBCCCCCBCCCCCCCCCCCCBCBCCCCCCCCCCC
2008rate area
CCCCAAABACBBACBBBCCCCCBCCCCCCCCCCCCBCBCCCCCCCCCCC
2010rate area
CCCCAAABACBBACBBBCCCCCBCCCCCCCCCCCCBCBCCCCCCCCCCC
County
HarneyHarneyHarneyHarneyHood RiverHood RiverHood RiverHood RiverJacksonJacksonJacksonJacksonJacksonJacksonJacksonJacksonJacksonJacksonJacksonJacksonJacksonJacksonJacksonJeffersonJeffersonJeffersonJeffersonJeffersonJeffersonJosephineJosephineJosephineJosephineJosephineJosephineJosephineJosephineJosephineJosephineJosephineJosephineKlamathKlamathKlamathKlamathKlamathKlamathKlamathKlamath
* ZIP codes that changed rate area from 2008 to 2010 are indicated in bold.
Rate areas by ZIP code sorted by county H

2010 Oregon Child Care Market Price Study 64
2010, 2008, 2006, 2004, 2002 and 2000 Rate Areas for Oregon counties, cities and ZIP codes, sorted by county* (continued)
City or town
DairyFort KlamathGilchristKenoKlamath FallsLake of WoodsMalinMerrillMidlandSprague RiverAdelChristmas ValleyFort RockLakeviewNew Pine CrkPaisleyPlushSilver LakeSummer LakeAlvadoreBlachlyCheshireCottage GroveCreswellCulp CreekDeadwoodDexterDisstonDorenaElmiraEugeneEugeneEugeneEugeneEugeneFall CreekFlorenceGreenleafJunction CityLeaburgLoraneLowellMapletonMarcolaMcKenzie BrdgNotiOakridgePleasant HillSaginawSpringfi eld
ZIP code
9762597626977379762797601976039763297633976349763997620976419773597630976359763697637976389764097409974129741997424974269742797430974319743397434974379740197402974039740497405974389743997430974489748997451974529745397454974139746197463974559747297477
2000rate area
CCCCCCCCCCCCCCCCCCCCCCCCCCBCCCAAAAACCCCACCCACCCACA
2002rate area
CCCCCCCCCCCCCCCCCCCCCCBCCCBCCCAAAAACCCCACBCACCCACA
2004rate area
CCCCCCCCCCCCCCCCCCCCCCBBCCBCCCAAAAACCCBBCBCACCCACA
2006rate area
CCCCCCCCCCCCCCCCCCCCCCBBCCBCCCAAAAACCCBBCBCACCCACA
2008rate area
CCCCCCCCCCCCCCCCCCCCCCBBCCBCCCAAAAACCCBBCBCACCCACA
2010rate area
CCCCCCCCCCCCCCCCCCCCCCBBCCBCCCAAAAACCCBBCBCACCCACA
County
KlamathKlamathKlamathKlamathKlamathKlamathKlamathKlamathKlamathKlamathLakeLakeLakeLakeLakeLakeLakeLakeLakeLaneLaneLaneLaneLaneLaneLaneLaneLaneLaneLaneLaneLaneLaneLaneLaneLaneLaneLaneLaneLaneLaneLaneLaneLaneLaneLaneLaneLaneLaneLane
* ZIP codes that changed rate area from 2008 to 2010 are indicated in bold.
Rate areas by ZIP code sorted by county H

65 2010 Oregon Child Care Market Price Study
2010, 2008, 2006, 2004, 2002 and 2000 Rate Areas for Oregon counties, cities and ZIP codes, sorted by county* (continued)
City or town
Swiss HomeThurstonVenetaVidaWaltonWestfi rWestlakeBurnt WoodsDepoe BayEddyvilleGleneden BeachLincoln CityLogsdenNeotsuNewportOtisOtter RockRose LodgeSeal RockSiletzSouth BeachTidewaterToledoWaldportYachatsAlbanyAlbanyBrownsvilleCascadiaCrabtreeCrawfordsvilleFosterHalseyHarrisburgLebanonLyonsMill CityScioSheddSweet HomeTangentAdrianArockBroganHarperIronsideJamiesonJordon ValleyJuntura
ZIP code
97480974829748797488974909749297493973289734197343973889736797357973649736597368973699737297376973809736697390973919739497498973219732297327973299733597336973459734897446973559735897360973749737797386973899790197902979039790697908979099791097911
2000rate area
CACCCCCBCBCBBCCCCBABBCBCCC.CCCCCCBCCCCCBBCCCCCCCC
2002rate area
CABCCCCBBBCBBCBCCBABBCBCCBBCCCCCCBBCCCCBBCCCCCCCC
2004rate area
CABCCCCBBBCBBCBCCBABBCBCCBBCCCCCCBBCCBCCBCCCCCCCC
2006rate area
CABCCCCBBBCBBCBCCBABBCBCCBBBCCBCBBBCCBBBBCCCCCCCC
2008rate area
CABCCCCBBBCBBCBCCBABBCBCCBBBCCBCBBBCCBBBBCCCCCCCC
2010rate area
CABCCCCBBBCBBCBCCBABBCBBCBBBCCBCBBBCCBBBBCCCCCCCC
County
LaneLaneLaneLaneLaneLaneLaneLincolnLincolnLincolnLincolnLincolnLincolnLincolnLincolnLincolnLincolnLincolnLincolnLincolnLincolnLincolnLincolnLincolnLincolnLinnLinnLinnLinnLinnLinnLinnLinnLinnLinnLinnLinnLinnLinnLinnLinnMalheurMalheurMalheurMalheurMalheurMalheurMalheurMalheur
* ZIP codes that changed rate area from 2008 to 2010 are indicated in bold.
Rate areas by ZIP code sorted by county H

2010 Oregon Child Care Market Price Study 66
2010, 2008, 2006, 2004, 2002 and 2000 Rate Areas for Oregon counties, cities and ZIP codes, sorted by county* (continued)
City or town
NyssaOntarioValeWestfallWillow Crk StAumsvilleAuroraDetroitDonaldGatesGervaisHubbardIdanhaJeffersonKeizerMarionMehamaMt. AngelSalemSalemSalemSalemSalem NESalem NESalem Rt 3, 4Salem St InstSalem WestScotts MillsSilvertonSt. PaulStaytonSublimityTurnerWoodburnBoardmanCecilHeppnerIoneIrrigonLexingtonBridal VeilCorbettFairviewGreshamGreshamOak GrovePortlandPortlandPortlandPortland
ZIP code
9791397914979189792097919973259700297342970209734697026970329735097352973079735997384973629730597306973099731797301973039730297310973049737597381971379738397385973929707197818978229783697843978449783997010970199702497030970809726897292972369724297266
2000rate area
CCCCCCCCCCCBCC-CCCBB--BBBBBCBCCCACCCCCCCAAAAAA.AAA
2002rate area
CCCCCCCCCCCCCBBCCCBBB-BBBBBCBCCCBCCCCCCCAAAAAAAAAA
2004rate area
CCCCCCBCCCCCCBBCCBBBB-BBBBBCBCCCBCCCCCCCAAAAAAAAAA
2006rate area
CCCCCCBCCCCCCBBCCBBBB-BBBBBCBCCCBBCCCCCCAAAAAAAAAA
2008rate area
CCCCCCBCCCCCCBBCCBBBBBBBBBBCBCBCBBCCCCCCAAAAAAAAAA
2010rate area
CCCCCCBCCCCCCBBCCBBBBBBBBBBCBCBCBBCCCCCCAAAAAAAAAA
County
MalheurMalheurMalheurMalheurMalheurMarionMarionMarionMarionMarionMarionMarionMarionMarionMarionMarionMarionMarionMarionMarionMarionMarionMarionMarionMarionMarionMarionMarionMarionMarionMarionMarionMarionMarionMorrowMorrowMorrowMorrowMorrowMorrowMultnomahMultnomahMultnomahMultnomahMultnomahMultnomahMultnomahMultnomahMultnomahMultnomah
* ZIP codes that changed rate area from 2008 to 2010 are indicated in bold.
Rate areas by ZIP code sorted by county H

67 2010 Oregon Child Care Market Price Study
2010, 2008, 2006, 2004, 2002 and 2000 Rate Areas for Oregon counties, cities and ZIP codes, sorted by county* (continued)
City or town
PortlandPortlandPortlandPortlandPortlandPortlandPortlandPortlandPortlandPortlandPortlandPortlandPortlandPortlandPortlandPortlandPortlandPortlandPortlandPortlandPortlandPortlandPortlandPortlandPortlandPortlandPortlandPortlandTroutdaleDallasFalls CityGrande RondeIndependenceMonmouthRickreallGrass ValleyKentMoroRufusWascoBay CityBeaverCloverdaleGaribaldiHeboManzanitaNehalemNeskowinNetartsOceansidePacifi c City
ZIP code
972019720297203972049720597206972099721097211972129721397214972159721697217972189721997220972219722797230972319723297233972259722997239972869706097338973449734797351973619737197029970339703997050970659710797108971129711897122971309713197149971439713497135
2000rate area
AAAAAAAAAAAAAAAAAAAAAAAAAA--ABBCAAACCCCCBCABACCACBA
2002rate area
AAAAAAAAAAAAAAAAAAAAAAAAAA--ABBCAAACCCCCBCABACCACBA
2004rate area
AAAAAAAAAAAAAAAAAAAAAAAAAAA-ABBCAAACCCCCBCABBCCACBA
2006rate area
AAAAAAAAAAAAAAAAAAAAAAAAAAA-ABBCAAACCCCCBBABBCBABBA
2008rate area
AAAAAAAAAAAAAAAAAAAAAAAAAAA-ABBCAAACCCCCBBABBCBABBA
2010rate area
AAAAAAAAAAAAAAAAAAAAAAAAAAAAABBCAAACCCCCBBABBCBABBA
County
MultnomahMultnomahMultnomahMultnomahMultnomahMultnomahMultnomahMultnomahMultnomahMultnomahMultnomahMultnomahMultnomahMultnomahMultnomahMultnomahMultnomahMultnomahMultnomahMultnomahMultnomahMultnomahMultnomahMultnomahMultnomahMultnomahMultnomahMultnomahMultnomahPolkPolkPolkPolkPolkPolkShermanShermanShermanShermanShermanTillamookTillamookTillamookTillamookTillamookTillamookTillamookTillamookTillamookTillamookTillamook
* ZIP codes that changed rate area from 2008 to 2010 are indicated in bold.
Rate areas by ZIP code sorted by county H

2010 Oregon Child Care Market Price Study 68
2010, 2008, 2006, 2004, 2002 and 2000 Rate Areas for Oregon counties, cities and ZIP codes, sorted by county* (continued)
City or town
Rockaway BchTillamookWheelerDaleAdamsAthenaCayuseEchoHelixHermistonMcNaryMeachamMilton-FreewaterPendletonPilot RockRiethStanfi eldUmatillaWestonCoveElginImblerLaGrandeNorth PowderSummervilleUnionEnterpriseImnahaJosephLostineWallowaFriendAntelopeDufurMaupinMosierShanikoThe DallesTygh ValleyBanksBeavertonBeavertonBeavertonBeavertonBeavertonBuxtonCorneliusForest GroveGales CreekGaston
ZIP code
9713697141971479788097810978139782197826978359783897882978599786297801978689787197875978829788697824978279784197850978679787697883978289784297846978579788597021970019702197037970409705797058970639710697005970069700797008971239710997113971169711797119
2000rate area
CBCCCCCCCCCCCCCCCCCCCCCCCCCCCCCCCCCCCCCAAAAAAAAABA
2002rate area
CBCCCCCCCCCCCCCCCCCCCCCCCCCCCCCCCCCCCCCAAAAAAAAABA
2004rate area
CBCCCCCCCCCCCBCCCCCCCCCCCCCCCCCCCCCCCBCAAAAAAAAABA
2006rate area
CBCCCCCCCCCCCBCCCCCCCCCCCCCCCCCCCCCCCBCAAAAAAAAABA
2008rate area
CBCCCCCCCCCCCBCCCCCCCCCCCCCCCCCCCCCCCBCAAAAAAAAABA
2010rate area
CBCCCCCCCCCCCBCCCCCCCCCCCCCCCCCCCCCCCBCAAAAAAAAABA
County
TillamookTillamookTillamookUmatillaUmatillaUmatillaUmatillaUmatillaUmatillaUmatillaUmatillaUmatillaUmatillaUmatillaUmatillaUmatillaUmatillaUmatillaUmatillaUnionUnionUnionUnionUnionUnionUnionWallowaWallowaWallowaWallowaWallowaWascoWascoWascoWascoWascoWascoWascoWascoWashingtonWashingtonWashingtonWashingtonWashingtonWashingtonWashingtonWashingtonWashingtonWashingtonWashington
* ZIP codes that changed rate area from 2008 to 2010 are indicated in bold.
Rate areas by ZIP code sorted by county H

69 2010 Oregon Child Care Market Price Study
2010, 2008, 2006, 2004, 2002 and 2000 Rate Areas for Oregon counties, cities and ZIP codes, sorted by county* (continued)
City or town
GlenwoodHillsboroManningNorth PlainsSherwoodTigardTigardTimberTualatinFossilMitchellSprayAmityCarltonDaytonDundeeLafayetteMcMinnvilleNewbergSheridanWillaminaYamhill
ZIP code
97116971249712597133971409722397224971449706297830977509787497101971119711497115971279712897132973789739697148
2000rate area
BAAAAAACACCCCBBBCCACCB
2002rate area
BAAAAAACACCCCBBBBBACCB
2004rate area
BAAAAAACACCCCBBBBBACCB
2006rate area
BAAAAAACACCCCBBBBBABCB
2008rate area
BAAAAAACACCCCBBBBBABCB
2010rate area
BAAAAAACACCCCBBBBBABCB
County
WashingtonWashingtonWashingtonWashingtonWashingtonWashingtonWashingtonWashingtonWashingtonWheelerWheelerWheelerYamhillYamhillYamhillYamhillYamhillYamhillYamhillYamhillYamhillYamhill
* ZIP codes that changed rate area from 2008 to 2010 are indicated in bold.
Rate areas by ZIP code sorted by county H


DHS 9837 (Rev. 12/2010)
Oregon Departmentof Human Services
This document can be provided upon request in alternative formats for individuals with disabilities. Other formats may include (but are not limited to) large print, Braille, audio recordings, Web-based communications and other electronic formats.
E-mail [email protected] or call 503-945-6110 (voice) or fax 503-373-7032 to arrange for the alternative format that will work best for you.