land cover/land use change - oregon state university
TRANSCRIPT

Land Cover/Land Use Change
12 May 2003
Outline
• Land cover classification
• Land cover change detection– Fire
– Desertification
– Deforestation
• Land use change detection– Rural/Urban transitions

Why it is important to map land cover andland use change?
• NASA key science questions for land cover/landuse:– Where are land cover and land use changing, what is the
extent and over what time scale?– What are the causes and what are the consequences of
LCLUC?– What are the projected changes of land use and land cover
and their potential impacts?– What are the impacts of climate variability and changes on
LCLUC and what is the potential feedback?

What is Land Cover?
• “Land cover” often designates only thesurface vegetation
• May also include non-vegetated surfaces(snow/ice, urban areas)

What is “Land Use”?
• The “use of land by humans”
• Typically has a functional/economicdesignation
• Land use is not always directly observable

Land Cover Classification
Land Cover Classification Schemes:– International Geosphere-Biosphere Programme (IGBP)
• 17 classes of land cover
– Modified IGBP• 24 classes of land cover
– Vegetation Lifeforms• 8 classes of land cover
– Vegetation Continuous Fields
– Normalized Difference Vegetation Index (NDVI)• proxy for “greenness”

IGBP Land Cover Classes

Satellite Land Cover Mapping
• Global scale:– AVHRR
– MODIS
• Local and regional scale:– Landsat TM or ETM+
– Synthetic Aperture Radar (especially for cloudyareas)

AVHRR Global Land Cover Products
• 1 km grid resolution
• IGBP land cover classes, modified IGBP, vegetationlifeforms
• Based on data collected from April 1992 - March 1993
• Available for free fromhttp://edcdaac.usgs.gov/glcc/glcc.html
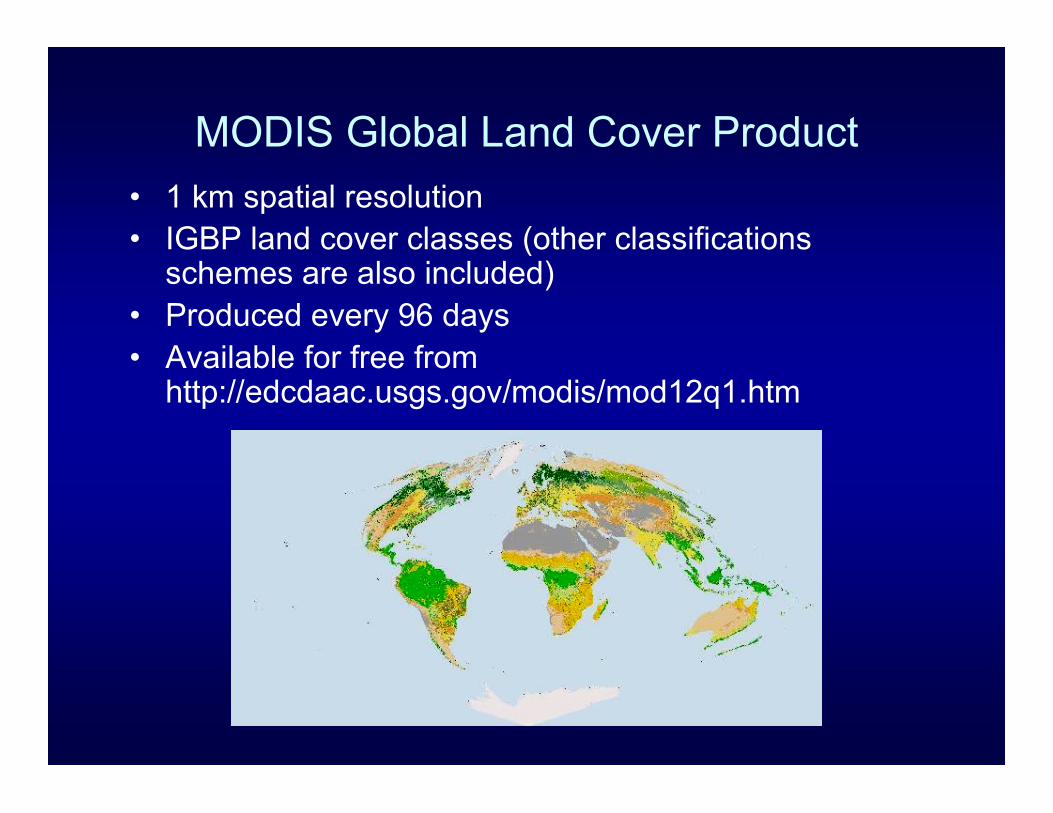
MODIS Global Land Cover Product
• 1 km spatial resolution• IGBP land cover classes (other classifications
schemes are also included)• Produced every 96 days• Available for free from
http://edcdaac.usgs.gov/modis/mod12q1.htm

MODIS Vegetation Continuous Fields(VCF) Product
• Describes tree cover, leaf type, leaf longevity– %treecover
– %broadleaf
– %needleleaf
– %evergreen
– %deciduous

MODIS VCF
• 500m spatial resolution
• Available for free from http://modis.umiacs.umd.edu
North Carolina VCF

USGS Land Cover Product
• Based on aerial photographs from 1970s and 1980s
• Variable spatial resolution (30m to 4 hectares)
• Covers coterminus U.S. and Hawaii
• Created using data acquired 199 - 199
• Available for free fromhttp://edc.usgs.gov/products/lulc.html
Land Cover Change
• Fire mapping
• Desertification
• Deforestation
• Changes in growing season/vegetationgreenness

Fire Mapping
• Important for:– fire monitoring and post-burn management
– estimating biomass burning emissions (tropospheric ozone,carbon monoxide, formaldehyde, carbon dioxide, etc.
• Fire properties from thermal remote sensing:– active fire detection
– fire characterization
– burned area mapping
• MODIS fire products
• ATSR World Fire Atlas

MODIS Fire Products
• 8-day and monthly temporalcomposites– 1 km spatial resolution– fire occurrences– strength of fire– total burned area
• Daily fire product– 5-km spatial resolution
• Active fire detection– daily fire maps– each detection is the center
of a 1km pixel– Available for free from
http://rapidfire.sci.gsfc.nasa.gov

MODIS Fire Product
• Comparison ofMODIS fire detectionin 1 km pixels withASTER 90m pixels
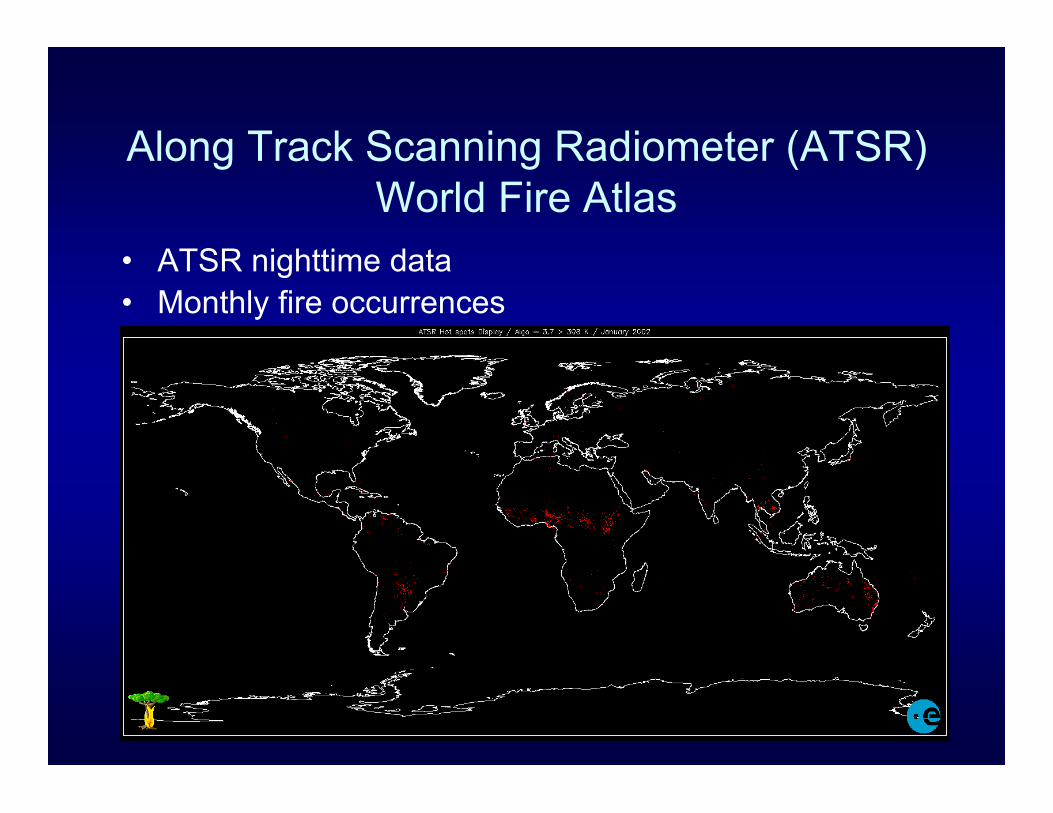
Along Track Scanning Radiometer (ATSR)World Fire Atlas
• ATSR nighttime data• Monthly fire occurrences
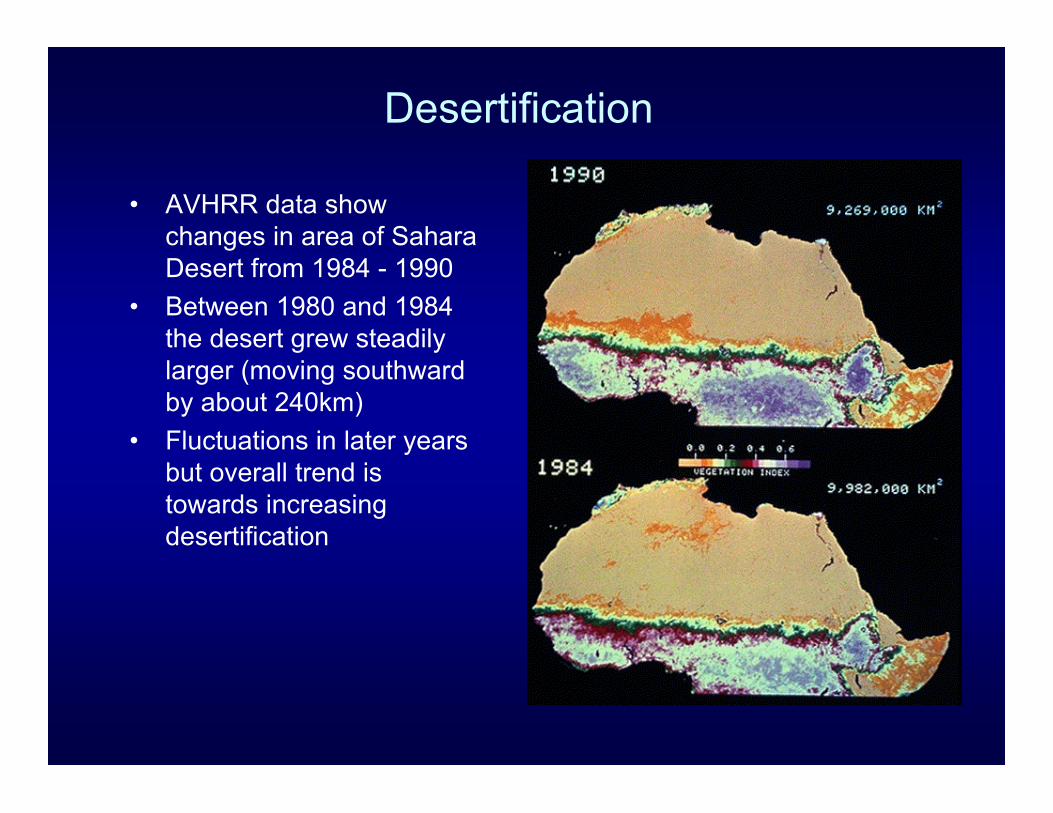
Desertification
• AVHRR data showchanges in area of SaharaDesert from 1984 - 1990
• Between 1980 and 1984the desert grew steadilylarger (moving southwardby about 240km)
• Fluctuations in later yearsbut overall trend istowards increasingdesertification

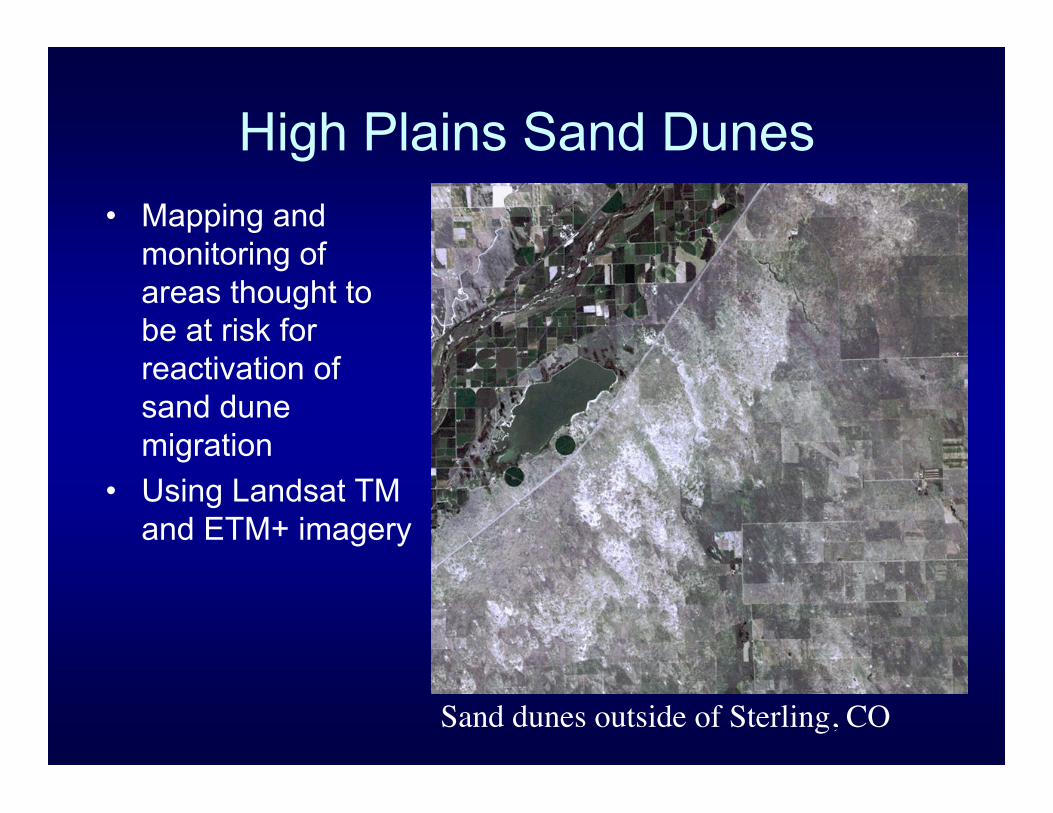
High Plains Sand Dunes
• Reactivation of sanddunes in the HighPlains region of theU.S.
• Climate changeimplications
High Plains Sand Dunes
• Mapping andmonitoring ofareas thought tobe at risk forreactivation ofsand dunemigration
• Using Landsat TMand ETM+ imagery
Sand dunes outside of Sterling, CO
Deforestation
• Implications for:– carbon cycle
– biodiversity
– hydrology
– sustainability
• Remote sensing is useful for mapping global changesin forest cover– multispectral and synthetic aperture radar
– multi-temporal mapping for change detection

Forest Clearcutting in Alberta, Canada
Multi-spectral imagery SAR imagery

Amazonian Deforestation Mapping
• Uses JERS-1 Synthetic Aperture Radar• Penetrates through cloud cover• 30m spatial resolution

Landsat TM
• Multispectral mapping of vegetation– Change in NDVI– Change in albedo
Rondonia, Brazil British Columbia, Canada

Synthetic Aperture Radar• Backscattering properties vary with vegetation cover
• Useful for regions with persistent cloud cover
Red areas indicate tropical deforestation SAR images from 2 dates show increasein deforestation over 15 months
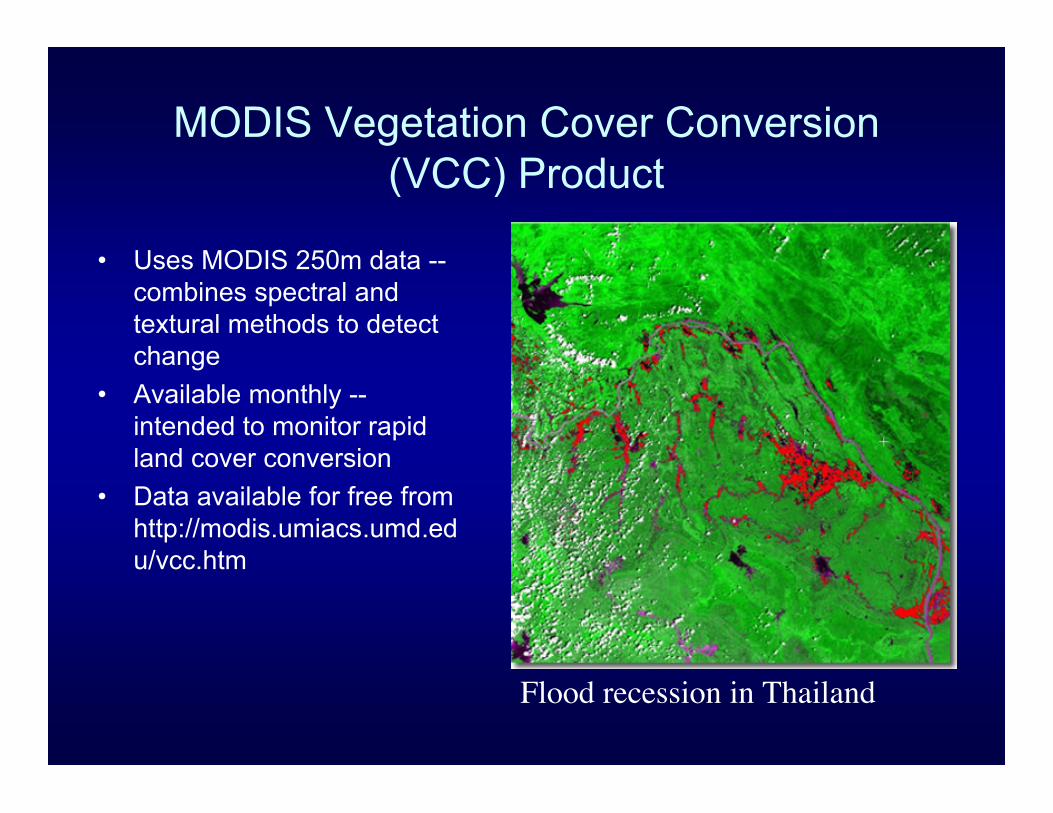
MODIS Vegetation Cover Conversion(VCC) Product
• Uses MODIS 250m data --combines spectral andtextural methods to detectchange
• Available monthly --intended to monitor rapidland cover conversion
• Data available for free fromhttp://modis.umiacs.umd.edu/vcc.htm
Flood recession in Thailand

Changes in Growing Season
• Using NDVI data from1981 to 1999,researchers havefound that spring hasadvanced by about 8days (±4 days) inNorth America, 11days (±3 days) inEurasia and thatautumn was alsodelayed

Changes in “Greenness” Level
• NDVI data show that average greenness level hasincreased since 1981

Land Use Change
• Forest to agricultural (Amazon and otherregions)
• Rural to Urban

Land Use Change
• Urban sprawl infringes on agricultural ornaturally vegetated land
• City growth is an indicator of industrialization
• Remote sensing provides multi-temporalanalysis capability– Typically need high spatial resolution
– Multispectral data needed to distinguish betweenland cover classes
– SAR data show change in backscatter properties
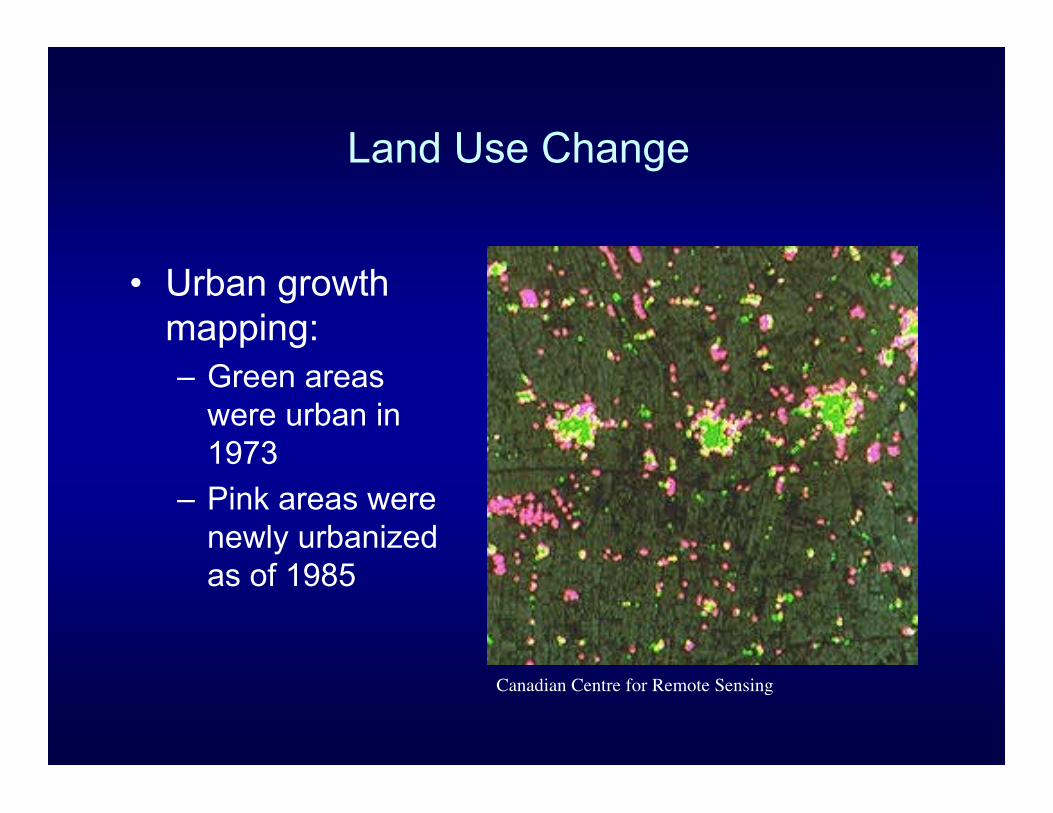
Land Use Change
• Urban growthmapping:– Green areas
were urban in1973
– Pink areas werenewly urbanizedas of 1985
Canadian Centre for Remote Sensing

Gap Analysis Program
• Goal is to identifygaps in biodiversity
• Administered on astate-by-statebasis
• GAP combinesland cover maps,vertebrate speciesdistribution data,stewardship info
• Land cover ismapped usingLandsat TM data