market participants can follow certain foolproof...
TRANSCRIPT

For Pr ivate Circulat ion Volume 1 Issue 55 19th Sept ’11
Market par ticipants can fol low cer tain foolproof fundamentals to
pick right stocks and diversify their por tfol io in t imes l ike these,
when volati l i ty rules the roost
QUEST FORQUALITY


It’s simplified...Beyond Market 19th Sept ’11 3
DB Corner – Page 5
Restrained EnthusiasmFear and uncertainty among investors has forced companies to defer or in some cases abandon their plans to go in for IPOs – Page 6
Code DecodedThe new ‘game changing’ takeover norm by SEBI aims to strike a balance between the stakeholders in a win-win manner - Page 9
Quest For QualityMarket participants can follow certain foolproof fundamentals to pick right stocks and diversify their portfolio in times like these, when volatility rules the roost - Page 12
Increasing AccountabilityThe need for a more comprehensive legal framework necessary to promote growth of private pools of capital led the SEBI to formulate a set of guidelines to regulate alternative investment funds - Page 18
New Offerings With A Global AppealThe introduction of new global indices futures trading by NSE will enable market participants to benefit from S&P 500 and DJIA - Page 22
In Your Best InterestBorrowers would be better off if they prepay their loan amount or get the tenure of their loan extended when interest rates rise - Page 24
Clouded By GloomThe turbulence in the US economy and the uncertainty in the Eurozone do not bode well for an export–led Asian economy like India- Page 26
Getting The Act RightThe dynamics of film production have changed a great deal; nowadays films are produced with the main focus on breaking-even much before a movie hits theatres - Page 29
Under Construction. Inconvenience RegrettedDespite opportunities, the construction sector is besieged with hurdles that are hampering growth - Page 32
Fortnightly Outlook For Commodities. - Page 35
Fortnightly Outlook For Currencies - Page 36
Guru MantraMaintaining the characteristics of the fund, while trying to marry growth and value is one of the many keys to being a successful fund manager, says Tridib Pathak - Page 38
Keeping Date With Debt FundsMore and more retail investors are turning to long-term debt funds in turbulent times like we are witnessing at present - Page 42
Back Door Entry?Of the many changes being considered by SEBI to revive the mutual fund industry, the introduction charges is one of them and it is hoped to benefit distributors too – Page 44
Important Statistics For The Fortnight Gone By – Page 47
Four Seasons In A Stock’s Life CycleEvery stock follows a cyclical path and is therefore, imperative for the market participants to know the exact stage at which a stock is trading, to make the right investment decision – Page 52
Volume 1 Issue: 55, 19th Sept ’11
Editor-in-Chief & Publisher: Rakesh BhandariEditor: Tushita NigamSenior Sub-Editor: Kiran V Uchil
Art Director: Sachin KambleJunior Designer: Sagar Padwal
Marketing & Operations:Savio Pashana
We, at Beyond Market welcome your views, comments and feedback. Do help us to grow better as per your liking. This is our attempt to reach you better while crossing horizons...
Web: www.nirmalbang.com [email protected] No: 022 - 3926 8047
HEAD OFFICE Nirmal Bang Financial Services Pvt LtdSonawala Building, 25 Bank Street, Fort, Mumbai - 400001 Tel. 022-3926 7500/7501
CORPORATE OFFICE B-2, 301/302, Marathon Innova,Off Ganpatrao Kadam Marg,Lower Parel (W), Mumbai - 400 013Tel: 022 - 3926 8000/8001
Research Team: Sunil Jain, Kunal Shah, Michael Pillai, Sunit Mehta, Vikash Bairoliya, Runjhun Jain, Amish Pansuriya,Kavita Vempalli, Ruchita Maheshwari, Silky Jain

DIRECTIONAL VIEWS
Tushita NigamEditor
Investing in the stock markets is now treated at par with having a job or a profession. It is looked at as a fruitful investment avenue that each one seeks to benefit from. But considering the volatility in the stock markets, many investors seek to know when is the right time to enter the markets or make fresh or additional purchases.
While every market expert has his own way of interpreting this question, we at Beyond Market have simplified the process of stock-picking for you in times of volatility in the markets. By using fundamen-tals, market participants can identify right stocks and diversify their portfolio to achieve long-term gains. Our cover story will help you understand these fundamentals better and enable you to take cues from the stocks we have chosen.
Apart from this, there is an article on how companies that were planning to come out with IPOs have either deferred or abandoned their plans fearing lack of response and volatility in the markets. Another article dwells on the revamped takeover code, which is hoped to benefit investors and stakeholders of the target company, alike.
There are also articles on the guidelines by SEBI to regulate alternative investment funds, the introduc-tion of new global indices futures trading by NSE, the modes of repayment before home loan takers in the current scenario where interest rates are rising constantly and the changing face of film production, among others.
In our Beyond Basics section, there is an interesting piece on the latest developments made by the market regulator SEBI to bring about a change in the mutual fund industry, which had been performing poorly since the abolition of entry load.
Beyond Market constantly endeavours to bridge the gap between individuals and the financial world. We have, therefore, introduced a new section called ‘Beyond Work’ where we plan to highlight the lighter side of fund managers and corporate honchos by giving an insight into their life outside work. In the current issue, Tridib Pathak, Director Equity and Senior Fund Manager at IDFC Mutual Fund, speaks about his life and experiences and what led him to becoming a successful fund manageR.
It’s simplified...Beyond Market 19th Sept ’114

It’s simplified...Beyond Market 19th Sept ’11 5
Traders should avoid keeping
overnight positions.
Disclaimer It is safe to assume that my clients and I may have an investment interest in the stocks/sectors discussed. Investors are required to take an independent decision before investing. Investment in equity is subject to market risk. Our research should not be considered as an advertise-ment or advice, professional or otherwise. The investor is requested to take into consideration all the risk factors including their financial condition, suitability to risk return profile and the like and take professional advice before investing.
Nifty: 5,012.55Sensex: 16,709.60(As on 14th Sept ’11)
he sovereign debt crisis in Europe continued to weigh heavily on the global markets in the
previous fortnight.
Greece’s two-year government bond yield rate of over 66% and the 10-year bond yield rate of over 23% clearly indicate the growing possibility of a default by the country.
Although Greece’s GDP is only 2% of the Eurozone and has a 3% loan of the total loan in the Eurozone, the bigger problem, however, is the contagious impact of the default by Greece on other high-debt countries like Italy. In fact, Italy is the third largest economy in the Eurozone with the second highest debt in the world.
In the US, President Barack Obama recently proposed a $447 billion package to revive a stalled job market there. The package includes $240 billion in short-term payroll and investment spending tax cuts.
However, its implication on the US economy and subsequently the rest of the world will be known only after it is passed as it is currently facing opposition from the Republicans.
Talking about India, the IIP numbers have been low due to the de-growth in the capital goods segment. However, the consumer durables segment continues to grow, showing that consumer demand is yet strong. Rainfall too has been good at 3% above normal.
Inflation continues to be a source of worry for the government. The inflation numbers for the month of August have been higher than expected at 9.78%.
Also, the sharp depreciation of the rupee on the back of uncertainties in the global economy and rising trade
T deficit in India, has taken corporates by surprise. This can impact companies, both positively and negatively, depending on their exposure to the international markets.
Market participants should avoid buying at the upper levels as the markets are expected to be range-bound.
The Nifty has resistance at the 5,150 – 5,200 levels. Traders should avoid keeping overnight positions. However, investors can consider buying stocks on declines.
Stocks like Everest Kanto Cylinder Ltd (LTP: `74.10), Munjal Showa Ltd (LTP: `64.05), Petronet LNG Ltd (LTP: `177.10), Mahindra & Mahindra Ltd (LTP: `792.70), Praj Industries Ltd (LTP: `71.40) and Yes Bank Ltd (LTP: `276.70) can be looked at on declines from an investment perspective.
Further, traders and investors should be watchful of the Eurozone crisis and how it unfolds as the situation in this region will determine the course of the global equity markets in the near term.
Market participants can also expect the RBI to hike key interest rates by 25 basis points in line with market expectations, while addressing slow growth in the economY.

It’s simplified...Beyond Market 19th Sept ’116
Fear and uncertainty
among investors has
forced companies to
defer or in some cases
abandon their plans to
go in for IPOs
RESTRAINEDhe storm brewing in the stock markets, has taken with it the dreams of many Indian companies that want
to go in for public listing. India’s benchmark index, the Sensex, has declined by 5.21% in the last one year and with the possibility of a double dip recession in the US, investors are staying away from the equity markets.
Fear and uncertainty among investors has put the lid on the initial public offerings of 15 companies, including the likes of Anil Ambani Group’s Reliance Infratel, Jindal Power (`7,200 crore), Reliance Infra (`5,000 crore), Lodha Developers (`2,500 crore) and Gujarat State Petroleum Corp Ltd (`3,067 crore).
T The 15 companies would have raised an estimated `25,000 crore from the market had they gone ahead with their IPO plans. It was a deliberate decision by the companies to let their plans lapse, even though they had received the initial nod for their IPOs from the market regulator, the Securities and Exchange Board of India (SEBI).
SEBI gives a one-year window to companies to go through with their IPO, once they receive the regulatory nod. After the one-year window lapses, companies need to re-file their updated draft red herring prospectus with SEBI. But, perhaps, looking at the lack of interest among investors and the volatile market, these 15 companies have decided not to go
ahead with their IPO plans.
Not surprisingly, a majority of companies, that have let their IPOs lapse, are from the real estate sector, which is currently out of favour with investors, both Foreign Institutional Investors and retail investors.
The Bombay Stock Exchange Realty Index, an index of 14 real estate stocks, has lost 50% in value in the last one year. The loss has been on account of declining residential sales, high debt of companies and concerns over corporate governance in real estate companies.
Companies such as BPTP Ltd, Ambience Ltd and Kumar Urban
ENTHUSIASM

It’s simplified...Beyond Market 19th Sept ’11 7
ENTHUSIASMDevelopment Ltd, among others have forgone their public funding plans, although real estate companies are in dire need of funds.
The problem with real estate IPOs goes beyond weak market sentiments. Expensive valuation of real estate developers is keeping investors away. In the year 2007, when the market was at a high, many real estate developers listed at high valuations. Things went downhill for companies when the global economy crashed in September ’08.
The crash hit the Indian real estate sector, with real estate prices correcting up to 50% and real estate company stocks losing more than half
of their share value. For instance, DLF, the largest developer by market value, is now trading at around `197, more than half of its listing price of `525.
Analysts say that now when their peers are looking at listing themselves, they expect the same valuations, but investors do not want to blindly put money in real estate IPOs anymore.
Investors have begun looking at the valuations and cash flow of developers, instead of merely investing in a company based on its land bank valuation. And any developer, who is not able to justify its valuation, is finding it tough to
obtain investors who would be willing to put money in his company.
The rush for IPOs from the real estate sector is similar to the one seen in the year 2007 when the country’s largest realtor, DLF Ltd, went public, except for the fact that this time around, barring a few companies, the rest have been unsuccessful in raising money from the equity market.
The IPO fever began in late 2009 and early 2010 when real estate developers filed for IPOs, encouraged by the revival in the stock market. The successful IPO of Godrej Properties, which was subscribed by 4 times also gave hope to companies that the IPO market is back.

It’s simplified...Beyond Market 19th Sept ’118
Analysts believe that a real estate IPO will go through, only if promoters offer a heavy discount to its investors and keep the valuation at a realistic level. This, however, seems unlikely given the fact that most developers are going in for an IPO to raise cash to repay their debt obligations or to meet working capital requirements.
For instance, New Delhi-based BPTP was planning to use one-fourth of the IPO proceeds of ̀ 1,500 crore to lower its debt. Listing at a discount, therefore, does not make any sense for them. It is a catch-22 situation for developers. Unless builders blink and offer discounts, their dreams of an IPO will remain just that.
Lapsed initial public offerings is not the only problem. A lot of companies have either shelved or delayed their IPO plans because of weak markets. While Galaxy Surfactants Ltd withdrew its IPO in May this year because of poor response to its IPO, public sector companies like Steel Authority of India Ltd (SAIL) and Oil & Natural Gas Corp (ONGC) have deferred their follow-on public offerings. Analysts believe that given the weak IPO market, the government will find it difficult to meet its $9 billion divestment target for the year 2011-12.
Recently, Micromax Informatics Ltd, India’s third-largest mobile handset maker by sales, withdrew its `466-crore IPO on 17th Jun ’11. In a statement, Micromax said the company board recommended withdrawing the IPO to “allow the company to focus on new product launches and product development.”
Micromax, which is backed by private equity investors such as TA Associates, Sandstone Capital LLC, Madison Capital Management LLC and Sequoia Capital India, had filed a draft red herring prospectus in
October last year, which was approved by SEBI in January ’11.
The company had earlier cut its issue size in March, from $150 million to $105 million. Mircomax had also gone on road shows and met investors globally before it decided to withdraw its IPO. Now, the company has said it will look at renewing its IPO plans in FY13.
Analysts believe that companies are consciously withdrawing from IPOs, for mainly two reasons. One, they feel the issue may not get a very good response and the other, going by the recent IPOs, companies feel that after listing, their stock will trade below the issue price.
According to data from Prime Database, 157 companies raised `70,627 crore from the IPO market, between 2007 and 2009. Of the 157 IPOs, around 84 are currently trading below their issue price.
The proof of the lackluster IPO market lies in the fact that the amount of funds raised by companies through IPOs and rights issue fell 75% month-on-month to `1,195.6 crore in June ’11, over the amount raised in May this year.
“During June ’11, `1,195.6 crore was mobilized in the primary market through seven issues, compared to `4,781.1 crore mobilized through five issues in May ’11, showing a decrease of 75% over the previous month,” said a ‘Capital Market Review’ released by SEBI.
Data provider Dealogic says the amount of money raised through IPOs in India has fallen by more than 80% year-on-year. The company says that in the past six months there have been 22 listings in India, raising a combined $780 million compared to $4 billion raised from 28 IPOs during
the same period last year. On the contrary, global IPO fundraising for year-to-date till July ’11 is up 14% at $114 billion, led by listings in Hong Kong and the US. Analysts, however, are of the opinion that while the number of lapsed or withdrawn IPOs is high, this is still better than 2008-09, when the market condition was worse than it is now. In early 2008, when the Sensex hit an all-time high of 21,200, many companies filed for an IPO, in the hope of raising easy money.
But the global economic downturn which came in September of 2008, hit the stock market so badly that the Sensex dropped to 8,000 points in March ’09. During this time, nearly 29 companies, which had received regulatory approval, either withdrew their IPOs or let them lapse. This time around, the situation is not as bad.
Companies whose IPOs have lapsed are now looking at other funding options, such as private equity or debt instruments like non-convertible debentures. The IPO story is however not completely over. Analysts say companies with strong fundamentals and cash flow will still find interest among investors.
For instance, in the last one year, small companies such as Lovable Lingerie Ltd, have given phenomenal returns to investors. The lingerie maker’s IPO, was subscribed by over ten times and has given 82.7% returns to investors in just a span of around five months.
Once the volatility in the market subsides and there is more clarity on the future course of the global markets, we could see some IPOs hitting the market. Whether the IPO will do well or not, will depend entirely on the valuation and the timing of the issuE.

It’s simplified...Beyond Market 19th Sept ’11 9
CODE DECODEDThe new ‘game changing’ takeover norm by SEBI aims to strike a balance between the stakeholders in a win-win manner
ndia hopped on to the economic reforms’ bandwagon in the year 1991, and thus began its journey of
liberalization. Six years later, in the year 1997, the government instituted a formal takeover code which governed mergers and acquisitions in corporate India.
While liberalization was followed by globalization, the takeover code remained intact, until much later in September ’09 when the market regulator the Securities Exchange Board of India constituted a Takeover Regulation Advisory Committee (TRAC) to review the then prevailing norms and make them more relevant for the present day scenario.
The TRAC recommendations were made public in July last year. However, it was followed by internal
I

It’s simplified...Beyond Market 19th Sept ’1110
deliberations by SEBI. And on 28th July this year, at its board meeting, SEBI cleared the decks for the revamped takeover code.
While the fine prints are yet to be unveiled, SEBI has considered most recommendations by TRAC and made sweeping changes to the old norms. As a starter, the trigger point for open offer has been increased to 25% from 15% and the open offer size, after the 25% trigger is hit, has been enhanced to 26% from the current 20%.
What does the enhanced trigger mean? It means that a potential acquirer, who would have either paused below 15%, or would have come out with an open offer, can now continue making creeping acquisitions of an additional 10% stake in the target company. Take the case of Hotel Leela Ventures Ltd, wherein ITC Ltd currently holds a 14.5% stake. Under the new code, ITC can buy another 10% and continue to be a substantial shareholder of Hotel Leela and still stay away from making an open offer for additional 26% stake.
Equally interesting is the case of EIH Ltd. This hospitality company which owns and operates the Oberoi chain of hotels also has Reliance, apart from ITC as its 14.5% shareholder. These are some of the cases where the effectiveness of the new takeover code will be tested in the days to come.
Beyond the 25% trigger, if an acquirer makes an open offer and successfully acquires an additional 26%, then the result of the two would be a ‘controlling’ 51% stake in the target company. That is the ‘game changer’.
Under the old norms, it was not easy for an acquirer to obtain a controlling stake in a target company, informs an
investment banker. With the new norms, the concept of a buyout will now be a reality in India, he adds.
The revised norms would certainly change the dynamics of mergers and acquisitions in India. In the distant past, corporate India has seen some interesting cases of hostile takeover attempts. While not many tasted success, Bombay Dyeing & Manufacturing and the erstwhile GESCO Corporation (now Mahindra Lifescapes) did manage to grab headlines. However, the hostile attempts turned out to be futile.
Coming back to the TRAC recommendation, the so-called dynamic revisions have not taken all the recommendations into consideration. Against the 26% open offer, TRAC had proposed an open offer size of 100%; post the 25% trigger being hit. Had the 100% recommendation been implemented, small investors in the target company would have been freed up. And delisting, in that case, would have been the subsequent corporate action for the acquired company.
No doubt, the acquirer in that case would have been compelled to commit more resources and be even more serious about the target company. That, for an Indian company planning to acquire another Indian company would have been a bit tougher, considering that banks, according to the norms laid down by the Reserve Bank of India, are not supposed to finance takeovers.
While the new norms widen the enhanced shareholding window for the acquirer, owing to the additional 10% buffer with 15% trigger norm changed to 25% , it also gives respite for the target company.
Unlike earlier norms where the acquirer was supposed to get a total
35% of the company, 20% open offer after the 15% trigger, the new norms require the acquirer to buy 51% at the end of the open offer. That is an additional cost. Here, SEBI, believe experts, has actually achieved two important goals.
Firstly, with the new code, India will be able to woo investors and secondly, the additional cost will ensure that only financially stronger players will enter the fray for takeovers. In addition to this, the recommendation by the board of the target company has been made mandatory under the new code.
Needless to say, prominent Indian companies operate with their promoter holdings ranging from 25% to 30%, where special resolutions can be blocked above 25%. Strategic investors like venture capitalists and private equity players would be the most excited among investors with the new code by SEBI.
At the earlier 15% trigger, it was not sensible for such investors as promoters would totally sideline them. Under the new code, an investor can acquire up to 24.99% in the company, avoid making any open offer and also comfortably block promoter’s special resolutions as substantial shareholders along with some scattered support.
What next? While investors have reasons to cheer with the new code, the promoters of Indian companies would soon get busy exploring methods to counter possible hostile bids that could hurt them in the coming days. While average shareholding in Indian companies is in the range of 20% to 40%, BSE 500 index has 210 companies where promoter holding is below 51%. There are 24 companies in the same index where promoter holding is currently below 26%. Therefore, it

It’s simplified...Beyond Market 19th Sept ’11 11
would not be surprising to see instances of promoters being allotted convertible warrants.
Beyond the tug of war of percentages and prices, there is both good and bad news. Good news for small investors in target companies and bad news for promoters of such target companies. The old regulations permitting the payment of non-compete fee up to 25% of the offer price to the exiting promoters of the target company, in addition to the decided offer price, now stands deleted.
This means promoters’ years of hard work towards building the company would not fetch them an extra buck, unless the offer price to other shareholders is revised to the same extent. Not all acquirers would be generous in rewarding shareholders in order to reward the promoters.
This, by and large, serves the purpose of protecting the interests of minority shareholders, says an investment banker who cites the case of the Cairn-Vedanta deal. Going forward, we will not see such non-compete fee
element in the mergers and acquisition deals, he explains.
Until the fine prints are out and the new takeover code is used as the base for acquisitions, the new norms reflect a meticulous attempt by the market regulator - SEBI to juggle with the interests of all the stakeholders in the game. Needless to say, the new norms make ‘takeovers’ a reality from erstwhile acquisitions. But the cost, price and tenability of the code will get decoded with its authentic use in the days to comE.
COMMODITY FUTURESCrude Oil $98/barrel
Nickel$28,000/tonne
Pepper`25,000/quintal
Silver $32/troy ounce
Zinc $2,100/tonne
Aluminium $2,450/tonne
Chana`2,500/quintal
Copper $8,500/tonne
Jeera`14,000/quintal
Cardamom `1,000/kg
Gold $1,500/troy ounce
Guar Seed `3,200/quintal
Our research goes beyond numbers to identify the forces that affect the kundali of commodities - global events, domestic issues, and everything in between. Which is why, our predictions have invariably come true on several occasions, proving that we are among the best in the industry when it comes to commodity trading.
Predicting Accurate Results. Consistently.
w w w.nirmalbang.com
E Q U I T I E S * | D E R I V AT I V E S * | C O M M O D I T I E S | C U R R E N C Y * | M U T U A L F U N D S ^ | I P O s ^ | I N S U R A N C E ^ | D P *
CORPORATE OFFICE: B-2, 301/302, Marathon Innova, O� Ganpatrao Kadam Marg, Lower Parel (W), Mumbai - 400 013. Tel: 022 - 39268000 / 8001; Fax: 022 - 39268010R E G D. O F F I C E : S onawala Bui ld ing, 25 Bank Street , For t , Mumbai - 400 001. Tel : 022 - 39267500 / 7501; Fax : 022 - 39267510
BSE SEBI REGN No. INB011072759, INF011072759 & INE011072759, NSE SEBI REGN No. INB230939139, INF230939139 & INE230939139 DP SEBI REGN. No NSDL: IN-DP-NSDL-136-2000, CDS(I)l: IN-DP-CDSL-37-99, AMFI REGN. No. arn-49454 NCDEX REGN. NO. 00362, FMC Code-0075, MCX REGN. No. 16590, FMC Code-MCX/TCM/CORP/0490, MCX SX-INE260939139, PMS-INP000002981
Disclaimer: Insurance is a subject matter of solicitation. Mutual Fund investments are subject to market risk. Please read the scheme related document carefully before investing. Please read the Do’s and Don’ts prescribed by Commodity Exchange before trading. The PMS Service is not o�ering for commodity segment. *Through Nirmal Bang Securities Pvt. Ltd. ^Distributors #Prepared by Research Analyst of Nirmal Bang Commodities Pvt. Ltd.
For job openings at Nirmal Bang, visit http://www.nirmalbang.com/careers.aspx

ust when we thought that the economies around the world were showing signs of improvement, the situation
in the US and the Eurozone sent markets into a tizzy.
While President Barrack Obama is working out a proposal to inject more dollars into the US economy mainly
J through tax cuts and direct aid to states through the whole of next year, bailout packages are been chalked out for Greece and other Eurozone countries. This clearly indicates that world leaders have been doing everything in their capacity to salvage the situation and prevent the world from delving into another recession. Needless to say, while momentary
bouts of good news are propping up stocks sporadically, the volatility that we are witnessing in the markets is here to stay.
So what should an investor do at this point in time? Should he stay away from the markets? No, doing so would mean going against the fundamentals of investing. Instead,
Market par ticipants can fol low cer tain foolproof fundamentals to pick right stocks and diversify their por tfol io in t imes l ike these, when volati l i ty rules the roost
QUEST FORQUALITY
It’s simplified...Beyond Market 19th Sept ’1112

It’s simplified...Beyond Market 19th Sept ’11 13
he should go back to the basics. There are certain principles you cannot go wrong with and we are here to tell you the same. Some classic investing norms can be used to bottom fish or buy the cheapest investments in times of volatility. Besides, valuations are attractive and instead of just watching the depressing red on the tickers you could actually land up with some gems in times like these!
GOOD QUALITY MANAGEMENT
Although there are no mathematical parameters to judge the quality of the management, there are certain things you could watch out for. Check the dividend-paying history of the company. If a company has been paying regular dividends to investors even during unfavourable times, it is a keep over those who do not pay any dividend at all.
Also watch out for companies with high promoter holding. If company insiders themselves do not believe in the company, then investors too have no business in believing in it. The quantum of pledged shares of a promoter is also something an investor needs to be wary of. At a time when everything around is crashing at a breakneck speed, the quantity of shares pledged by a company is a good reason to stay away from the stock. It is especially relevant in smaller companies.
In a cash crunch scenario there is a big risk of margin calls on these companies by lenders. This essentially means that when markets fall, banks ask for either higher collateral or more cash to maintain their credit line.
With smaller companies, there is always a risk of not being able to meet these margin calls and ending up losing control over the company.
But do not be sceptical of all the companies that have pledged shares. There are several large corporate houses that have pledged shares as collateral in order to mobilize resources. The Tata Group, for instance, pledged shares to raise some cash and restructure its high cost debt.
Lastly while looking out for a company with good quality management do a thorough background check on the history of the company and its promoters. It is only fair to be sceptical at a time when there are numerous scam-tainted individuals who may be promising the moon to investors but have fly-by-night business models. It is best to do a thorough check on the company and its management before making any investment decision.
THE GROWTH FACTOR
If you have been a regular investor, you are no stranger to the fact that share prices are driven by growth. Hence, you need to look at the growth trajectory of a company before you make your investment decision.
Little or no growth does not augur well for a company or an industry. Markets are bothered about the future growth prospects of a company for capacity expansion plans or the order book of the company.
In a scenario like this, high interest rates and rising input costs have impacted the growth of the manufacturing sector. Core sectors such as cement, steel and electricity show a veritable slowdown in growth in difficult times. But what is working for a country like ours, where demographics are in our favour, is the domestic consumption theme.
Therefore, while the cement industry is growing at a CAGR of 8% to 10 %, the consumer durable industry is
growing at a CAGR of 15% pa. Also, watch out for the past growth rate of the company. It is especially relevant in the case of the financial sector. HDFC Bank, known to be a lender with a conservative approach, has been growing at a CAGR of more than 30% over the past few years. Look out for instances like this.
The compound annual growth rate is an important ratio traditionally looked at to measure growth. However, make sure that you do not restrict growth to growth in sales alone (net interest income in case of banks) while looking at growth.
Hence, broaden your horizon and look for growth in earnings per share to get a clearer picture. If a company is able to increase sales and profit after tax, with the dilution of equity then EPS may not grow and share prices may not be able to perform.
LOW DEBT EQUITY RATIO
Ideally, when you are looking out for debt equity ratio, the companies that have a debt equity ratio of 1 and below should be on your list. Especially at a time when the economy is slowing down, a company with heavy debt would see their profitability erode.
The high debt component goes even higher, as the working capital cycle gets stretched further and banks as well as financial institutions turn sceptical about doling out loans at these times. The companies that start borrowing to repay the debt and interest, may fall into a further debt trap. Rising interest cost to service the high debt is bad news to the company.
At such times, companies resort to desperate measures such as selling assets at unattractive prices. In a slowdown like situation, companies with a high debt component are likely

It’s simplified...Beyond Market 19th Sept ’1114
to get de-rated and this impacts their valuation negatively.
On the other hand, companies that have low debt can not only keep their interest costs down successfully, they can also invest the cash back into the business in times of trouble. If a company has a history of high debt to equity ratio, it indicates inefficient management of cash flows. Companies may have painted a rosy picture, showing great expansion plans and justifying the need to leverage, but it all comes to naught when bad times fall upon them.
During a slowdown, companies with high debt may even face critical risks to their business in the absence of adequate cash flows. An investor should carefully look at the debt equity ratio and avoid companies that are high on this parameter.
HIGH ROE
While making an investment decision you may obviously want to invest in a company that generates profits more efficiently than its rivals. The Return on Equity or ROE gauges the profit-generating efficiency of a
company. For an investor, the ROE can be the single most powerful tool to analyse the efficiency of a company and can give you a clearer picture instead of just looking at the PE ratio of the company.
The thumb rule here is that the ROE has to be more than the cost of capital. The Return on Equity is calculated on the basis of profit after tax as percentage of networth, whereas cost of capital is risk-free rate of interest plus risk weighted premium. (10 years GOI bond yield at 8.25% + risk weighted premium rate of say 6%, so cost of capital is 14.25%). If a company is not able to generate a consistent ROE of over say 14.25% in the long run, there is no point of investing in that company.
High growth companies with an ROE of around 20% or more are considered as good companies in the Indian context. You can say that these companies have good fundamentals and a defined growth path.
If the ROE of a company has been increasing over the years, it means that the company is operating in an improved business environment and is making efficient use of capital. This
generally translates into improved valuations for the company.
On the other hand, if the ROE of the company is decreasing, one needs to be cautious. However, sometimes decreasing ROE could be an implication of cyclical factors that are short term.
However, if it continues for a longer period of time, you can consider exiting. A high ROE company is, therefore, a definite pick. Companies which have a low debt component as well as a high ROE are definite winners and can be considered by market players.
REASONABLE VALUATIONS
Last but not the least, remember that you have to find a growth stock at a reasonable valuation. Despite all the above parameters working in favour of the company, if the valuation is excessively high as compared to its peer group, something is definitely amiss. The stock may have lost its steam and is fairly valued at this stage. Hence, it does not make sense to feature it in a portfolio. But take a through look at the historical valuations before your decide.
Some of the stocks that can be picked based on the discussed criteria for creating a quality portfolio are:
D/E(x)
ROE Correctedfrom 52W
P/E(x)
CMP(`)
FY12 EPS(`)
52 W High(`)
1.90 20.23% -45% 11 162.20 14.8 295.1
IRB Infrastructure Developers Ltd
NHAI's is likely to award 7,300km of projects in FY12. And the IRB Management intends to bid for projects worth `15 billion and above, to achieve targeted IRR of 16%. Moreover, competition is likely to ease, given individual balance sheet constraints. IRB hiked toll rates at major stretches – Mumbai-Pune Expressway in Apr’11 by 18% and Bharuch-Surat-Dahisar Expressway by 8% in Jul’ 11. The Management has also indicated that the toll rate for Surat-Dahisar is likely to increase 9%-10% in Sep ‘11. This will enhance tolling revenue for FY12. The two projects – Surat-Dahisar (expected in Sep ’11) and Kolhapur BOT would be completed in FY12. IRB has a strong unexecuted order book of `111.7 billion. The debt to equity of 1.9x is normal for the industry it operates in.

It’s simplified...Beyond Market 19th Sept ’11 15
Cadila Healthcare Ltd
Cadila Healthcare Ltd is the fifth largest research-oriented Indian pharmaceutical company having presence across the Pharma value chain. Cadila is expected to post strong sales and profit growth over the next two years on account of sales from newer territories, new product launches and deeper penetration in existing regions.
Coromandel International Ltd
Coromandel is a leading player in the Indian fertilizer industry and manufactures a wide range of products like fertilizers, specialty nutrients, crop protection, etc. It is the second largest phosphatic fertilizer player in India and set to benefit the most with nutrient-based subsidy scheme announced for complex fertilizers. It has grown at 38.7% CAGR over the last four years.
Infosys Ltd
Infosys is known for its good management and corporate governance. Currently, the stock is available at 16.5x the FY12E earnings. The management has guided for 18%-20% growth for FY12 and historically, the company has always succeeded its guidance
0.51 32.70% -15.9% 20.4 827.25 40.5 984
0.85 40.10% -20.80% 12.3 297.85 24.2 376
D/E(x)
ROE Correctedfrom 52W
P/E(x)
CMP(`)
FY12 EPS(`)
52 W High(`)
0.00 27.90% -36.30% 16.2 222.40 136.9 3494
D/E(x)
ROE Correctedfrom 52W
P/E(x)
CMP(`)
FY12 EPS(`)
52 W High(`)
Dena Bank
We expect Dena Bank to improve its core operating metrics going forward driven by focus on its liability franchise with operating efficiency. Dena Bank has been able to sustain growth in advances above industry average and has major presence in the state of Gujarat, which has the highest GDP among the Indian states. Higher exposure in Gujarat, increasing focus on high-yield retail credit, strengthening of balance sheet, coupled with lower operating costs would improve efficiency and drive earnings, going forward.
ROE Corrected From 52W P/BVROE 52 W High(`)
CMP(`)
20% -47.30% 0.7 151
FY12BV(`)
10779.60
D/E(x)
ROE Correctedfrom 52W
P/E(x)
CMP(`)
FY12 EPS(`)
52 W High(`)

It’s simplified...Beyond Market 19th Sept ’1116
Ajanta Pharma Ltd
Ajanta Pharma is a NDDS (New Drug Delivery System)-based pharmaceutical company. It is enhancing its spectrum of products with new therapeutic areas and its reach by hiring more sales people. After making its strong footing in domestic and emerging markets, the company is now targeting the US market with its first ANDA approval and poised for filing more ANDAs in the coming years.
Yes Bank’s return ratios have been consistently good for over three years. Moreover, the asset quality is the best in the listed Indian banking industry with net NPAs of 0.01%. In addition, the bank’s business and CASA are expected to improve going forward along with the scope to improve other income.
Yes Bank Ltd
Axis Bank Ltd
We remain positive on Axis Bank, owing to its attractive CASA franchise, rapid branch expansion, healthy asset book, sustainable fee income, strong growth outlook and good management. We believe that the recent decline has made Axis Bank’s valuation attractive, both in absolute and relative terms. The stock has corrected sharply and is currently trading at 2.1x FY12E BV.
Maruti Suzuki Ltd
Maruti Suzuki continues to hold a dominant position in the passenger car segment with a 51% market share. We expect Maruti Suzuki’s volumes to improve once the deliveries of new Swift cars take place on a larger scale from the current month. In addition to this, the company’s installed capacity will rise to 1.65 million units pa once the second plant at Manesar facility becomes operational in September ’11. We believe that the expansion in capacity will enable the company to cater to higher demand in the festive season.
0.04 17.80% -32.80% 12.5 1075.1 86 1600
D/E(x)
ROE Correctedfrom 52W
P/E(x)
CMP(`)
FY12 EPS(`)
52 W High(`)
0.83 22.20% -11.40% 5.7 326.20 57.30 368
D/E(x)
ROE Correctedfrom 52W
P/E(x)
CMP(`)
FY12 EPS(`)
52 W High(`)
ROE
21% -29.40% 2.10 388 131.70273.8
Corrected From 52W P/BVROE 52 W High(`)
CMP(`)
FY12BV(`)
ROE
19% -34.60% 2 1608 537.81051.4
Corrected From 52W P/BVROE 52 W High(`)
CMP(`)
FY12BV(`)

It’s simplified...Beyond Market 19th Sept ’11 17
Bajaj Electricals Ltd
The recent decline in the share prices of Bajaj Electricals was due to poor Q1FY12 results on account of specific reasons. We believe these reasons would correct in the coming quarters, easing concerns about the company. The company is among the few listed players who have a presence in small consumer appliances market. The industry is riding high on the growing India consumer story. Bajaj Electricals derives 70% of its revenues from consumer businesses — lighting and kitchen appliances. It enjoys a leadership position in the northern and eastern regions in appliances such as fans, compact fluorescent bulbs and mixer-grinders. The recent correction in copper and aluminium prices and efforts to control working capital and inventory may help the company contain margin pressures in this business.
At a time when there is rampant fear in the markets about a further decline, you as an investor, should not despair. Instead you should remain focussed on how you can catch the bottom. Make use of this time to diversify and invest in 4 or 5 parts in every decline. The good news is that though valuations are below their historical averages, the long-term India story is still intact. Therefore, make the most of the opportunities that the markets are providing noW.
0.19 26.20% -48.60% 10.5 178.45 17 374
D/E(x)
ROE Correctedfrom 52W
P/E(x)
CMP(`)
FY12 EPS(`)
52 W High(`)
EQUITIES | DERIVATIVES | COMMODITIES* | CURRENC Y | MUTUAL FUNDS # | IPOs # | INSURANCE # | DPDisclaimer: Insurance is a subject matter of solicitation. Mutual Fund investments are subject to market risk. Please read the scheme related document carefully before investing. Please read the Do’s and Don’ts prescribed by Commodity Exchange before trading. The PMS Service is not o�ering for commodity segment. *Through Nirmal Bang Commodities Pvt. Ltd. #Distributors
SMS ‘BANG’ to 54646Contact at: 022-3926 9404, E-mail: [email protected]
BSE SEBI REGN No. INB011072759, INF011072759 & INE011072759, NSE SEBI REGN No. INB230939139, INF230939139 & INE230939139 DP SEBI REGN. No NSDL: IN-DP-NSDL-136-2000, CDS(I)l: IN-DP-CDSL-37-99, AMFI REGN. No. arn-49454 NCDEX REGN. NO. 00362, FMC Code-0075, MCX REGN. No. 16590, FMC Code-MCX/TCM/CORP/0490, MCX SX-INE260939139, PMS-INP000002981
Registered O�ce: 38-B, Khatau Building, 2nd Floor, Alkesh Dinesh Mody Marg, Fort, Mumbai - 400 001. Tel: 264 1234 / 3027 2000 / 2005; Fax: 30272006Corporate O�ce: B-2, 301/302, 3rd Floor, Marathon Innova, O� Ganpatrao Kadam Marg, Lower Parel (W), Mumbai - 400 013. Tel.: 39268000 / 8001 Fax: 39268010

The need for a more comprehensive legal framework necessary to promote
growth of private pools of capital led the SEBI to formulate a set of
guidelines to regulate alternative investment funds
increasingaccountability
It’s simplified...Beyond Market 19th Sept ’1118

It’s simplified...Beyond Market 19th Sept ’11 19
arket regulator, the Securities and Exchange Board of India (SEBI) recently
issued a draft proposal to regulate alternative investment funds (AIF) such as private equity funds, real estate funds, infrastructure funds, debt funds and hedge funds, among others. The watchdog is making an attempt to bring these alternative investment funds under its purview and regulate the private pool of money flowing into them.
At present, the regulation is limited to mutual funds, collective investment schemes (CIS), venture capital funds (VCF) and portfolio managers. As far as mutual funds and CIS from the retail segment are concerned, the SEBI has done a commendable job. However, the existing rules and regulations in the non-retail segment are not comprehensive.
With the AIF regulations, the SEBI wishes to bring an umbrella rule catering to such pool of capital. Let us look at the draft proposal, the rationale behind it and the reaction to it by those from the industry.
WHY THE NEED?
SEBI (Venture Capital Funds) Regulations, which were framed in 1996 to encourage funding of entrepreneurs in early‐stage companies, has lost its context.
Of late, funds have found their way into listed companies or real estate (through Private Investment in Public Entity deals or special purpose vehicles), which already have easy access of funds through other routes. Hence, the very purpose of venture fund is defeated.
The AIF guideline is the result of such regulatory gap. This has been necessitated to keep a check on the
M kind of money flowing into venture capital funds, considering the risk of money laundering. Over the years, the definition of venture capital and private equity has blurred with an overlap in their investment avenues.
There was also a need to formulate a regulatory framework for the AIF industry so that the necessary concessions or restrictions reach the desired kind of funds.
Taking cues from the western markets, especially the United States, which recently imposed strict regulations on hedge funds as well as private equity funds, the SEBI has come up with the draft paper with a three-fold objective.
First, to avoid any kind of systemic risks as funds manage huge amount of money and some funds may also be highly leveraged.
Second, to make clear distinction between the different types of private pooled investment vehicles and channelize them in the desired space in a regulated manner and third, to improve disclosures and avoid frauds by adequate reporting requirements and legal agreements. THE DRAFT PROPOSAL, INVESTMENT CONDITIONS AND RESTRICTIONS
can register itself into any of the following categories - (i) Venture Capital Fund (ii) PIPE Funds (iii) Private Equity Fund (iv) Debt Funds (v) Infrastructure Equity Fund (vi) Real Estate Fund (vii) SME Fund (viii) Social Venture Funds (ix) Strategy Fund (Residual Category, including all varieties of funds such as hedge funds, if any) - as per its investment strategy.
required to be close ended and mandatorily registered with the market regulator along with their individual schemes.
investment strategy, investment purpose as well as business model in an information memorandum to all the investors.
be `20 crore and the initial size should be specified to the SEBI. The fund size can be revised upwards up to 25% after giving suitable reasons.
by an investor should be 0.1% of the total fund size subject to a minimum of `1 crore.
contribute from its own account an amount of investment equal to at least 5% of the fund whose investment shall be locked-in till the redemption by all investors in the fund.
minimum period of 5 years and the extension of the tenure of the fund may be permitted up to 2 years only at a time and to be approved by 75% of the beneficiaries.
of the fund’s corpus in a single investee company.
(i) Non Banking Financial Companies (excluding Infrastructure Finance Company, Asset Finance Company, Core Investment Company or companies engaged in microfinance activity in case AIF is not a Strategy Fund) (ii) Gold Financing (excluding gold financing for jewellery) (iii) Activities not permitted and under Industrial Policy of the Government of India.

It’s simplified...Beyond Market 19th Sept ’1120
ALTERNATIVE INVESTMENT FUNDREGULATION [PROPOSED]
VENTURE CAPITAL FUNDS REGULATION[EXISTING]
It is mandatory for all funds and their schemes to register
The minimum investment by an investor proposed to the
higher of 0.1% of fund size or `1 crore. [Impact: Will
limit retail money into AIFs]
Increase the minimum size of the fund to `20 crore
The AIF regulations requires the sponsor to commit
to invest at least 5% of the fund
It is not mandatory to register
It is `5 lakh
Commitment of `5 crore for the launch of the scheme
The VCF regulations do not stipulate a sponsor
commitment
TYPE OF FUND CONDITIONS FOR EACH CATEGORY
Venture Capital Fund
PIPE Fund
Private Equity Fund
Debt Fund
Infrastructure Fund
SME Fund
Real Estate Fund
Total investment in the fund cannot be more than `250 crore. The fund can be used
to promote only ventures with new innovative ideas or new technology in the start-up
stage or early stage. Not permitted to invest in any company that is promoted,
directly or indirectly by any of the top 500 listed companies by market capitalization
or by their promoters.
Invest in shares of listed companies which are not part of any market index. PIPE funds
will be exempt from applicability of insider trading restriction, which will help funds
conduct due diligence on the investee company.
Invest in unlisted equity, equity-linked instruments of companies which require medium
to long-term capital. Invest at least half of the fund in equity shares or equity-linked
instruments of an unlisted company and shall not invest more than half in the equity
or equity-linked instruments of a company which is proposed to be listed. A PE fund
shall not invest more than 50% in unlisted debt of a portfolio company.
60% of the corpus in debt or debt instruments of unlisted companies,
not more than 25% of which may be in convertible debt, with a minimum maturity
of 5 years. Remaining 40% in securitized debt instruments, debt securities of listed
company and equity shares of unlisted portfolio company.
Can invest at least two-thirds of its corpus in the equity or equity-linked instruments
of infrastructure companies or SPVs of infrastructure projects.
Should invest primarily in the unlisted equity or equity-linked instruments of SMEs
or SMEs proposed to be listed on the SME exchange. Can take delivery of securities
in the process of market-making.
75% of its corpus in real estate projects or fully built properties or in real estate special
purpose vehicles. Up to 25% of the corpus in allied sectors of real estate.
CONDITIONS SPECIFIED FOR EACH CATEGORY OF AIF
Some Of The Important Conditions For Each Category Of AIF Are As Follows:

It’s simplified...Beyond Market 19th Sept ’11 21
THE MOOT POINT
The draft proposal has evinced mixed reaction in the industry. Many experts are of the opinion that ‘too-much’ categorization will increase the regulatory cost for the funds. Also, the need for individual schemes to stick to their pre-defined investment strategy will rob the fund of the advantage of diversification into different avenues to mitigate risk. Clearly, the SEBI has concentrated more on micromanaging the fund and the way they should invest instead of safeguarding the risk in investing in AIF, they feel. The minimum
participation of `1 crore from the investor in the fund will keep retail investors at bay, thus prohibiting them from taking advantage of private equity as an asset class.
Also, the requirement by the sponsor to commit to invest at least 5% of the fund effectively means start-up fund managers cannot raise large funds even if they have the capability to do so as they will have to put forward 5% of the asset under management from their own pocket. It also means that only big funds with deep pockets will dominate the industry.
Other worrying prospect of the draft
is the reservation of the PIPE fund to invest in non-index companies. This requirement will severely affect the interest of reputable foreign funds in index stocks and they will have to register as a FII or P-note.
SEBI has admitted that the capital flow through AIF is “good quality money” and “plays a very important role in the growth of the corporate sector”. With this as background and the slowdown in FDI in the past few years, the timing of the draft paper has surprised many and the last thing that the SEBI and the government want is a pause in activity due to such a regulatioN.
TYPE OF FUND CONDITIONS FOR EACH CATEGORY
Social Venture Fund
Strategy Fund
Targeted to investors who are willing to accept muted returns. Required to invest in
social enterprises as per norms laid down by the fund, such as micro finance institutions.
May specify any strategy in any class of financial instruments and may invest in
derivatives and complex structural products, subject to requirement of suitability
and disclosure to investors.
QUALWe understand and value the equation of our relationships. Which is why, we offer our sub-broker/authorized person/remisier equal independence and status that our partner merits.
That apart, we provide unparalleled knowledge and exceptional market analysis to keep you ahead of the curve, to the advantage of your customers.
After all, at NIRMAL BANG, it’s a relationship beyond broking.
BSE SEBI REGN No. INB011072759, INF011072759 & INE011072759, NSE SEBI REGN No. INB230939139, INF230939139 & INE230939139 DP SEBI REGN. No NSDL: IN-DP-NSDL-136-2000, CDS(I)l: IN-DP-CDSL-37-99, AMFI REGN. No. arn-49454 NCDEX REGN. NO. 00362, FMC Code-0075, MCX REGN. No. 16590, FMC Code-MCX/TCM/CORP/0490, MCX SX-INE260939139, PMS-INP000002981
Disclaimer: Insurance is a subject matter of solicitation. Mutual Fund investments are subject to market risk. Please read the scheme-related document carefully before investing. Security is subject to market risk. Please read the Do’s and Don’ts prescribed by Commodity Exchange before trading. The PMS Service is not offering for commodity segment. *Through Nirmal Bang Commodities Pvt. Ltd. #Distributors
Registered Office: 38-B, Khatau Building, 2nd Floor, Alkesh Dinesh Mody Marg, Fort, Mumbai - 400 001. Tel: 39268600 / 8601; Fax: 39268610, Corporate Office: B-2, 301/302, 3rd Floor, Marathon Innova, Off Ganpatrao Kadam Marg, Lower Parel (W), Mumbai - 400 013. Tel.: 39268000 / 8001 Fax: 39268010
AT NIRMAL BANG, YOU’RE MORE THANJUST A BUSINESS ASSOCIATE,YOU’RE AN EQUAL PARTNER.
Contact Person: Gaurav Mohta - 7738380299 & Nilesh Sonawane - 7738380027
Address: B-2, 301/302, 3rd Floor, Marathon Innova, O�. G. K. Marg, Lower Parel (W), Mumbai - 400013.
EQUITIES | DERIVATIVES | COMMODITIES* | CURRENCY | MUTUAL FUNDS | IPOs | INSURANCE | DP www.nirmalbang.com# # #

It’s simplified...Beyond Market 19th Sept ’1122
The introduction of new
global indices futures trading
by NSE will enable market
par ticipants to bene�t from
S&P 500 and DJIA
ndian retail investors are becoming more sophisticated in their investment approach. With more educated people taking interest in investment, even those from the middle class are seen taking up
trading and/or investing as a part-time activity. They are not only taking keen interest in equities, but also in forex, commodities and other asset classes. The introduction of new global indices futures trading by the National Stock Exchange (NSE) is a step forward in that direction.
People who have long wanted to take exposure in popular equity indices in the overseas market can do so now. NSE will offer futures trading in S&P 500 and DJIA, two of the world’s most followed indices and considered as the barometers of the US equity market. The trading will take place during Indian market hours and will certainly help the Indian investors in managing their risk, as well.
I
NEW OFFERINGSWITH A GLOBAL
APPEAL

It’s simplified...Beyond Market 19th Sept ’11 23
WHAT IS S&P 500?
It is a free-float market capitalization weighted index of 500 leading companies of the US economy and is considered as a benchmark index in the US equity market. Introduced in 1957, the index mainly covers large and mid-cap stocks. It captures 75% of the total US equity market. Hence, is a good indicator of the economy. The index selects its companies based on their market size, liquidity and the sector they belong to.
WHAT IS DJIA?
Dow Jones Industrial Average, also known as Dow 30, is a price-weighted stock index. The Industrial portion of the name is largely historical, as many of the modern 30 components have little or nothing to do with traditional heavy industry.
First introduced in the year 1896, the index consists of 30 most actively traded liquid blue-chip stocks. Though this index captures only 28% of the US equity market, its performance is closely linked to that of S&P 500. The index value gets influenced only by changes in market prices of individual stocks. Sole change in the number of shares does not impact its value.
NSE GLOBAL INDICES OFFER
Indian investors are currently permitted to trade in foreign securities subject to a limit as stipulated by the RBI. Many investors either do not know about real good brokers who offer trading in these foreign securities or are sceptical about others. They may also have to incur higher transaction costs if they don’t have the right information about these foreign brokers. Further, trading in the US equity means exposing oneself to the foreign
exchange risk, in addition to the equity market risk. Futures contracts offered by NSE are denominated in rupees. Hence, investors need not take any currency risk. This will provide an opportunity to investors to diversify their portfolio and make it more global.
It can also be used as a hedging tool by investors who want to hedge their sector-specific risk for those sectors whose performance is highly linked to the US economy.
For example, the Indian IT sector derives more than one-third of its revenue from the US and one can hedge the Indian IT portfolio by taking appropriate positions in the S&P and DJIA. Finally, traders can devise appropriate trading strategies by looking at different kinds of relationships that exist between the US and Indian indices.
USE OF GLOBAL INDEX FUTURES
Depending upon the risk profile of individual investors, these contracts can be used for different purposes. Some of the participants who can benefit from these contracts are investors with directional views, spread traders, HNIs and persons or companies with business having a high overseas exposure.
DIRECTIONAL VIEWS
Investors, who track the US economy and the markets on a regular basis, can take a position on the movement of these indices, which reflect the state of affairs of the US economy. They can make direct profits from the positions they have undertaken.
For example, based on the recent job market, US GDP growth data you think that S&P 500 will increase in value and long the futures contract. If
your forecast turns out to be true, then you can make money.
DIVERSIFICATION
Investors, who invest in various global asset classes like bonds and stocks of various countries, commodities, foreign currencies, etc, can diversify the risk of their overall portfolio by taking positions in S&P and DJIA futures contract.
The US economy has a big impact on various asset classes. Hence, S&P and DJIA can be considered as good instruments for diversification, like an investor holds stocks of emerging economies like India, China, Brazil, Taiwan, South Korea, etc.
Consider a scenario where because of a high inflation situation the stocks from these countries start moving down. At the same time, the US economy, without getting affected by inflation, might be doing well. In such a scenario, stocks from the US will perform better than their US counterparts. If the investor also holds the S&P and DJIA futures position, then his portfolio will not suffer much. TRADING
Various correlations exist between S&P500, DJIA and other global indices, including Nifty and Sensex. Investors/traders should carry out their own research and find out the correlation. They can devise trading strategies to generate profits.
For example, historically, the US and Indian indices moved in tandem. However, due to some critical economic events, there can be some temporary divergence between the two equity indices. Traders could benefit from such happenings in the market and take appropriate positions in both these index futureS.

It’s simplified...Beyond Market 19th Sept ’1124
n an attempt to control inflation, the Reserve Bank of India (RBI) has revised key interest rates as many as 11 times since March ’10, despite slowing growth in the country and uncertain growth demand.
The hike in key policy rates subsequently results in the hike in home loan rates, thus impacting home loan takers directly. However, if there is no rise in interest rate or that the rate falls, the EMIs would also come down.
But the rise in key policy rates and the following rise in interest rates can be quite damaging on the home loan taker as it would either lead to an increase in EMI with no change in the tenure of the loan or an increase in the tenure of the loan with no impact on the EMI.
This can be better explained with an example. If Ram has taken a home loan of `30 lakh at an interest rate of 11% per annum for a tenure of 20 years, his EMI would be `30,966.
I
INYOURBEST
INTERESTBorrowers would be
better o� if they prepay their loan
amount or get the tenure of their loan
extended wheninterest rates rise
Particulars
Original Loan
Loan Amt
30,00,000
Tenure
20
ROI
11%
EMI
30,966
Interest Due
44,31,840
Total Amt
Payable
74,31,840
Particulars
Case 1: Change in EMI
Case 2: Change in tenure with
the EMI remaining the same
Loan Amt
30,00,000
30,00,000
Tenure
20
23
ROI
11.50%
11.50%
EMI
31,933
30,966
Interest Due
46,78,320
55,25,620
Total Amt
Payable
76,78,320
85,25,620
Suppose the interest rates were to increase by 50 bps to 11.5%, then:
When Ram originally took the home loan, he was paying an EMI of `30,966 per month. But after the interest rate increases from 11% to 11.5%, two possibilities arise:
Case 1: If the tenure of the loan were to be kept constant, with an increase in interest rate by 50 bps, the increase in EMI would be `967 per month and an annual increase of `11,604 and the total outflow on the 20-year loan along with the interest component would be `76,78,320, which is `2,46,480 higher than his original outflow. Ram would be fine with this arrangement provided the increase in the EMI does not materially impact his cash flows.
Case 2: If the EMIs were to be left constant in line with the original loan but the tenure were to be increased to incorporate the effect of the 50 bps hike in interest rates, Ram would have to pay EMIs for 36 more months than originally planned. By increasing the tenure of the loan, you are essentially changing the mix of your principal and interest repayment. Since your principal repayment will be extended to more than 20 years on which you will be paying interest,

It’s simplified...Beyond Market 19th Sept ’11 25
your total cost of the loan would increase by `10,93,780 which is much higher than Case 1. If Ram’s finances start getting stretched due to the increase in the EMI, he is left with this option and will have more time to pay the loan. Some banks offer people the choice to select either the option under case 1 or case 2.
However, banks are sceptical to increase the tenure of the loan beyond 20 years. If such is the case, you may find yourself in a tight spot.
In a rising interest rate scenario, individuals should look for options to prepay some portion of the loan their financial situation permits. Prepaying a loan means you are repaying a part of the principal, which will automatically bring down the interest component of the loan.
Before you opt for prepayment of the loan, go through the fine print of the loan document, which has a clause on prepayment. There is likely to be a prepayment penalty, which needs to be taken into consideration if you are re-financing your loan because the penalty can be as high as 2% to 3% of the outstanding loan amount.
MODES OF PREPAYMENT
Personal Funds: If this is your source of fund, you can negotiate with the bank and get the penalty lowered or waived off. Most banks are willing to waive off the prepayment penalty provided you prove that the proceeds from repayment belong to you or your co-borrower. The best way is through the bank account statement.
Hence, if you are borrowing money from friends or relatives, make sure it comes to you through your bank account. In a rising interest rate scenario, there are many requests for prepayment and banks have become more stringent.
As long as you are able to prove that the source of funds is personal, you can expect a waiver from the bank on prepayment penalty. Also, when a borrower partially prepays the loan, banks tend to waive off the prepayment penalty. But you need to check the quantum with the bank.
HDFC Bank allows prepayment of up to 25% of the outstanding loan amount without charging any prepayment penalty.
If you have fixed deposits yielding you less than the interest you are paying on your home loan, it makes sense to liquidate it, invest and prepay your home loan.
Prepaying your loan will reduce your EMI burden as you’re repaying the principal. But make sure you don’t have outstanding unsecured loans such as credit card loans or personal loans. These should get first preference as far as repayment is concerned as they carry a very high interest rate due to the risk element.
Refinancing/ Switching Of Loans: If you find it is an attractive proposition to take a new loan to prepay your existing home loan due to attractive terms and conditions, then do so after thoughtfully considering your prepayment penalty.
It is advisable to negotiate about the prepayment penalty especially if you have a good credit history. However, it is harder in case of re-financing because it means loss of business to a competitor in case of a bank. If you have to incur a penalty for prepaying your loan amount, you need to figure out how much interest you will save after taking into consideration the outflow on account of the penalty. If you find that savings on interest payments are much higher than the prepayment penalty, then it
makes more sense to prepay the loan.
SHOULD YOU PREPAY YOUR LOAN?
If you are able to refinance your loan with another one with better terms and conditions after taking into consideration the prepayment penalty, it makes sense to go for it.
If you have surplus funds, straight away prepay the loan to whatever extent possible and reduce your principal amount. It will thus bring down the interest component.
In a rising interest rate scenario, very few investments will give you a post-tax return that will be greater than the interest rate charged on the home loan. Hence, it is better to liquidate investments to prepay outstanding unsecured loans.
IF PREPAYMENT IS NOT AN OPTION?
Home loan is an investment of a life time for an individual. So it is quite possible that one would have already stretched himself financially and, hence, would find it difficult to pay a higher EMI.
In such a scenario extending the tenure of the loan is the only option. Increasing the tenure of the loan raises the total interest outflow significantly as is indicated in the example mentioned earlier.
If it is possible for the home loan- taker to bear the stress of an increase in the EMI, it is certainly better than opting for an increase in tenure. Even better would be to mop up funds to prepay the loan to the extent needed to keep the EMI constant.
Whatever be the case, it is in the best interest of a home loan taker to act after weighing his optionS.

It’s simplified...Beyond Market 19th Sept ’1126
The turbulence in the US economy and the uncer tainty
in the Eurozone do not bode well for an expor t-led Asian
economy like India
ndia’s exports registered a whopping growth of 81.8% at $29.3 billion in July this year as compared to the previous year. The growth was led by good performance by sectors such as engineering, petrochemical products and gems and jewellery. In fact, this is not a monthly
aberration, exports have been showing robust growth over the past few months.
However, looking at the global scenario, there is a high probability that the trend might reverse. The same is true for Indian companies which are largely dependent on the export markets. The economic instability and uncertainty in the euro zone and the US and the expected slowdown could impact the demand for Indian companies’ products and services.
I

It’s simplified...Beyond Market 19th Sept ’11 27
Meanwhile, the debate is on and the views are several as no one is sure about the situation that could unfold in the coming times. However, as informed investors, the best thing is to keep an eye on these developments and stay cautioned about companies with high exposure to exports or overseas markets, particularly those with a high exposure to countries in the developed world, especially in the US and the Euro zone.
USA AND EUROPEAN COUNTRIES
THE BIGGER ISSUE
During the global financial crisis of 2008-09, exports from emerging markets were severely hit and declined by 7.5% by the end of 2009. In the case of India, export growth tumbled to negative 3.6% in FY10 as compared to about 30% in FY08. However, with the economies recovering in the western world by the end of 2010, exports growth in the emerging markets was strong at 14.5%.
Economists are not forecasting a similar slump in the world trade as we saw in the last global financial crisis, but surely a decline is on the cards. In its note on the outlook of the world economy published in April, the IMF said in the current year the growth in exports from the emerging economies, including India could just be half of last year.
policy handicap.
This is also evident from the recent downgrade of the US by the global ratings agency Standard’s & Poor to AA+ from AAA, with a negative outlook.
According to reports, the downgrade of the US economy would impact exports and affect liquidity positions of Asia-Pacific countries. Further, the IMF expects the US economy to grow just 2.5% in the current year as against 2.8% last year.
The situation in the Euro zone is equally worrying where most nations are going through difficult times and the governments are busy cutting corners to trim their deficits and bring down debt levels.
Overall, the most troubled economies across the globe, namely the US and Europe, which also happen to be major contributors to India’s exports, including sectors like textile, IT, gems and jewellery and leather and machinery, among others, could continue to affect exports for some time, at least.
POCKETS OF WEAKNESS
The IT sector has already come in the limelight, which is logical given that most large Indian IT companies generate almost 80% to 90% of their revenues from the international markets, mainly the developed markets of the US, Europe and others.
Even the most diversified player would not be able to escape the aftereffects of the slowdown across regions and sectors. The only saving grace that these companies could have is that unlike during the last crisis, the financial sector is not impacted or may not get impacted significantly; the most prominent Banking, Financial Services and Insurance (BFSI) sectors’ revenues of the Indian IT companies could see some relief.
During the financial meltdown of 2008-09, BFSI was the most impacted segment, given that a large number of banks, insurance companies and firms on the Wall Street were battered heavily or went bankrupt, forcing them to cut spending. However, the overall impact on demand could be seen in the coming months and will be reflected in the share prices of most Indian IT companies, which are significantly down from their peaks in the recent past.
During the economic crisis, IT majors like Infosys, Wipro
2009 2010
World Trade Volume Growth (%)Emerging Market Export Growth (%)
–10.9–7.5
12.414.5
2011E
7.48.8
2012E
6.98.7
Export Growth
Source: IMF
2009 2010
U S A EurozoneJapan
–2.6–4.1–5.2
2008
00.5
–1.2\
2007Country
2.12.72.3
2.81.73.9
2011E
2.81.61.4
2012E
2.91.82.1
GDP Growth
Source: IMF
This could still be conservative estimates, given that a lot of things and fresh concerns over the likelihood of double dip in the US economy and a further slowdown in the European countries have recently sprung up.
In fact, in its note, the IMF has already cut its GDP forecast for developed countries to about 2.2% as against the earlier estimate of 3%.
In the US, there are enough indications of a slowdown as unemployment is seen returning to its crisis levels and the slump in the housing market persists. Besides, fiscal concerns and high debt in the United States have led to uncertainty over its economic environment, leading to a

It’s simplified...Beyond Market 19th Sept ’1128
and TCS reported a significant fall in volumes growth.
The global research firm Forrester has already lowered its growth forecast for the IT market in the US to about 6.5% compared to 7% earlier. However, these estimates are still considered to be more optimistic or on the little higher side as recent news flow is yet to be factored in to the estimates.
CONSUMER SENTIMENTS
Apart from the IT sector, companies from sectors such as textiles, leather, gems and jewellery that supply products to US retailers like Wal-Mart, could see a shrinkage in demand owing to the cut in spending by consumers and buyers in America.
The signs of weakness are already visible; the confidence among the US consumers plunged to 54.9% (63.7% in the previous month) in the month of August to the lowest level since mid 1980, fuelling concerns that weak employment gains could put pressure on spending.
Apart from consumer goods companies, Tata Motors, Tata Steel, Hindalco and Suzlon to name a few have a large presence in the overseas markets like the US and Europe through their subsidiaries, although they are not majorly into exports and could be affected due to the turmoil in these markets.
Interestingly, the subsidiaries of these companies account for a majority of their Group’s revenues. This means any slowdown in these markets would hit the overall performance of Indian businesses, as well.
MIDDLE EAST COUNTRIES
Market participants also need to keep an eye on companies such as L&T and Punj Lloyd from the engineering and construction space as they have huge exposure in Middle East countries, which are susceptible to crude oil prices.
If the propellers of the world economic growth and the largest consumers like the US, Europe and Japan
slowdown, this would certainly have a negative impact on the demand for crude oil, and subsequently its prices.
This, to some extent, will also hit the Middle East economies as their large government spendings are financed through the proceeds from crude oil exports.
Also, the global investments in the hydrocarbon sectors will get impacted leading to further spill over in demand for engineering and other ancillary services like offshore, oil and gas pipes, etc.
Most Indian steel pipe companies generate their revenues from these markets. Crude oil prices are already down from their recent peaks mainly due to concerns over growth in the western world. DOLLAR-RUPEE RATE
In addition to the demand-side issues, which are linked to the economic growth of these regions, the rupee to dollar rate will equally impact export growth of the Indian companies, especially the earnings and profitability of these companies.
The rupee to dollar rate has been very volatile in the recent past. This year the rupee depreciated against the dollar to touch a high of 45.95 in January, but it later appreciated.
There are fair possibilities that the rupee may appreciate further in the coming months if the dollar continues to lose against major currencies in the light of worries over recovery in the US.
An appreciating rupee means exports will become costlier and could potentially erode the competitiveness of the Indian companies. Besides, there is a threat to earnings.
Even if, a company grows its earnings by 10% in dollar terms, a 5% appreciation in the value of rupee against the dollar would mean an effective growth in earnings of just 5%. So, in addition to the demand, an appreciating rupee rate against the dollar could play a spoilsporT.
SMS ‘BANG’ to 54646 | e-mail: [email protected] | www.nirmalbang.comEQUITIES | DERIVATIVES | COMMODITIES | CURRENC Y | MUTUAL FUNDS | IPOs | INSURANCE | DP
plan your finances in time
a stitch in time saves nine
Your financial security is our concern.At Nirmal Bang, it’s a relationship beyond broking...

The dynamics of �lm production have
changed a great deal; nowadays �lms are produced with the
main focus on breaking- even much
before a movie hits the theatres
ilmmaking in India has always been fraught with uncertainty over execution and the desired outcome. It has always been as vulnerable an exercise as parents’ vulnerability to admit their child to a school.
Few businessmen who hardly understood the nitty-gritties of filmmaking supervised the production of commercial and light cinema. This was followed by a new wave cinema, which was government-sponsored, mostly National Film Development Corporation (NFDC), which ensured smooth production of shoestring budget films that were detailed in their execution and championed the cause of socialistic cinema.
But none of these ways of producing ensured break even for stakeholders. Filmmaking continued to be mighty risky and its outcome even riskier as cinema-goers got access to the Internet as well as cable and satellite channels that showed new films soon after their releases.
Things have taken a dramatic turn in terms of producing films. Nowadays, films are produced with an absolute focus to break even even before a film is officially released. This is a part of the new way of making films referred to as corporatization of films.
Major film production houses UTV Software Communications, Eros, UTV, Reliance Entertainment, Viacom 18 Motion Pictures and Balaji Telefilms (to a very small extent) have changed the dynamics of filmmaking.
These production houses spell out the marketing angle of a film without tampering with the creative aspect of the film. It is a confluence of the marketing team and the creative team where a script once narrated is only accepted when the marketing aspect of the film is spelt out unambiguously.
F
It’s simplified...Beyond Market 19th Sept ’11 29

It’s simplified...Beyond Market 19th Sept ’1130
For example, the marketing of the film Dev D, which follows the niche film business model, was done taking into account different aspects such as youth-orientation, disillusionment in love, debauchery and infidelity as the key marketing highlights of the film. THE ASSURED WAY There are many aspects of filmmaking today that ensure that the money that is invested is recovered even before a film is released. Syndicate deals such as music rights, television and satellite rights, overseas rights and, quite recently, two new concepts: part-production and post-production sharing of money are being signed.
This has de-risked production houses’ disproportionate dependence on big budget films. For instance, some production houses’ money foreseen for a film project sometimes goes beyond the calculated sum.
Nowadays, there are few well-diversified entertainment companies that pitch in such late stages of production and invest money in the film project. A case in point is Eros International.
Another aspect to saving the downside of a project is linking the remuneration of the cast of a film to the financial performance of the film after its release. Normally producers bear the brunt of losses after paying off the cast of the film. Hence, such arrangement not only brings in accountability in the project, which Indian film industry seriously lacks but also saves losses for the producer. Such deals help producers recover over 40% to 60% of a film’s cost. One of the biggest players in the industry, UTV Software Communications produces films under two banners. For first-timers
and not-so-known directors, the company produces movies under the banner of UTV SpotBoy. For established directors, it uses its flagship brand-UTV Motion Pictures.
This has completely de-risked its disproportionate dependence on heavy star cast movies for good revenues as first-time and not-so-known directors on many occasions deliver better results. This is helping the company in a big way. Films like Dev D, A Wednesday, Aamir, Kaminey and the most recent Delhi Belly have been money-spinners for the company.
The idea is simple. Pick up fire-in-the-belly writers and directors. Give them a set budget. And ensure that they stick to the budget and produce the desired outcome.
With mushrooming multiplex culture and increasing awareness about European and non-English cinema among young audiences, the ability to discern a bad commercial potboiler from a niche meaningful and content-oriented film has become sharper and stronger.
With multiple screens in a multiplex these films are shown besides the run-of-the-mill commercial films, and to the surprise of many critics, these
films have immense audience pull. Take the case of a niche film like A Wednesday. The film was made on a shoe-string budget of only `3.5 crore that clocked a business of `11 crore.
So is the case with small but meaningful films such as Peepli Live. It was made on a budget of `6 crore and it made a business of `29 crore, almost five times the return on investment on the film.
This has ensured that the films that are made with a viable content get immediate financial support and see the light of the day. UTV Software Communications is the only production company that is spearheading the concept of corporatization in a very conscious and big way.
The beauty of such niche film business models is that it works both in bad and good times of an economy. Not surprisingly, out of the many corporate deals that UTV Software Communications undertakes, as many as five of the ten deals have a niche content focus.
Here are the box office details of some of the films that clearly reflect that niche and concept-based films from the UTV banner have performed really well
Movie Release Date CostOf Production
(` in crores)
Domestic NetBox Office Figures
(` in crores)
Jodha Akbar
A Wednesday
Dev D
Raajneeti
Udaan
Peepli Live
No One Killed Jessica
15th Feb ’08
5th Sept ’08
6th Feb ’09
4th Jun ’10
16th Jul ’10
13th Aug ’10
7th Jan ’11
37
3.5
6
50
3
6
9
63
11
15
88
5
29
28

It’s simplified...Beyond Market 19th Sept ’11 31
A PARADIGM SHIFT It is estimated that an average ticket price for an Indian film is far lower than what an average film-goer in the US, Canada, China or Russia pays. It can be as low as one-seventh of the cost of the ticket of a foreign film.
Being the chief source of entertainment on weekends for many segments of the society - from an executive working in a plush office to a plumber in a decrepit building - the scope for an average ticket price in India could go up provided films have content and have been produced with utmost honesty irrespective of whether it is a potboiler or meaningful cinema.
Hence, to capture such immense audience base, production houses are following ‘portfolio’ model of films. Under the portfolio model, production houses do outright purchase of film projects considering their viability.
For instance, a Marathi film like HarishChandraChi Factory had immediate backing of UTV because of its niche focus and viability of content. Another aspect that is being used nowadays is the use of combinations such as complete -producing, co-producing and part-
producing a film. This includes big-budget (more than `45-crore), medium-budget (`15 crore to `25 crore) and small-budget movies (`3 crore to `5 crore).
The portfolio needs to have an optimum mix of movies to get maximum returns, mitigate financial and performance risks and also have a healthy release ‘slate’ for securing future revenues. Eros, for example, makes 20 Hindi movies a year that rake in almost 85% of its revenues. The ratio that works for Eros is producing 10%, acquiring 30% and co-producing 60% of the movies. Also the emergence of foreign players as producers of Indian films has led to the streamlining of different facets of filmmaking. Production costs of a film, for instance, are monitored on a daily or a weekly basis.
So if there is any inconsistency in the use and investment of money, there is scrutiny and after presenting only the viable reason, further money is allocated by the producers.
Many film producers are putting a limit on the budget that should be spent on a film. UTV Software Communications, for instance, has capped it around 7% to 10%. Another streamlining brought in by these
foreign players is ensuring that the tone, logic and flow of the scripts are even and sensible.
Touted as script doctors, foreign players like Fox Star, Warner and others send Indian scripts to their overseas offices for a second opinion. In such scripts people at overseas offices make additions and increase comprehension of the film. Add to this, the advantage of comprehensive release to a film in the overseas market. Big foreign studios tap into their inherent strength of reach and marketing. This helps domestic film producers maximize their revenues.
Fox Star, which co-produced My Name is Khan with Karan Johar is an example of this kind. The studio did an international cut and showcased the film in a phased international launch. The film was released in South Korea just a few months ago with 200 prints and in Taiwan even later in May, more than a year after its release in India and the US.
Such releases help the producers to make extra money. With Hollywood heavyweights realizing the importance of untapped films’ market in India, more of such streamlining is also being planneD.
regular investments keep worries away
an apple a day keeps the doctor away
SMS ‘BANG’ to 54646 | e -mail: [email protected] | www.nirmalbang.comE Q U I T I E S | D E R I V AT I V E S | C O M M O D I T I E S | C U R R E N C Y | M U T U A L F U N D S | I P O s | I N S U R A N C E | D PYour financial health is our concern.
At Nirmal Bang, it’s a relationship beyond broking...

It’s simplified...Beyond Market 19th Sept ’1132
Despite immense oppor tunities, the
construction sector is besieged with hurdles that are
hampering growth
ndia’s construction story has great relevance at a time when most metros have lesser space for development and a
large number of people from tier-II and tier-III cities are flocking to the cities, which has put enormous strain on the infrastructure in metros. However, for companies in the construction sector, this has resulted in stiff competition, thus bringing down the Internal Rate of Returns of most of their projects.
The construction sector has been in the news of late. Firstly, increasing interest rates has ensured that it is a topic of discussion among the general public and secondly, delays in rolling
Iout of projects by the government has been a cause of concern for construction companies in the last few months. These have resulted in the downgrading of a number companies in the sector.
So what exactly are the problems that are posing hurdles for the sector’s growth? At a time when interest rates are rising and companies are in the cost-cutting phase, would construction companies be able to find a firm footing in the coming quarters? We give you a lowdown on the opportunities in the construction sector and the problems that are making it difficult for construction companies to turn these opportunities into visible earnings.

It’s simplified...Beyond Market 19th Sept ’11 33
THE INDUSTRY
The construction industry is directly related to the infrastructure of the government and corporations in different sectors. It is estimated that under the 11th Five-Year Plan (FY08-12) around `11 trillion has been spent on infrastructure.
Of the total estimated amount of `20 trillion, `9 trillion is to be spent in FY12. Apart from this, the 12th Five-Year Plan is expected to entail an investment of `41 trillion in infrastructure projects, which means the investment allocated to this sector is over 200% in comparison with the previous Five-Year Plan.
In addition to this, other sectors such as power, road, irrigation, port, airports and water infrastructure depend heavily on construction companies as enablers of growth. In the coming two fiscal years, these sectors are likely to present enough order book and earnings visibility for the construction companies.
a) Power Sector
Experts believe that if the government follows the investment pattern of the Eleventh Plan, a substantial amount of investment would be channelized into power generation, transmission and distribution segments of the power sector in the Twelfth Plan. After providing for investment in these sectors, the remaining investment would find its way into roads, irrigation as well as water supply and sanitation.
In addition to this, India’s power capacity is expected to treble in the Eleventh Five-Year Plan. In comparison to the Tenth Five-Year Plan of adding capacity of 12 GW of thermal power, it is expected that the Eleventh Five-Year Plan would add a capacity of 50 GW.
Additionally, private players in the sector too would play a crucial role in it and is estimated to account for 56% of 27 GW supposed to be added in FY12. Hence, there is enough opportunity for construction companies that would be building power plants to meet the power demand in the country. The estimated opportunity for the construction companies would be worth $56 billion or `254 crore, approximately.
The Power Grid Corporation of India, which is the central nodal agency for maintaining national and regional transmission grids, has a capital expenditure of `550 billion, which it would spend in the span of four years ending 2012.
b) Roads
Roads form an integral part of the order book of construction companies. Being a developing country, infrastructurally speaking, roads in the country are in a bad state and suffer from under capacity.
The government has come up with programmes such as the National Highway Development Project (NHDP) and the Pradhan Mantri Gram Sadak Yojna (PMGSY) to upgrade the national highway network and the rural road infrastructure, respectively. Projects have also been undertaken at the state level to upgrade state highways. Multi-lateral agencies like the World Bank and the Asian Development Bank have been involved in funding a number of projects at every level.
Under NHDP, the government has planned to develop 49,987 km of national highways. Projects like the Golden Quadrilateral and the North-South/East-West corridors are almost complete. However, projects whose cumulative length adds up to more than half of the total length to be
developed under the NHDP, are yet to be awarded. Estimated projects worth $55 billion are yet to be awarded and may be issued in FY11-14 if NHDP is to be completed by its deadline.
c) Water Infrastructure
Water infrastructure is in dire need of investments. There is a scarcity of fresh water in India. Nearly 85% of water in the country is used for irrigation. Every year some regions of the country face drought, while others face floods. Scanty rainfall received last year and the spate of farmer suicides in recent years have brought the government’s attention to the development of water resources and channelize the supply to every corner of the country.
The government has set aside nearly `415 billion for water projects. This forms about 71% of the total allocation under the Jawaharlal Nehru National Urban Renewal Mission (JNNURM). The projects under JNNURM are meant to establish and upgrade infrastructure in cities with water supply, sewerage and drainage being the top priority. Providing clean drinking water and treating and disposing sewage are the main objectives of the programme. Hence, these projects provide enough opportunities for the construction companies to cash on.
ISSUES
However, there are several roadblocks obstructing the growth of construction companies. The construction companies are finding it difficult to secure consistent orders. There have been delays due to lack of clarity on land acquisition, fuel linkages, and financing. Also, projects are getting unviable due to outdated costs and insufficient manpower. Another important reason for delays is regulatory norms on the

It’s simplified...Beyond Market 19th Sept ’1134
part of the government, which is probing a host of scams. These obstacles have stalled swift issuance of projects and, hence, increased interest cost of companies. Construction companies are also facing a problem of increase in working capital cycle. A working capital cycle is defined as the number of days taken by a company to procure revenues for its projects. The working capital cycle of construction companies has widened in the past few years due to issues such as credit crunch in FY09, delay in payments, slippages in execution of projects and change in mix of projects.
The working capital cycle for companies has increased from 85 days to 145 days. This deterioration in the last two quarters is mainly due to
delays in payments and increasing loans and advances.
This has resulted in higher borrowing, thus impacting profitability. Most companies’ loans and advances shot up because of increasing loans to their subsidiaries for investments in BOT projects, which will be returned once the projects become operational.
As a result of increasing working capital cycle of construction companies, the debts on their books have been rising. Most construction companies still maintain a debt to equity ratio of less than 1. However, with high working capital these companies have to stretch their balance sheet to fund future growth. More so with rising interest rates, the resultant increase in cost of funds would hurt profitability of companies.
Also, execution of projects in the last two quarters has slowed down. Much of the negative impact of these factors can be seen in the lackluster performance of most construction companies in the sector in the June ’11 quarter. Going forward, it is important that the government clears projects promptly and urgently. Traditionally, the third and fourth quarters of a fiscal are considered to be better than the first and the second quarter.
Experts believe that it would take few more quarters for the sector to enjoy the desired momentum in project execution considering inflationary and interest rate concerns. However, most big-sized companies are likely to see revenues coming in the next three to four yearS.

It’s simplified...Beyond Market 19th Sept ’11 35
slowdown in the global economy, but signalled no shift in the policy and differed in emphasis on the Eurozone debt crisis.
On the other hand, US President Barack Obama proposed a $450 billion package for more job creation in the economy. The final word is still awaited on the proposal.
Going forward, we do not see any clarity on the measures to be adopted to support the global economy. Also, the debt problems in Greece and weak job data of the US continue to dent the risk-appetite of investors. Considering the above arguments we do not expect any major downside in the prices of gold on account of safe-haven buying. We expect gold prices to test new highs and cross $1,920/ounce on the COMEX until the next fortnight.
INDUSTRIAL METALSIndustrial metals were in the consolidation mode in the previous fortnight. Supply concerns from major copper mines in Chile and Indonesia kept the downside limited, while, overall risk aversion in global finance kept a check on the upside.
Also, rising copper inventories at the LME and Shanghai warehouses pressurized prices. Copper prices once again traded below $8,800/tonne on the LME after reaching above $9,000/tonne. Nickel was an outperformer with prices trading firm and not following the fall in the broader base metals complex.
Treatment and refining charges that Chinese smelters receive for converting concentrate imports into copper have fallen nearly 18% from July due to supply disruptions, according to a few traders in China.
Terramin Australia said its processing plant is now fully operational after repairs following an electrical incident. It said the loss of production meant it had cut its full-year production forecast by 4% to 45,000 tonnes of zinc concentrate, while it expected to meet its full-year forecast of 18,500 tonnes of lead and precious metal concentrates.
Going forward, we expect further weakness to continue in the prices of base metals. Slow demand from China, high level of inventory at warehouses, easing supply concerns and weak economic data from the Eurozone and the US are likely to further pressurize prices of metals. We expect copper prices to test $8,500/tonne to $8,400/tonne on the LME until the next fortnight.
CRUDE OILCrude oil prices fell around $83/barrel on the NYMEX after reaching $90/barrel in the last fortnight. Higher oil prices were mainly supported by low inventories released weekly by the EIA and threats of hurricanes affecting oil refineries in the US, which actually diminished the affect of the end of the Libyan war.
The projected pace for oil demand is lower this month due to uncertainty in the market and less optimistic outlook for global economic growth. Less demand for oil will automatically ease the fear of tightness in the oil market, as forecasted earlier.
We expect the weakness in crude oil prices to continue as lower demand for oil across the globe, with no changes in supply side, would automatically build up the inventories and this will keep oil prices under pressure in the coming fortnighT.
FORTNIGHTLY OUTLOOK FOR COMMODITIES
I nternational commodities traded mixed in the previous fortnight as the global economy continues to fear a
slowdown or a recession. Persistent problems in the Eurozone, led by Greece, coupled with sluggish jobs data of the US are highly responsible for such mounting fears.
Gold and the US dollar were the two beneficiaries of such risk-averse stature of global finance. Industrial metals prices experienced a consolidation phase as supply concerns in major metal-producing mines supported prices. However, a weak global growth outlook kept the upside limited. Crude oil prices too witnessed weak trading as tumbling equities and easing tensions in the middle-east nations reduced the issues related to supply, in turn, leading to a sell-off in crude oil.
PRECIOUS METALSThis previous fortnight can be termed as one of the most volatile periods for the prices of gold. However, continuing its run from the previous fortnight, gold prices extended its rally upwards. We have seen gold prices testing its all-time high of $1,920/ounce on the COMEX followed by a profit-taking of more than $100. Silver prices too traded above $44/ounce on the COMEX. But weak base metals kept the upside limited in silver. The US dollar too benefited as debt problems in the Eurozone dragged the euro to its lows of 2011. Markets awaited measures by the US Fed officials in the Jackson Hole meet. However, Fed Chairman Ben Bernanke failed to provide any specific measures that could revive the US economy. The G7 pledged to make a coordinated response to a

It’s simplified...Beyond Market 19th Sept ’1136
On the face of it, these tools could be in the form of extending the duration of the treasuries held by the Fed. We believe that such an event would barely push the US dollar in the south.
In fact, any further delay by the European Union to act decisively on the last tranche of aid to Greece could have serious repercussions on the financial markets, which will continue to put the US dollar in demand. We expect the dollar index to test 79-79.50 in the coming fortnight.
The euro finally broke out of range, nosediving by almost 900-1000 pips in the fortnight gone by. After defying the gravity of the debt problems for quite some time, euro bulls finally gave in to the rising chances of a default by Greece.
The European Central Bank (ECB) too acknowledged the faltering growth in the Eurozone, coupled with rising fiscal problems and lowered growth and inflation forecasts for the rest of the year.
The German court ruling against the anti-euro bailout law provided little help to the euro. However, it did not last long and the final blow came after the resignation of German ECB member Juergen Stark, which exposed the growing differences among ECB members over the ongoing bond-buying programme.
In the coming fortnight, Moody is about to complete a review of the French banks – a review that began in June and is expected to end soon. BNP Paribas, Credit Agricole and Societe Generale are all candidates for possible downgrades. We expect to see a further slide in the euro to $1.32-33 against the US dollar as no concrete action from the Eurozone
members is in sight.
The pound was under pressure because of global uncertainties and economic weaknesses. A lower August manufacturing PMI and a decrease in housing prices signalled a stalling economic recovery.
Also, the exposure of UK banks to sovereign debt of euro zone, with rising expectations of further quanti-tative easing added to the pressure on the pound. We expect the pound to slide to $1.57 against the US dollar.
The Japanese yen witnessed some depreciation on fears of any interven-tion by the Bank of Japan after the Swiss National Bank pledged to keep the Swiss franc weak. On the economic front, unemployment rate came to 4.7% and the manufacturing activity was also subdued.
Last week, BOJ maintained the overnight call rate at 0.10%. Leading indicators climbed more than predicted to 106 but core machinery orders slid 8.2%, worse than the 3.9% drop predicted, indicating a bumpy road to recovery. In the coming fortnight, USDJPY pair is likely to trade in the range of 76-77.50 with a downside bias.
The rupee depreciated significantly in the last fortnight largely on account of a shortage of the US dollar in the spot market. Oil importers bought dollars to the tune of $5 billion to fulfill payments due to Iran.
Going forward, we expect the rupee to weaken further against the backdrop of broad concerns in the global financial markets. Moreover, the strength in the US dollar abroad may drive the USDINR pair higher to 47.90-48.00 in spoT.
Fortnightly Outlook For Currencies
T he US Dollar Index (USDX) witnessed its strongest rally in recent times. It moved from 75
points to 77.2 points – the highest level in two months.
The dramatic intervention by the Swiss National Bank (SNB) to weaken the franc had the strongest impact on the US Dollar Index. The SNB decided to set a floor of 1.20 in EUR/CHF to help the faltering Swiss economy. The second push came in the form of the worsening debt situation in the Eurozone as Greece is on the verge of bankruptcy. The US dollar was inevitably the most favoured among all major currencies. The deteriorating debt situation in the Eurozone, coupled with broad risk aversion in the financial markets, triggered robust demand for the US dollar as a safe-haven asset.
Furthermore, SNB’s pledge to keep Swiss franc over the 1.20 mark against the euro, led to some reshuf-fling from the Swiss franc to the US dollar. Lastly, dollar supply sagged further as banks hesitated to lend to each other which, was reflected in the form of rising inter-bank rates. These developments lent additional strength to the US dollar.
Going forward, investors have set their eyes on the next Forward Open Market Committee meet which ends on 21st September. At the moment, the larger side of the market rules out another round of quantitative easing termed as QEIII. However, Fed Chairman Ben Bernanke has time and again testified that the Fed has a set of tools other than direct quantitative easing, which could be implemented if the economic situation so demands.


It’s simplified...Beyond Market 19th Sept ’1138
For someone who has been a fund manager for nearly two decades of his life, his passion for his job is
heartening. When asked what drives him to work every single day, he quips with the enthusiasm of a newbie, “I love my job. I can’t imagine doing anything else!”
Meet Tridib Pathak, Director Equity and Senior Fund Manager, IDFC Mutual Fund. The fact that he would spend the most of his waking life in the equity markets was not what he thought he would do till he started his life as a management trainee.
That he was different was evident though. While his cousins in the extended Gujarati family he was born into, were opting for the science stream, he opted the commerce stream. Till today, he maintains it was the hand of God that took him from being just an average student till standard VII to a topper, a habit he maintained for the rest of his academic life. Pathak has the rare distinction of being a rank holder in chartered accountancy; a course that experts reckon is one of the most difficult ones to get through in a single attempt.
GuruMantra
Maintaining the characteristics of the fund, while trying to
marry growth and value is one of the many keys to being a
successful fund manager, says Tridib Pathak

THE WONDER YEARS
Having cleared chartered account-ancy with distinction in the fag end of the 1980s, Pathak’s dream was to work in the project finance depart-ment of IDBI or ICICI. While both institutions were recruiting manage-ment trainees, it was IDBI that picked him up.
He made a gutsy decision to work with a public sector unit with a meagre salary compared to his peers, who were joining foreign banks. Little did he know then that this decision was to shape the course of his life later on.
Yet the initiation into project finance was not exactly handed out to him on a silver platter. After a grueling year in the accounts department of IDBI, Lady Luck shone on him when a senior colleague was assigned the task of the computerization of the accounts department.
He was on the hunt for management trainees who were Chartered Accountants and rank holders at that. A team of five, including Pathak, was chosen, and they gave it their best shot. This became his entry pass into the project finance team, his first breakthrough as a professional.
At a time when IDBI was a primary lender to India’s largest companies, the sheer scale was the first thing that hit him. Recalling his earliest days in project finance, he says, “The largest of companies in the country such as Reliance Industries Ltd was a client. Even though there was a lot of scepticism about the company, it took me a while to realise that RIL was breaking mindsets successfully and that was their USP.”
It was during his years in project finance that Pathak learnt the lesson that one had to be intrusive to
understand the premise of a company’s functions.
Another opportunity came by Pathak during his tenure at IDBI. Credit rating agencies (CRAs) were being set up in India at that time and the home-grown agency CARE was an initiative by IDBI (just as CRISIL was ICICI’s).
Knowing Pathak’s mettle, the senior management at IDBI now offered him to be a part of the initial team of CARE. This was his initiation into the world of analysts. He began as a credit rating analyst in the oil and petrochemicals sector. A mid-term approach while providing credit rating to these companies was another eye opener.
THE MARKETS BECKON
An avid reader too, a book that served as an early influence in his life was ‘One Up on Wall Street’ by famous Wall Street investor, Peter Lynch. Reading continues to be his food for thought. The stock market bug had already done its job in his formative years.
After a four-year stint at IDBI, he knew stock market was his calling. In what capacity though, he was yet to figure out. As it so happened, global financial services firm, UBS was setting up its brokerage business in India and was on the hunt for an oil and petrochemicals analyst.
Having spent a number of years studying the oil and petrochemicals business in the country, Pathak applied for the post and got recruited, almost immediately. But then came a big shocker. A confident and perhaps a little arrogant greenhorn in the equities market, Pathak recalls the experience of writing his first report during his stint at UBS.
Used to describing the company at length before giving the rationale for looking at a stock, Pathak wrote out what he thought was an excellent report on Chemplast. But his boss Niall Shiner thought otherwise and did not publish it even after making re-write the front page alone at least six to seven times!
Name: Tridib Pathak
Organisation And Role: IDFC Mutual Fund, Director Equity-Senior Fund Manager
Number Of Years Spent In The Market: 22
The First Sector I Looked At Professionally: Oil and gas
What Keeps Me Ticking Every Day: The complexity of the market
The Book That Was An Inspiration To Me: One Up on Wall Street by Peter Lynch
A Book I Recommend: Against the Gods: The Remarkable Story of Risk by Peter L.Bernstein
What Do I Do To Unwind: Read and play video games with my son
It’s simplified...Beyond Market 19th Sept ’11 39

It’s simplified...Beyond Market 19th Sept ’1140
He deems it the hand of God, that took him from an average student to a topper in school a habit he maintained for the rest of his academic life
It is fun to remove the noise and see the clear picture
But today Pathak speaks of Shiner fondly. “Though he had his way of cutting our corners, he was actually making good analysts out of us,” says Pathak. In fact, it is thanks to Shiner that Pathak learnt how to make his reports “punchy”.
He recalls a particular time how he took up the challenge of writing a sector report on oil and gas when he was pushed to the edge by Shiner who showed no confidence in him on the face of it.
Pathak then had the notion that he was to be fired soon as Niall was not pleased with his progress. In an attempt to prove his mettle, he set out to write a 100 page sector report. The basic argument of his report was that the oil and gas sector was to lose its steam, as the much promised de-regulation was not to happen anytime soon. What Pathak did not know then, was that he had unwit-tingly struck a chord with Niall, because of his fondness for contrar-ian calls.
True to his nature though, Niall did not show his enthusiasm when Pathak handed over his magnum opus. It was not until a colleague let
the cat out of the bag , did Pathak realise that Niall was much too excited about its impact! And so Pathak learnt another valuable lesson in his life which is: ‘If you want to break the noise, you have to be different. Have the guts to stick your neck out and say it.’ This is the notion he formed at UBS and holds on to till date.
Though UBS was a great learning experience for him and a sea change from his IDBI days, Pathak had begun to feel restricted in his role as a sell side analyst. After all, he did not want to spend the rest of his life

It’s simplified...Beyond Market 19th Sept ’11 41
justifying the picks he made. Also, the oil and gas sector had limited scope and stagnation had set in. He now wanted to try his hand as an investment manager.
Opportunity came knocking once again on Pathak’s door, from his previous organization IDBI, which was also running an asset manage-ment company.
THE CROSSOVER
Winds of change were sweeping through UBS as well. SBC (Swiss Bank Corporation) worldwide had taken over UBS and the existing teams from UBS were being disbanded. Even though the Indian brokerage business team survived, Pathak was already on the hunt.
Although he had other offers from brokerage houses, his heart was in investment management. But whether it would be a progressive or regressive step to go back to IDBI from a foreign brokerage was his dilemma. Help came from a senior colleague, who like Pathak, was caught in the doldrums of the UBS-SBC merger. He bluntly told Pathak that the foreign brokerage “halo” would not be diminished by “going back” to IDBI. The next thing Pathak knew was that he was in IDBI MF. Of course, dreams come at a price and he took a 75% cut in his salary!
But thanks to this move, Pathak believes he is where he is today. Another remark from the same
colleague is what Pathak has ingrained in his investment philosophy till date. “Don’t use your own brains too much as a fund manager!” he had told him.
Today, Pathak speaks of the market with reverence. “Mr Market” as he says, has a mind of his own. The trick is to maintain a balance and, however strong the temptation, do not try to either outsmart or underestimate Mr Market. “If there was to be a room of 100 people and 99 people think the same thing, it is their decision that is going to define the course of action in the market,” he explains.
From his early fund management days, he recalls a humbling incident. The head of international business of Principal Mutual Fund was visiting India and coincidentally around the same time Pathak’s funds had performed extremely well, beating all the benchmarks. But contrary to his expectations of being lauded, he was advised not to perform “so well”.
“In fact, I remember being shocked when I was told that the next time I was doing so well, I would be pulled up, assuming that something must be wrong,” says Pathak. It was only after this incident that Pathak understood the true meaning of not using too much of his brains. He learnt that being able to achieve balance between risk and return is the mantra for success. AND MILES TO GO
Pathak today is a part of the management team at IDFC, where his job, apart from managing funds, is to build a team of professionals. He says the one takeaway from his experience is the basic premise of whether one is creating or destroy-ing wealth for the investor. His
If you want to break the noise, you have to be different and have the guts to stick your neck out and say it.
mantra in fund management has been to maintain the characteristics of the fund while trying to marry growth and value. In a day and age when the markets are getting increasingly complex, he says it is this very complexity about “Mr Market” that is his driving force. “It’s fun to remove the noise and see the clear picture emerge.”
The other thing he loves about his professional life is the fact that it is objective. All his principles are reflected in NAVs, and as long as that is in place, there’s little to complain about. The only regret Pathak has is that there is not enough time left for him to catch up on his reading!
Most of his weekends are thus spent reading international financial magazines and publications and non-finance fiction that he has a whole collection of. And when Pathak is not reading? Look out for him in a movie theatre, catching the latest Bollywood flicks or spending time with his son at the latest game on the Playstation.
The fund manager takes a backseat when he talks about his passion for gaming. “I have all the latest games at home, purchased for my son. But, even he knows that those are more for me,” he chuckleS!
After being made to re-write the front page at least six to seven times, his first research report was not even published.

1 2 3 4 5
7 8 9 10 11
1421 22
29 30 3123 24 25 2615 16 17 18 19
12
It’s simplified...Beyond Market 19th Sept ’1142
More and more retail investors are turning to long-term debt funds in turbulent times like we are witnessing at present
ay be it is the ‘August rush’ which is keeping investors away from equities as global
bourses are in a tizzy. Negative sentiments have been weighing down on equities as an asset class ever since the downgrading of the US long-term sovereign credit rating from AAA to AA+ by leading ratings agency, Standard & Poor’s.
M
Keeping Date With Debt Funds
There has been nothing short of a bloodbath across the world since then, as panic-stricken investors are rushing to exit their holdings in equities. At the outset, it must be said that panic reaction from Indian investors is certainly not advisable. One should rather consider the benefits of staying invested for the long term. However, diversifying into other asset classes at this point of time
is not totally uncalled for. Little wonder then that wealth managers are now advising their clients to take a re-look at long-term debt funds.
WORRIES WORLDWIDEBefore we launch into a discussion on why investors can look at long-term debt funds at this juncture, let us dwell upon how Indian investors are likely to be impacted by the negative

It’s simplified...Beyond Market 19th Sept ’11 43
events taking place around the world. Firstly, the Indian economy is in a unique position. Unlike other emerging ones, ours is not export-led. Instead, we are dependent on domestic consumption - it is our own demand that fuels our economy. That puts us at a vantage point.
It must be remembered that we cannot be insulated from the impact of negative global factors such as the possibility of a double dip recession in the US and the Eurozone. We are not decoupled from the rest of the world due to the trading relations.
While an Indian investor need not panic, it would be best if he refrains from putting all eggs in one basket. Hence, we make the case for looking at long-term debt funds. The proof that fund managers have already been recommending debt funds to their clientele in a big way is evident from the statistics.
Latest figures released by the Association of Mutual Funds in India (AMFI) show that liquid and income funds (funds in the debt category) saw net inflows of `35,699 crore and `15,429 crore, respectively in July. While these numbers speak of the rising popularity of debt funds, fund managers are now strongly advocating the long-term category.
THE DEBT WAY OUTThe logic is, with commodity prices easing out, crude oil prices have fallen over 10% from May’11 to under $100/barrel, inflation that has been a worry for our economy, may finally start coming down.
This, is turn, will have a positive impact as policymakers may now decide to go soft on the interest rate hardening regime. The central bank has hiked key policy rates 11 times since March ’10 to battle inflation. This has impacted corporate profits
and hurt growth. But now when the signals are pointing towards easing of inflation, fund managers are hopeful that interest rates will come down too. In such a situation (if and when interest rates begin to come down) the yield on long duration bond papers will fall leading to an appreciation in price (bond yields and price are inversely related; that is, if yields are falling, prices will rise).
Long-term debt funds will, therefore, perform better in a scenario like this. These long term funds, also known as income funds, invest in fixed-income instruments of varying maturities to generate regular income from coupon payouts from the instruments.
A long-term debt fund invests in certificates of deposit, commercial paper, government bonds, debentures and securitised debt to build a diversified portfolio offering good risk-adjusted returns. Such long duration bond funds have returned an average of 6.8% in the past one-year.
Among better-performing funds, SBI Dynamic Bond, UTI Bond, LIC Nomura MF Bond and Birla Sun Life Medium Term have returned about 8.5% to 9% over the past one year, better than even bank fixed deposits on a post-tax return basis.
Fund managers believe that compared to short term debt and liquid funds (that have been performing very well over the past year) the investment radar will now shift to long-term bond funds, and there will be swift changes in the fixed income portfolio, as interest rates begin to fall. FLAVOUR OF THE YEARFixed maturity plans (FMPs) make a lot of sense too. Although FMPs cannot disclose indicative returns, there is evidence that the performance is better than that of bank fixed
deposits. For investors in these products, the important problem is choosing the right tenure.
Though FMPs come with a tenure of 15 days, if you do not require your money immediately, the best thing is to go in for a long tenure FMP (one or two years). FMPs maturing in one year are offering 9.25%, whereas a public sector bank such as State Bank of India is offering 9.25% for its fixed deposits (FDs) for tenures from one to 10 years. But there is a catch.
There is a tax on the interest income on FDs. That is, for the highest income tax bracket, there is a tax of 33%, thereby bringing the rate of return on your bank FDs down from 9.25% to around 6.47%.
On the other hand, an FMP offering the same rate of return will get double indexation benefits. The tax on the return will get inflation indexation benefits twice-on the year the amount is invested and the year withdrawn.
The rate of tax on returns will be 10% without indexation and 20% with indexation. The post-tax return for a one-year FMP is 8.32%, thus making it a superior product than a bank FD. Fund houses are thus concentrating on launching FMPs with a vengeance. As compared to 340 FMP schemes launched in 2010, already 410 schemes have been launched in the first eight months of 2011.
With equity markets so volatile, this trend seems here to stay. Fund managers opine that many retail investors who are not bullish on the equity markets now are already making the switch to debt and this is likely to be the mood for a while. With most fixed income products from fund houses offering 8% to 9% risk-free returns, retail investors are happy to ride the debt wave as of now, as they shy away from equitieS.

Of the many changes being
considered by SEBI to revive the
mutual fund industry, the
introduction of transaction charges
is one of them and is hoped to
bene�t distributors too
ver since the market regulator Securities and Exchange Board of India (SEBI) enforced a ban on
entry load two years ago, the mutual fund industry has taken a beating, especially since the ban led to the shrinkage of revenues of distributors. Following the ban, a huge number of distributors stayed away from selling funds due to non-compensation and redemptions stayed their course as equity markets surged northwards.
Fund houses, on their part, were affected as their profits took a hit. They had to pay commission to distributors from their own pockets. Further, the adoption of new measures
E
BACKDOORENTRY?
It’s simplified...Beyond Market 19th Sept ’1144

It’s simplified...Beyond Market 19th Sept ’11 45
benefitted retail investors while hurting fund houses.
Now, the SEBI has come up with a host of measures to revive the sagging fortunes of the mutual fund industry and take it to hinterland. The regulator is planning to allow distributors to take a transaction charge. Besides, they have also begun regulating distributors and introduced infrastructure debt funds, which is likely to boost infrastructure spending in the country.
At its board meeting in July, several matters were discussed by SEBI Chairman UK Sinha. Among the points raised at the meeting, some are hoped to come as a relief to the mutual fund industry facing a tough time since the introduction of entry load ban from 1st Aug ’10.
TRANSACTION CHARGES
The much awaited decision will give some monetary benefits to distributors selling MF schemes. SEBI stated that to help penetrate mutual fund into the retail segment in smaller towns, distributors would be allowed to levy `100 as transaction charge per subscription, above `10,000. No charge can be made for investments below `10,000, though. An additional sum of `50 (hence, a total of `150) can be charged to first-time mutual fund investors.
However, no transaction charge would be levied on transactions other than purchase subscriptions relating to new inflows and direct transactions with the mutual fund house.
For systematic investment plans (SIPs), transaction charges can be recovered in 3 or 4 installments. Hence, `20 to `25 can be deducted every month if the SIP is over `1,000 per month. The transaction charges are in addition to the existing eligible
commissions that are permissible to the distributors.
TRANSPARENCY
Guidelines for advertisements will be suitably modified to include point to point return on a standard investment of `10,000 and other performance related disclosures. More granular disclosure of Assets Under Management (AUM) figures giving break up of debt/equity/balanced and also geography-wise disclosures will be made.
Besides, the scheme performance will have to be disclosed against Sensex or Nifty or government of India debt paper in addition to the scheme’s benchmark. Performance of the fund manager across all schemes that are managed by the same fund manager will also have to be disclosed.
ACTIVITIES PERMITTED Asset Management Companies (AMCs) have to manage and advise pooled assets such as offshore funds and pension funds and ensure that they are broad based, provided there is no conflict of interest due to differential fee structure. AMCs will continue to deal with Portfolio Management Services (PMS) under the current arrangements.
DISTRIBUTORS OF MUTUAL FUND PRODUCTS
As a first step towards regulating distributors of Mutual Funds, selected distributors will be regulated through Asset Management Companies (AMCs) by putting in place the due diligence process to be conducted by fund houses.
The due diligence process may be initially applicable for those distributors satisfying one or more of the criteria, that is, if a distributor has
multiple point presence in more than 20 locations and assets under management (AUM) of over `100 crore across the industry in the non-institutional category which includes high networth individuals.
Secondly, the commission received over `1 crore in a year across the industry and commission received of over `50 lakh from a single mutual fund, shall be regulated.
It is estimated that this measure will cover distributors handling about half of the total AUM in the industry. AMCs shall disclose the commissions paid to the distributors meeting one or more of the above criteria and the Association of Mutual Funds in India (AMFI) will disclose the aggregate amount of commissions paid to such distributors by the MF industry.
ACCOUNT STATEMENT, COST- EFFECTIVE MEASURES & GREEN INITIATIVE
One common account statement will be dispatched every month to investors who have transacted in any of their folios across the mutual funds. The account statement shall also contain disclosures related to the transaction charge paid to the distributor.
One common account statement will be dispatched to the investor every half year for all non-transacted folios. Unit holders whose email ids are registered for receiving annual reports by mail, the scheme’s annual reports would be sent by email.
In case of unit holders whose email ids are not registered with the mutual fund houses and the investors who request for hard copies notwithstanding their registration of email ids, the fund houses shall continue to send hard copies of scheme annual reports.

It’s simplified...Beyond Market 19th Sept ’1146
OPERATIONS OF FUND HOUSES TO BE LOCATED IN INDIA
It was seen that some fund houses had investment operations outside India. Hence, SEBI decided that all operations of a mutual fund, including trading desks, unit holder servicing and investment operations shall be based in India.
Mutual funds having any of their operations abroad, will be required to immediately wind up the same and bring them onshore within a span of one year from the notification amending the regulations. The period is extendable by another one year on SEBI’s discretion.
INFRASTRUCTURE DEBT FUND SCHEMES
The SEBI board approved a framework for setting up of Infrastructure Debt Funds (IDFs) through the amendment of SEBI (Mutual Funds) Regulations, 1996.
The IDFs can be set up by any existing mutual fund.
Applications from companies which have been carrying on activities or businesses in the infrastructure financing sector for a period of five years or more and fulfill the eligibility criteria provided in Regulation 7 of Mutual Fund Regulations will also be considered for setting up of mutual funds exclusively for the purpose of launching IDF Schemes.
The IDF would invest 90% of its assets in debt securities of infrastructure companies or across all infrastructure sectors. The minimum investment in IDF would be `1 crore with `10 lakh as minimum size of the unit. The credit risks associated with underlying securities will be borne by the investors and not by IDF.
An infrastructure debt fund scheme shall be launched either as a close-ended scheme maturing after more than five years or interval scheme with a lock-in period of five
years. Fully paid up units of infrastructure debt fund schemes shall be listed on a recognized stock exchange. An infrastructure debt fund shall have a minimum of five investors and no single investor shall hold more than 50% of net assets of the scheme.
Mutual funds may disclose indicative portfolio of infrastructure debt fund scheme to its potential investors disclosing the type of assets the mutual fund will be investing in. Mutual funds launching infrastructure debt fund scheme may issue partly paid units to the investors.
Despite the much needed relief to the industry, some players believe that transaction cost is too less for distributors to sell mutual funds compared to other financial products. However, we will have to wait for few more months to look at how the distributors sell the mutual fund products and whether transaction costs bring in money into the mutual fund industrY.
Commodity trading can be confusing especially if one is inexperienced and
lacks the necessary skills to trade successfully. At Nirmal Bang, our team of
seasoned analysts with years of experience and in-depth knowledge can
help you spot the underlying clues and create the investment strategies
that best suit your commodity trading requirements.
Now, Commodity Trading Is No More A Puzzle.
EQUITIES* | DERIVATIVES* | COMMODITIES | CURRENC Y* | MUTUAL FUNDS^ | IPOs^ | INSURANCE^ | DP* w w w.nirmalbang.comREGD. OFFICE: Sonawala Building, 25 Bank Street, Fort, Mumbai - 400 001. Tel: 022 - 39267500 / 7501; Fax: 022 - 39267510 CORPORATE OFFICE: B-2, 301/302, Marathon Innova, O� Ganpatrao Kadam Marg, Lower Parel (W), Mumbai - 400 013. Tel: 022 - 39268000 / 8001; Fax: 022 - 39268010BSE SEBI REGN No. INB011072759, INF011072759 & INE011072759, NSE SEBI REGN No. INB230939139, INF230939139 & INE230939139 DP SEBI REGN. No NSDL: IN-DP-NSDL-136-2000, CDS(I)l: IN-DP-CDSL-37-99, AMFI REGN. No. arn-49454 NCDEX REGN. NO. 00362, FMC Code-0075, MCX REGN. No. 16590, FMC Code-MCX/TCM/CORP/0490, MCX SX-INE260939139, PMS-INP000002981
Disclaimer: Insurance is a subject matter of solicitation. Mutual Fund investments are subject to market risk. Please read the scheme related document carefully before investing. Please read the Do’s and Don’ts prescribed by Commodity Exchange before trading. The PMS Service is not o�ering for commodity segment. *Through Nirmal Bang Securities Pvt. Ltd. ^Distributors #Prepared by Research Analyst of Nirmal Bang Commodities Pvt. Ltd.
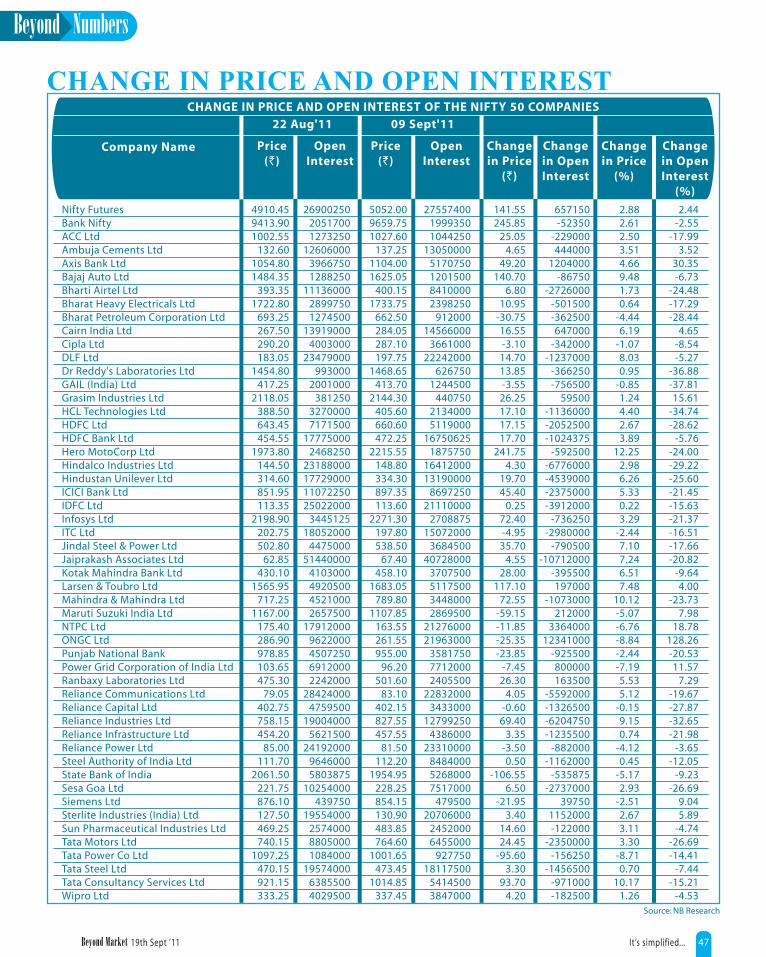
It’s simplified...Beyond Market 19th Sept ’11 47
CHANGE IN PRICE AND OPEN INTEREST
Nifty FuturesBank NiftyACC LtdAmbuja Cements LtdAxis Bank LtdBajaj Auto LtdBharti Airtel LtdBharat Heavy Electricals LtdBharat Petroleum Corporation LtdCairn India LtdCipla LtdDLF LtdDr Reddy's Laboratories LtdGAIL (India) LtdGrasim Industries LtdHCL Technologies LtdHDFC LtdHDFC Bank LtdHero MotoCorp LtdHindalco Industries LtdHindustan Unilever LtdICICI Bank LtdIDFC LtdInfosys LtdITC LtdJindal Steel & Power LtdJaiprakash Associates LtdKotak Mahindra Bank LtdLarsen & Toubro LtdMahindra & Mahindra LtdMaruti Suzuki India LtdNTPC LtdONGC LtdPunjab National BankPower Grid Corporation of India LtdRanbaxy Laboratories LtdReliance Communications LtdReliance Capital LtdReliance Industries LtdReliance Infrastructure LtdReliance Power LtdSteel Authority of India LtdState Bank of IndiaSesa Goa LtdSiemens LtdSterlite Industries (India) LtdSun Pharmaceutical Industries LtdTata Motors LtdTata Power Co LtdTata Steel LtdTata Consultancy Services LtdWipro Ltd
Company Name Price(`)
OpenInterest
Price(`)
OpenInterest
Changein Price
(`)
Changein Price
(%)
Changein OpenInterest
(%)
Changein OpenInterest
4910.459413.901002.55
132.601054.801484.35
393.351722.80
693.25267.50290.20183.05
1454.80417.25
2118.05388.50643.45454.55
1973.80144.50314.60851.95113.35
2198.90202.75502.80
62.85430.10
1565.95717.25
1167.00175.40286.90978.85103.65475.30
79.05402.75758.15454.20
85.00111.70
2061.50221.75876.10127.50469.25740.15
1097.25470.15921.15333.25
2690025020517001273250
1260600039667501288250
1113600028997501274500
139190004003000
23479000993000
2001000381250
32700007171500
177750002468250
23188000177290001107225025022000
344512518052000
447500051440000
4103000492050045210002657500
179120009622000450725069120002242000
284240004759500
190040005621500
2419200096460005803875
10254000439750
19554000257400088050001084000
1957400063855004029500
5052.009659.751027.60
137.251104.001625.05
400.151733.75
662.50284.05287.10197.75
1468.65413.70
2144.30405.60660.60472.25
2215.55148.80334.30897.35113.60
2271.30197.80538.50
67.40458.10
1683.05789.80
1107.85163.55261.55955.00
96.20501.60
83.10402.15827.55457.55
81.50112.20
1954.95228.25854.15130.90483.85764.60
1001.65473.45
1014.85337.45
2755740019993501044250
130500005170750120150084100002398250
91200014566000
366100022242000
6267501244500
44075021340005119000
167506251875750
1641200013190000
869725021110000
270887515072000
368450040728000
3707500511750034480002869500
2127600021963000
358175077120002405500
228320003433000
127992504386000
23310000848400052680007517000
47950020706000
24520006455000
92775018117500
54145003847000
141.55245.85
25.054.65
49.20140.70
6.8010.95
-30.7516.55-3.1014.7013.85-3.5526.2517.1017.1517.70
241.754.30
19.7045.40
0.2572.40-4.9535.70
4.5528.00
117.1072.55
-59.15-11.85-25.35-23.85
-7.4526.30
4.05-0.6069.40
3.35-3.500.50
-106.556.50
-21.953.40
14.6024.45
-95.603.30
93.704.20
657150-52350
-229000444000
1204000-86750
-2726000-501500-362500647000
-342000-1237000
-366250-756500
59500-1136000-2052500-1024375
-592500-6776000-4539000-2375000-3912000
-736250-2980000
-790500-10712000
-395500197000
-1073000212000
336400012341000
-925500800000163500
-5592000-1326500-6204750-1235500
-882000-1162000
-535875-2737000
397501152000-122000
-2350000-156250
-1456500-971000-182500
2.882.612.503.514.669.481.730.64
-4.446.19
-1.078.030.95
-0.851.244.402.673.89
12.252.986.265.330.223.29
-2.447.107.246.517.48
10.12-5.07-6.76-8.84-2.44-7.195.535.12
-0.159.150.74
-4.120.45
-5.172.93
-2.512.673.113.30
-8.710.70
10.171.26
2.44-2.55
-17.993.52
30.35-6.73
-24.48-17.29-28.44
4.65-8.54-5.27
-36.88-37.8115.61
-34.74-28.62
-5.76-24.00-29.22-25.60-21.45-15.63-21.37-16.51-17.66-20.82
-9.644.00
-23.737.98
18.78128.26-20.5311.57
7.29-19.67-27.87-32.65-21.98
-3.65-12.05
-9.23-26.69
9.045.89
-4.74-26.69-14.41
-7.44-15.21
-4.53
22 Aug'11 09 Sept'11CHANGE IN PRICE AND OPEN INTEREST OF THE NIFTY 50 COMPANIES
Source: NB Research

It’s simplified...Beyond Market 19th Sept ’1148
Source: Capital Line
Company Name Current Market Price11th Nov'10
Book Value Price /Book Value
119.72103.70
70.91325.73231.94
91.61142.45141.39169.35124.03
83.31320.17231.01269.10
64.7040.00
705.71124.70223.62113.48200.03160.39322.05130.62489.85154.57
52.41153.76370.29107.21139.70
51.74118.55
21.5874.4838.8133.71
149.82294.61
39.69148.75368.13225.84102.59
96.5752.7751.3593.63
657.21207.81
0.270.300.330.330.360.390.400.410.420.430.430.450.460.480.490.490.510.510.530.530.540.540.550.560.560.570.570.570.580.580.580.580.590.590.600.600.610.630.640.650.660.660.660.670.690.700.700.710.710.71
Source: Capital Line
PRICE TO BOOK VALUE
IVRCL Assets & Holdings LtdAnsal Properties & Infrastructure LtdMoser Baer India LtdBharati Shipyard LtdReliance Communications LtdMahanagar Telephone Nigam LtdBajaj Hindusthan LtdD B Realty LtdEscorts LtdJaiprakashOrbit Corporation LtdGreat Offshore LtdHousing Development & Infrastructure LtdKesoram IndProvogue (India) LtdAlok Industries LtdPiramal Healthcare LtdAnant Raj Industries LtdUnited Breweries Holdings LtdGeodesic LtdPatel Engineering LtdIndiabulls Real Estate LtdVideocon Industries LtdPunjab & Sind BankDredging Corporation Of India LtdJai Corp LtdElectrosteel Castings LtdShipping Corporation Of India LtdJindal Poly Films LtdPunj Lloyd LtdGammon India Ltd3I Infotech LtdIndia Cements LtdFirstsource Solutions LtdIVRCL LtdTriveni Engineering & Industries LtdConsolidated Construction Consortium LtdGujarat Narmada Valley Fertilizers Company LtdVardhman Textiles LtdMercator Lines LtdRolta India LtdGreat Eastern Shipping CoLtdKiri Industries LtdBrigade Enterprises LtdHCL Infosystems LtdIFCI LtdUsha Martin LtdNCC LtdReliance Infrastructure LtdGujarat Alkalies & Chemicals Ltd
Company Name Current Market Price9 Sept'11
Book Value Price /Book Value
32.1031.1523.35
108.7083.7535.9056.4058.1571.7053.2036.20
145.60105.60129.90
31.4019.50
357.2064.05
118.2060.65
107.1586.00
177.1572.80
276.2588.0030.0088.35
213.1062.0080.8030.0069.8012.7544.5023.2020.7094.25
189.2525.7097.80
243.80149.95
68.4566.9537.0536.2066.10
465.00147.85
The table represents companies listed on the BSE that are low on Price to Book Value

It’s simplified...Beyond Market 19th Sept ’11 49
MUTUAL FUND, FII ACTIVITY AND NIFTY
Source: NB Research
Date MF Net*22 Aug'1123 Aug'1124 Aug'1125 Aug'1126 Aug'1129 Aug'1130 Aug'1102 Sep'1105 Sep'1106 Sep'1107 Sep'1108 Sep'1109 Sep'11
FII Net *188.40119.80
94.40229.20-50.7049.00
266.20-268.80-205.90-264.60
39.10-62.30
--
-1281.10-766.10
-71.70-757.80
-1494.00-96.60485.40678.20
1178.10212.00568.80374.20
29.40
4898.804948.904888.904839.604747.804919.605001.005040.005017.205064.305124.655153.255059.45
Nifty
*Net activity in Equity
This graph and data represent the Mutual Fund and FII activity that took place in the last fortnight, whether the Fund Houses were buyers or sellers.
MF Net , FII Net & Nifty
MF FII NIFTY (RHS)
BULK DEALS
Ex Company Client
Price (Rs)
Date Quantity % of EqTrade
BSEBSEBSEBSEBSEBSEBSEBSEBSEBSEBSEBSEBSEBSEBSEBSEBSEBSEBSEBSEBSEBSEBSEBSEBSEBSEBSEBSEBSEBSE
22 Aug'1125 Aug'1125 Aug'1125 Aug'1125 Aug'1125 Aug'1125 Aug'1126 Aug'1126 Aug'1126 Aug'1129 Aug'1130 Aug'1130 Aug'1102 Sep'1105 Sep'1105 Sep'1106 Sep'1106 Sep'1106 Sep'1107 Sep'1108 Sep'1108 Sep'1109 Sep'1109 Sep'1109 Sep'1109 Sep'1109 Sep'1109 Sep'1109 Sep'1109 Sep'11
Gammon India LtdIndia Securities LtdMagma Fincorp LtdMagma Fincorp LtdSterlite Projects LtdTulip Telecom LtdTulip Telecom LtdKemrock Industries & Exports LtdKemrock Industries & Exports LtdTree House Education & Acc LtdPFL Infotech LtdIndia Securities LtdPFL Infotech LtdPFL Infotech LtdSpicejet LtdSpicejet LtdIndia Securities LtdNeo Corp International LtdPerfect Pack LtdEveronn Education LtdIndiabulls Wholesale Services LtdTemptation Foods LtdEl Forge LtdGateway Distriparks LtdGateway Distriparks LtdIndia Securities LtdIndiabulls Wholesale Services LtdIndiabulls Wholesale Services LtdLGS Global LtdSun Granite Exports Ltd
Tree Line Asia Master Fund (Singapore) Pte LtdEssar Teleholdings LtdCitigroup Global Markets Mauritius Pvt LtdCLSA (Mauritius) LtdOverskud Multi Asset Managment LtdCitigroup Global Markets Mauritius Pvt LtdCLSA (Mauritius) LtdTindel Marketing LtdAxis Bank LtdDhanlaxmi Bank LtdThe Royal Bank Of Scotland N VEssar Teleholdings LtdThe Royal Bank Of Scotland N VThe Royal Bank Of Scotland N VSBI Mutual Fund Morgan Stanley India Investment Fund IncEssar Teleholdings LtdAlfa Fiscal Services Pvt LtdFaridabad Papers Mills LtdMorgan Stanley Mauritius Company LtdDeutsche Bank Trust Company AmericasSilver Cross Marketing Pvt LtdTeam India Managers LtdCitigroup Global Markets Mauritius Pvt LtdSwiss Finance Corporation (Mauritius) LtdEssar Teleholdings LtdHSBC Global Investment Funds Fidelity Management And Research Company Stone Media Advisory Services Pvt LtdAjay Multi Projects Ltd
SellSellSellBuySellSellBuySellBuySellBuySellBuyBuyBuySellSellBuyBuySellSellSellSellSellBuySellSellSellBuyBuy
146000048000000
41479404147940
15200019465161946516
306000300000444954114750
48000000117500115000
83973525691091
48000000257100
45000197602593027
1200526620000
20037972000000
480000001302726
920336414505200000
1.075.482.312.311.021.341.341.751.721.321.535.481.571.542.071.405.481.833.381.031.182.972.871.851.855.482.591.831.631.87
Traded
68.0060.0071.5071.5024.37
147.50147.50516.30516.30137.20414.87
60.25418.69420.93
23.7523.7760.6045.0035.60
244.453.489.50
10.00132.02132.00
61.103.663.66
50.0043.90
Close
73.0059.0072.2572.2524.60
146.70146.70520.45520.45116.55415.00
58.80418.60420.70
26.3026.3059.0545.0035.70
247.703.499.559.97
140.40140.40
60.503.663.66
49.6043.90
MAJOR BULK DEALS WHERE OVER 1% OF EQUITY WAS TRADED FROM 22nd Aug ’11 TO 9th Sept ’11
Bulk deals take place from normal trading windows that brokers provide and can be done any time during trading hours. In a bulk deal, the total traded quantity exceeds 0.5% of the number of equity shares of a company.
Source: NSE and BSE
4500
4600
4700
4800
4900
5000
5100
5200
-2000
-1500
-1000
-500
0
500
1000
1500
22 Aug'11
25 Aug'11
30 Aug'1106 Sep'11
09 Sep'11

It’s simplified...Beyond Market 19th Sept ’1150
Scheme Name
Absolute % (Point to Point)
2 Weeks
NAV(9th Sept'11)
MoversBirla SL CEF-Global Agri-Ret(G)Birla SL CEF-Global Multi Commo-Ret(G)Motilal Oswal MOSt Shares NASDAQ-100 ETFBirla SL CEF-Global Prec Metal-Ret(G)ING Latin America Equity(G)LaggardsKotak PSU Bank ETFGS PSU Bank BeESBaroda Pioneer PSU Equity(G)SBI PSU(G)Religare PSU Equity(G)
14.1612.0093.6514.32
9.45
346.29335.43
7.688.98
10.08
10.979.399.138.046.77
-1.64-1.64-1.41-1.32-0.40
Equity Schemes
MOVERS AND LAGGARDS IN MUTUAL FUND SCHEMES
Debt Schemes MoversTata FIPF A1-Reg(G)Escorts Income Bond(G)Escorts Income Plan(G)IDFC Asset Alloc-Mod(G)FT India Life Stage FOFs-40(G)LaggardsDWS Gilt Fund-Reg(G)UTI G-Sec-Invest(G)Principal Govt Sec Fund(G)Reliance Gilt Securities-Ret(G)Birla SL Gilt Plus-Reg(G)
11.9430.1532.4911.3223.25
11.2822.5720.7612.5132.69
2.952.481.921.101.00
-0.18-0.09-0.06-0.04-0.01
Balance SchemesMoversEscorts Balanced(G)Sundaram Balanced Fund(G)LIC Nomura MF Children(G)JM Balanced(G)HDFC Children's Gift - InvestmentLaggardsSBI Magnum NRI Inv-FlexiAsset(G)BNP Paribas MIP(G)ICICI Pru Eq & Deriv-Income Opt-Ret(G)IDFC Arbitrage Plus-Reg(G)ICICI Pru Blended-A-Reg(G)
58.6144.34
9.5521.2343.69
28.0114.8913.9712.0915.55
4.703.613.253.113.03
0.090.210.220.240.25
Source: NB Research
Disclaimer The information provided here has been obtained from various sources and is considered to be authentic and reliable. However,
Nirmal Bang Securities Private Limited is not responsible for any error or inaccuracy in the same.

It’s simplified...Beyond Market 19th Sept ’11 51
week and recovered sharply from the lows of 4,720 to hit a high of 5,175 in just six trading sessions. We believe the oversold market had room for opportunities for both investors and traders to go long in the markets around the 4,720 level.
The larger trend of the market is weak as the Nifty is trading below its important 50-day and 200-day EMA of 5,201 and 5,449, respectively, which is a concern. These are turbu-lent times for the markets, which are losing 2% to 3% daily on the bourses. The third biggest rally of this year took place in the first week of this month; the BSE Sensex surged 567 points and the NSE Nifty jumped 172 points at the end of the day.
However, issues in the Eurozone will continue to stay in the news in the coming weeks. Rumours that Greece is nearing a default added to the global sell-offs in equities seen last week. European markets hit a 26-month low on worries over the situation in Greece. Similarly, the German DAX slipped below the 5,000 level for the first time since July ’09. Stock market traders will also keep a close track on possible warnings and commentaries from corporate America, depending on how the global slowdown will impact the third quarter earnings.
The Nifty Options suggest the highest build-up is seen at the 5,200 Call and 4,800 strike Put to the tune of 6.77 million and 8.99 million, respectively. The Nifty PCR fell to 1.36 from 1.43. Put writers were squaring off positions at strikes 5,000 and below, the highest being at the 4,900 level to the tune of 0.87 million. Call writers on the other hand, added 1.33 million shares at 5,100, hinting at a strong resistance along with a continuation
in the downward trend in the market.
Technically, the short-term trend still remains under review as the Nifty is trading below its 50-day EMA of 5,230, which is a cause of concern. Looking at the current weekly trend, it seems that if the Nifty manages to hold above the 5,035 level, only then there is a possibility of the Nifty testing the 5,230-5,300 levels in the September series. If the Nifty breaks below the 4,835 level, then there is a possibility of a big sell-off being witnessed in the markets.
Therefore, in this environment, we believe that below the 4,835 level, a significant downside up to 4630-4540-4400 is possible. We advise market participants to either stay focused on defensive stocks or avoid high beta stocks.
On the home turf, the IIP numbers at 3.3% for July ’11 left a lot to be desired as against 8.8% in June ’11. The dismal number was mainly due to the poor performance of companies from capital goods, manufacturing and mining sectors, reflecting the sluggishness in the economy.
Important events like Q2 advance tax numbers and the RBI policy meet will play an important role in deciding the trend of the markets.
STOCK IDEAS
Technically, defensive stocks like Coal India Ltd, Hindustan Unilever Ltd, HDFC Bank, Larsen & Toubro, Jindal Steel & Power Ltd, Mahindra & Mahindra Ltd, Petronet LNG Ltd, Sun Pharmaceutical Industries Ltd and Tata Consultancy Services can be bought on corrections from a trading perspective in this uncertain and volatile environmenT.
TECHNICAL OUTLOOK FOR THE FORTNIGHTKEY HIGHLIGHTS
The Indian markets were battered heavily in the month of August. And while the bloodbath on the bourses led to the markets taking a beating by almost 8.5%, the Sensex dipped to alarming levels, hinting at a repeat of the economic gloom of 2008. This was mainly because foreign institu-tional investors (FIIs) turned net sellers by pulling out almost `10,215 crore from the Indian equities.
Globally too, the situation wasn’t any different as the financial markets fell the most since the economic crisis of the year 2008, raising concerns of another recession.
Due to these volatile conditions, investors piled heavily onto gold, pushing the metal to a lifetime high of US $1,921/ounce as investors sought safe-haven avenues. Gold has risen sharply this year as more and more investors are using the yellow metal as a hedge against inflation and politi-cal and economic uncertainties.
Crude oil, on the other hand has dropped to the $89 level. Technology stocks in India too saw a major fall due to fears of a double-dip recession in the US as they rely heavily on income from exports of software services. Among other sectors, realty, power, metal and banking were big losers on the bourses.
Even though the Indian markets were hammered consistently since the past few weeks, short-covering, build-up of fresh longs and positive global cues brought the bulls back to Dalal Street in the first week of September.
STRATEGY
The Indian markets rallied in the past

It’s simplified...Beyond Market 19th Sept ’1152
Four SeasonsIn A Stock’sLife Cycle
Ever y stock fol lows a cycl ical path and it is therefore, imperative for market par ticipants
to know the exact stage at which a stock is trading, to make the right investment decision

It’s simplified...Beyond Market 19th Sept ’11 53
n allegory goes thus: in life, what goes around comes around. The stock markets are no exception
to this rule. Every stock follows a cyclical path. It starts with a slow uptrend, reaches a high point, followed by a steady decline and finally reaches a low, from where it repeats the cycle.
Understanding these cycles and knowing the exact stage at which a stock is currently trading, can help an investor in not only predicting the future direction of a stock, but also the extent of the move. Accordingly, the investor can initiate a trade and reap great profits.
Experts Have Broadly Divided The Markets Into Four Phases.
A
ACCUMULATION
Accumulation is the period in which institutional investors buy substantial quantities of a stock in a slow and steady manner so as not to attract the market’s attention but at the same time accumulate a sizeable chunk of these stocks in their portfolio.
Street Sentiment: This is the time when the word on the street is that the stock is down and out and the general view around the stock is bearish. Most people are either selling or are short on the stock. Even the odd upward bound stock is viewed with scepticism and considered an act of mere short-covering after which prices are expected to fall back again. Even the most ardent long-term investor who had been holding on to his stock in the worst of the markets,
gives up and sells his stocks. The stock is available at great valuations but alas fear keeps small and retail investors away from the stock. Only smart institutional investors are the first to spot this opportunity and board the bus.
This is not a very ideal time for retail investors to invest since prices can hover within a range for a long time. The investor may have bought the stock at a great valuation, but there may be no appreciation in the price for a long time and his capital would get locked-in and cause a lot of mental distress to him.
There is not much of an opportunity for traders too since the volatility is quite low. Even though it is not the right time for retailers to enter, recognizing the signs of accumulation early enough can help them speculate the future price moves. Remember, the base of a stock is formed during the accumulation phase, and hence, market players get a fair idea of where the maximum downside lies.
MARK-UP
This is the most important phase from a retail investor’s point of view. This is a phase when the accumulation phase of the institutional investors is almost over. The slow and steady buying during the accumulation phase has done just enough to push the prices to a level where it will catch the fancy of the more experienced and involved investors who start buying.
This additional buying pressure pushes prices even further and there is now a mad rush by majority of the crowd to get a piece of action. Demand far outweighs the supply and this buying pressure starts pushing prices upwards at a much rapid rate. The stock begins to gain momentum and is now in a confirmed uptrend.
Accumulation
Mark-Up
Distribution
Mark-Down
A STOCK CYCLE
The main indicator that the stock is out of the accumulation phase and firmly in the mark-up phase is the substantial increase in volumes.
Street Sentiment: The word on the street is that this uptrend is going to last for a while and buying recommendations abound. Some even state that this might be the last chance to enter before prices move up astronomically, and that they might be left in the lurch at a later date.
Valuations are high, but fundamentals are thrown out of the window. The final stage of this phase will be marked with a strong acceleration in price and at some point a peak is reached, which is point of resistance.
On a technical chart, this phase is characterized by the formation of higher highs and higher lows. The earlier you recognize this phase and enter, the higher are your chances of profits. For traders, too, there is maximum opportunity to earn money if they are on the long side.
The main thing to watch out for is the end of this stage, which is characterized by a buying climax, where the largest gains occur in the shortest period signalling that the sentiment is most bullish at that point and the stock is getting ready to reverse. A smart investor is one who gets out before the end of this phase.
DISTRIBUTION
This is the phase when institutional investors are seen selling their holdings or are going short on the stock. Here again, they do so in a slow and phased manner so as not to be overtly conspicuous and to keep the prices up at least until they have exited the counter completely. In this regard, this phase mimics the accumulation phase, only in the opposite direction.

It’s simplified...Beyond Market 19th Sept ’1154
Street Sentiment: The word on the street is that this is just a case of profit-booking from where the stock would take support and move up even higher. Hence, amateurs continue their buying or averaging their positions, which is why the fall is not greatly accentuated.
The sentiment begins to turn from bullish to mixed, as both fear and greed is prevalent in this phase. Volumes are fairly thin. If any bad news surfaces during this phase, it only accelerates the process of trend reversal. The key chart patterns to note here are the head-and-shoulder pattern or the rounding dome pattern indicating a trend reversal.
As prices move sideways in this phase, there is not much opportunity for traders to earn money. But if it is a retail investor who has not exited his position during the last leg of the mark-up phase, this is the last chance to sell the share at break even or even a loss. Because, once the next phase sets in, all hell will break loose.
MARK-DOWN
This is the last phase of the stock cycle. By this time, all institutional investors are completely out of the counter or are heavily short. Buying pressure starts decreasing and selling pressure starts mounting.
Many investors begin realizing the trend has reversed and start offloading their positions. Many new investors, taking fresh short positions, also compound this selling pressure. The stock now falls with greater ferocity. Everybody starts selling in panic with hardly anyone to buy. Hence, prices start falling. People who have held on to their loss- making stocks in the hope of a turnaround, throw in the towel and exit. Volumes are very high and the
phase is characterized by a series of lower lows and lower highs on charts.
Street Sentiment: The word on the street again turns bearish; there are sell recommendations all around, and there is a general sense of doom and gloom. But this again is a buy signal for smart institutional investors who once again look to accumulate these stocks, which are available at fairly cheaper valuations after the fall and, hence, the cycle starts signalling the restart of the accumulation phase.
GENERAL STRATEGY
Stay in cash when the stock is languishing in stage 1. In stage 2, you want to go aggressively long. In stage 3, you again want to be sitting on cash. In stage 4, go short aggressively.
PRACTICAL USES OF CYCLES
A stock cycle is measured both horizontally and vertically. The horizontal distance from one bottom to the next is known as the period or the duration of the cycle. Whereas the vertical distance from the bottom to the top is known as magnitude.
(Low) Bo o (Low)Period
Top (High)
Magnitude
carefully, you should be able to spot around 5 to 6 distinct bottoms. Next, measure the distance between each consecutive bottom. This number would be in days or weeks depending on the duration of the period.
After that, take an average of all these measurements. If you have got 6 measurements, say: 15 days, 18, 22, 25, 19 and 20 days, respectively, then take an average of this15+18+22+25+19+20 = 119 = 19.83 days.
6 6Therefore, in order to predict when the stock cycle will bottom out again, we shall allow for a 10% error in both directions. And, 10% of 19.83 = 1.98.
So, the minimum period by which the stock can be expected to bottom out would be 19.83-1.98 = 17.85 days from the last known bottom.
And the maximum period by which the stock can be expected to bottom would be 19.83 + 1.98 = 21.81 days from the last known bottom. Thus, we have a range of 17 to 22 days by which there could be a fair chance of the stock bottoming out again from the last known bottom.
Hence, if you are planning to buy a stock at today’s price but are not quite sure if there is any downside left, the above analysis can serve as a very helpful tool in your stock-buying process as far as timing is concerned. So, if after going through the historic charts you have identified the last bottom of the stock cycle, about 14 days ago, according to our range of 17 to 22 days, you would do well to wait a bit longer for the next 3 to 7 days where there is a strong possibility of a firm bottom being formed and a much greater upside potential from there on.
Understanding and utilizing this process of a stock’s life cycle is not the only tool to be considered. Taking expert advice is always helpfuL.
Every stock goes through cycles of highs and lows in its lifetime. To study the cycle of any stock in detail, it is very important to view the historic charts of any stock. Take a relatively medium-to-high time frame so as to get a more accurate picture of the movement of the stock.
The next step is to try and identify the distinct bottoms of the stock over the concerned time frame. If you look

It’s simplified...Beyond Market 19th Sept ’11 55
DATE: 16th July, 2011VENUE: Hotel Dream, Kochi

It’s simplified...Beyond Market 19th Sept ’1156
Beyond MarketVisits Kochi
Beyond Market, the one-of-its-kind investor education camp, organized by Nirmal Bang Securities Pvt Ltd, in associa-tion with ET Now, was held at Hotel Dream in Kochi on 16th July.
The organizers had brought together industry veterans like Mehraboon Irani, Principal and Head - Private Client Group (PCG), Nirmal Bang Securities Pvt Ltd; N Sethuraman Iyer, CIO, Daiwa Asset Management and Sandeep Wagle, Founder & Managing Director, APTART to impart skills and knowledge necessary to take investment decisions, in line with the aim of the camp which is to enable traders and investors to help become informed investors by bringing them on a single platform.
At the outset, ET Now’s anchors Devina Menon and Niraj Shah introduced the speakers to the audience and informed them how important it is to seek professional guidance in volatile market conditions.
After the brief introduction, Mehraboon Irani took over the dais. While addressing the august audience, he said, “The Indian markets are de-rated and you can expect the growth to slow down. FIIs are under-weight on India. It is not among the top five preferred investment destinations among emerging markets globally.”
The Indian economy is facing a host of problems. Rate hike by the RBI could slower growth, going forward. Corporate earnings may also come down. He expects the Sensex to be in the range of 17,000 to 19,000 over the next six months.
He then spoke about the ongoing crisis in the Euro zone and the US. But there appears to be some hope for India. In the coming times, the emerg-ing markets will stand out, he said. India will gain favour among FIIs.
People are pinning hopes on the government to take steps to positively impact the economy. The markets are in a comatose state. It went up less than 1% in the last 18 months. However, he feels that some fundamen-tally good large-cap stocks have given tremendous returns, outperform-ing the indices.
According to him, FIIs will return once inflation falls or is brought under control. But only once the interest rates start falling will FIIs become overweight on India. And once this happens, they will purchase industry heavyweights. He advised members in the audience to buy at current levels and sell to make profits when FIIs enter the market.
In times of a crisis, like we are seeing at present, only fundamentally sound large-caps will come to your rescue, he said.
“An investor’s portfolio should comprise of 10% to 40% of blue-chip stocks, 30% to 70% of fundamentally strong companies for trading
purposes, 10% to 20% companies that are concept stocks and 0 to 20% in steady stocks,” he advised. He also recom-mended a host of stocks that investors can consider.
Irani said: “The only people that make money are the ones who have the attitude of ‘even though we don’t make money,
Mehraboon IraniPrincipal and Head - Private Client Group (PCG),Nirmal Bang Securities Pvt Ltd
Mehraboon Irani is the Principal and Head of the Private Client Group at Nirmal Bang Securities Pvt Ltd. Previously he was associated with FCH Centrum Wealth Managers Ltd. He has over 20 years experience in capital markets. At Nirmal Bang, he works on increasing brand visibility, improving client base, retaining and improving business with the existing client base as well as providing active advisory services. His previous stints include FCH Centrum Wealth Managers Ltd as Senior Vice President – PMS, Darashaw & Company Ltd as Vice President – Equities and Afternoon Despatch and Courier as Business Editor.
Market participants take informed decisions with guidance from industry experts

It’s simplified...Beyond Market 19th Sept ’11 57
we are unlikely to lose.’ ” Investors should avoid catching momentum to make money. And it is not essential to make money every day.
Irani also advised people to prepare a list of good fundamentally sound scrips and the prices at which they want to acquire them. And that they should buy them at the decided price instead of waiting for the stock to fall further.
N Sethuraman Iyer, a renowned name in the industry, dwelt on the current economic scenario in the world. He mentioned about the underly-ing weaknesses in most developed economies like the US, Europe and Japan. He maintained that growth in the current year is likely to be slow and recovery could also take some time. He admitted that even though the global economy is led by China today, the problems faced by most emerging markets could also impact this leading nation. Inflation continues to be a major cause of worry for most countries and China is no exception. China’s central bank has been tightening its monetary stance much like the RBI. However, the impact of the global issues and internal measures adopted by China are bound to cool down its economy.
Referring to India, Sethuraman said that the macro economic scenario in the country is mixed. He is expecting inflation to continue to be a cause of concern. There has also been a slowdown in IIP numbers in the past few months. Moreover, the trade deficit in India and current account deficit are quite large. However, exports have been quite strong and growth rates phenomenal. This is very important because India is largely dependent on oil imports to meet most of its domestic requirements.
He feels company stocks are getting relatively cheaper and companies are positioning themselves for a fairly good growth, adding that Indian markets are not cheap. But, in a system where earnings are seen growing in double digits, stocks do not come cheap.
Investors today have a plethora of investment options available to them. They must look at investing with a long-term perspective in mind. “The ability to take risk is not an issue, but the lack of ‘expertising’ it is,” emphasized Sethuraman.
The common man does not understand the equity markets. The returns are uncertain. But one must realize that prudent investing with a long-term horizon can give good returns. One must seek advice about good investment opportunities, he said and suggested that new or small inves-tors can start investing through mutual funds.
The last speaker at the event, renowned technical analyst from APTART Sandeep Wagle, spoke about ways to identify technical patterns and how they can help investors and traders understand the highs and lows of the markets. “The crux of the matter is that one should make money from the market.”
Sandeep WagleFounder & Managing Director, APTART
Sandeep Wagle is a stock market veteran in the field of technical analysis with an experience of more than 15 years and has trained more than 6,000 stock market participants across the country, including brokers, sub-brokers, analysts, fund-portfolio managers of reputed mutual funds and FIIs. He started the Technical Analysis department at Angel Broking in May ’02 and was the Chief Technical Analyst till November ’09. Over the past 7 to 8 years, he has been successfully spotting majority of the market moves in the early stages with an amazing degree of accuracy.
N Sethuraman IyerCIO, Daiwa Asset Management
N Sethuraman Iyer, a CFP, is currently the Chief Investment Officer at Daiwa Asset Management. He has an experience of over 30 years at State Bank of India in areas of investments, credit and Forex. He was deputed to SBI Funds Manage-ment Pvt Ltd as the CIO. He has been instrumen-tal in guiding the whole investment team. Post completion of his deputation as the CIO, Sethura-man rejoined SBI as General Manager of the Mumbai Circle in May ’07. He has also been the Senior Vice-President (Credit & Investments) of SBI in Tokyo for over four years. He was last working as the CIO of Shinsei Asset Manage-ment India Pvt Ltd.

It’s simplified...Beyond Market 19th Sept ’1158
Explaining the use of technical analysis in studying market movements, Wagle said, “Technical analysis is the study of the price and volumes using historical data. It studies the psychology of investors and traders and deciphering the direction in which the money is moving.”
Technical analysis is based on the law of demand and supply and works best on stocks that have a mass following. It is all about price. The price says everything.
He said, “Techno funda is an ideal combination,” and added, “market players must study the fundamentals to identify outper-forming stocks and study technicals to time the trade.”
People get addicted to the process of trading. But the process of trading and making money are two different things. People must be willing to sell also. One must realize that when going long, the upside is unlimited. But when going short, the down-side is very fast. Most traders are compulsive traders who trade habitually and this must be avoided, he advised.
The event ended with a round of question and answerS.
The next camp was held in Chennai on 3rd September.

1.6603 in

QUAL
EQUITIES | DERIVATIVES | COMMODITIES* | CURRENCY | MUTUAL FUNDS | IPOs | INSURANCE | DP# # #
www.nirmalbang.com
We understand and value the equation of our relationships. Which is why, we offer our sub-broker/authorized person/remisier equal independence and
status that our partner merits.
That apart, we provide unparalleled knowledge and exceptional market analysis to keep you ahead of the curve, to the advantage of your customers.
After all, at NIRMAL BANG, it’s a relationship beyond broking.
BSE SEBI REGN No. INB011072759, INF011072759 & INE011072759, NSE SEBI REGN No. INB230939139, INF230939139 & INE230939139 DP SEBI REGN. No NSDL: IN-DP-NSDL-136-2000, CDS(I)l: IN-DP-CDSL-37-99, AMFI REGN. No. arn-49454 NCDEX REGN. NO. 00362, FMC Code-0075, MCX REGN. No. 16590, FMC Code-MCX/TCM/CORP/0490, MCX SX-INE260939139, PMS-INP000002981
Disclaimer: Insurance is a subject matter of solicitation. Mutual Fund investments are subject to market risk. Please read the scheme-related document carefully before investing. Security is subject to market risk. Please read the Do’s and Don’ts prescribed by Commodity Exchange before trading. The PMS Service is not offering for commodity segment. *Through Nirmal Bang Commodities Pvt. Ltd. #Distributors
Registered Office: 38-B, Khatau Building, 2nd Floor, Alkesh Dinesh Mody Marg, Fort, Mumbai - 400 001. Tel: 39268600 / 8601; Fax: 39268610, Corporate Office: B-2, 301/302, 3rd Floor, Marathon Innova, Off Ganpatrao Kadam Marg, Lower Parel (W), Mumbai - 400 013. Tel.: 39268000 / 8001 Fax: 39268010
AT NIRMAL BANG, YOU’RE MORE THANJUST A BUSINESS ASSOCIATE,YOU’RE AN EQUAL PARTNER.
Contact Person: Andhra Pradesh - P V Siddhartha: 9849029992; Chandigarh - Yoginder Singh/Gaurav Jolly: 8800396877/9468086545; Chattisgarh - Vidhya Bhushan Tiwari: 7898909299; Delhi, NCR - Aparna Kohli/Yogendra Singh: 8800396872/8800396877; UP - Utkarsh Garg / Yoginder Singh: 7607346002/8800396877; West Bengal, Bihar, Jharkhand, Orissa, North Eastren Region - Joydeep Mukharjee: 9163671502; Gujarat - Devarshi Bhatt: 7600014125; Surat - Om Prakash Mohata: 7600021601; Karnataka - Sivaram Ramkrishnan / Sridhar Ustala: Cell9686682492/8861208308; Kerala - Dennu Kuruvilla / Raghavan: 8129823502/8129823500; Mumbai - Gaurav Mohta/Nilesh Sonawane: 7738380299/7738380027; Maharashtra - Vikrant Darak: 7738380029; MP - Prafull Jain: 7869960088; Punjab, Himachal Pradesh, Jammu & Kashmir - Sukhwinder Singh / Inderpal Singh Madan: 8146666001/8146666006; Rajasthan - Sushil Shrimal: 9414043547; Jodhpur - Shyam Mundra: 9461268368; Udaipur - Dinesh Chhajed/Abhishek Pokharna: 9414166060/9414166662; Tamil Nadu - Thirupathy S: 9677128266
DISCLAIMERIn the preparation of the content of this magazine, Nirmal Bang Securities Private Limited has used information that is publicly available, including information developed in-house. Such information has not been independently verified and we make no representation or warranty as to its accuracy, completeness or correctness. Any opinions or estimates herein reflect the judgement of Nirmal Bang Securities Private Limited at the date of this publication/ communication and are subject to change at any point without notice. This is not a solicitation or any offer to buy or sell. This publication/ communication is for information purposes only and is not intended to provide professional, investment or any other type of advice or recommendation and does not take into account the particular investment objectives, financial situation or needs of individual recipients. For data reference to any third party in this material no such party will assume any liability for the same. Further, all opinion included in this magazine are as of date and are subject to change without any notice. All recipients of this magazine should seek appropriate professional advice and carefully read the offer document and before dealing and/ or transacting in any of the products referred to in this material make their own investigation. Nirmal Bang Securities Private Limited, its directors, officers, employees and other personnel shall not be liable for any loss (financial or otherwise), damage of any nature, including but not limited to direct, indirect, punitive, special, exemplary and consequential, as also any loss of profit in any way arising from the use of this material in any manner whatsoever. The recipient alone shall be fully responsible/ are liable for any decision taken on the basis of this material. This magazine is prepared for private circulation only. Nirmal Bang Securities Private Limited, its affiliates and their employees may from time to time hold positions in securities referred to herein. Nirmal Bang Securities Private Limited or its affiliates may from time to time solicit from or perform investment banking or other services for any company mentioned in this document.
RNI Reg. No. MAHENG/2009/28962