market analysis of bio-composite products · determine where the potential for future market growth...
TRANSCRIPT

MARKET ASSESSMENT: Determine where the potential for future market growth for bio composite
products exists
A paper prepared for CFC/ITTO-USDL
By
Bintang C. H. Simangunsong Bedyaman Tambunan
i

CONTENTS
Page I. Introduction 1 II. World’s demand and its trend of wood composite products 2
2.1. Plywood 2 2.2. Veneer sheets 2 2.3. Particleboard 3 2.4. Fibreboard 3
III. Principal policies 8
3.1. Forest law enforcement, governance and trade 8 3.2. Forest certification 8 3.3. Policies promoting the sound use of wood 9 3.4. Research and development related policies 9 3.5. Industry competitiveness and investment policy 10 3.6. Climate change policy 10 3.7. Wood energy promotion policy 11 3.8. Trade policy and tariff and non-tariff barriers 11 3.9. Phytosanitary measures 12
IV. Demand drivers 13
4.1. Population 13 4.2. Economic growth 13 4.3. Product application and substitution 13 4.4. Price level 14 4.5. Industry push for innovation and value addition to resources 15
V. Potential future market of Indonesia wood composite products 16
5.1. Plywood 16 5.2. Veneer sheets 16 5.3. Particleboard 17 5.4. Fibreboard 17
VI. Indonesia’s forest industry revitalization 21
VII. Summary 30 References 31
ii

LIST OF TABLES Page
Table 1. Apparent consumption and net export of plywood in major
consumer countries, 2002-2006 4 Table 2. Apparent consumption and net export of veneer sheets
in major consumer countries, 2002-2006 5 Table 3. Apparent consumption and net export of particleboard
in major consumer countries, 2002-2006 6 Table 4. Apparent consumption and net export of fibreboard
in major consumer countries, 2002-2006 7 Table 5. Major country destinations of Indonesia wood based panels
exports reported by Ministry of Forestry over the period 2002-2006 19
Table 6. Indonesia wood based panels import shares of total imports
reported by importer country over the period 2002-2006 20 Table 7. Issues, Target, and Strategy in the Restructuring
Phase (2007-2014) 24 Table 8. Issues, Target, and Strategy in the Restructuring
Phase (2015-2025) 25 Table 9. Strategy, Policy, and Action Plan in the Restructuring
Phase (2007-2014) 26 Table 10. Strategy, Policy, and Action Plan in the Restructuring
Phase (2015-2025) 29
iii

I. Introduction
This paper provides a brief analysis of how to determine the potential future
market for bio composite products, especially for Indonesia’s bio composite
products. First, current world’s demand and its trend for each wood-composite
products: plywood, veneer sheets, particleboard and fiberboard were investigated.
The principal policies and market forces that are likely to affect the global and
regional markets for bio-composite products were also described. Then, shares of
Indonesia’s bio composite product imports of total bio composite product imports in
each major country destination as reported by importer countries were analyzed.
Recommended type of Indonesia’s bio composite products that should be
developed and its potential future market would also be determined. Finally, the
need for Indonesia to restructure and revitalize its forest industry were explained.
The principal policies affecting forest products markets in the future are
forest law enforcement, governance and trade (FLEGT); forest certification; policies
promoting the sound use of wood; research and development related policies;
industry competitiveness and investment policy; climate change policy; wood
energy promotion policy; trade policy and tariff and non-tariff barriers; and
phytosanitary measures. Meanwhile, from demand side, needs for wood
composites were driven by population, economic growth, product application and
substitution, price level, and Industry push for innovation and value addition to
resources
The analysis is based on statistics from the FAOSTAT database (FAO
2008), the latest summary of global forest statistics available. Data on production
and trade provided by Ministry of Forestry of Indonesia (MOF) and related agencies
such as Central Bureau of Statistics of Indonesia (BPS) as well as other available
literature were also used. Meanwhile, description of the principal policies affecting
forest products markets in the future was based on Forest Products Annual Market
Review published by United Nations Economic Commission for Europe (UNECE)
and in Annual Review and Assessment of the World Timber Situation published by
ITTO.
1

II. World’s demand and its trend of wood composite products 2.1. Plywood
During the period 2002-2006, world’s plywood consumption significantly
increased from 59.3 millions m3 in year 2002 to 73.3 millions m3 in year 2006, a
24% increase (Table 1). Over this period, about 312.9 million m3 of plywood were
consumed by only 20 countries, which accounted for 91% of world’s plywood
consumption. Three largest consumers were United States of America, China, and
Japan, which together accounted for 68% of world’s plywood consumption. Other
important consumers were the Republic of Korea, India, and Canada.
Although consumption grew fastest in Brazil (117%) followed by China (88%)
and Russian Federation (54%), not only these countries were net exporters but also
major world exporters. Meanwhile, consumption grew slightly 3% in United States
of America, Japan, and United Kingdom and even decreased in the Republic of
Korea (-10%), but these countries were net and major world importers, which
together accounted for 54% of world’s plywood imports. Production, export, and
import of plywood in major consumer countries in the period 2002-2006 are shown
in Appendix 1.
2.2. Veneer sheets During the period 2002-2006, world’s veneer sheets consumption
significantly increased from 8.5 millions m3 in year 2002 to 11.5 millions m3 in year
2006, a 35% increase (Table 2). Over this period, about 48.6 million m3 of veneer
sheets were consumed by only 28 countries, which accounted for 90% of world’s
veneer sheets consumption. The largest single consumer was China (27%). Other
important consumers were the Republic of Korea (9%), Italy (6%), United States of
America (6%), and New Zealand (5%).
Consumption grew fastest in Indonesia (1958%) followed by China (196%)
and Russian Federation (119%). However, Indonesia and Russian were net
exporters, whereas China was a net and one of major world importers. Although
consumption decreased in United States of America, the Republic of Korea, and
Canada, these countries were still net and major world importers. Coupled with
China and Italy, those countries together accounted for 56% of world’s veneer
2

2.3. Particleboard During the period 2002-2006, world’s particleboard consumption significantly
increased from 85.6 millions m3 in year 2002 to 105.9 millions m3 in year 2006, a
24% increase (Table 3). Over this period, about 447.4 million m3 of particleboard
were consumed by only 27 countries, which accounted for 93% of world’s
particleboard consumption. The largest single consumer was United States of
America (32%). Other important consumers were Germany (9%), and China (7%).
Consumption grew fastest in China (104%) followed by Ukraine (100%) and
Russian Federation (88%). These countries were also net importers. Although
particleboard consumption of United States of America grew not as fast as in those
three countries, it was the largest single particleboard importer in the world (36%).
Other important importers were Germany, United Kingdom, Poland, and the
Republic of Korea. Production, export, and import of particleboard in major
consumer countries in the period 2002-2006 are shown in Appendix 3.
sheets imports. Production, export, and import of veneer sheets in major
consumer countries in the period 2002-2006 are shown in Appendix 2.
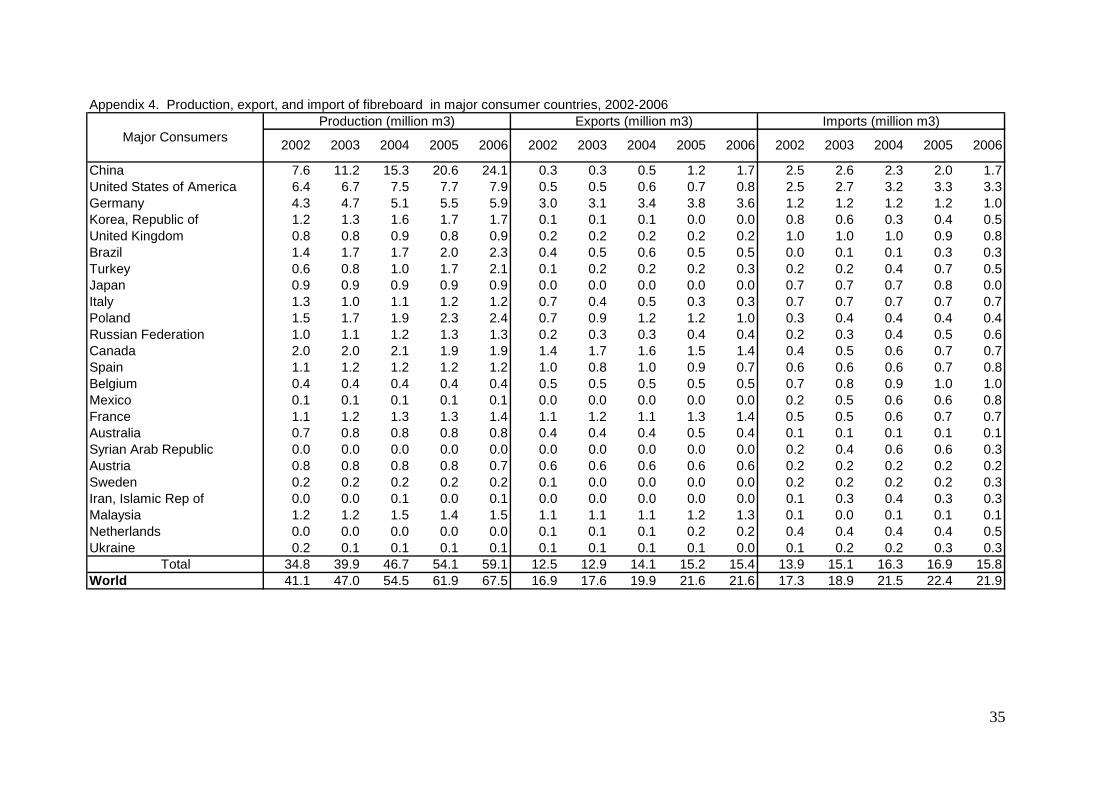
2.4. Fibreboard During the period 2002-2006, world’s fibreboard consumption significantly
increased from 41.5 millions m3 in year 2002 to 67.8 millions m3 in year 2006, a
63% increase (Table 4). Over this period, about 242.6 million m3 of fibreboard were
consumed by only 24 countries, which accounted for 88% of world’s fibreboard
consumption. Two largest consumers were China and United States of America,
which together accounted for 49% of world’s fibreboard consumption. Other
important consumers were Germany, the Republic of Korea, United Kingdom,
Brazil, Turkey, Japan, and Italy.
Although consumption grew fastest in Mexico (239%) followed by Turkey
(213), China (146%), Iran (134%) and Brazil (101%), in order of importance, major
world’s importers were United States of America (USA), China, Germany, United
Kingdom, Belgium, and the Republic of Korea, which together accounted for 43%
of world’s import. Production, export, and import of fibreboard in major consumer
countries in the period 2002-2006 are shown in Appendix 4.
3

Table 1. Apparent consumption and net export of plywood in major consumer countries, 2002-2006
annual 2002-2006United States of America 18.7 18.6 20.2 20.1 19.3 96.9 1% 3% -3.4 -3.7 -5.4 -5.7 -5.7China 11.7 21.3 19.0 21.7 22.1 95.8 17% 88% 0.4 0.5 2.8 4.2 6.0Japan 7.8 7.2 8.3 7.9 8.3 39.6 2% 6% -5.1 -4.2 -5.1 -4.7 -5.0Korea, Republic of 2.2 2.3 1.9 1.9 2.0 10.2 -3% -10% -1.3 -1.4 -1.1 -1.2 -1.3India 1.6 1.7 1.9 2.1 2.1 9.4 7% 31% 0.0 0.0 0.0 0.0 0.0Canada 1.6 1.7 1.7 1.9 2.1 9.0 7% 30% 0.6 0.5 0.7 0.4 0.2United Kingdom 1.2 1.2 1.4 1.3 1.4 6.5 3% 11% -1.2 -1.2 -1.4 -1.3 -1.4Germany 1.0 1.1 1.2 1.1 1.2 5.7 3% 14% -0.7 -0.9 -0.9 -0.9 -0.9Brazil 0.8 0.8 0.8 0.9 1.8 5.2 21% 117% 1.9 2.4 3.0 2.8 1.9Indonesia 1.7 1.0 0.5 1.2 0.8 5.2 -18% -54% 5.8 5.1 4.0 3.4 3.0Russian Federation 0.7 0.8 0.9 1.1 1.1 4.5 11% 54% 1.1 1.2 1.4 1.5 1.5Italy 0.9 0.9 0.9 0.8 0.7 4.0 -6% -23% -0.4 -0.3 -0.4 -0.4 -0.3Mexico 0.5 0.7 1.0 0.9 0.9 4.0 13% 61% -0.4 -0.5 -0.8 -0.8 -0.8France 0.6 0.6 0.6 0.6 0.6 3.1 0% 1% -0.2 -0.2 -0.2 -0.2 -0.2Malaysia 0.7 0.8 0.4 0.5 0.6 3.0 -7% -26% 3.6 3.9 4.3 4.5 4.9Netherlands 0.5 0.5 0.5 0.5 0.5 2.5 2% 9% -0.5 -0.5 -0.5 -0.5 -0.5Spain 0.4 0.4 0.4 0.6 0.5 2.2 6% 26% 0.0 0.0 0.0 0.0 0.0Singapore 0.4 0.4 0.4 0.4 0.4 2.2 0% 0% -0.2 -0.2 -0.2 -0.2 -0.2Philippines 0.4 0.4 0.4 0.4 0.4 1.8 1% 5% 0.0 0.0 0.0 0.0 -0.1Australia 0.3 0.4 0.3 0.3 0.4 1.8 3% 12% -0.1 -0.2 -0.2 -0.2 -0.2
Total 53.9 63.0 62.7 66.3 67.0 312.9 6% 24%World 59.3 69.1 68.5 72.2 73.3 342.5 5% 24%
2006
Net Export = Export - Import (million m3)Major Consumers Change (%)
Apparent consumption (million m3)
2002 2003 2004 2005 2006 2002 2003 2004 20052002-2006
4

Table 2. Apparent consumption and net export of veneer sheets in major consumer countries, 2002-2006
annual 2002-2006China 1.1 3.3 3.3 3.4 3.4 14.5 31% 196% -0.3 -0.2 -0.2 -0.2 -0.2Korea, Republic of 1.1 1.0 0.9 0.9 0.8 4.7 -6% -21% -0.4 -0.3 -0.3 -0.3 -0.3Italy 0.6 0.6 0.6 0.6 0.6 3.1 0% 0% -0.2 -0.2 -0.2 -0.2 -0.2United States of America 0.7 0.6 0.9 0.6 0.4 3.1 -16% -50% -0.3 -0.2 -0.5 -0.2 0.0New Zealand 0.5 0.5 0.5 0.5 0.5 2.6 3% 15% 0.1 0.1 0.1 0.1 0.1Brazil 0.6 0.5 0.5 0.4 0.4 2.4 -7% -26% 0.1 0.1 0.1 0.2 0.2Indonesia 0.0 0.3 0.1 1.0 1.0 2.4 113% 1958% 0.0 0.0 0.1 0.0 0.0Germany 0.4 0.4 0.4 0.4 0.5 2.2 1% 6% 0.0 0.0 0.0 -0.1 -0.1Philippines 0.3 0.4 0.4 0.2 0.2 1.5 -14% -44% -0.1 -0.1 -0.1 -0.1 -0.1Malaysia 0.2 0.3 0.3 0.3 0.3 1.5 11% 50% 0.4 0.3 0.3 0.4 0.3India 0.2 0.2 0.3 0.3 0.3 1.3 4% 16% 0.0 0.0 0.0 0.0 0.0France 0.2 0.2 0.2 0.2 0.2 0.9 2% 7% -0.1 -0.1 -0.1 -0.1 -0.1Pakistan 0.2 0.2 0.2 0.2 0.2 0.9 8% 35% 0.0 0.0 0.0 0.0 0.0Ghana 0.1 0.2 0.2 0.2 0.1 0.9 -1% -4% 0.1 0.1 0.1 0.1 0.1Japan 0.2 0.2 0.2 0.2 0.2 0.8 0% -1% -0.1 -0.1 -0.1 -0.1 -0.1Spain 0.1 0.1 0.2 0.2 0.2 0.8 8% 37% -0.1 -0.1 -0.1 -0.1 -0.1Russian Federation 0.1 0.1 0.2 0.2 0.1 0.7 22% 119% 0.0 0.0 0.0 0.0 0.0Canada 0.1 0.1 0.1 0.1 0.1 0.5 -3% -11% 0.6 0.6 0.8 0.8 0.7Denmark 0.1 0.1 0.1 0.1 0.1 0.5 17% 86% -0.1 -0.1 -0.1 -0.1 -0.1Poland 0.1 0.1 0.1 0.1 0.1 0.5 1% 3% 0.0 0.0 0.0 0.0 0.0Ecuador 0.1 0.1 0.1 0.1 0.1 0.5 6% 28% 0.0 0.0 0.0 0.0 0.0South Africa 0.1 0.1 0.1 0.0 0.1 0.4 -16% -49% 0.0 0.0 0.0 0.0 0.0Singapore 0.1 0.1 0.1 0.1 0.1 0.4 0% 0% 0.0 0.0 0.0 0.0 0.0Turkey 0.1 0.1 0.1 0.1 0.1 0.4 13% 61% 0.0 0.0 0.0 0.0 0.0Côte d'Ivoire 0.1 0.1 0.0 0.1 0.1 0.3 -11% -39% 0.2 0.1 0.2 0.2 0.2Ethiopia 0.1 0.1 0.1 0.1 0.1 0.3 -12% -39% 0.0 0.0 0.0 0.0 0.0Slovenia 0.1 0.0 0.0 0.1 0.1 0.3 -18% -55% 0.0 0.0 0.0 0.0 0.0Belgium 0.1 0.0 0.1 0.1 0.1 0.3 -4% -14% 0.0 0.0 0.0 0.0 0.0
Total 7.6 10.1 10.3 10.5 10.2 48.6 8% 35%World 8.5 11.1 11.3 11.8 11.5 54.2 8% 35%
Change (%) 2002 2003 2004 2005 2006Major ConsumersApparent consumption (million m3) Net Export = Export - Import (million m3)
2002 2003 2004 2005 2006 2002-2006
5

Table 3. Apparent consumption and net export of particleboard in major consumer countries, 2002-2006
annual 2002-2006United States of America 27.2 29.7 31.5 32.4 31.7 152.6 4% 16% -8.3 -9.0 -9.7 -10.2 -9.7Germany 7.7 8.2 9.0 9.1 9.1 43.1 4% 17% 1.0 1.1 1.6 1.8 1.8China 4.6 6.4 7.4 6.7 9.4 34.5 20% 104% -0.9 -0.9 -0.8 -0.8 -1.0Russian Federation 3.0 3.6 4.0 4.3 5.6 20.5 17% 88% -0.3 -0.4 -0.3 -0.3 -1.0Poland 2.9 3.4 4.1 3.9 4.6 19.0 12% 56% 0.2 0.3 0.0 0.0 -0.1Italy 3.5 3.6 3.9 3.8 3.8 18.6 2% 8% -0.2 -0.2 -0.2 -0.3 -0.1United Kingdom 3.7 3.5 3.7 3.5 3.4 17.7 -2% -7% -1.2 -1.0 -1.0 -1.0 -0.8Spain 3.6 3.5 3.6 3.5 3.5 17.7 -1% -2% -0.2 -0.3 -0.3 -0.3 -0.2France 3.1 3.1 3.4 3.4 3.1 16.2 0% 0% 0.7 0.8 1.0 1.2 1.7Canada 3.2 2.8 1.9 3.1 4.9 15.9 12% 55% 8.1 8.9 9.4 9.3 8.7Turkey 2.0 2.3 2.8 2.9 2.8 12.7 9% 39% 0.0 0.0 -0.1 0.0 0.0Brazil 2.0 2.2 2.4 2.3 2.4 11.2 5% 21% 0.0 -0.1 -0.1 0.0 0.1Korea, Republic of 1.6 1.5 1.8 1.6 1.8 8.2 3% 13% -0.9 -0.7 -0.9 -0.8 -1.0Japan 1.6 1.7 1.6 1.6 1.7 8.2 1% 3% -0.4 -0.4 -0.4 -0.4 -0.4Denmark 1.0 1.0 1.1 1.2 1.2 5.4 5% 22% -0.6 -0.6 -0.8 -0.8 -0.8Australia 1.0 1.1 1.1 1.0 1.0 5.2 0% 0% -0.1 0.0 0.0 0.0 0.0Ukraine 0.7 1.0 0.6 1.3 1.5 5.1 19% 100% -0.2 -0.3 0.4 -0.2 -0.1Austria 0.9 0.9 0.9 0.9 0.9 4.6 1% 5% 1.5 1.5 1.5 1.5 1.5Sweden 0.8 0.8 0.9 0.9 1.1 4.4 8% 35% -0.2 -0.3 -0.4 -0.4 -0.5Greece 0.7 0.9 0.8 0.8 0.9 4.1 5% 23% 0.0 0.0 0.0 0.0 -0.1Belgium 0.8 0.7 0.7 1.0 0.8 4.0 1% 5% 1.7 1.6 1.5 1.3 1.5Czech Republic 0.6 0.8 0.8 0.9 0.8 3.9 5% 24% 0.2 0.3 0.3 0.3 0.5South Africa 0.7 0.7 0.7 0.4 0.6 3.1 -5% -18% 0.0 0.0 0.0 0.0 -0.1Iran, Islamic Rep of 0.5 0.6 0.7 0.7 0.6 3.1 6% 25% 0.0 0.0 0.0 0.0 0.0Romania 0.4 0.5 0.6 0.7 0.8 3.0 16% 78% -0.3 -0.1 -0.1 -0.2 -0.1Netherlands 0.6 0.5 0.5 0.6 0.6 2.8 3% 11% -0.6 -0.5 -0.5 -0.6 -0.6Hungary 0.6 0.5 0.5 0.5 0.6 2.6 0% -1% -0.1 0.0 0.0 0.1 0.1
Total 79.1 85.3 90.8 93.1 99.1 447.4 6% 25%World 85.6 91.7 98.3 100.3 105.9 481.7 5% 24%
Major ConsumersApparent consumption (million m3) Net Export = Export - Import (million m3)
2002 2003 2004 2005 2006 Change (%) 2002 2003 2004 2005 20062002-2006
6

7
Table 4.
ChinaUnited GermKorea, RepubUnited KiBrazilTurkeyJapanItalyPolandRussCanadaSpainBelgiumMexicFrancAustraliaSyrian AAustriaSwedenIran, IsMalayNetherlandsUkraine
Apparent consumption and net export of fibreboard in major consumer countries, 2002-2006
annual 2002-20069.8 13.6 17.1 21.4 24.1 86.0 25% 146% -2.2 -2.3 -1.7 -0.8 0.0
States of America 8.4 8.9 10.1 10.3 10.4 48.1 6% 24% -2.0 -2.2 -2.6 -2.6 -2.5any 2.5 2.8 2.9 2.9 3.3 14.5 7% 31% 1.7 1.9 2.2 2.6 2.6
lic of 1.9 1.9 1.8 2.0 2.1 9.7 2% 7% -0.7 -0.5 -0.3 -0.4 -0.4ngdom 1.6 1.6 1.7 1.5 1.5 7.9 -2% -7% -0.8 -0.8 -0.8 -0.7 -0.6
1.1 1.3 1.2 1.8 2.1 7.5 19% 101% 0.3 0.4 0.5 0.2 0.20.7 0.9 1.2 2.3 2.3 7.4 33% 213% -0.1 -0.1 -0.2 -0.5 -0.21.6 1.5 1.6 1.6 0.9 7.3 -12% -40% -0.7 -0.7 -0.7 -0.8 0.01.3 1.3 1.3 1.5 1.5 7.0 4% 17% 0.0 -0.3 -0.3 -0.4 -0.31.0 1.2 1.1 1.5 1.8 6.6 15% 74% 0.4 0.5 0.8 0.8 0.6
ian Federation 1.0 1.2 1.2 1.4 1.5 6.3 12% 58% 0.1 -0.1 -0.1 -0.1 -0.21.0 0.8 1.2 1.2 1.2 5.4 4% 18% 0.9 1.1 0.9 0.8 0.70.8 0.9 0.9 1.0 1.4 4.9 14% 68% 0.3 0.2 0.4 0.3 -0.10.5 0.7 0.8 0.9 0.9 3.8 16% 78% -0.2 -0.4 -0.4 -0.5 -0.6
o 0.3 0.6 0.7 0.8 0.9 3.2 36% 239% -0.2 -0.5 -0.6 -0.6 -0.8e 0.5 0.5 0.7 0.7 0.6 3.0 7% 33% 0.6 0.7 0.6 0.6 0.8
0.4 0.4 0.5 0.5 0.5 2.3 6% 27% 0.3 0.4 0.3 0.4 0.3rab Republic 0.2 0.4 0.6 0.6 0.3 2.0 17% 86% -0.2 -0.4 -0.6 -0.6 -0.3
0.4 0.3 0.4 0.5 0.3 1.9 -7% -25% 0.5 0.5 0.4 0.3 0.40.3 0.3 0.4 0.4 0.4 1.7 8% 38% -0.1 -0.2 -0.2 -0.2 -0.2
lamic Rep of 0.1 0.3 0.5 0.3 0.3 1.5 24% 134% -0.1 -0.3 -0.4 -0.3 -0.3sia 0.2 0.2 0.5 0.3 0.3 1.5 5% 20% 1.0 1.0 1.0 1.0 1.2
0.3 0.3 0.3 0.3 0.3 1.5 1% 3% -0.3 -0.3 -0.3 -0.2 -0.30.3 0.2 0.2 0.3 0.4 1.4 9% 40% 0.0 -0.1 -0.1 -0.2 -0.3
Total 36.2 42.1 48.9 55.8 59.5 242.6 13% 64%World 41.5 48.3 56.1 62.7 67.8 276.4 13% 63%
2003 2004 2005 2006Major ConsumersApparent consumption (million m3) Net Export = Export - Import (million m3)
2002 2003 2004 2005 2006 Change (%) 20022002-2006

III. Principal policies
3.1. Forest law enforcement, governance and trade
The most prominent group of policy issues discussed in international and
national forums is forest law enforcement, governance and trade (FLEGT). This is
a regulation to control imports of illegally-sourced timber from specific countries and
will form the legal basis for the licensing scheme and partnership agreements.
However, if it is restricted only to logs and sawnwood, it would be negligible. To be
essential, this licensing scheme should include all product groups but at the same
time would lead to additional administrative burdens, possibly similar to chain-of-
custody tracking systems in forest certification (Blasser 2002).
In May 2003, The European Commission issued an "Illegal Logging Action
Plan,” which proposed the establishment of voluntary bilateral agreements between
the EU and timber-producing countries. "Legality licences" would be created, using
independent verification, to ensure the origin and legality of timber imports.
However, the industry is worried about the functionality, complexity and additional
costs of such measures.
3.2. Forest certification
Many factors are considered in forest certification programmes including
illegal logging. Rametsteiner and Simula (2003) stated there are some evidences
that certification programmes are having a positive impact on forest management
practices around the world although doubts about the value and future viability of
forest certification from a market perspective exist. Issues related to more
comprehensive management planning, plant and animal biodiversity, retention of
sensitive areas, and social responsibility have all become more important as
certification processes have become more prevalent.
The development of demand for certified forest products through specific
public procurement policies have been facilitating by several governments at local,
provincial and national levels in the US and Europe. However, these measures
8

were seen as effectively constituting non-tariff barriers to trade by some developing
countries.
3.3. Policies promoting the sound use of wood
The harmonization of functional specifications in standards across borders is
clearly important to more efficient use of wood. For example, although no direct
regulatory barriers to the use of wood or wood-based products in the construction
of residential buildings, differences between sets of regulations act as barriers to
common practice across Europe.
The development of wood-based composite products such as oriented
strand board (OSB), laminated strand lumber, parallel strand lumber and laminated
veneer lumber (LVL) provides is another example of significant advancement in the
sound use of wood. This has dramatically affected wood markets and provided
new options to forest managers and policy makers. New developments related to
wood-based composite products technology is associated with myriad products that
can be substituted for products made of solid wood and is likely to stimulate further
interest in plantation establishment while at the same time further reducing interest
in long rotation periods on industrial forestlands.
3.4. Research and development related policies
In forestry sector, publicly funded research is related to the development of
policies aimed at the sound use of wood. The objective of all wood products
research program globally is to improve efficiency of wood use, whether through
development of new conversion technologies, product designs, building codes and
application guidelines or durability enhancements.
In US, advances in process and product development over the past 50 to 60
years have increased the quantity of primary products (e.g. sawnwood, panels, and
paper) obtained from a given quantity of industrial roundwood by about 40%. The
development of wood composites and engineered structural materials has also
allowed better utilization of low value resources to create high value materials,
thereby enhancing forest management options. All of these developments have
served to greatly extend the forest resources of the US.
9

However, funding for forestry-oriented research, and for wood utilization
research in particular, has declined markedly in the UNECE region in recent
decades. For example, in the US, funding for forest products research by the US
Department of Agriculture (USDA)-Forest Service has been declined by almost
30% over the last 20 years. The number of USDA Forest Service research
scientists involved in wood science and technology-oriented research has also
declined by more than 75% since 1985 (National Research Council 2002). Industry
funding of research has also declined over this period.
3.5. Industry competitiveness and investment policy
The developed countries is forced to reassess a long-established
manufacturing and marketing strategies due to the flow of capital investment to new
producing regions, and growing global competition in wood-based commodity
products markets. One result in North America is radical new thinking about the
nature of paper manufacturing in the future, which is to transform the entire industry
to a biochemicals/biofeedstocks/bioenergy/pulp and paper industry, with individual
mills operating as integrated biorefineries.
Under this new paradigm, manufacturing centres will have the capacity to
produce electricity, liquid fuels (such as ethanol), and a wide variety of bioderived
chemicals and chemical feedstocks, in addition to pulp and paper. Paper will
effectively become only one of a number of (diverse) co-products. The biorefinery
is quickly moving beyond the concept stage, with a major research effort now
underway involving both wood products and the agricultural sectors of the US and
Canadian economies.
3.6. Climate change policy
Although a considerable research effort has been conducted to quantify
carbon flows and storage within forests under various management regimes, it has
little impact on forest management practices and uncertainty impacts on markets
and trade in the US.
Lecocq (2004) stated the carbon trade market is growing globally with
market buyers are mainly Japan, the Netherlands and the Carbon Finance
10

Business (CFB) of the World Bank (Prototype Carbon Fund and Community
Development Carbon Fund). However, carbon sink projects especially those linked
to plantations and large-scale hydropower projects face strong NGO resistance,
which will likely make such projects less attractive for Carbon Emission Reduction
(CER) buyers. On the other hand, the working group of an EU Advisory Committee
(EU 2004) has recently focused on carbon sequestration benefits associated with
substitution of wood for non-wood materials.
3.7. Wood energy promotion policy
As countries promote renewable energy sources, energy markets and the
international biofuel trade are rapidly developing. In Europe, demand continues to
increase for the use of forest biomass for energy. This is partly driven by targets to
fulfill national commitments under the Kyoto Protocol.
Increase demand for wood as a source of bioenergy in North America and
Europe whether as a result of business initiatives or government policies, or both
creates a competitive alternative use of raw material in wood-based industries,
especially the pulp and paper and panel industries. This new reality means the
price of wood fibre will have to be competitive with the price of wood as a fuel even
though this is a positive development from the standpoint of profitability of forestry.
3.8. Trade policy and tariff and non-tariff barriers
The massive development of production capacity in China has led to
unprecedented growth of Chinese imports into the US. These and other
developments have prompted the US government to consider tariff measures under
the anti-dumping category in some market segments. As a result, Chinese
exporters of wooden bedroom furniture face stiff anti-dumping penalties on exports
to the US market.
There is still tariff escalation of forest products in developed countries. But,
the overall level of applied tariffs is higher in developing countries than in the
industrialized regions, with considerable differences in the applied rates between
regions. Reducing tariff barriers would then increase new export market
opportunities, which in turn, increase wood and forest products production in the
11

forest-rich, net exporting countries. On the other hand, non-market barriers, such
as those set through environmental, social or health standards, are considerably
more difficult to negotiate.
3.9. Phytosanitary measures
The WTO Sanitary and Phytosanitary (SPS) Agreement aims at clarifying
inspection and quarantine control procedures. The profile of SPS measures has
risen in recent years, partly as a response to increased vigilance and concern
about environment and safety issues. Concern is not limited to risks of wood
transport from developing countries. Regulations also impact trade between North
America and Europe in order to prevent transmission of a range of forest pests
across the Atlantic.
12

IV. Demand drivers
4.1. Population
Demand of bio-composite products are strongly affected by changes in
population (growth or decline), age structures and household composition. ITTO
(2007) stated that in producer countries total population was increased by almost
600 millions during the period 1987 to 2007. Population in consumer countries was
also increases, though more moderately. However, Japan, a major importer, was
believed to have ceased its population growth during that period and then declining
in its demand would be expected in coming years.
4.2. Economic growth
Since 2000, trends in GDP growth have been similar for all consumer
regions, but Asia clearly showed the greatest volatility, with Europe and North
America tracking each other’s growth within a much narrower band. ITTO (2007)
stated that GDP growth for all ITTO Consumers was grown in 2006, where Asia
was the fastest (4.9%) and followed by North America (3.4%), non-EU Europe’s
(2.7%), and the EU (2.5%).
ITTO Producer economies generally have been growing significantly faster
than Consumers ever since 2000, with a spread of 2 percentage points expected to
persist at least until the end of 2007. ITTO Producer Asia continues to show the
most robust growth of all ITTO sub-regions, with Africa running a close second.
Latin America has lagged due to relatively slower growth in both Brazil and Mexico.
Although Japan remains in number-one position among all ITTO importers of
tropical plywood, its imports would expectedly decline hereafter as its population
has peaked and its economy has reached a steady state with little or no GDP
growth.
4.3. Product application and substitution
Currently, temperate and coniferous plywood is increasingly substituted for
tropical hardwoods, holding down the latter’s price. This was indicated by a
progressive substitution of temperate and boreal conifers for tropical hardwoods
13

imports of Japan. China, one of major tropical plywood manufacturers, has
broadened tropical export panel products to include a variety of combinations of
some different core (often China-grown poplar) overlaid with face veneers of
tropical woods such as meranti. As a result, its plywood products are
comparatively lighter and cheaper than Southeast Asian products while their quality
has noticeably improved.
Meanwhile, consumption of veneer theoretically not destined for plywood,
presumably in the furniture and other secondary processing industries of ITTO
member countries, had marked a minor decline of 0.6% to 3.51 million m3 in 2006.
Moreover, there are clear trends for European governments and buyers, in
good part responding to expressed desires of producers, to shift their import
product mix increasingly away from tropical hardwood roundwood in favor of
sawnwood, panels and further-processed products manufactured in producing
countries.
4.4. Price level
The future of tropical plywood consumption in most markets is apt to be
determined mainly by price competition. Consumer country inflation rates were
mostly in a band around 2%, whereas most producer countries held inflation rates
near 5% in the period 2000-2005. Prices for most primary tropical timber products
and species ended 2006 considerably further strengthened over their already-
strong performances during 2005, as supplies of raw materials tightened, severely
in some cases. At the same time most ITTO consumer country economies were
expanding or at least stabilized, steadying or improving consumer confidence in
most markets.
Prices for Asian plywood kept on rising steadily and steeply through 2006,
due to basic scarcities of peeler logs in some case heightened by regulatory
policies, strong demands from North American and some European consumers as
well as transport interruptions due to weather and other factors. However, further
price rises were prevented by strong competition from cheaper Chinese
combiplywood and the mounting concern of public opinion-leaders over illegal
logging.
14

Meanwhile, the international markets for tropical veneer remain quite small
and buyers mainly seek decorative sliced veneers. The individual markets for these
very varied sliced veneers are extremely narrow and knowledge of transactions is
closely held. There are no representative benchmark species whose prices could
serve as indicators of overall market trends. Tropical veneer prices are therefore
not regularly covered by the ITTO MIS and are also not regularly quoted by any
other readily available source.
4.5. Industry push for innovation and value addition to resources
The highest degree of conversion at least to primary products is in Latin
America. In 2005, 86.7% of logs have been converted locally into sawnwood,
10.8% into plywood, and 1.9% into veneer sheets. Moreover, this region has been
relatively highly advanced, with about 70% of total exports by value being
secondary processed wood products (SPWP) in 2005.
Meanwhile, as roundwood export policies are tightening, the roundwood
exports proportion of log production in Producer Asia was declined from 8.8% in
1995 to 7.2% in 2005. The SPWP shares were also increased from about 30% in
1995 to 55% in 2005.
Only African producers still export significant proportions of their log harvests
as roundwood, though there is also progressive cutting back on roundwood exports
in this region: From 40.6% of the log harvest in 1995, to 17.3% in 2005, 16.3%
forecast for 2007. Clearly substantial progress has been made in fostering domestic
processing, but evidently there is significant further potential for capture of value-
added by the African economies by intensifying industrial development efforts.
Even more dramatic inter-regional differences in progress toward higher-value-
added products in the timber industries sector, coupled with higher foreign-
exchange earnings from the forest resource, are seen by comparing the
proportional values of primary versus further-processed wood products exported.
15
V. Potential future market of Indonesia wood composite products
5.1. Plywood MOF (2007) reported over the period 2002-2006, in order of importance, major
country destinations of Indonesia’s plywood exports were Japan, United States,
China, the Republic of Korea, Taiwan, Saudi Arabia, United Arab Emirates, United
Kingdom, and Belgium, which together accounted for 83% of Indonesia’s plywood
exports (Table 5). In Japan, China, the Republic of Korea, and United Arab
Emirates, plywood import from Indonesia’s was around 27%-33% of their total
plywood imports (Table 6). In Saudi Arabia, it was almost 60% of its total plywood
imports.
Although China has been the largest plywood producer in the world since 2003
as well as a net exporter (Table 1), its plywood import was still large, ranging from
1.7 to 2.0 millions m3 per year. Meanwhile, even though, consumption in United
States of America, Japan, and United Kingdom grew slightly and even decreased in
the Republic of Korea (-10%), but these countries were net and major world
importers, which together accounted for 54% of world’s plywood imports. Hence, It
is obvious these five countries would still be the future market for Indonesia’s
plywood exports.
5.2. Veneer sheets MOF (2007) reported over the period 2002-2006, in order of importance, major
country destinations of Indonesia’s veneer sheets exports were Japan, United
States, China, the Republic of Korea, Taiwan, Germany, Saudi Arabia, Italy, and
United Kingdom, which together accounted for 84% of Indonesia’s veneer sheets
exports (Table 5). However, In United States, the Republic of Korea, and Italy,
veneer sheets import from Indonesia’s was much less than 1% of their total veneer
sheets imports (Table 6). In Germany and United Kingdom it was around 1% of
their total veneer sheets imports. Meanwhile, in Japan, China and Saudi Arabia, it
ranged from 5.1% to 6.8% of their total veneer sheets imports.
16

The fact that most veneer sheets production were consumed domestically over
the period 2002-2006 and considered that veneer sheets export price were more
than double of plywood export price, then, if Indonesia would domestically process
veneer sheets, it should produce high added value forest products. Otherwise,
selling veneer sheets is more profitable than to process it first into plywood and
then sold it.
5.3. Particleboard MOF (2007) reported over the period 2002-2006, in order of importance, major
country destinations of Indonesia’s particleboard exports were the Republic of
Korea, Taiwan, Viet Nam, Hongkong, China, and Malaysia, which together
accounted for 97% of Indonesia’s particleboard exports (Table 5). However, in the
Republic of Korea, Viet Nam, China, and Malaysia, particleboard import from
Indonesia’s was only ranged from 2.3% to 6.9% of their total particleboard imports
(Table 6).
Although during that period Indonesia’s particleboard exports to those countries
were declining, China and Republic of Korea imports of particleboard were still
large, ranging from 0.7 to 1.1 millions m3 per year (Appendix 3). Similar to that
veneer sheets product, most particleboard were consumed domestically over the
period 2002-2006. Coupled with particleboard import that was almost triple over
that period, particleboard production should be intended for domestic consumption.
5.4. Fibreboard MOF (2007) reported over the period 2002-2006, in order of importance, major
country destinations of Indonesia’s fiberboard exports were China, Saudi Arabia,
Republic of Korea, Taiwan, Syria Arab Republic, Egypt, United Arab Emirates, Viet
Nam, Philippines, and Hongkong, which together accounted for 89.5% of
Indonesia’s fiberboard exports (Table 5). In China, the Republic of Korea, and
Saudi Arabia, fiberboard import from Indonesia’s was around 9.1%-11.5% of their
total fiberboard imports (Table 6). For the rest countries, it ranged from 3.3% to
6.1% of its total fiberboard imports.
17

18
Table 4 and Appendix 4 show China and the Republic of Korea would still be
potentially become major country destinations of Indonesia’s fiberboard exports in
the future since they are world’s major consumers and net importers of fiberboard
with imports ranging from 1.7 to 2.6 millions m3 per year for China and from 0.3 to
0.8 millions m3 per year for the Republic of Korea.

Table 5. Major country destinations of Indonesia wood based panels exports reported by Ministry of Forestry over the period 2002-2006
Country Destination Percentage Country Destination Percentage Country Destination Percentage Country Destination PercentageJapan 39.6% Japan 39.8% Korea, Republic of 27.0% China 29.7%United States 8.6% United States 12.8% Taiwan, Province of China 21.8% Saudi Arabia 16.6%China 7.8% China 8.5% Viet Nam 17.0% Korea, Republic of 16.4%Korea, Republic of 7.6% Korea, Republic of 7.1% Hongkong 16.1% Taiwan, Province of China 7.2%Taiwan, Province of China 6.1% Taiwan, Province of China 4.8% China 9.3% Syria Arab Republic 4.7%Saudi Arabia 4.8% Germany, Fed. Rep. of 3.4% Malaysia 6.0% Egypt 4.1%United Arab Emirates 4.0% Saudi Arabia 3.0% Other countries 2.8% United Arab Emirates 3.5%United Kingdom 2.4% Italy 3.0% Viet Nam 3.4%Belgium 2.3% United Kingdom 2.1% Philippines 2.1%Other countries 17.0% Other countries 15.6% Hongkong 2.0%
Other countries 10.5%Total 100.0% Total 100.0% Total 100.0% Total 100.0%
Plywood Veneer sheets Particleboard Fibreboard
19

20
Table 6. Indones
JapanUnited StatesChinKorea, RepublSaudi ArabiaUnited Arab EmUnited KingdomBelgium
ia wood based panels import shares of total imports reported by importer country over the period 2002-2006
Importer Country Percentage Importer Country Percentage Importer Country Percentage Importer Country Percentage30.6% Japan 5.1% Korea, Republic of 3.7% China 9.1%9.5% United States << 1% Viet Nam 6.9% Saudi Arabia 11.5%
a 28.6% China 6.0% China 2.3% Korea, Republic of 10.8%ic of 27.2% Korea, Republic of << 1% Malaysia 3.1% Syria Arab Republic 3.3%
59.9% Germany, Fed. Rep. of 1.1% Egypt 5.1%irates 32.5% Saudi Arabia 6.8% United Arab Emirates 4.4%
10.7% Italy << 1% Viet Nam 5.1%18.5% United Kingdom 1.3% Philippines 6.1%
Plywood Veneer sheets Particleboard Fibreboard

VI. Indonesia’s Forest Industry Revitalization1
Indonesia’s forest sector is facing crisis, due to rapid forest resource loss
and degradation that threaten the livelihoods of rural people and the sector’s
continued contribution to export earnings and economic development. Industrial
restructuring and development of alternative timber resources are needed to bridge
the growing gap between demand for forest products and sustainable supply. The
Ministry of Forestry and most stakeholders recognize the problem of industrial over
capacity and the obstacles to revitalization posed by continued illegal logging.
There is also recognition that the future of the wood processed industry will depend
on an expanded plantation program. In many areas, there is considerable potential
to involve the rural poor in plantation production on both community and individually
owned land. Expanding plantations will be challenged by conflict over land
resources and the need to address issues of due process related to gazettal to help
ensure legality of products in international markets. Industry revitalization will also
require restructuring of the wood processing industry, the main source of demand
for Indonesian timber resources.
With regard to develop operational policies and plans, the Ministry of
Forestry established an In-house Experts Working Group in June 2006, with a
mandate to advise the Minister of Forestry on key issues related to industry
revitalization, including plantation acceleration and industry retooling/reform and
prepare policy recommendations for the Minister directly. The Working Group,
which consists of senior Forestry Ministry experts including representatives from
each of the Department’s main directorates, as well as the legal and planning
bureaus, and outside academics, has: conducted regular meetings with several
major stakeholders, visited several forest plantation concessionaires, community
forests, and wood processed companies; and conducted stakeholder consultation
workshops. Based on In-house Experts Working Group’s assessments, four
working groups: Woodworking WG, Furniture WG, Plywood and Other Wood Based
Panel WG, and Pulp and Paper WG were then established by Direktorat Jendral
Bina Produksi Kehutanan (BPK) in March 2007. In-house Experts Working Group
1 Summarized from MOF. 2007. A Road Map for the Revitalization of Indonesia’s Forest Industry. The Forest Industry Revitalization In-house Expert Working Group- Ministry of Forestry, Jakarta.
21

was then actively guided2 those working groups to develop their industry roadmaps
and combined them into roadmap of Indonesia wood-based industry.
All involved stakeholders have a shared vision regarding Indonesia wood-
based industry. That is, in the future the industry would produce wood products
that can enter highly competitive market and be supported by sustainable
increasing wood supply. There would be enough log supply from different sources;
particularly from certified and sustainable managed production forests and the
production level of wood products would be in accordance with that sustainable log
supply in the next 20 years. Moreover, Indonesia wood-based industry would
operate efficiently and in environment friendly with capacity utilization rate of at
least 70%, focus on high value-added products that can enter highly competitive
market where at least 20% of them are certified, and enlarge their market share in
domestic and foreign markets.
However, they are also recognizing many problems that can hinder
Indonesia to achieve that vision. At least six major problems agreed by all
stakeholders are facing by the industry. They are: a huge gap between industrial
demand for timber and the legal sustainable supply, industrial over capacity,
inefficient in wood processing industry, declining in product competitiveness,
declining in market share, and low value-added products.
Two-stage strategy with a series of policy and action plans for each strategy
in each stage was then recommended. In the first stage or the restructuring phase,
which is from 2007 to the year 2014, it will be important strategy to intensify forest
plantation, increase productivity of forest plantation, combat forest crimes, develop
alternative sources of timber supply, optimize industrial log distribution, improve
utilization of natural production forest, monitor operations of wood processing
industry, invest in new wood processing technology for efficiency and waste
reduction, reduce production cost of wood products, enhance wood products image
in international market, facilitate development of wood industry clustering, find new
market and sustain traditional market of wood products, invest in secondary wood
2 In reference to: (1) Restructuring and Revitalization of Indonesia’s Wood-Based Industry: Synthesis of Three Major Studies. T. H. Brown, B. C. H. Simangunsong, D. Sukadri, D. W. Brown, Subarudi S., A. Dermawan, Rufi'ie. Ministry of Forestry, CIFOR, and DFID-MFP. Jakarta. November 2005; (2) Revitalization of Indonesia’s Forest Industry: A Supply Side Analysis. 2006. B. C. H. Simangunsong. Paper prepared for the World Bank; and (3) Revitalization of Indonesia’s Forest Industry: A Demand Side Analysis. 2007. B. C. H. Simangunsong. Paper prepared for the World Bank.
22

processing technology, and diversify wood products. This first stage focuses on
demand management and supply enhancement and sets the stage for the
revitalization phase. Issues, target and strategies in the restructuring phase are
shown in Table 7.
Several strategies chosen in the first stage need to be continued in the
second stage, the revitalization phase, in addition to strategies that take advantage
of different timber supplies, different processing technologies, and different end
products for different end markets. Those important strategies are to: intensify
forest plantation, primarily for saw logs/veneer logs production; increase
productivity of forest plantation, broaden utilization of alternative timber supply
sources; broaden implementation of Intensive Silvicultural System (SILIN) in the
natural production forest; continue investment in new wood processing technology
for efficiency and waste reduction; broaden wood industry clustering; continue
production cost reduction; continue enhancement of wood products image in
international market; broaden foreign market and sustaining traditional market of
wood products; penetrate potential market; invest in secondary wood processing
technology; and continue wood products diversification. Issues, target and
strategies in the revitalization phase are shown in Table 8.
Table 7. Issues, Target, and Strategy in the Restructuring Phase (2007-2014)
Issues Target Strategy
Increase productivity of forest plantationCombat forest crimes
Optimize industrial log distributionImprove utilization of natural production forest
Reduce production cost of wood products Enhance wood products image in international marketFacilitate development of wood industry clustering
Invest in secondary wood processing technologyDiversify wood products
A
ansu
Lo
huge gap between industrial demand for timber
d the legal sustainable pply
The legal sustainable log supply is sufficient
Intensify forest plantation
Develope alternative sources of timber supply
Over capacity A production level of wood products is based on legal sustainable log supply Monitor operations of wood processing industry
Declining in competitiveness Wood products is highly competitive
Inefficient in wood processing industry Wood processing industry operates efficiently Invest in new wood processing technology for efficiency and waste
reduction
Declining in market share Market share of wood products is restored and even increase Find new market and sustain traditional market of wood products
w value-added products Production focuses on high value-added wood products
23

24
Issues Target Strategy
Increase productivity of forest plantation
Broaden wood industry clusteringContinue production cost reduction
Penetrate potential marketInvest in secondary wood processing technologyContinue wood products diversification
Log deficit Broaden utilization of alternative timber supply sources
Intensify forest plantation, primariy for sawlogs/veneer logs production
Broaden implementation of SILIN in the natural production forest
The legal sustainable log supply increases and mostly comes from forest plantation
non-significantly increase in market share
Market share of wood products is significantly in the increase
Broaden foreign market and sustaining traditional market of wood products
value-added products Production focuses on high value-added wood products
Continue investment in new wood processing technology for efficiency and waste reduction
Continue enhancement of wood products image in international market
Wood products is highly competitiveeclining in competitiveness
nefficient in wood processing industry Wood processing industry operates efficiently
Series of policy and action plans for each strategy in each stage were
recommended and showed in detail in Tables 9 and 10. One or several indicators
were also developed and involved parties were also identified for each action plan.
Nevertheless, there are several enabling conditions that are needed to be
considered such as: good political will of the government, national stewardship,
land tenure and use security, good forest governance, and existence of economic
institutions. Implications of these chosen strategies are temporarily decrease in
output and labour force level so that coordination and collaborations amongs
related ministries or departments are a must. On the other hand, these chosen
strategies reduce pressure to natural forest utilization and give more space to
health and efficient wood-based companies to operate.
Low
A
D
I
Table 8. Issues, Target, and Strategy in the Revitalization Phase (2015-2025)

Table 9. Strategy, Policy, and Action Plan in the Restructuring Phase (2007-2014)
Strategy Policy Recom m ended Action Plan
Optim ize function of province/district "tim lahan" Accelerating infrastructure developm ent Integrate forest plantation establishm ent with regional development
Expedite license perm it processes of forest plantation developm ent
Broaden com m unity acces to financial capital
Optim ize seed centre capacityProviding database on forestland suitability Integrate and up-grade forestland suitability databaseCom batting illegal logging Im prove integration in combatting illegal loggingCom batting illegal trade Im prove integration in combatting illegal trade
Build wood term inals in industrial centres area
Im plement docum ent issued by crops estate as legal ‘skau’ docum ent
O ptim ize industrial log distribution Regulating industrial logs distribution Make G IS based database/inform ation system on potential and distribution
of wood resources
Dissem inate logs produced from crops replanting as alternative raw materials for wood industry
Utilizing logs produced from crops replanting
Perfecting utilization of logs produced from com m unity forest
Develope alternative sources of tim ber supply
Revise Perm enhut. No. P 51 /2006
Combat forest crimesElim inating high cost econom y
Dissem inate and im plement Permenhut 55 to law enforcer about tim ber legalityIm pose FAKB for certain conditions m aximum 1.5 times of norm al period tim e
Im proving law enforcem entFunction the existance of PPNS in wood forest products circulation
Harm onize overlapped regulations, particularly regulations that are related with wood forest product circulation, retribution, and levy
Increase productivity of forest plantation
Utilizing high quality seedlingsProvide tree im provement technology and silviculture tehnique through establishm ent of integrated research centre
Intensify forest plantation
Speeding-up creation of Forestry District Management Unit (KPH)
Expeditely issue related regulations and coordinate it with province/district governm ent
Sim plifying license perm it processes of forest plantation developm ent Affirm land use security of IUPHHK – HT
Im plem enting forest plantation certification Promote and facilitate system of forest plantation certification developed by national initiative
Creating tenurial conflict m echanism s and facilitating its resolutions after KPH is built Optim ize function of province/district "tim lahan"
Providing alternative financial assistance for developing HTR
Expedite establishm ent of technical organizer BPPH
25

Table 9. Strategy, Policy, and Action Plan in the Restructuring Phase (2007-2014; Continued)
Strategy Policy Recom m ended Action Plan
Expediting annual a llowable cut (JPT) determ ination Expedite issuance of RKT and heavy equipm ents procurem ent perm its
C lose down wood com panies that are consum ed illegal logsC lose down illegal wood com paniesControl issuance of new wood com pany perm itsFacilitate wood com pany w ith acces to finance institutions or capita l
Build container ports in exported product centre areas
Map out distribution of wood resources in each district
Support establishm ent of dom estic wood processed m achines industryRetooling m achines and equipm ents of wood industry
Invest in new wood processing technology for effic iency and waste reduction
Replacing old and ineffic ient m achines and equipm ents Expedite a process and assist a com pany to get perm it for replacing old
and ineffic ient m achines and equipm entsProvide technical assistance, prim arily to UKM, for replacing old and inefficient m achines and equipm ents
Facilitate developm ent of wood industry clustering
Establishing integrated prim ary and secondary wood processing industry
Accelerate developm ent of wood industry clustering in districts and provinces
Develop wood industry based on a specific district/province
Enhance wood products im age in international m arket Prom oting wood products regularly Integrate wood products prom otion and intensify public re lation
Reduce production cost of wood products
Establishing transportation infrastructures Build transportation infrastructure from wooud resources to wood industria l centres and then to ports
Im proving processing productivity Provide trainings for m achine operators, supervisors, m anagem ents, product designers
Reviewing im port regulations of sam ple and exhibition products Reduce or elim inate im port tariff of sam ple and exhibition products
Conducting energy diversifaction for effic iency Support utilization of low-cost energy such as bio-diesel and coal
E lim inating transaction costs Revise governm ent regulations on com pany operational perm its
Curbing prim ary wood industry w ithout RPBBI
Im prove utilization of natural production forest
Im proving SILIN im plem entation in the natural production forest
Accelerate SILIN im plem entation and its incentive m echanism in the natural production forest
U tilizing log waste of natural forest harvesting Review stum page levy and forest tax polic ies
Monitor operations of wood processing industry
Prohibiting illegal logs consum ption Conduct an effective log audit by independent th ird party
Support im plem entation of chain of custody for wood products legalityIm plem enting chain of custody
26

Table 9. Strategy, Policy, and Action Plan in the Restructuring Phase (2007-2014; Continued)
Strategy Policy Recommended Action PlanStandardize wood products
Conduct roadshows of wood products
Reduce or remove import tariff of machine and equipment capital
Facilitate wood company with acces to finance institutions or capital
Provide incentives to the wood company, which conducts research and development, in marketing of its new wood products
Develop wood industry and wood products design centres collaborations
Facilitate the wood company, which conducts research and development, to obtain a patent of its new wood products
Diversify wood products Stimulating research and development in wood industry
Invest in secondary wood processing technology
Providing financial incentives for machines and equpments procurement
Give financial incentive such as low lending rate for importing machine and equipment capital
Improving labor skills
Provide trainings for machine operators, supervisors, managements, product designers
Establish educational institutions that produce certified skilled labour in secondary wood processed production
Collaborate with forest industry associations and NGO's on regional and international wood products marketingStrengthen national forest industry associations role at regional and international level to promote and market Indonesian wood products
Lobby major country export destinations
Negotiate import tariffs of wood products in trade pact forum such as APEC
Conduct market researches and benchmarking of Indonesia wood products with its competitors
Find new market and sustain traditional market of wood products
Enlarging domestic market
Dealing with tariff and non-tariff barriers in international trade of wood products
Campaign to use domestically produced wood products
Provide information of imported wood products for domestic consumers protection
Intensify wood products promotion to foreign market
Lobby traditional foreign markets such as Japan, United States, European Union
27
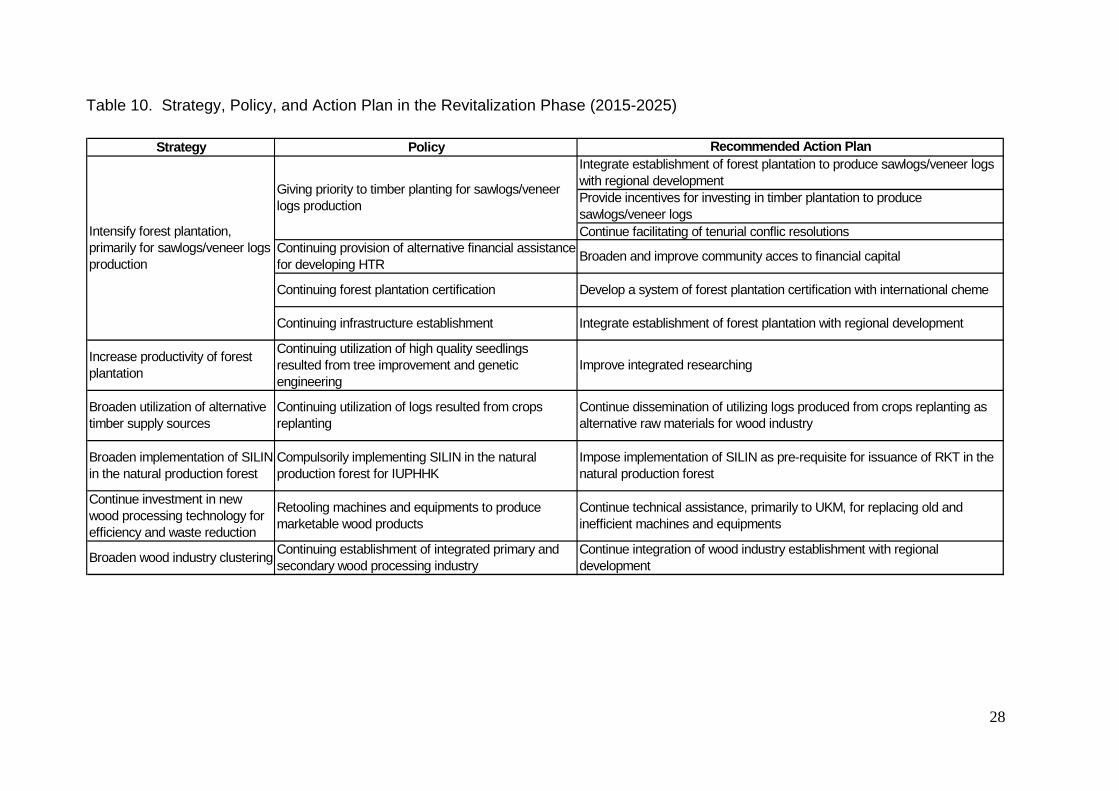
Table 10. Strategy, Policy, and Action Plan in the Revitalization Phase (2015-2025)
Strategy Policy Recommended Action Plan
Continue facilitating of tenurial conflic resolutions
Continue investment in new wood processing technology for efficiency and waste reduction
Retooling machines and equipments to produce marketable wood products
Continue technical assistance, primarily to UKM, for replacing old and inefficient machines and equipments
Broaden wood industry clustering Continuing establishment of integrated primary and secondary wood processing industry
Continue integration of wood industry establishment with regional development
Broaden utilization of alternative timber supply sources
Continuing utilization of logs resulted from crops replanting
Continue dissemination of utilizing logs produced from crops replanting as alternative raw materials for wood industry
Broaden implementation of SILIN in the natural production forest
Compulsorily implementing SILIN in the natural production forest for IUPHHK
Impose implementation of SILIN as pre-requisite for issuance of RKT in the natural production forest
Develop a system of forest plantation certification with international cheme
Continuing infrastructure establishment Integrate establishment of forest plantation with regional development
Increase productivity of forest plantation
Continuing utilization of high quality seedlings resulted from tree improvement and genetic engineering
Improve integrated researching
Intensify forest plantation, primarily for sawlogs/veneer logs production
Giving priority to timber planting for sawlogs/veneer logs production
Integrate establishment of forest plantation to produce sawlogs/veneer logs with regional developmentProvide incentives for investing in timber plantation to produce sawlogs/veneer logs
Continuing provision of alternative financial assistance for developing HTR Broaden and improve community acces to financial capital
Continuing forest plantation certification
28

29
Contdiversi
Penetrate
Invest iprocessi
Contproducts imark
Broaden foreisustaiwood prod
Contreducti
Table 10. Strategy, Policy, and Action Plan in the Revitalization Phase (2015-2025; Continued)
Strategy Policy Recommended Action Plan
Build container ports in exported product centre areas
Continue roadshows of special quality wood productsContinue lobbying country export destinations
Reduce or remove import tariff of machine and equipment capital
Protect wood products patent
inue wood products fication
Stimulating research and development in wood industry
Provide incentives to the wood company, which conducts research and development
Develop wood industry and wood products design centres collaborations
Comply with wood product standard of market destinations
potential market Developing marketable wood products Develop new marketable wood products
n secondary wood ng technology
Continuing labor skills improvement Provide trainings for machine operators, supervisors, managements, product designers
inue enhancement of wood mage in international
et Promoting wood products regularly Continue integrated promotion of wood products and intensive public relation
gn market and ning traditional market of
ucts
Continuing intensive wood products promotion to foreign market Continue market researches and benchmarking of Indonesia wood products
with its competitorsDealing with tariff and non-tariff barriers in international trade of wood products Continue wood products certification
inue production cost on
Eliminating transaction costs Continue illegal levy elimination
Improving processing productivity Continue machine operators, supervisors, and managements trainings
Give financial incentive such as low lending rate for importing machine and equipment capital
Facilitate wood company with acces to finance institutions or capital
Providing financial assistance for machines and equpments procurement of secondary wood processing industry
Continue implementation of chain of custody for wood products legalityContinuing chain of custody implementation
Build transportation infrastructure from wood industrial centres and then to ports
Establishing transportation infrastructures
VII. SUMMARY
Based on current world’s demand and its trend, shares of Indonesia’s bio
composite product imports of total bio composite product imports in each major
country destination as reported by importer countries and considering the principal
policies and market forces that are likely to affect the global and regional markets,
both plywood and medium density fibreboard made from small diameter log would
be plausible to be developed for international market (i.e. Japan, China, the
Republic of Korea, Taiwan, Saudi Arabia, and United Arab Emirates) as well as for
domestic market. Meanwhile, veneer sheets and particleboard made from small
diameter log would be plausible to be developed for domestic market.
To realize those potential future markets, Indonesia needs to restructure and
revitalize its forest industry. This must involve all stakeholders in order to
implement the selected strategies explained in Chapter VI. Coordination and
cooperation from several ministries and departments is also absolutely vital. On
the other side, these strategies will reduce pressure on natural forests and at the
same time provide room for efficient wood composite companies to operate.
30

31
REFERENCES BPS. 2003. Economic Indicators. Various months. BPS-Statistics of Indonesia.
Jakarta FAO. 2008. FAOSTAT Database home page (http://www.fao.org/). Food And
Agriculture Organization of the United Nations, Rome. ITTO. 2007. Annual Review and Assessment of the World Timber Situation 2007.
Division of Economic Information and Market Intelligence, ITTO. Yokohama, Japan.
ITTO. 2006. Annual Review and Assessment of the World Timber Situation 2007. Division of Economic Information and Market Intelligence, ITTO. Yokohama, Japan.
MOF. Various years. Strategic forestry data: An executive report. Forest Planning Agency, Ministry of Forestry of the Republic of Indonesia. Jakarta.
MOF. Various years. Forest statistics. Directorate General of Forestry Production Management, Ministry of Forestry, .of the Republic of Indonesia. Jakarta.
MOF. 2007. A Road Map for the Revitalization of Indonesia’s Forest Industry. The Forest Industry Revitalization In-house Expert Working Group- Ministry of Forestry, Jakarta.
UNECE/FAO. 2007. Forest Products Annual Market Review, 2006-2007. Geneva Timber and Forest Study Paper 22. United Nations. New York and Geneva.
UNECE/FAO. 2006. Forest Products Annual Market Review, 2005-2006. Geneva Timber and Forest Study Paper 21. United Nations. New York and Geneva.
UNECE/FAO. 2005. Forest Products Annual Market Review, 2004-2005. Timber Bulletin-Volume LVIII (2005). United Nations. Geneva.
UNECE/FAO. 2004. Forest Products Annual Market Review, 2003-2004. Timber Bulletin-Volume LVII (2004), No.3. United Nations. Geneva.
UNECE/FAO. 2003. Forest Products Annual Market Analysis, 2002-2004. Timber Bulletin-Volume LVI (2003), No.3. United Nations. Geneva.
Tissari, J., A. Schuler and C. Adair. 2003. Value-Added Products Market, 2001-2003. Geneva Timber and Discussion Paper 36. UNECE/FAO-United Nations. Geneva.

Appendix 1. Production, export, and import of plywood in major consumer countries, 2002-2006
United States of America 15.3 14.9 14.8 14.4 13.7 0.5 0.5 0.5 0.5 0.5 3.9 4.2 5.9 6.2 6.1China 12.2 21.8 21.8 26.0 28.1 2.1 2.4 4.6 6.2 7.8 1.7 1.8 1.8 2.0 1.8Japan 2.7 3.0 3.1 3.2 3.3 0.0 0.0 0.0 0.0 0.0 5.1 4.2 5.1 4.7 5.0Korea, Republic of 0.9 0.9 0.8 0.7 0.7 0.0 0.0 0.1 0.0 0.0 1.3 1.4 1.2 1.2 1.3India 1.6 1.8 1.9 2.1 2.1 0.0 0.0 0.1 0.1 0.1 0.0 0.0 0.0 0.0 0.0Canada 2.2 2.2 2.3 2.3 2.3 1.1 1.0 1.0 1.1 0.9 0.5 0.5 0.4 0.7 0.8United Kingdom 0.0 0.0 0.0 0.0 0.0 0.1 0.1 0.1 0.1 0.1 1.3 1.3 1.5 1.5 1.5Germany 0.3 0.2 0.3 0.2 0.2 0.2 0.2 0.3 0.3 0.3 0.9 1.1 1.2 1.1 1.2Brazil 2.7 3.2 3.8 3.7 3.7 1.9 2.4 3.0 2.8 1.9 0.0 0.0 0.0 0.0 0.0Indonesia 7.6 6.1 4.5 4.5 3.8 5.8 5.1 4.0 3.4 3.1 0.0 0.0 0.0 0.0 0.0Russian Federation 1.8 2.0 2.2 2.6 2.6 1.2 1.2 1.4 1.5 1.6 0.0 0.0 0.0 0.1 0.0Italy 0.5 0.5 0.5 0.4 0.3 0.2 0.2 0.2 0.1 0.2 0.6 0.6 0.6 0.5 0.6Mexico 0.2 0.2 0.2 0.1 0.0 0.0 0.0 0.0 0.0 0.0 0.4 0.5 0.8 0.8 0.8France 0.5 0.4 0.4 0.4 0.4 0.2 0.2 0.2 0.2 0.2 0.3 0.4 0.4 0.4 0.4Malaysia 4.3 4.8 4.7 5.0 5.4 3.6 4.0 4.3 4.5 5.0 0.0 0.0 0.0 0.0 0.1Netherlands 0.0 0.0 0.0 0.0 0.0 0.0 0.0 0.0 0.0 0.1 0.5 0.5 0.5 0.5 0.6Spain 0.4 0.4 0.4 0.6 0.5 0.1 0.1 0.1 0.1 0.1 0.1 0.1 0.1 0.1 0.2Singapore 0.3 0.3 0.3 0.3 0.3 0.1 0.1 0.1 0.1 0.1 0.3 0.3 0.3 0.3 0.3Philippines 0.4 0.4 0.4 0.3 0.3 0.0 0.0 0.0 0.0 0.0 0.0 0.0 0.0 0.1 0.1Australia 0.2 0.2 0.1 0.2 0.1 0.0 0.0 0.0 0.0 0.0 0.1 0.2 0.2 0.2 0.2
Total 53.9 63.3 62.8 67.0 67.9 17.1 17.5 20.2 21.2 22.0 17.2 17.3 20.1 20.5 21.1World 59.3 68.8 68.6 73.2 74.3 20.7 21.5 24.5 25.7 26.7 20.8 21.8 24.3 24.7 25.7
Major ConsumersProduction (million m3) Exports (million m3) Imports (million m3)
2005 2006 2002 2003 2004 20052004 2005 2006 2002 2003 20042002 2003 2006
32

Appendix 2. Production, export, and import of veneer sheets in major consumer countries, 2002-2006
China 0.8 3.1 3.1 3.1 3.2 0.2 0.2 0.2 0.2 0.1 0.5 0.4 0.4 0.4 0.4Korea, Republic of 0.7 0.7 0.6 0.6 0.6 0.0 0.0 0.0 0.0 0.0 0.4 0.3 0.3 0.3 0.3Italy 0.5 0.5 0.5 0.5 0.5 0.0 0.0 0.0 0.0 0.0 0.2 0.2 0.2 0.2 0.2United States of America 0.4 0.4 0.4 0.4 0.4 1.1 1.1 1.2 0.4 0.4 1.4 1.3 1.7 0.5 0.3New Zealand 0.6 0.6 0.7 0.7 0.7 0.1 0.1 0.1 0.1 0.2 0.0 0.0 0.0 0.0 0.0Brazil 0.6 0.6 0.6 0.6 0.6 0.1 0.1 0.1 0.2 0.2 0.0 0.0 0.0 0.0 0.0Indonesia 0.0 0.3 0.2 1.0 1.0 0.0 0.0 0.1 0.0 0.0 0.0 0.0 0.0 0.0 0.0Germany 0.4 0.4 0.4 0.4 0.4 0.1 0.1 0.1 0.1 0.1 0.2 0.2 0.2 0.2 0.2Philippines 0.2 0.3 0.4 0.1 0.1 0.0 0.0 0.0 0.0 0.0 0.1 0.1 0.1 0.1 0.1Malaysia 0.7 0.6 0.6 0.7 0.6 0.6 0.5 0.4 0.4 0.3 0.2 0.1 0.1 0.0 0.1India 0.2 0.2 0.3 0.3 0.3 0.0 0.0 0.0 0.0 0.0 0.0 0.0 0.0 0.0 0.0France 0.1 0.1 0.1 0.1 0.1 0.1 0.1 0.0 0.0 0.0 0.1 0.1 0.2 0.2 0.2Pakistan 0.1 0.1 0.2 0.2 0.2 0.0 0.0 0.0 0.0 0.0 0.0 0.0 0.0 0.0 0.0Ghana 0.3 0.3 0.3 0.3 0.2 0.1 0.1 0.1 0.1 0.1 0.0 0.0 0.0 0.0 0.0Japan 0.1 0.1 0.1 0.1 0.1 0.0 0.0 0.0 0.0 0.0 0.1 0.1 0.1 0.1 0.1Spain 0.1 0.1 0.1 0.1 0.1 0.0 0.0 0.0 0.0 0.0 0.1 0.1 0.1 0.2 0.2Russian Federation 0.1 0.1 0.2 0.2 0.2 0.0 0.0 0.0 0.0 0.0 0.0 0.0 0.0 0.0 0.0Canada 0.7 0.7 0.9 0.9 0.8 0.9 0.8 1.0 1.0 1.0 0.3 0.2 0.3 0.3 0.3Denmark 0.0 0.0 0.0 0.0 0.0 0.0 0.0 0.0 0.0 0.0 0.1 0.1 0.1 0.1 0.1Poland 0.1 0.1 0.1 0.1 0.1 0.0 0.0 0.0 0.0 0.0 0.0 0.0 0.0 0.0 0.0Ecuador 0.1 0.1 0.1 0.1 0.1 0.0 0.0 0.0 0.0 0.0 0.0 0.0 0.0 0.0 0.0South Africa 0.1 0.1 0.1 0.0 0.1 0.0 0.0 0.0 0.0 0.0 0.0 0.0 0.0 0.0 0.0Singapore 0.1 0.1 0.1 0.1 0.1 0.0 0.0 0.0 0.0 0.0 0.0 0.0 0.0 0.0 0.0Turkey 0.1 0.1 0.1 0.1 0.1 0.0 0.0 0.0 0.0 0.0 0.0 0.0 0.0 0.0 0.0Côte d'Ivoire 0.2 0.2 0.2 0.2 0.2 0.2 0.1 0.2 0.2 0.2 0.0 0.0 0.0 0.0 0.0Ethiopia 0.1 0.1 0.1 0.1 0.1 0.0 0.0 0.0 0.0 0.0 0.0 0.0 0.0 0.0 0.0Slovenia 0.1 0.1 0.0 0.1 0.1 0.0 0.0 0.0 0.0 0.0 0.0 0.0 0.0 0.0 0.0Belgium 0.1 0.0 0.0 0.0 0.0 0.0 0.0 0.0 0.0 0.0 0.0 0.0 0.0 0.0 0.0
Total 7.4 10.0 10.2 10.9 10.6 3.6 3.4 3.8 3.1 2.8 3.7 3.5 3.9 2.7 2.4World 8.5 11.0 11.3 12.2 12.0 4.2 4.1 4.6 4.0 3.8 4.2 4.1 4.6 3.6 3.3
2002 2003 2004 20052004 2005 2006 2002 2003 2004Major ConsumersProduction (million m3) Exports (million m3) Imports (million m3)
2002 20062005 20062003
33

Appendix 3. Production, export, and import of particleboard in major consumer countries, 2002-2006
United States of America 18.9 20.8 21.8 22.2 21.9 0.7 0.6 0.6 0.5 0.5 9.0 9.6 10.2 10.7 10.2Germany 8.7 9.3 10.6 10.9 10.8 2.5 2.6 3.2 3.5 3.5 1.5 1.5 1.6 1.7 1.8China 3.8 5.6 6.5 5.8 8.5 0.2 0.1 0.2 0.1 0.1 1.0 1.0 1.0 1.0 1.1Russian Federation 2.7 3.2 3.6 3.9 4.6 0.1 0.2 0.2 0.2 0.3 0.4 0.6 0.6 0.6 1.3Poland 3.1 3.7 4.1 3.9 4.5 0.7 0.9 0.9 0.9 0.9 0.6 0.6 0.9 0.9 1.0Italy 3.3 3.4 3.7 3.5 3.7 0.5 0.3 0.4 0.4 0.5 0.7 0.6 0.7 0.7 0.6United Kingdom 2.4 2.5 2.7 2.6 2.6 0.2 0.3 0.2 0.2 0.2 1.4 1.2 1.3 1.1 1.0Spain 3.5 3.2 3.2 3.2 3.3 0.4 0.3 0.4 0.4 0.5 0.6 0.6 0.8 0.7 0.7France 3.8 3.9 4.4 4.6 4.8 1.4 1.4 1.6 2.0 2.4 0.6 0.7 0.7 0.8 0.8Canada 11.3 11.6 11.3 12.5 13.7 8.8 9.2 9.8 9.8 9.7 0.7 0.4 0.4 0.5 0.9Turkey 2.0 2.3 2.7 2.9 2.8 0.1 0.1 0.2 0.3 0.2 0.1 0.2 0.3 0.3 0.2Brazil 1.9 2.1 2.4 2.3 2.5 0.0 0.0 0.0 0.1 0.2 0.0 0.1 0.1 0.1 0.1Korea, Republic of 0.7 0.8 0.9 0.8 0.8 0.0 0.0 0.0 0.0 0.0 0.9 0.7 0.9 0.8 1.0Japan 1.2 1.2 1.2 1.2 1.2 0.0 0.0 0.0 0.0 0.0 0.4 0.4 0.5 0.4 0.5Denmark 0.3 0.4 0.4 0.3 0.3 0.0 0.0 0.0 0.0 0.0 0.6 0.7 0.8 0.9 0.9Australia 1.0 1.0 1.0 0.9 1.0 0.0 0.0 0.0 0.0 0.0 0.1 0.1 0.1 0.0 0.1Ukraine 0.5 0.7 1.0 1.2 1.3 0.1 0.1 0.7 0.2 0.2 0.3 0.4 0.3 0.3 0.3Austria 2.4 2.4 2.4 2.4 2.4 1.7 1.8 1.8 1.9 1.9 0.2 0.3 0.3 0.4 0.4Sweden 0.6 0.5 0.4 0.5 0.5 0.1 0.1 0.1 0.1 0.1 0.3 0.4 0.5 0.5 0.6Greece 0.8 0.8 0.8 0.8 0.8 0.1 0.1 0.2 0.2 0.1 0.0 0.1 0.1 0.1 0.2Belgium 2.5 2.3 2.2 2.4 2.3 2.0 1.9 1.8 1.7 1.8 0.3 0.3 0.3 0.3 0.4Czech Republic 0.9 1.1 1.1 1.2 1.2 0.5 0.5 0.6 0.6 0.8 0.3 0.2 0.2 0.3 0.3South Africa 0.7 0.7 0.7 0.4 0.5 0.0 0.0 0.0 0.0 0.0 0.0 0.0 0.0 0.0 0.1Iran, Islamic Rep of 0.5 0.5 0.6 0.7 0.6 0.0 0.0 0.0 0.0 0.0 0.0 0.0 0.0 0.0 0.0Romania 0.1 0.4 0.5 0.5 0.7 0.1 0.2 0.3 0.2 0.3 0.3 0.3 0.4 0.4 0.4Netherlands 0.0 0.0 0.0 0.0 0.0 0.1 0.1 0.1 0.1 0.1 0.6 0.6 0.6 0.7 0.8Hungary 0.5 0.5 0.5 0.6 0.6 0.2 0.3 0.3 0.4 0.3 0.3 0.2 0.3 0.3 0.2
Total 78.2 84.9 90.7 92.3 98.2 20.5 21.2 23.6 23.7 24.8 21.4 21.7 23.7 24.5 25.7World 85.8 92.1 98.4 100.6 106.3 24.3 25.5 28.7 29.4 31.1 24.1 25.1 28.6 29.1 30.7
2002 2003 2004 2005 2006 2002Major ConsumersProduction (million m3) Exports (million m3) Imports (million m3)
2002 2003 2004 2005 2006 2003 2004 2005 2006
34
Appendix 4. Production, export, and import of fibreboard in major consumer countries, 2002-2006
China 7.6 11.2 15.3 20.6 24.1 0.3 0.3 0.5 1.2 1.7 2.5 2.6 2.3 2.0 1.7United States of America 6.4 6.7 7.5 7.7 7.9 0.5 0.5 0.6 0.7 0.8 2.5 2.7 3.2 3.3 3.3Germany 4.3 4.7 5.1 5.5 5.9 3.0 3.1 3.4 3.8 3.6 1.2 1.2 1.2 1.2 1.0Korea, Republic of 1.2 1.3 1.6 1.7 1.7 0.1 0.1 0.1 0.0 0.0 0.8 0.6 0.3 0.4 0.5United Kingdom 0.8 0.8 0.9 0.8 0.9 0.2 0.2 0.2 0.2 0.2 1.0 1.0 1.0 0.9 0.8Brazil 1.4 1.7 1.7 2.0 2.3 0.4 0.5 0.6 0.5 0.5 0.0 0.1 0.1 0.3 0.3Turkey 0.6 0.8 1.0 1.7 2.1 0.1 0.2 0.2 0.2 0.3 0.2 0.2 0.4 0.7 0.5Japan 0.9 0.9 0.9 0.9 0.9 0.0 0.0 0.0 0.0 0.0 0.7 0.7 0.7 0.8 0.0Italy 1.3 1.0 1.1 1.2 1.2 0.7 0.4 0.5 0.3 0.3 0.7 0.7 0.7 0.7 0.7Poland 1.5 1.7 1.9 2.3 2.4 0.7 0.9 1.2 1.2 1.0 0.3 0.4 0.4 0.4 0.4Russian Federation 1.0 1.1 1.2 1.3 1.3 0.2 0.3 0.3 0.4 0.4 0.2 0.3 0.4 0.5 0.6Canada 2.0 2.0 2.1 1.9 1.9 1.4 1.7 1.6 1.5 1.4 0.4 0.5 0.6 0.7 0.7Spain 1.1 1.2 1.2 1.2 1.2 1.0 0.8 1.0 0.9 0.7 0.6 0.6 0.6 0.7 0.8Belgium 0.4 0.4 0.4 0.4 0.4 0.5 0.5 0.5 0.5 0.5 0.7 0.8 0.9 1.0 1.0Mexico 0.1 0.1 0.1 0.1 0.1 0.0 0.0 0.0 0.0 0.0 0.2 0.5 0.6 0.6 0.8France 1.1 1.2 1.3 1.3 1.4 1.1 1.2 1.1 1.3 1.4 0.5 0.5 0.6 0.7 0.7Australia 0.7 0.8 0.8 0.8 0.8 0.4 0.4 0.4 0.5 0.4 0.1 0.1 0.1 0.1 0.1Syrian Arab Republic 0.0 0.0 0.0 0.0 0.0 0.0 0.0 0.0 0.0 0.0 0.2 0.4 0.6 0.6 0.3Austria 0.8 0.8 0.8 0.8 0.7 0.6 0.6 0.6 0.6 0.6 0.2 0.2 0.2 0.2 0.2Sweden 0.2 0.2 0.2 0.2 0.2 0.1 0.0 0.0 0.0 0.0 0.2 0.2 0.2 0.2 0.3Iran, Islamic Rep of 0.0 0.0 0.1 0.0 0.1 0.0 0.0 0.0 0.0 0.0 0.1 0.3 0.4 0.3 0.3Malaysia 1.2 1.2 1.5 1.4 1.5 1.1 1.1 1.1 1.2 1.3 0.1 0.0 0.1 0.1 0.1Netherlands 0.0 0.0 0.0 0.0 0.0 0.1 0.1 0.1 0.2 0.2 0.4 0.4 0.4 0.4 0.5Ukraine 0.2 0.1 0.1 0.1 0.1 0.1 0.1 0.1 0.1 0.0 0.1 0.2 0.2 0.3 0.3
Total 34.8 39.9 46.7 54.1 59.1 12.5 12.9 14.1 15.2 15.4 13.9 15.1 16.3 16.9 15.8World 41.1 47.0 54.5 61.9 67.5 16.9 17.6 19.9 21.6 21.6 17.3 18.9 21.5 22.4 21.9
2004Major ConsumersProduction (million m3) Exports (million m3) Imports (million m3)
2002 2003 20062005 2006 2002 2003 2004 20052004 2005 2006 2002 2003
35