market analysis, gross revenue projections - uss …uss-mass.org/documents/spectrum_market...
TRANSCRIPT

Market Analysis, Gross Gaming Revenue Projections: An Update
Prepared for the Massachusetts Legislature March 31, 2010

Massachusetts Gross Gaming Revenue Projections 2
Contents
INTRODUCTION ............................................................................................................................. 6
EXECUTIVE SUMMARY .................................................................................................................. 9
2008 TO 2010: WHAT HAS CHANGED .......................................................................................... 11
REGIONAL GAMING MARKET TRENDS ................................................................................................ 11 DEMOGRAPHIC AND ECONOMIC TRENDS ............................................................................................ 14
GROSS GAMING REVENUE MODELS ........................................................................................... 16
WHAT HAS NOT CHANGED .............................................................................................................. 16 WHAT HAS CHANGED IN THE MODELS ............................................................................................... 20
GROSS GAMING REVENUE PROJECTIONS, METHODOLOGY ....................................................22
HOTEL ROOMS .............................................................................................................................. 24 GROSS GAMING REVENUE PROJECTIONS ‐ PRIMARY PRESENTATION .................................. 26
MODERATE CASE GGR PROJECTIONS ................................................................................................. 27 LOW CASE GGR PROJECTIONS .......................................................................................................... 31 HIGH CASE GGR PROJECTIONS .......................................................................................................... 34
GROSS GAMING REVENUE PROJECTIONS – SECONDARY PRESENTATION ............................ 38
MODERATE CASE GGR PROJECTIONS ................................................................................................. 40 LOW CASE GGR PROJECTIONS .......................................................................................................... 44 HIGH CASE GGR PROJECTIONS .......................................................................................................... 47
GROSS GAMING REVENUE PROJECTIONS – ALTERNATE PRESENTATION ............................. 50
SHARE(S) OF MARKET ..................................................................................................................... 50 SIZING OF THE CASINOS ................................................................................................................... 52 GGR SUMMARY FOR ALTERNATE PRESENTATION ................................................................................. 53 MODERATE CASE GGR PROJECTIONS ................................................................................................. 54 LOW CASE GGR PROJECTIONS .......................................................................................................... 58 HIGH CASE GGR PROJECTIONS .......................................................................................................... 61 SENSITIVITY ANALYSIS BASED ON CHANGES TO REGION ONE SHARE OF VISITATION...................................... 64
RECAPTURE OF MASSACHUSETTS GAMING DOLLARS ............................................................ 66
REASONABLENESS OF SPECTRUM’S GGR PROJECTIONS/MODELING .................................... 70
OUR MODELING APPLIED TO FOXWOODS AND MOHEGAN SUN IN CT ....................................................... 70 GGR PROJECTIONS FOR MA COMPARED TO EASTERN PA RESULTS ........................................................... 72 GGR PROJECTIONS FOR NORTHEAST MA FACILITY COMPARED TO OTHER REGIONAL FACILITIES AND LOCATIONS 73
QUALITATIVE, CAPITAL EXPENSE CONSIDERATIONS ............................................................... 75
ABOUT THIS REPORT ................................................................................................................... 77
DISCLAIMER .................................................................................................................................. 77

Massachusetts Gross Gaming Revenue Projections 3
Figures Figure 1: GGR Summary per Primary Presentation, 2016 at moderate case .................................. 9 Figure 2: Slot revenue annual trends in $millions: ....................................................................... 11 Figure 3: Slot revenue annual trends in $millions: ....................................................................... 12 Figure 4: Slot revenue annual trends in $millions: ....................................................................... 12 Figure 5: Slot revenue annual trends in $millions: ....................................................................... 13 Figure 6: Massachusetts current competitive slot market statistics: ........................................... 13 Figure 7: Recent comparable market average win‐per‐unit figures: ............................................ 14 Figure 8: Total market region projected population growth: ....................................................... 14 Figure 9: The personal consumption expenditure price index: .................................................... 15 Figure 10: Map of Massachusetts gaming regions and approximate casino locations: ................ 16 Figure 11: Region One (northeast), drive‐time area, and approximate casino locations: ............ 17 Figure 12: Region Two (southeast), drive‐time area, and approximate casino locations: ........... 18 Figure 13: Region Three (west), drive‐time area, and approximate casino locations: ................. 19 Figure 14: MA gaming regions, drive‐time areas, and approximate casino locations: ................. 20 Figure 15: Projected GGR differences, 2010 vs. 2008 reports ....................................................... 22 Figure 16: Revenue modeling assumptions and sources .............................................................. 23 Figure 17: Range of potential Massachusetts GGR from hotel rooms ($M, except per room): ... 25 Figure 18: Moderate case GGR projections, comparative for current vs. 2008 report ................. 26 Figure 19: Low case GGR projections, comparative for current vs. 2008 report .......................... 27 Figure 20: High case GGR projections, comparative for current vs. 2008 report .......................... 27 Figure 21: Moderate case GGR projections, northeast MA location: ........................................... 28 Figure 22: Moderate case GGR projections, southeast MA location: ........................................... 28 Figure 23: Moderate case GGR projections, central/western MA location: ................................ 29 Figure 24: Moderate case GGR projections, statewide total: ....................................................... 29 Figure 25: Incremental destination visitation, moderate case: .................................................... 30 Figure 26: Grand total GGR projections, statewide, moderate case: ........................................... 30 Figure 27: Low case GGR projections, northeast MA location: .................................................... 31 Figure 28: Low case GGR projections, southeast MA location: .................................................... 32 Figure 29: Low case GGR projections, central/western MA location: .......................................... 32 Figure 30: Low case GGR projections, statewide total: ................................................................ 33 Figure 31: Incremental destination visitation, low case: .............................................................. 33 Figure 32: Grand total GGR projections, statewide, low case: ..................................................... 34 Figure 33: High case GGR projections, northeast MA location: .................................................... 34 Figure 34: High case GGR projections, southeast MA location: ................................................... 35 Figure 35: High case GGR projections, central/western MA location: ......................................... 35 Figure 36: High case GGR projections, statewide total: ............................................................... 36 Figure 37: Incremental destination visitation, high case: ............................................................. 36 Figure 38: Grand total GGR projections, statewide, high case: .................................................... 37 Figure 39: Adult Population figures – Primary vs. Secondary Scenarios ....................................... 38 Figure 40: Moderate case GGR projections, comparative for current vs. 2008 report ................. 39

Massachusetts Gross Gaming Revenue Projections 4
Figure 41: Low case GGR projections, comparative for current vs. 2008 report .......................... 39 Figure 42: High case GGR projections, comparative for current vs. 2008 report .......................... 40 Figure 43: Moderate case GGR projections, northeast MA location: ........................................... 40 Figure 44: Moderate case GGR projections, southeast MA location: ........................................... 41 Figure 45: Moderate case GGR projections, central/western MA location: ................................ 41 Figure 46: Moderate case GGR projections, statewide total: ....................................................... 42 Figure 47: Incremental destination visitation, moderate case: .................................................... 43 Figure 48: Grand total GGR projections, statewide, moderate case: ........................................... 43 Figure 49: Low case GGR projections, northeast MA location: .................................................... 44 Figure 50: Low case GGR projections, southeast MA location: .................................................... 44 Figure 51: Low case GGR projections, central/western MA location: .......................................... 45 Figure 52: Low case GGR projections, statewide total: ................................................................ 45 Figure 53: Incremental destination visitation, low case: .............................................................. 46 Figure 54: Grand total GGR projections, statewide, low case: ..................................................... 46 Figure 55: High case GGR projections, northeast MA location: .................................................... 47 Figure 56: High case GGR projections, southeast MA location: ................................................... 47 Figure 57: High case GGR projections, central/western MA location: ......................................... 48 Figure 58: High case GGR projections, statewide total: ............................................................... 48 Figure 59: Incremental destination visitation, high case: ............................................................. 49 Figure 60: Grand total GGR projections, statewide, high case: .................................................... 49 Figure 61: Massachusetts market shares from 2‐hour drive‐times: ............................................. 51 Figure 62: Competitors (2010): ..................................................................................................... 52 Figure 63: Moderate case GGR projections, comparative for current vs. 2008 report ................. 53 Figure 64: Low case GGR projections, comparative for current vs. 2008 report .......................... 54 Figure 65: High case GGR projections, comparative for current vs. 2008 report .......................... 54 Figure 66: Moderate case GGR projections, northeast MA location: ........................................... 55 Figure 67: Moderate case GGR projections, southeast MA location: ........................................... 55 Figure 68: Moderate case GGR projections, central/western MA location: ................................ 56 Figure 69: Moderate case GGR projections, statewide total: ....................................................... 56 Figure 70: Incremental destination visitation, moderate case: .................................................... 57 Figure 71: Grand total GGR projections, statewide, moderate case: ........................................... 57 Figure 72: Low case GGR projections, northeast MA location: .................................................... 58 Figure 73: Low case GGR projections, southeast MA location: .................................................... 59 Figure 74: Low case GGR projections, central/western MA location: .......................................... 59 Figure 75: Low case GGR projections, statewide total: ................................................................ 60 Figure 76: Incremental destination visitation, low case: .............................................................. 60 Figure 77: Grand total GGR projections, statewide, low case: ..................................................... 61 Figure 78: High case GGR projections, northeast MA location: .................................................... 61 Figure 79: High case GGR projections, southeast MA location: ................................................... 62 Figure 80: High case GGR projections, central/western MA location: ......................................... 62 Figure 81: High case GGR projections, statewide total: ............................................................... 63 Figure 82: Incremental destination visitation, high case: ............................................................. 63

Massachusetts Gross Gaming Revenue Projections 5
Figure 83: Grand total GGR projections, statewide, high case: .................................................... 64 Figure 84: GGR sensitivity based upon Region One share of visitation ......................................... 65 Figure 85: GGR taxes, sensitivity based upon Region One share of visitation .............................. 65 Figure 86: Prior method and current cross‐check of GGR outflow from Massachusetts: ............ 66 Figure 87: Moderate case GGR with estimate of MA in‐state recapture: .................................... 67 Figure 88: Low case GGR with estimate of MA in‐state recapture: .............................................. 67 Figure 89: High case GGR with estimate of MA in‐state recapture: ............................................. 68 Figure 90: CT and RI gaming drive‐time areas and casino locations: ........................................... 68 Figure 91: CT GGR Build‐up (2009) replicating Spectrum's Methodology for MA ........................ 70 Figure 92: Est. GGR for CT gaming facilities, FY 2005‐2009 ........................................................... 71 Figure 93: MA compared to eastern PA, size and population ....................................................... 72 Figure 94: MA 2016 projections vs. eastern PA 2009 results, GGR ............................................... 72 Figure 95: MA 2016 projections vs. eastern PA 2010 projected results, GGR ............................... 73 Figure 96: Historical capital investment and GGR for the New Jersey gaming industry ............... 76

Massachusetts Gross Gaming Revenue Projections 6
Introduction
The Massachusetts General Court (“Legislature”, “the client”) retained Spectrum Gaming Group (“Spectrum,” “we” or “our”) to assist the Legislature by conducting a Market Analysis and Gross Gaming Revenue Projections. Specifically, Spectrum has updated its 2008 Massachusetts gross gaming revenue estimates (as contained in its August 1, 2008, report "Projecting and Preparing for Potential Impact of Expanded Gaming on Commonwealth of Massachusetts” for Governor Deval Patrick).
The assumed locations of the potential gaming facilities in Massachusetts remain as they were in the report nearly two years ago: a gaming facility in the geographic centers of three designated regions: northeastern, southeastern, and central/western Massachusetts. The report and figures herein represent our current (2010) version of those projections.
Spectrum recognizes that the present and future development of gaming legislation in the Commonwealth may or may not rest on the same assumptions that are built into the previous legislation1. We, therefore, suggest that this analysis offers insight into the potential demand for gaming, examining what has changed and what has remained unchanged in that demand since mid‐2008.
Among the factors that may or may not change from previous legislation is the number of projected facilities within the Commonwealth, their potential locations, as well as the level of required capital investment. With that last point in mind, we have endeavored to isolate the number of hotel rooms as a contributing factor to revenue, noting that this will serve the additional purpose of educating the Legislature and others as to the potential impact of such amenities on revenue.
Additionally, we note that the level of capital investment – which would help determine the breadth and quality of the various amenities – could serve additional purposes, such as capturing incremental revenue from different market segments, such as conventions and meetings. While we note the potential of such incremental business, these segments have not been quantitatively factored into our revenue projections.
The basic methodology that we utilized to update the GGR projections is consistent with the preparation nearly two year ago. However, many metrics and assumptions integral to the modeling, and consequent GGR results, have been modified to either reflect more current and relevant amounts, or are presented with more precision than was done nearly two years ago. In essence we rely upon a demand‐driven model whereby the majority of GGR generated at each
1 At the time of this writing, Spectrum professionals are also working with legislators and staff in an advisory role to assist in the development of legislation. That work is not reflected in this report in either the assumptions or findings.

Massachusetts Gross Gaming Revenue Projections 7
gaming facility is generated by adults within a reasonable two‐hour drive‐time from each facility.
In undertaking this update, Spectrum has adopted a comprehensive approach to our analysis, relying on different models and assumptions that collectively help illuminate some of the issues related to revenue, and may help guide policymakers in these areas.
Our multi‐step approach can be summarized as follows:
1. We provide a direct update of our 2008 projections, relying on the same assumptions and methodology. This allows readers to see precisely what has changed during this time span.
2. We adjust both the 2008 and 2010 stabilized Year Three GGR projections to 2010/current dollars. This allows readers to better understand the level of revenues that can be potentially anticipated in a normalized Year Three.
3. We cross‐check our projections by using a more refined, granular methodology that uses more narrow ZIP code data, which offers guidance as to the reliability and efficacy of both methodologies.
4. We then further examine that methodology by inflation‐adjusting the projections to determine the anticipated levels of revenue in the respective normalized Year Three for both analyses, again at 2010/current dollar levels.
5. In this step, we adjust one of our key assumptions – the anticipated share of revenue for a casino in the relatively populous Boston area – to determine how this could impact overall revenue to the Commonwealth.
6. The final step in the process is to provide some understanding, through a sensitivity analysis, of how different assumptions in market share for a Boston‐area casino can potentially impact overall revenue, as well as direct gaming tax revenue for Massachusetts (calculated at 27 percent of GGR).
In our initial 2008 study, we took great pains to ensure that our analysis did not intentionally or unintentionally appear to favor one location over another. That is still a guiding principle that must be adhered to in any analysis of legislation that would lead to competitive bids.
We suggest, however, that a more detailed analysis such as that outlined here ‐ with an additional focus on differences in markets that may justify more or less capital investment, depending on the region – could serve a vital educational purpose.
In our fifth scenario, for example, this report assumes that a destination casino in the Boston area would likely justify more hotel rooms, while properties in other areas may not. Therefore, we have adjusted and reapportioned the number of rooms to more accurately reflect this reality, which would also affect overall revenue projections. One result of this more

Massachusetts Gross Gaming Revenue Projections 8
detailed methodology is that a property in Region One, which encompasses the Boston area, gains significantly more revenue in the updated model. The Region Two facility, encompassing Southeastern Massachusetts, declines in projected revenue from the 2008 projections, while the Region Three property, encompassing central and Western Massachusetts, grows slightly.
While we have employed multiple assumptions, this report reflects the same level of commitment to conservative projections as was evidenced in the 2008 study.
As explained in more detail in this report, the recession was not a significant factor in our long‐term projections, as we anticipate a return to normal growth patterns prior to 2016. The recession, however, could prove to have long‐term consequences if, for example, developers of gaming properties do not regain access to affordable capital.

Massachusetts Gross Gaming Revenue Projections 9
Executive Summary
Spectrum Gaming Group estimates that three casino resorts in Massachusetts could collectively generate more than $1.6 billion per year in gross gaming revenue (GGR) in 2016, their third year of operations, based on our moderate case scenario as presented in our primary and secondary presentations in this report. Given a gaming tax rate assumption of 27 percent, this level of revenue may generate more than $455 million in direct gaming tax revenue for Massachusetts.2
More than $1.3 billion of this revenue is forecasted to be generated from drive‐in patrons, while the remainder projected may be generated by overnight visitors at the casino hotels.
Our projections for three regions, and three scenarios for each region, are summarized in the following table:
Figure 1: GGR Summary per Primary Presentation, 2016 at moderate case
GGR $M (Primary Presentation, moderate) Low Case Moderate Case High Case Region 1 (northeastern MA) $495.5 $605.8 $710.6 Region 2 (southeastern MA) $489.4 $598.1 $701.3 Region 3 (central/western MA) $396.9 $482.5 $562.6 Grand Total $1,381.8 $1,686.3 $1,974.5 Source: Spectrum Gaming Group.
Potential gaming facilities at three locations throughout Massachusetts (each having 3,000 slot units, 100 table games, and 40 poker units, along with 2,000 hotel rooms) could generate the following in their third year of operations, at our moderate case scenario in our primary presentation:
• A gaming facility, in northeast Massachusetts (Region 1), could generate GGR of $605.8 million with $496.7 million coming from patrons within a two‐hour drive‐time. This translates into slot revenue per unit per day of $309, table game revenue per unit per day of $4,069, and poker revenue per unit per day of $680.
• A gaming facility in southeast Massachusetts (Region 2) could generate GGR of $598.1 million with $489 million coming from patrons within a two‐hour drive‐time. This translates into slot revenue per unit per day of $304, table game revenue per unit per day of $4,006, and poker revenue per unit per day of $670.
• A gaming facility in central/western Massachusetts (Region 3) could generate GGR of $482.5 million with $373.4 million coming from patrons within a two‐hour drive‐time. This translates into slot revenue per unit per day of $232, table
2 Calculated at full value based upon GGR, no reductions have been incorporated for gaming promotional credits, as some jurisdictions allow for a deduction from GGR for calculation of gaming tax.

Massachusetts Gross Gaming Revenue Projections 10
game revenue per unit per day of $3,059, and poker revenue per unit per day of $511.
• Collectively, slot revenue per unit per day is forecasted to be $282, table revenue per unit per day is estimated to amount to $3,711, and poker revenue per unit per day would amount to $621.
• By 2016, Massachusetts would recapture more than $634 million in annual gaming spending that is now going to casinos in other states. This would equate to over 54 percent of what is currently being spent at out‐of‐state casinos by Massachusetts adults.
We note that any potential revenue projections must be made with the assumption of a level of at least parity in product offerings with those of competitors in order for such forecasts to be realistic and plausible. This, in turn, underscores the importance of levels of capital investment in this process. Destination‐type resorts offer a diversity of amenities beyond gaming, thereby attracting a broader visitor base of adults who have more discretionary income, and thus increased spending options.

Massachusetts Gross Gaming Revenue Projections 11
2008 to 2010: What Has Changed
Casino gaming in the Northeastern United States3 has changed significantly since 2008, largely because of the longest and most severe recession at least since the post‐World War II slump, and arguably since the Great Depression – final evaluations are still being conducted.4 While the gaming industry certainly has not been immune from these effects, aggregate gross gaming revenues (GGR) in the Northeast region grew until 2009, and then declined only very slightly from 2008 (although we expect some modest growth to resume this year). This seemingly recession‐resistant trend for the region can be attributed almost exclusively to the expansion of slot supply from 2006 through 2009. Yonkers Raceway in Yonkers, NY opened its racino in October 2006, and Pennsylvania slot parlors started opening the following month. Indeed, Pennsylvania opened six facilities in the first year and three more in the next 22 months, through August 2009. This expansion engendered some offsetting effects within the region. Existing gaming facilities in markets such as Atlantic City, NJ and Delaware reported GGR declines during the same period, as we will show.
Regional Gaming Market Trends
One subset of the Northeastern gaming market is the Mid‐Atlantic gaming market, comprised of the 11 casinos in Atlantic City six (presently) in eastern Pennsylvania, three Delaware racinos, as well as the Yonkers NY racino. We include this market for comparative purposes to what may become the Massachusetts competitive gaming market, presently comprised of the two Connecticut casino resorts, the two Rhode Island racinos, and, to a lesser degree, the Saratoga NY racino.
Figure 2: Slot revenue annual trends in $millions:
Slot Revenues ($millions) 2006 2007 2008 2009
Northeast US $8,063 $9,063 $9,514 $9,493
percent change 12.4% 5.0% ‐0.2%
Mid‐Atlantic $4,537 $5,286 $5,559 $5,527
percent change 16.5% 5.2% ‐0.6%
Massachusetts Competitors $2,260 $2,229 $2,267 $2,132
percent change ‐1.4% 1.7% ‐5.9% Source: Gaming Industry Observer’s East Coast Slot Report.
3 Spectrum Gaming defines this as casino gaming in the States of Connecticut, Delaware, New Jersey, New York, Pennsylvania, Rhode Island, and West Virginia. 4 The Economic Recession of 2007‐2009: A Comparative Perspective on Its Duration and the Severity of Its Labor Market Impacts, A. Sum, I. Khatiwada, J. McLaughlin, Center for Labor Market Studies, Northeastern University, Boston, MA, April 2009. http://www.clms.neu.edu/publication/documents/Economic_Recession_of_20072009.pdf

Massachusetts Gross Gaming Revenue Projections 12
The following chart illustrates the trending of the aforementioned GGR, providing the general market revenue direction in recent years.
Figure 3: Slot revenue annual trends in $millions:
Source: Gaming Industry Observer’s East Coast Slot Report, from respective state gaming commissions
Within the Mid‐Atlantic trend, we highlight some detail that offers parallels for what may come in the Massachusetts region. Consider the following recent trends that comprise the Mid‐Atlantic line above.
Figure 4: Slot revenue annual trends in $millions:
Slot Revenues ($millions) 2006 2007 2008 2009
Eastern PA (started end '06) $32 $817 $1,351 $1,701
2488% 65.3% 25.9%
Atlantic City, New Jersey $3,804 $3,464 $3,133 $2,722
‐8.9% ‐9.6% ‐13.1%
Delaware $652 $612 $589 $564
‐6.0% ‐3.8% ‐4.2%
Yonkers, NY (opened 10‐06) $50 $392 $486 $540
686% 24.0% 11.1%
(Mid‐Atlantic) $4,537 $5,311 $5,559 $5,527
17.1% 4.7% ‐0.6% Source: Gaming Industry Observer’s East Coast Slot Report, from respective state gaming commissions
The next chart illustrates the declines in the pre‐existing Atlantic City and Delaware venues, as eastern Pennsylvania operations and Yonkers have come on line. We suggest this picture is instructive in that it portrays a trend roughly similar to what may likely occur in
$0
$1,000
$2,000
$3,000
$4,000
$5,000
$6,000
$7,000
$8,000
$9,000
$10,000
2006 2007 2008 2009
($ m
illions)
Northeast US
Mid‐Atlantic
Massachusetts Competitors

Massachusetts Gross Gaming Revenue Projections 13
Connecticut and Rhode Island (decline) as proposed Massachusetts gaming venues open and consequently exhibit a ramp‐up in performance. Note that in the previous chart, the Mid‐Atlantic market revenues have grown, but to the benefit only of the newcomers, and to the detriment of the existing operators.
Figure 5: Slot revenue annual trends in $millions:
Source: respective state gaming commissions, Spectrum Gaming reports.
The two following tables are provided for contextual, comparative purposes, in order to provide a current picture of the market context into which Massachusetts is considering entry.
Figure 6: Massachusetts current competitive slot market statistics:
LAST 12‐MONTHS ENDED DECEMBER
2009 Slot GGR Prior Year Variance Var.
% Units YOY % change
Daily win per unit
YOY % change
Foxwoods $ 737,125,034 $ 782,500,419 $ (45,375,385) (5.8%) 7,632 (1.3%) $ 265 (4.2%)
Mohegan Sun $ 798,093,727 $ 874,941,973 $ (76,848,246) (8.8%) 6,746 7.1% $ 324 (14.6%)
Connecticut total $ 1,535,218,761 $ 1,657,442,392 $ (122,223,631) (7.4%) 14,378 2.4% $ 293 (9.3%)
Twin River $ 399,662,954 $ 407,498,600 $ (7,835,646) (1.9%) 4,740 (0.2%) $ 231 (1.5%)
Newport Grand $ 61,505,924 $ 67,541,838 $ (6,035,914) (8.9%) 1,481 19.1% $ 114 (23.3%)
Rhode Island total $ 461,168,878 $ 475,040,438 $ (13,871,560) (2.9%) 6,221 3.8% $ 203 (6.2%)
Saratoga, NY $ 136,038,290 $ 134,373,561 $ 1,664,729 1.2% 1,770 0.0% $ 211 1.5% Market Total $ 2,132,425,929 $ 2,266,856,391 $ (134,430,462) (5.9%) 22,370 2.6% $ 261 (8.1%)
Source: Gaming Industry Observer’s East Coast Slot Report, respective state gaming commissions
$0
$500
$1,000
$1,500
$2,000
$2,500
$3,000
$3,500
$4,000
2006 2007 2008 2009
($ m
illions)
Atlantic City, New Jersey
Eastern PA (started end '06)
Delaware
Yonkers, NY (opened 10‐06)

Massachusetts Gross Gaming Revenue Projections 14
In the previous figure, Atlantic City is included as comparable only because it represents similar types of facilities as Spectrum is projecting for Massachusetts; it is not part of the Massachusetts direct competitive set.
Figure 7: Recent comparable market average win‐per‐unit figures:
2009 Slot Win/unit 2009 Table Win/unit
Newport $ 114
Twin River $ 231
Yonkers $ 278
Foxwoods $ 265 Foxwoods (est.) $ 2,333
Mohegan Sun $ 324 Mohegan Sun (est.) $ 2,954
Atlantic City $ 235 Atlantic City (norm.) $ 2,532
Regional average $ 256 Regional average $ 2,563 Source: respective state gaming commissions, Spectrum Gaming reports.
Demographic and Economic Trends
While the US Census Bureau projects a gradual slowing in the rate of population growth for the Massachusetts region (which we define as the states of Massachusetts, Connecticut, Rhode Island, and New Hampshire) in recent and coming years5, the Congressional Budget Office and other economic policy analysts project gradual small increases in per capita spending over a similar period.6
The following figure shows expected population growth for the Massachusetts region in five year increments.
Figure 8: Total market region projected population growth:
2000 2005 2010 2015 2020
MA‐CT‐RI‐NH combined 12,038,767 12,423,449 12,729,143 12,990,216 13,210,177
Five‐year growth 3.2% 2.5% 2.1% 1.7%
Average per year 0.6% 0.5% 0.4% 0.3% Source: U.S. Census Bureau, Population Division, Interim State Population Projections, 2005. Internet Release Date: April 21, 2005
The following figure shows expected US personal spending inflation through 2016.
5 U.S. Census Bureau, Population Division, Interim State Population Projections, 2005. 6 The personal consumption expenditure price index ‐ CBO’s Year‐by‐Year Forecast and Projections for Calendar Years 2009 to 2020.

Massachusetts Gross Gaming Revenue Projections 15
Figure 9: The personal consumption expenditure price index:
2010 2011 2012 2013 2014 2015 2016
Percentage change 1.9% 1.1% 1.1% 1.1% 1.3% 1.6% 1.7%
Source: Congressional Budget Office, CBO’s Year‐by‐Year Forecast and Projections for Calendar Years 2009 to 2020.
Both of these underlying forecasted trends are factored into Spectrum’s gross gaming revenue projection models presented in the next section(s) of this report.

Massachusetts Gross Gaming Revenue Projections 16
Gross Gaming Revenue Models
What Has Not Changed
As with our 2008 report, the updated models are based on three pre‐defined regions in Massachusetts, each with one relatively central casino hotel resort. The three regions were defined by county for Spectrum for our 2008 report, and have been preserved in this version. These regions are again represented in the following map:
Figure 10: Map of Massachusetts gaming regions and approximate casino locations:
Source: Microsoft MapPoint 2010, Spectrum Gaming Group.
The casino sites within each region were not pre‐defined, and remain hypothetically based only on each region’s approximate geographic centers, as determined by Spectrum Gaming Group. The Region One casino location remains about fifteen miles north of downtown Boston, roughly within a triangle formed by Wilmington, Reading, and Burlington. The Region Two location is again in the southeast of the state, near Middleborough and Lakeville. The Region Three site is in the west‐central part of the state, still in the vicinity of West Pelham, Amherst, and South Amherst.
All three potential, or projected, casino resorts, although sized somewhat differentially in this analysis, remain in concept full‐service casino‐hotels, with non‐gaming amenities unspecified here, but understood to include a hotel, as well as several food and beverage

Massachusetts Gross Gaming Revenue Projections 17
options, bars, entertainment, and some retail. The prior Spectrum report likened the project at the time to the Borgata in Atlantic City, pre‐expansion. We cite this again now only as a baseline assumption, in that the proposed Massachusetts projects may need to offer some combination of amenities on this scale in order to reasonably and effectively compete with existing operators in the region.
As for the previous report, we then applied two‐hour drive time areas to each of the three casino locations, to provide perimeters for their respective (and overlapping) likely feeder populations.
Figure 11: Region One (northeast), drive‐time area, and approximate casino locations:
Source: Microsoft MapPoint 2010, Spectrum Gaming Group.
The Region One 2010 total drive‐time population estimate is 10.462 million, with over 7.6 million adults.7
7 Microsoft MapPoint 2010, US Census Bureau, Population Division, Interim State Population Projections, 2005.

Massachusetts Gross Gaming Revenue Projections 18
Figure 12: Region Two (southeast), drive‐time area, and approximate casino locations:
Source: Microsoft MapPoint 2010, Spectrum Gaming Group.
The Region Two 2010 total drive‐time population estimate is 9.348 million, with over 6.8 million adults.8
8 Ibid.

Massachusetts Gross Gaming Revenue Projections 19
Figure 13: Region Three (west), drive‐time area, and approximate casino locations:
Source: Microsoft MapPoint 2010, Spectrum Gaming Group.
The Region Three 2010 drive‐time population estimate is 10.331 million, with over 7.5 million adults.9
The highlighted but unlabeled sites in the following combined map indicate the existing competing facilities in other states that we will discuss further in a later section. Note that there is considerable overlap, or shared, population between the three regions. The combined 2010 total population (without duplication) for all three Massachusetts drive‐time regions is estimated to be 13.143 million regional residents, including 9.8 million adults.10
9 Ibid. 10 Ibid.

Massachusetts Gross Gaming Revenue Projections 20
Figure 14: MA gaming regions, drive‐time areas, and approximate casino locations:
Source: Microsoft MapPoint 2010, Spectrum Gaming Group.
What Has Changed in the Models
As we illustrate in the upcoming financial models, we updated various assumptions and statistics, both for the present state of the market (two years after our original report) and for the future Massachusetts gaming revenue projections. Spectrum estimated years one, two, and three in the projections to be calendar years 2014, 2015, and 2016, and built up population and spending levels as discussed accordingly. Year‐to‐year growth in the models is based in part on demographic and economic trends as outlined, and also in part on typical growth in each operation’s customer base and business volume in its early years, reflecting trial and retention increases that accompany marketing programs and public awareness.
Population figures in the revenue models, in addition to being shown on a county‐by‐county basis (consistent with preparation of 2008 report) are also shown based on estimates down to the ZIP code level. This enhancement allowed for relatively more accurate mapping of feeder populations and estimates; however we show both methods to illustrate impact.
Additionally, we show an alternate presentation in the report which illustrates various changes in the anticipated share of visitation for each of the three regions. A material change is illustrated for a gaming resort in Region One, the relatively populous Boston area. This is shown to enhance understanding, and appreciation, on how the type (i.e. size, scope, attractiveness,

Massachusetts Gross Gaming Revenue Projections 21
level of capital investment and offerings) of a gaming facility developed there could impact overall revenue to the Commonwealth. Spectrum recognizes that a gaming resort facility developed in Region One potentially could attract a much larger respective share of the local population than the 20 percent utilized in our reporting. However, we simply do not know what type of facility may be developed and its ultimate appeal to the local population, therefore we deem our 20 percent figure as conservative, but we do show examples of how positive changes in share of revenue impact the projections.

Massachusetts Gross Gaming Revenue Projections 22
Gross Gaming Revenue Projections, Methodology
In developing these projections, Spectrum relied on a combination of drive‐time and incremental destination modeling (i.e. – from a hotel and non‐gaming amenities). However, in our alternate presentation we further refine the model to include adjusting visitation share based upon gravity modeling (i.e. – primarily enhanced visitor share for Region One).
The differences in GGR over the two year span are summarized in the following tables, all at moderate case scenario for a stabilized year three of operations:
Figure 15: Projected GGR differences, 2010 vs. 2008 reports
GGR $M (Primary Presentation, moderate) Low Case Moderate Case High Case Region 1 (northeastern MA) $495.5 $605.8 $710.6 Region 2 (southeastern MA) $489.4 $598.1 $701.3 Region 3 (central/western MA) $396.9 $482.5 $562.6 Grand Total $1,381.8 $1,686.3 $1,974.5
GGR $M (2008 Report, moderate) Low Case Moderate Case High Case Region 1 (northeastern MA) $452.3 $542.1 $643.4 Region 2 (southeastern MA) $438.1 $526.8 $623.4 Region 3 (central/western MA) $336.4 $432.7 $509.7 Grand Total $1,226.8 $1,501.6 $1,776.5 Source: Spectrum Gaming Group.
Much of the difference in these figures has to do with the two year span separating the preparation of these reports, as year three in this current report is assumed to be 2016, while in our 2008 report year three was assumed to be 2014. As we will illustrate further in this report, when these figures are adjusted for inflation and both presented in 2010/current dollar values, the effective variance at the moderate case scenario in our primary presentation is only 1.0 percent (while the variance between the low and high cases scenarios between this report and the 2008 report is 1.3 percent and 0.0 percent, respectively).
In our primary and secondary presentations in this report, the existing differences between this report and the 2008 report results, when adjusted for inflation, are primarily due to changes in population estimates, as well as adjustments to our estimated gaming spend per adult. One subtle difference that exists between our primary and secondary presentations is due to the re‐creation of the drive‐time zones based upon ZIP code population data, this method is much more precise and does not require including, or excluding, entire county population data as the prior report did; however the effective variances due to this are minimal.
In our detailed GGR projections that follow in this report, Spectrum presents the projected gaming revenue for each location first by drive‐time visitation, by year for the first three years of operation – opening year one, ramp‐up year two, and stabilized year three

Massachusetts Gross Gaming Revenue Projections 23
operations, after which minimal baseline growth is assumed (although not displayed in this report). For this report we consider year one, two, and three as 2014, 2015, and 2016, respectively. In addition to likely drive‐time population attendance, destination, or tourism, visitation estimates are added on, representing hotel guests only, from beyond the normal or likely drive‐time population.
In order to adequately define and quantify feeder populations to the potential sites, Spectrum again used two‐hour drive‐time perimeters, as it is our belief and experience that areas so defined represent at least 80 percent of likely and repeat visitation to these types of facilities. Some drive‐in visitation from beyond this range can be expected, but in keeping with our conservative approach to projections, we assume there may be little incremental revenue generated from adults living outside that perimeter.
We present these revenue estimates in three identically formatted versions, or scenarios: a moderate case, which we consider the central and most likely outcomes model, plus a low case, then a high case, which we see as the likely lower and upper limits to the revenue projections, given the real‐world variability of the factors in the models, and absent any significant, unanticipated market or economic events.
All of the GGR models presented herein share following assumptions (differences among presentations are noted), line item definitions, and sources:
Figure 16: Revenue modeling assumptions and sources 2‐hour Drive‐time Population Total feeder population per region location, by County or ZIP codes (as applicable), adjusted
for growth, per U.S. Census Bureau estimates.
Microsoft MapPoint 2010, U.S. Census Bureau, Population Division, Interim State Population Projections, 2005.
Adult % 73.2 percent of total for region, per U.S. Census Bureau estimates. Population Division, U.S. Census Bureau, Estimates of the Resident Population by Selected Age
Groups for the United States and Puerto Rico: July 1, 2008.
Adults (product of above two.)Gaming Incidence Rate 28 percent, per latest Harrah's (2006) national survey, considered conservative, as
participation increases as gaming availability increases.
Profile of the American Casino Gambler: Harrah's Survey 2006, http://www.harrahs.com/images/PDFs/Profile_Survey_2006.pdf.
"Gamers" Gaming participants; product of above two.Avg. annual trips per adult 6.7 average, per Harrah's national survey, also considered conservative, as gaming
jurisdictions tend higher than non‐gaming juridistions.
Annual Gaming Visits (product of above two.)Region _ Share of Visits Estimated at 20% for each location in Primary/Secondary presentation; alternate presentation
has estimated per location share of total visitation, based on distance, number of competing locations, and share growth.
Region _ Gaming Visits (product of above two.)Gaming Value per Visit Atlantic City base model of $150, varied by region, adjusted for future inflation, per
Congressional Budget Office projections.
New Jersey Casino Control Commission, South Jersey Transportation Authority, The personal consumption expenditure price index ‐ CBO’s Year‐by‐Year Forecast and Projections for Calendar Years 2009 to 2020.
Gross Gaming Revenue (GGR) (product of above two.)Days (365 per year.)

Massachusetts Gross Gaming Revenue Projections 24
Gross Slot Win 68.1 percent of total GGR, per 2009 Atlantic City average. New Jersey Casino Control Commission, http://www.state.nj.us/casinos/financia/mthrev/.Slot Win per Unit per Day (average)Units 3,000 each in Primary/Secondary presentation; alternate presentation has 2,500 each for
regions 2 and 3, 5,000 for region 1, per casino resort base model.
Gross Table Win 29.9 percent of total GGR, per 2009 Atlantic City average.Table Win per Unit per Day (average)Table Units 100 each in Primary/Secondary presentation; alternate presentation has 100 each for regions
2 and 3, 160 for region 1, per casino resort base model.
Gross Poker Win 2.0 percent of total GGR, per 2009 Atlantic City average.Poker Units 40 each in Primary/Secondary presentation; alternate presentation has 40 each for regions 2
and 3, 70 for region 1, per casino resort base model.
Poker Win per Unit Per Day (average)Gaming Tax Rate 27.0 percent.Calculated Gaming Tax 27.0 percent of Gross Gaming Revenue.Estimated Gaming Tax Paid 27.0 percent of Gross Gaming Revenue, after $100,000,000 annual minimum. Incremental room‐nights 2,000 hotel rooms for each facility in Primary/Secondary presentations; alternate presentation
has 1,500 for regions 2 and 3, 2,000 for region 1. All multiplied by days per year.
Percent of available total 36.0 +/‐ percent average destination travel (non‐drive‐in) estimate, based on Atlantic City historical averages.
Gaming Value per Room‐night 2.5 times Gaming Value per Visit, based on Atlantic City historical averages. Gross Gaming Revenue (GGR) (product of above three.)
Source: Spectrum Gaming Group.
We do not project any impact from any other gaming facilities that may open in the Northeast region in coming years, in near proximity to any points in Massachusetts, and specifically through 2016. For example, there is the looming possibility of legalized gaming in the Catskills region of New York (just beyond a two‐hour drive from many points in western Massachusetts), and other areas in New York, as well as discussion of legalizing casino gaming in the State of New Hampshire (as the southern half of that state is within a two‐hour drive from many points in Massachusetts, including Boston).
We fully realize that other states surrounding Massachusetts may offer a significantly different casino gaming landscape in the near future from what currently exists; however, we have no way of accurately determining what may or may not occur. Therefore, for purposes of this report we have utilized what we believe the competitive casino gaming landscape will be through 2016. Finally, we do not speculate or include potential material changes in the size and scope of existing gaming facilities in the region – all gaming facility supply attributes for gaming facilities outside of Massachusetts that are factored into our projections for Massachusetts GGR are at year ended 2009 levels.
Hotel Rooms
Beyond potential drive‐in hotel traffic, the relatively robust destination visitation to Massachusetts by tourists, as reviewed at some length in our first report, should provide potential incremental gaming revenues. Based partially on that rationale, we assume that the three gaming resort facilities will collectively have 6,000 hotel rooms (assumed at 5,000 in our

Massachusetts Gross Gaming Revenue Projections 25
alternate presentation). Properly marketed and priced, such room capacity is forecasted to translate into value‐added incremental gaming revenue from drive‐in and tourist visitors alike.
Here again, Spectrum has sized the model room inventories as offering typical and adequate supply in connection with the casino demand being modeled. These inventories are intended only to be adequate, as we do not seek to constrain our demand revenue projections. There would, naturally, be other supporting rationales that could justify varying levels of casino resort capital investment, as discussed in more detail later in this report.
Figure 17: Range of potential Massachusetts GGR from hotel rooms ($M, except per room):
Massachusetts average annual occupancy of 6,000‐room inventory
50.0% 55.0% 60.0% 65.0% 70.0% 75.0% 80.0% 85.0% 90.0%
GGR pe
r roo
m‐night
$300 $329 $361 $394 $427 $460 $493 $526 $558 $591
$330 $361 $397 $434 $470 $506 $542 $578 $614 $650
$363 $397 $437 $477 $517 $556 $596 $636 $676 $715
$399 $437 $481 $525 $568 $612 $656 $700 $743 $787
$439 $481 $529 $577 $625 $673 $721 $770 $818 $866
$483 $529 $582 $635 $688 $741 $794 $846 $899 $952
$531 $582 $640 $698 $757 $815 $873 $931 $989 $1,048
$585 $640 $704 $768 $832 $896 $960 $1,024 $1,088 $1,152 Source: Spectrum Gaming Group.
As with casino gaming capacity, too many hotel rooms can lead to diminishing returns, while adequate supply in proportion with casino size and resort demand is projected to produce incremental revenues and profit. Hotel utilization is reflected in two places in the gaming revenue projections below: partially in the gaming value per visit in each regional table (drive‐in population) and in part in the incremental destination visitation estimates (tourism gaming spend). GGR per room‐night is based on average 2.0 adults per room, per Atlantic City casino hotel visitation averages.11
11 Atlantic City 2008 Visitor Profile Survey, Atlantic City Convention and Visitors Authority and Spectrum Gaming.
http://www.atlanticcitynj.com/!userfiles/pdfs/Reports/ACVP08_summ.pdf
Massachusetts Gross Gaming Revenue Projections 26
Gross Gaming Revenue Projections ‐ Primary Presentation
This section of the report provides a direct update of our 2008 projections, relying on the same assumptions and methodology. This allows readers to see precisely what has changed during this time span. Additionally, we adjust both the 2008 and 2010 third year GGR projections to real, inflation adjusted dollars; this step allows readers to better understand the level of revenues that can be potentially anticipated in a normalized Year Three.
Under our moderate case scenario, in the third year of operations or 2016, we project that three gaming facilities located throughout Massachusetts (having supply attributes and characteristics to effectively capture existing demand) have the potential to generate $1.69 billion in GGR in their third year, and beyond.
This $1.69 billion GGR projection for 2016, discounted for estimated inflation, translates into approximately $1.58 billion in 2010/current dollars. Our 2008 report projected GGR to be $1.5 billion in the third year of operations, after applying inflation rates this figure translates to approximately $1.54 billion in 2010/current dollars.
In summary, at our moderate case scenario for the third year of operations (in both reports), our overall statewide GGR projection in this updated report varies favorably by 1.0 percent (or by $16.0 million) from our 2008 report.
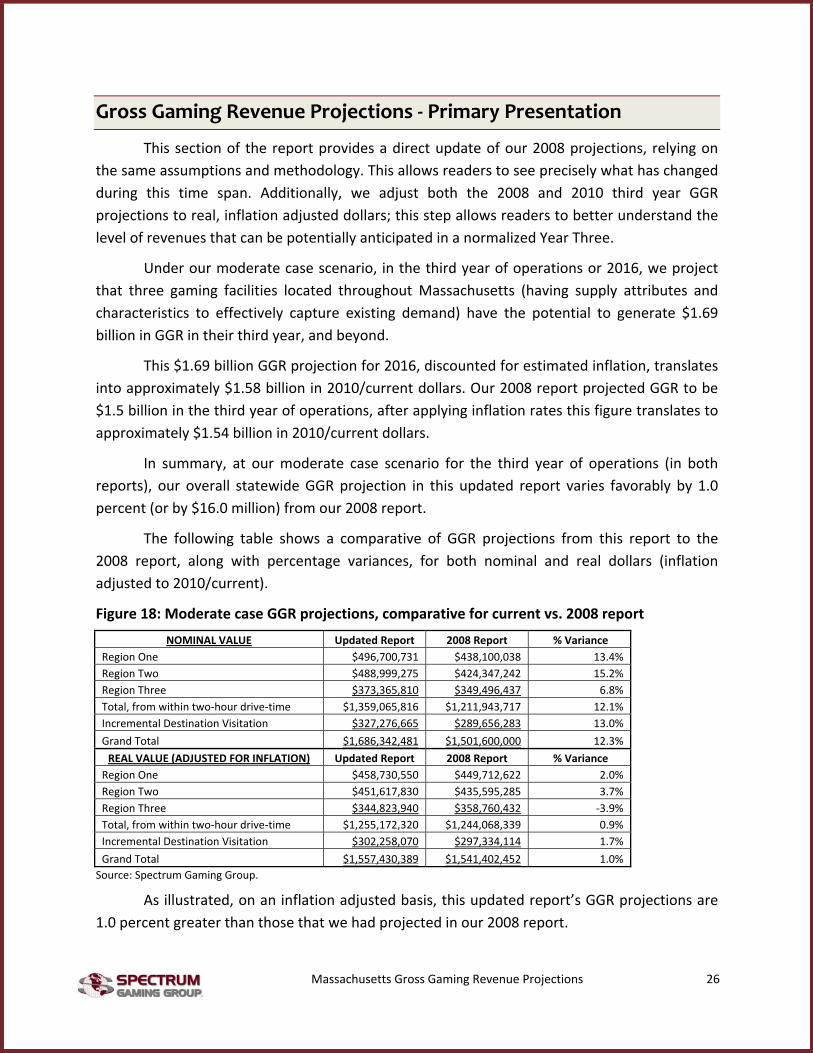
The following table shows a comparative of GGR projections from this report to the 2008 report, along with percentage variances, for both nominal and real dollars (inflation adjusted to 2010/current).
Figure 18: Moderate case GGR projections, comparative for current vs. 2008 report
NOMINAL VALUE Updated Report 2008 Report % Variance Region One $496,700,731 $438,100,038 13.4% Region Two $488,999,275 $424,347,242 15.2% Region Three $373,365,810 $349,496,437 6.8% Total, from within two‐hour drive‐time $1,359,065,816 $1,211,943,717 12.1% Incremental Destination Visitation $327,276,665 $289,656,283 13.0% Grand Total $1,686,342,481 $1,501,600,000 12.3% REAL VALUE (ADJUSTED FOR INFLATION) Updated Report 2008 Report % Variance
Region One $458,730,550 $449,712,622 2.0% Region Two $451,617,830 $435,595,285 3.7% Region Three $344,823,940 $358,760,432 ‐3.9% Total, from within two‐hour drive‐time $1,255,172,320 $1,244,068,339 0.9% Incremental Destination Visitation $302,258,070 $297,334,114 1.7% Grand Total $1,557,430,389 $1,541,402,452 1.0% Source: Spectrum Gaming Group.
As illustrated, on an inflation adjusted basis, this updated report’s GGR projections are 1.0 percent greater than those that we had projected in our 2008 report.

Massachusetts Gross Gaming Revenue Projections 27
The following table shows a comparative of GGR projections from this report to the 2008 report, along with percentage variances, for both nominal and real dollars (inflation adjusted to 2010/current) for the low case scenarios from both reports.
Figure 19: Low case GGR projections, comparative for current vs. 2008 report
NOMINAL VALUE Updated Report 2008 Report % Variance Region One $397,360,585 $350,480,031 13.4% Region Two $391,199,420 $339,477,794 15.2% Region Three $298,692,648 $279,597,149 6.8% Total, from within two‐hour drive‐time $1,087,252,653 $969,554,974 12.1% Incremental Destination Visitation $294,548,998 $257,245,026 14.5% Grand Total $1,381,801,651 $1,226,800,000 12.6% REAL VALUE (ADJUSTED FOR INFLATION) Updated Report 2008 Report % Variance
Region One $366,984,440 $359,770,098 2.0% Region Two $361,294,264 $348,476,228 3.7% Region Three $275,859,152 $287,008,345 ‐3.9% Total, from within two‐hour drive‐time $1,004,137,856 $995,254,671 0.9% Incremental Destination Visitation $272,032,263 $264,063,741 3.0% Grand Total $1,276,170,119 $1,259,318,413 1.3%
Source: Spectrum Gaming Group.
The following table shows a comparative of GGR projections from this report to the 2008 report, along with percentage variances, for both nominal and real dollars (inflation adjusted to 2010/current) for the high case scenarios from both reports.
Figure 20: High case GGR projections, comparative for current vs. 2008 report
NOMINAL VALUE Updated Report 2008 Report % Variance Region One $596,040,877 $525,720,046 13.4% Region Two $586,799,130 $509,216,691 15.2% Region Three $448,038,971 $349,496,437 28.2% Total, from within two‐hour drive‐time $1,630,878,979 $1,384,433,174 17.8% Incremental Destination Visitation $343,640,498 $392,066,826 ‐12.4% Grand Total $1,974,519,477 $1,776,500,000 11.1% REAL VALUE (ADJUSTED FOR INFLATION) Updated Report 2008 Report % Variance
Region One $550,476,660 $539,655,147 2.0% Region Two $541,941,396 $522,714,342 3.7% Region Three $413,788,728 $430,512,518 ‐3.9% Total, from within two‐hour drive‐time $1,506,206,783 $1,492,882,007 0.9% Incremental Destination Visitation $317,370,973 $330,707,136 ‐4.0% Grand Total $1,823,577,757 $1,823,589,143 0.0% Source: Spectrum Gaming Group.
Moderate case GGR projections
The following six sequential tables present the moderate scenario for years one, two, and three for each region, all three combined, hotel tourist visitation for the state, and grand totals.

Massachusetts Gross Gaming Revenue Projections 28
The following four tables present our moderate case GGR projections for each location and statewide strictly determined by adult population within a two‐hour drive time from each location, further enhanced by expected visitation share to each location based upon proximity of this adult population to respective gaming facility and others in the region.
Figure 21: Moderate case GGR projections, northeast MA location:
Region One Moderate Case Year 1 Year 2 Year 3 Adults 7,875,318 7,906,820 7,938,447 Avg. annual trips per gaming adult 6.7 6.7 6.7 Region Share of Visits 16.0% 18.0% 20.0% Gaming Value per Visit $161 $164 $167 GGR $381,507,166 $437,806,941 $496,700,731 Slot Win per Unit per Day $237 $272 $309 Table Win per Unit per Day $3,125 $3,586 $4,069 Poker Win per Unit per Day $523 $600 $680 Calculated Gaming Tax @.27 $103,006,935 $118,207,874 $134,109,197 Estimated Gaming Tax Paid $103,006,935 $118,207,874 $134,109,197 Effective Gaming Tax Rate 27.0% 27.0% 27.0% Source: Spectrum Gaming Group.
As illustrated we project that a gaming facility in Region One (northeast Massachusetts) could generate $496.7 million in GGR in its third year of operations from patrons within a two‐hour drive‐time (net of incremental destination visitation or hotel guests from farther away).
Figure 22: Moderate case GGR projections, southeast MA location:
Region Two Moderate Case Year 1 Year 2 Year 3 Adults 7,129,063 7,157,579 7,186,209 Avg. annual trips per gaming adult 6.7 6.7 6.7 Region Share of Visits 16.0% 18.0% 20.0% Gaming Value per Visit $176 $178 $181 GGR $375,591,812 $431,018,647 $488,999,275 Slot Win per Unit per Day $234 $268 $304 Table Win per Unit per Day $3,077 $3,531 $4,006 Poker Win per Unit per Day $515 $590 $670 Calculated Gaming Tax @.27 $101,409,789 $116,375,035 $132,029,804 Estimated Gaming Tax Paid $101,409,789 $116,375,035 $132,029,804 Effective Gaming Tax Rate 27.0% 27.0% 27.0% Source: Spectrum Gaming Group.
As illustrated, we project that a gaming facility in Region Two (southeastern Massachusetts) could generate $489 million in GGR in its third year of operations from patrons within a two‐hour drive‐time (net of incremental destination visitation or hotel guests from beyond the two‐hour drive population).

Massachusetts Gross Gaming Revenue Projections 29
Figure 23: Moderate case GGR projections, central/western MA location:
Region Three Moderate Case Year 1 Year 2 Year 3 Adults 7,237,988 7,266,940 7,296,008 Avg. annual trips per gaming adult 6.7 6.7 6.7 Region Share of Visits 16.0% 18.0% 20.0% Gaming Value per Visit $132 $134 $136 GGR $286,775,764 $329,095,838 $373,365,810 Slot Win per Unit per Day $178 $205 $232 Table Win per Unit per Day $2,349 $2,696 $3,059 Poker Win per Unit per Day $393 $451 $511 Calculated Gaming Tax @.27 $77,429,456 $88,855,876 $100,808,769 Estimated Gaming Tax Paid $100,000,000 $100,000,000 $100,808,769 Effective Gaming Tax Rate 34.9% 30.4% 27.0% Source: Spectrum Gaming Group.
As illustrated, we project that a gaming facility in Region Three (central/western Massachusetts) could generate $373.4 million in GGR in its third year of operations from patrons within a two‐hour drive‐time (net of incremental destination visitation or hotel guests from beyond two hours).
Figure 24: Moderate case GGR projections, statewide total:
Total State Moderate Case Year 1 Year 2 Year 3 Adults 9,351,484 9,388,890 9,426,446 Avg. annual trips per gaming adult 6.7 6.7 6.7 MA Share of MA feeder Visits 38.1% 42.8% 47.6% Gaming Value per Visit $156 $159 $162 GGR $1,043,874,742 $1,197,921,426 $1,359,065,816 Slot Win per Unit per Day $216 $248 $282 Table Win per Unit per Day $2,850 $3,271 $3,711 Poker Win per Unit per Day $477 $547 $621 Calculated Gaming Tax @.27 $281,846,180 $323,438,785 $366,947,770 Estimated Gaming Tax Paid $304,416,724 $334,582,909 $366,947,770 Effective Gaming Tax Rate 29.2% 27.9% 27.0% Source: Spectrum Gaming Group.
As illustrated, we project that three gaming facilities located throughout varying regions of Massachusetts could collectively generate in excess of $1.359 billion in GGR in their third year of operations from patrons within a two‐hour drive‐time (net of incremental destination visitation or hotel guests).
The next table shows projected GGR generated through incremental destination visitation, shown as a statewide total. This is primarily GGR generated due to having a gaming resort facility with hotel rooms, and other significant non‐gaming amenities. The incremental capture is from visitation beyond a two‐hour drive‐time from the three Massachusetts gaming

Massachusetts Gross Gaming Revenue Projections 30
facilities and/or from customers within a two‐hour drive‐time, albeit calculated at a higher GGR per patron worth due to longer visits at each facility via overnight stays.
To determine this incremental GGR, Spectrum utilized a GGR value per occupied room‐night at 2.5‐times the average gaming value per visit from the drive‐in customers. This is based conservatively in part on actual Atlantic City historical experience, including an average 2.0 adults per room. While the GGR worth per room night can and will vary, depending in part on each operator’s casino marketing rewards formula and operating strategies, we believe this is a reasonable and conservative starting point based on the scale of these facilities and comparable past experience.
The following table shows projected GGR from incremental destination visitation (primarily hotel guests at each casino‐hotel) based upon the three Massachusetts gaming facilities having a collective 6,000 hotel rooms.
Figure 25: Incremental destination visitation, moderate case:
Total State Moderate Case Year 1 Year 2 Year 3 Incremental room‐nights 766,500 788,400 810,300
Percent of available total 35% 36% 37% Gaming Value per Room‐night $391 $397 $404 GGR $299,617,172 $313,108,505 $327,276,665 Source: Spectrum Gaming Group.
As illustrated, we believe that the three potential gaming facilities in Massachusetts having 6,000 hotel rooms could reasonably generate in incremental $327.3 million in GGR, in their third year of operations, by virtue of having hotel rooms.
This implies that for the third year of operations (stabilized operations) each gaming facility could expect an incremental $54.5 million in GGR from having 1,000 hotel rooms (or $54,546 in GGR annually per hotel room).
The following table shows our projected statewide total GGR, the combination of GGR from adults within a two‐hour drive‐time of each proposed gaming facility coupled with the incremental destination total GGR.
Figure 26: Grand total GGR projections, statewide, moderate case:
Total State Moderate Case Year 1 Year 2 Year 3 GGR $1,343,491,914 $1,511,029,931 $1,686,342,481 Slot Win per Unit per Day $279 $313 $350 Table Win per Unit per Day $3,669 $4,126 $4,605 Poker Win per Unit per Day $613 $690 $770 Calculated Gaming Tax @.27 $362,742,817 $407,978,081 $455,312,470 Estimated Gaming Tax Paid $385,313,360 $419,122,205 $455,312,470 Source: Spectrum Gaming Group.

Massachusetts Gross Gaming Revenue Projections 31
As illustrated, in our moderate case scenario, we believe that three gaming facilities located throughout Massachusetts (having supply attributes and characteristics to effectively capture existing demand) have the potential to generate $1.69 billion in GGR in their third year, and beyond.
This $1.69 billion GGR projection for 2016, discounted for estimated inflation, translates into approximately $1.58 billion in 2010/current dollars. Our 2008 report projected GGR to be at $1.50 billion in the third year of operations, after applying inflation rates this figure translates to approximately $1.54 billion in 2010/current dollars.
In summary, at our moderate case scenario for the third year of operations (in both reports), our overall statewide GGR projection in this updated report varies favorably by 1.0 percent (or by $16.0 million) from our 2008 report.
Low case GGR projections
The next six tables present the low case revenue scenario in the same sequence as the moderate cases in the previous section of this report.
Figure 27: Low case GGR projections, northeast MA location:
Region One Low Case Year 1 Year 2 Year 3 Adults 7,875,318 7,906,820 7,938,447 Avg. annual trips per gaming adult 6.7 6.7 6.7 Region Share of Visits 13.0% 14.4% 16.0% Gaming Value per Visit $161 $164 $167 GGR $309,020,804 $350,245,553 $397,360,585 Slot Win per Unit per Day $192 $218 $247 Table Win per Unit per Day $2,531 $2,869 $3,255 Poker Win per Unit per Day $423 $480 $544 Calculated Gaming Tax @.27 $83,435,617 $94,566,299 $107,287,358 Estimated Gaming Tax Paid $100,000,000 $100,000,000 $107,287,358 Effective Gaming Tax Rate 32.4% 28.6% 27.0% Source: Spectrum Gaming Group.
As illustrated, we project that a gaming facility in Region One (northeast MA) could generate $397.4 million in GGR in its third year of operations from patrons within a two‐hour drive‐time (net of incremental destination visitation or hotel guests).

Massachusetts Gross Gaming Revenue Projections 32
Figure 28: Low case GGR projections, southeast MA location:
Region Two Low Case Year 1 Year 2 Year 3 Adults 7,129,063 7,157,579 7,186,209 Avg. annual trips per gaming adult 6.7 6.7 6.7 Region Share of Visits 13.0% 14.4% 16.0% Gaming Value per Visit $176 $178 $181 GGR $304,229,368 $344,814,917 $391,199,420 Slot Win per Unit per Day $189 $214 $243 Table Win per Unit per Day $2,492 $2,825 $3,205 Poker Win per Unit per Day $417 $472 $536 Calculated Gaming Tax @.27 $82,141,929 $93,100,028 $105,623,843 Estimated Gaming Tax Paid $100,000,000 $100,000,000 $105,623,843 Effective Gaming Tax Rate 32.9% 29.0% 27.0% Source: Spectrum Gaming Group.
As illustrated, we project that a gaming facility in Region Two (southeast MA) could generate $391.2 million in GGR in its third year of operations from patrons within a two‐hour drive‐time (net of incremental destination visitation or hotel guests).
Figure 29: Low case GGR projections, central/western MA location:
Region Three Low Case Year 1 Year 2 Year 3 Adults 7,237,988 7,266,940 7,296,008 Avg. annual trips per gaming adult 6.7 6.7 6.7 Region Share of Visits 13.0% 14.4% 16.0% Gaming Value per Visit $132 $134 $136 GGR $232,288,369 $263,276,670 $298,692,648 Slot Win per Unit per Day $144 $164 $186 Table Win per Unit per Day $1,903 $2,157 $2,447 Poker Win per Unit per Day $318 $361 $409 Calculated Gaming Tax @.27 $62,717,860 $71,084,701 $80,647,015 Estimated Gaming Tax Paid $100,000,000 $100,000,000 $100,000,000 Effective Gaming Tax Rate 43.0% 38.0% 33.5% Source: Spectrum Gaming Group.
As illustrated, we project that a gaming facility in Region Three (central/western MA) could generate $298.7 million in GGR in its third year of operations from patrons within a two‐hour drive‐time (net of incremental destination visitation or hotel guests).

Massachusetts Gross Gaming Revenue Projections 33
Figure 30: Low case GGR projections, statewide total:
Total State Low Case Year 1 Year 2 Year 3 Adults 9,351,484 9,388,890 9,426,446 Avg. annual trips per gaming adult 6.7 6.7 6.7 MA Share of MA feeder Visits 30.8% 34.3% 38.1% Gaming Value per Visit $156 $159 $162 GGR $845,538,541 $958,337,141 $1,087,252,653 Slot Win per Unit per Day $175 $199 $225 Table Win per Unit per Day $2,309 $2,617 $2,969 Poker Win per Unit per Day $386 $438 $496 Calculated Gaming Tax @.27 $228,295,406 $258,751,028 $293,558,216 Estimated Gaming Tax Paid $300,000,000 $300,000,000 $312,911,201 Effective Gaming Tax Rate 35.5% 31.3% 28.8% Source: Spectrum Gaming Group.
As illustrated, we project that three gaming facilities located throughout varying regions of Massachusetts could collectively generate nearly $1.1 billion in GGR in their third year of operations from patrons within a two‐hour drive‐time (net of incremental destination visitation or hotel guests).
The following table shows projected GGR from incremental destination visitation (primarily hotel guests at each casino‐hotel) based upon the three Massachusetts gaming facilities having a collective 6,000 hotel rooms – at our low case scenario.
Figure 31: Incremental destination visitation, low case:
Total State Low Case Year 1 Year 2 Year 3 Incremental room‐nights 689,850 709,560 729,270
Percent of available total 32% 32% 33% Gaming Value per Room‐night $391 $397 $404 GGR $269,655,455 $281,797,654 $294,548,998 Source: Spectrum Gaming Group.
As illustrated, we believe that the three potential gaming facilities in Massachusetts having 6,000 hotel rooms could reasonably generate in incremental $294.5 million in GGR, in their third year of operations, by virtue of having hotel rooms.
This implies that for the third year of operations (stabilized operations) each gaming facility could expect an incremental $49.1 million in GGR from having 1,000 hotel rooms (or $49,091 in GGR annually per hotel room).
The following table shows our projected statewide total GGR, the combination of GGR from adults within a two‐hour drive‐time of each proposed gaming facility coupled with the incremental destination total GGR.

Massachusetts Gross Gaming Revenue Projections 34
Figure 32: Grand total GGR projections, statewide, low case:
Total State Low Case Year 1 Year 2 Year 3 GGR $1,115,193,996 $1,240,134,795 $1,381,801,651 Slot Win per Unit per Day $231 $257 $286 Table Win per Unit per Day $3,045 $3,386 $3,773 Poker Win per Unit per Day $509 $566 $631 Calculated Gaming Tax @.27 $301,102,379 $334,836,395 $373,086,446 Estimated Gaming Tax Paid $372,806,973 $376,085,367 $392,439,431 Source: Spectrum Gaming Group.
As illustrated, in our low case scenario, we believe that three gaming facilities located throughout Massachusetts (having supply attributes and characteristics to effectively capture existing demand) may generate approximately $1.38 billion in GGR in their third year, and beyond.
At our low case scenario, this $1.38 billion GGR projection for 2016, discounted for estimated inflation, translates into approximately $1.276 billion in 2010/current dollars. Our 2008 report projected GGR to be at $1.227 billion in the third year of operations, after applying inflation rates this figure translates to approximately $1.259 billion in 2010/current dollars.
In summary, at our low case scenario for the third year of operations (in both reports), our overall statewide GGR projection in this updated report varies favorably by 1.3 percent (or by $16.9 million) from our 2008 report.
High case GGR projections
The next six tables present the high case revenue scenario in the same sequence as the moderate and low casino scenarios cases in the previous two sections of this report.
Figure 33: High case GGR projections, northeast MA location:
Region One High Case Year 1 Year 2 Year 3 Adults 7,875,318 7,906,820 7,938,447 Avg. annual trips per gaming adult 6.7 6.7 6.7 Region Share of Visits 19.4% 21.6% 24.0% Gaming Value per Visit $161 $164 $167 GGR $463,531,207 $525,368,330 $596,040,877 Slot Win per Unit per Day $288 $327 $371 Table Win per Unit per Day $3,797 $4,304 $4,883 Poker Win per Unit per Day $635 $720 $816 Calculated Gaming Tax @.27 $125,153,426 $141,849,449 $160,931,037 Estimated Gaming Tax Paid $125,153,426 $141,849,449 $160,931,037 Effective Gaming Tax Rate 27.0% 27.0% 27.0% Source: Spectrum Gaming Group.

Massachusetts Gross Gaming Revenue Projections 35
As illustrated, we project that a gaming facility in Region One (northeast MA) could generate $596 million in GGR in its third year of operations from patrons within a two‐hour drive‐time (net of incremental destination visitation or hotel guests).
Figure 34: High case GGR projections, southeast MA location:
Region Two High Case Year 1 Year 2 Year 3 Adults 7,129,063 7,157,579 7,186,209 Avg. annual trips per gaming adult 6.7 6.7 6.7 Region Share of Visits 19.4% 21.6% 24.0% Gaming Value per Visit $176 $178 $181 GGR $456,344,051 $517,222,376 $586,799,130 Slot Win per Unit per Day $284 $322 $365 Table Win per Unit per Day $3,738 $4,237 $4,807 Poker Win per Unit per Day $625 $709 $804 Calculated Gaming Tax @.27 $123,212,894 $139,650,042 $158,435,765 Estimated Gaming Tax Paid $123,212,894 $139,650,042 $158,435,765 Effective Gaming Tax Rate 27.0% 27.0% 27.0% Source: Spectrum Gaming Group.
As illustrated, we project that a gaming facility in Region Two (southeast MA) could generate $586.8 million in GGR in its third year of operations from patrons within a two‐hour drive‐time (net of incremental destination visitation or hotel guests).
Figure 35: High case GGR projections, central/western MA location:
Region Three High Case Year 1 Year 2 Year 3 Adults 7,237,988 7,266,940 7,296,008 Avg. annual trips per gaming adult 6.7 6.7 6.7 Region Share of Visits 19.4% 21.6% 24.0% Gaming Value per Visit $132 $134 $136 GGR $348,432,554 $394,915,005 $448,038,971 Slot Win per Unit per Day $217 $246 $279 Table Win per Unit per Day $2,854 $3,235 $3,670 Poker Win per Unit per Day $477 $541 $614 Calculated Gaming Tax @.27 $94,076,790 $106,627,051 $120,970,522 Estimated Gaming Tax Paid $100,000,000 $106,627,051 $120,970,522 Effective Gaming Tax Rate 28.7% 27.0% 27.0% Source: Spectrum Gaming Group.
As illustrated, we project that a gaming facility in Region Three (central/western MA) could generate $448 million in GGR in its third year of operations from patrons within a two‐hour drive‐time (net of incremental destination visitation or hotel guests).

Massachusetts Gross Gaming Revenue Projections 36
Figure 36: High case GGR projections, statewide total:
Total State High Case Year 1 Year 2 Year 3 Adults 9,351,484 9,388,890 9,426,446 Avg. annual trips per gaming adult 6.7 6.7 6.7 MA Share of MA feeder Visits 46.2% 51.4% 57.1% Gaming Value per Visit $156 $159 $162 GGR $1,268,307,812 $1,437,505,711 $1,630,878,979 Slot Win per Unit per Day $263 $298 $338 Table Win per Unit per Day $3,463 $3,925 $4,453 Poker Win per Unit per Day $579 $656 $745 Calculated Gaming Tax @.27 $342,443,109 $388,126,542 $440,337,324 Estimated Gaming Tax Paid $348,366,320 $388,126,542 $440,337,324 Effective Gaming Tax Rate 27.5% 27.0% 27.0% Source: Spectrum Gaming Group.
As illustrated, we project that three gaming facilities located throughout varying regions of Massachusetts could collectively generate in excess of $1.63 billion in GGR in their third year of operations from patrons within a two‐hour drive‐time (net of incremental destination visitation or hotel guests).
The following table shows projected GGR from incremental destination visitation (primarily hotel guests at each casino‐hotel) based upon the three Massachusetts gaming facilities having a collective 6,000 hotel rooms – at our high case scenario.
Figure 37: Incremental destination visitation, high case:
Total State High Case Year 1 Year 2 Year 3 Incremental room‐nights 804,825 827,820 850,815
Percent of available total 37% 38% 39% Gaming Value per Room‐night $391 $397 $404 GGR $314,598,030 $328,763,930 $343,640,498 Source: Spectrum Gaming Group.
As illustrated, we believe that the three potential gaming facilities in Massachusetts having 6,000 hotel rooms could reasonably generate in incremental $343.6 million in GGR, in their third year of operations, by virtue of having hotel rooms.
This implies that, for the third year of operations (stabilized operations), each gaming facility could expect an incremental $57.3 million in GGR from having 1,000 hotel rooms (or $57,273 in GGR annually per hotel room).
The following table shows our projected statewide total GGR, the combination of GGR from adults within a two‐hour drive‐time of each proposed gaming facility coupled with the incremental destination total GGR.

Massachusetts Gross Gaming Revenue Projections 37
Figure 38: Grand total GGR projections, statewide, high case:
Total State High Case Year 1 Year 2 Year 3 GGR $1,582,905,842 $1,766,269,641 $1,974,519,477 Slot Win per Unit per Day $328 $366 $409 Table Win per Unit per Day $4,322 $4,823 $5,392 Poker Win per Unit per Day $723 $807 $902 Calculated Gaming Tax @.27 $427,384,577 $476,892,803 $533,120,259 Estimated Gaming Tax Paid $433,307,788 $476,892,803 $533,120,259 Source: Spectrum Gaming Group.
As illustrated, in our high case scenario, we believe that three gaming facilities located throughout Massachusetts (having supply attributes and characteristics to effectively capture existing demand) could generate more than $1.97 billion in GGR in their third year, and beyond.
At our high case scenario, this $1.97 billion GGR projection for 2016, discounted for estimated inflation, translates into approximately $1.824 billion in 2010/current dollars. Our 2008 report projected GGR to be at $1.777 billion in the third year of operations, after applying inflation rates this figure translates to approximately $1.824 billion in 2010/current dollars.
In summary, at our high case scenario for the third year of operations (in both reports), our overall statewide GGR projection in this updated report does not vary materially from our 2008 report, as the variance 0.0 percent.

Massachusetts Gross Gaming Revenue Projections 38
Gross Gaming Revenue Projections – Secondary Presentation
This section of the report provides a direct update of our 2008 projections, relying on relatively the same assumptions and methodology. The primary variance between this presentation and the Primary Presentation of projections presented in previous section is a refined two‐hour drive‐time collection method. For GGR projections in this updated report this specific section uses ZIP code based population parameters, as opposed to at the county level as presented in our Primary Presentation.
The difference, between using ZIP code adult population and county‐based, is illustrated in the following table, as projected for 2016 or third year of operations.
Figure 39: Adult Population figures – Primary vs. Secondary Scenarios
Adult Population ZIP based County based % Variance Region One 7,867,726 7,938,447 ‐0.9% Region Two 7,030,110 7,186,209 ‐2.2% Region Three 7,769,099 7,296,008 6.5%
Source: Microsoft MapPoint 2010, Spectrum Gaming Group.
Under our moderate case scenario, in the third year of operations or 2016, we project that three gaming facilities located throughout Massachusetts (having supply attributes and characteristics to effectively capture existing demand) have the potential to generate $1.69 billion in GGR in their third year, and beyond.
This $1.69 billion GGR projection for 2016, discounted for estimated inflation, translates into approximately $1.56 billion in 2010/current dollars. Our 2008 report projected GGR to be $1.5 billion in the third year of operations, after applying inflation rates this figure translates to approximately $1.54 billion in 2010/current dollars.
In summary, at our moderate case scenario for the third year of operations (in both reports), our overall statewide GGR projection in this updated report varies favorably by 1.5 percent (or by $23.2 million) from our 2008 report.
The following table shows a comparative of GGR projections from this report to the 2008 report, along with percentage variances, for both nominal and real dollars (inflation adjusted to 2010/current).

Massachusetts Gross Gaming Revenue Projections 39
Figure 40: Moderate case GGR projections, comparative for current vs. 2008 report
NOMINAL VALUE Updated Report 2008 Report % Variance Region One $492,275,818 $438,100,038 12.4% Region Two $478,377,173 $424,347,242 12.7% Region Three $397,575,793 $349,496,437 13.8% Total, from within two‐hour drive‐time $1,368,228,785 $1,211,943,717 12.9% Incremental Destination Visitation $325,903,436 $289,656,283 12.5% Grand Total $1,694,132,221 $1,501,600,000 12.8% REAL VALUE (ADJUSTED FOR INFLATION) Updated Report 2008 Report % Variance
Region One $454,643,898 $449,712,622 1.1% Region Two $441,807,733 $435,595,285 1.4% Region Three $367,183,197 $358,760,432 2.3% Total, from within two‐hour drive‐time $1,263,634,828 $1,244,068,339 1.6% Incremental Destination Visitation $300,989,817 $297,334,114 1.2% Grand Total $1,564,624,645 $1,541,402,452 1.5% Source: Spectrum Gaming Group.
As illustrated, on an inflation adjusted basis, this updated report’s GGR projections are 1.5 percent greater than those that we had projected in our 2008 report.
The following table shows a comparative of GGR projections from this report to the 2008 report, along with percentage variances, for both nominal and real dollars (inflation adjusted to 2010/current) for the low case scenarios from both reports.
Figure 41: Low case GGR projections, comparative for current vs. 2008 report
NOMINAL VALUE Updated Report 2008 Report % Variance Region One $393,820,655 $350,480,031 12.4% Region Two $382,701,739 $339,477,794 12.7% Region Three $318,060,635 $279,597,149 13.8% Total, from within two‐hour drive‐time $1,094,583,028 $969,554,974 12.9% Incremental Destination Visitation $293,313,092 $257,245,026 14.0% Grand Total $1,387,896,120 $1,226,800,000 13.1% REAL VALUE (ADJUSTED FOR INFLATION) Updated Report 2008 Report % Variance
Region One $363,715,119 $359,770,098 1.1% Region Two $353,446,186 $348,476,228 1.4% Region Three $293,746,557 $287,008,345 2.3% Total, from within two‐hour drive‐time $1,010,907,862 $995,254,671 1.6% Incremental Destination Visitation $270,890,835 $264,063,741 2.6% Grand Total $1,281,798,698 $1,259,318,413 1.8% Source: Spectrum Gaming Group.
The following table shows a comparative of GGR projections from this report to the 2008 report, along with percentage variances, for both nominal and real dollars (inflation adjusted to 2010/current) for the high case scenarios from both reports.

Massachusetts Gross Gaming Revenue Projections 40
Figure 42: High case GGR projections, comparative for current vs. 2008 report
NOMINAL VALUE Updated Report 2008 Report % Variance Region One $590,730,982 $525,720,046 12.4% Region Two $574,052,608 $509,216,691 12.7% Region Three $477,090,952 $349,496,437 36.5% Total, from within two‐hour drive‐time $1,641,874,542 $1,384,433,174 18.6% Incremental Destination Visitation $342,198,607 $392,066,826 ‐12.7% Grand Total $1,984,073,150 $1,776,500,000 11.7% REAL VALUE (ADJUSTED FOR INFLATION) Updated Report 2008 Report % Variance
Region One $545,572,678 $539,655,147 1.1% Region Two $530,169,279 $522,714,342 1.4% Region Three $440,619,836 $430,512,518 2.3% Total, from within two‐hour drive‐time $1,516,361,793 $1,492,882,007 1.6% Incremental Destination Visitation $316,039,308 $330,707,136 ‐4.4% Grand Total $1,832,401,101 $1,823,589,143 0.5% Source: Spectrum Gaming Group.
Moderate case GGR projections
The following six sequential tables present the moderate scenario for years one, two, and three for each region, all three combined, hotel tourist visitation for the state, and grand totals.
The following four tables present our moderate case GGR projections for each location and statewide strictly determined by adult population within a two‐hour drive time from each location, further enhanced by expected visitation share to each location based upon proximity of this adult population to respective gaming facility and others in the region.
Figure 43: Moderate case GGR projections, northeast MA location:
Region One Moderate Case Year 1 Year 2 Year 3 Adults 7,805,160 7,836,381 7,867,726 Avg. annual trips per gaming adult 6.7 6.7 6.7 Region Share of Visits 16.0% 18.0% 20.0% Gaming Value per Visit $161 $164 $167 GGR $378,108,468 $433,906,690 $492,275,818 Slot Win per Unit per Day $235 $270 $306 Table Win per Unit per Day $3,097 $3,554 $4,033 Poker Win per Unit per Day $518 $594 $674 Calculated Gaming Tax @.27 $102,089,286 $117,154,806 $132,914,471 Estimated Gaming Tax Paid $102,089,286 $117,154,806 $132,914,471 Effective Gaming Tax Rate 27.0% 27.0% 27.0% Source: Spectrum Gaming Group.
As illustrated we project that a gaming facility in Region One (northeast Massachusetts) could generate $492.3 million in GGR in its third year of operations from patrons within a two‐hour drive‐time (net of incremental destination visitation or hotel guests from farther away).

Massachusetts Gross Gaming Revenue Projections 41
Figure 44: Moderate case GGR projections, southeast MA location:
Region Two Moderate Case Year 1 Year 2 Year 3 Adults 6,974,204 7,002,101 7,030,110 Avg. annual trips per gaming adult 6.7 6.7 6.7 Region Share of Visits 16.0% 18.0% 20.0% Gaming Value per Visit $176 $178 $181 GGR $367,433,161 $421,656,007 $478,377,173 Slot Win per Unit per Day $229 $262 $298 Table Win per Unit per Day $3,010 $3,454 $3,919 Poker Win per Unit per Day $503 $578 $655 Calculated Gaming Tax @.27 $99,206,953 $113,847,122 $129,161,837 Estimated Gaming Tax Paid $100,000,000 $113,847,122 $129,161,837 Effective Gaming Tax Rate 27.2% 27.0% 27.0% Source: Spectrum Gaming Group.
As illustrated, we project that a gaming facility in Region Two (southeastern Massachusetts) could generate $478.4 million in GGR in its third year of operations from patrons within a two‐hour drive‐time (net of incremental destination visitation or hotel guests from beyond the two‐hour drive population).
Figure 45: Moderate case GGR projections, central/western MA location:
Region Three Moderate Case Year 1 Year 2 Year 3 Adults 7,707,317 7,738,147 7,769,099 Avg. annual trips per gaming adult 6.7 6.7 6.7 Region Share of Visits 16.0% 18.0% 20.0% Gaming Value per Visit $132 $134 $136 GGR $305,371,031 $350,435,244 $397,575,793 Slot Win per Unit per Day $190 $218 $247 Table Win per Unit per Day $2,502 $2,871 $3,257 Poker Win per Unit per Day $418 $480 $545 Calculated Gaming Tax @.27 $82,450,178 $94,617,516 $107,345,464 Estimated Gaming Tax Paid $100,000,000 $100,000,000 $107,345,464 Effective Gaming Tax Rate 32.7% 28.5% 27.0% Source: Spectrum Gaming Group.
As illustrated, we project that a gaming facility in Region Three (central/western Massachusetts) could generate $397.6 million in GGR in its third year of operations from patrons within a two‐hour drive‐time (net of incremental destination visitation or hotel guests from beyond two hours).

Massachusetts Gross Gaming Revenue Projections 42
Figure 46: Moderate case GGR projections, statewide total:
Total State Moderate Case Year 1 Year 2 Year 3 Adults 9,351,484 9,388,890 9,426,446 Avg. annual trips per gaming adult 6.7 6.7 6.7 MA Share of MA feeder Visits 38.5% 43.3% 48.1% Gaming Value per Visit $156 $158 $161 GGR $1,050,912,659 $1,205,997,942 $1,368,228,785 Slot Win per Unit per Day $218 $250 $284 Table Win per Unit per Day $2,870 $3,293 $3,736 Poker Win per Unit per Day $480 $551 $625 Calculated Gaming Tax @.27 $283,746,418 $325,619,444 $369,421,772 Estimated Gaming Tax Paid $302,089,286 $331,001,928 $369,421,772 Effective Gaming Tax Rate 28.7% 27.4% 27.0% Source: Spectrum Gaming Group.
As illustrated, we project that three gaming facilities located throughout varying regions of Massachusetts could collectively generate in excess of $1.368 billion in GGR in their third year of operations from patrons within a two‐hour drive‐time (net of incremental destination visitation or hotel guests).
The next table shows projected GGR generated through incremental destination visitation, shown as a statewide total. This is primarily GGR generated due to having a gaming resort facility with hotel rooms, and other significant non‐gaming amenities. The incremental capture is from visitation beyond a two‐hour drive‐time from the three Massachusetts gaming facilities and/or from customers within a two‐hour drive‐time, albeit calculated at a higher GGR per patron worth due to longer visits at each facility via overnight stays.
To determine this incremental GGR, Spectrum utilized a GGR value per occupied room‐night at 2.5‐times the average gaming value per visit from the drive‐in customers. This is based conservatively in part on actual Atlantic City historical experience, including an average 2.0 adults per room. While the GGR worth per room night can and will vary, depending in part on each operator’s casino marketing rewards formula and operating strategies, we believe this is a reasonable and conservative starting point based on the scale of these facilities and comparable past experience.
The following table shows projected GGR from incremental destination visitation (primarily hotel guests at each casino‐hotel) based upon the three Massachusetts gaming facilities having a collective 6,000 hotel rooms.
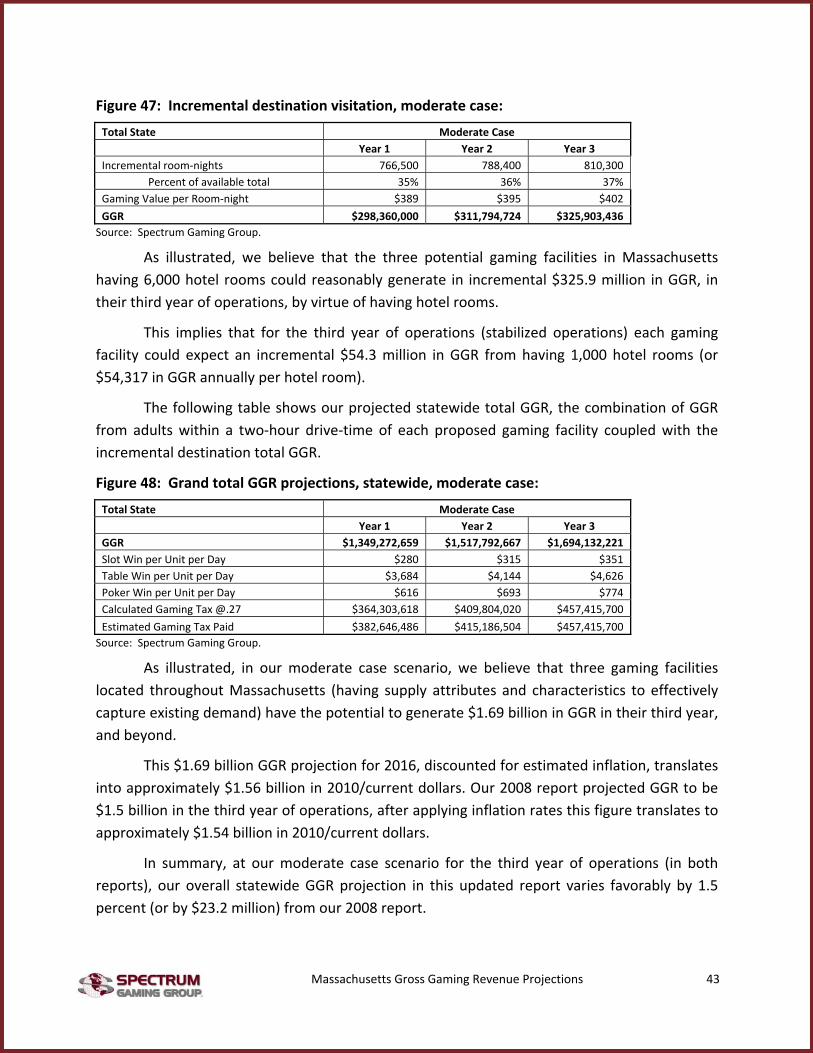
Massachusetts Gross Gaming Revenue Projections 43
Figure 47: Incremental destination visitation, moderate case:
Total State Moderate Case Year 1 Year 2 Year 3 Incremental room‐nights 766,500 788,400 810,300
Percent of available total 35% 36% 37% Gaming Value per Room‐night $389 $395 $402 GGR $298,360,000 $311,794,724 $325,903,436 Source: Spectrum Gaming Group.
As illustrated, we believe that the three potential gaming facilities in Massachusetts having 6,000 hotel rooms could reasonably generate in incremental $325.9 million in GGR, in their third year of operations, by virtue of having hotel rooms.
This implies that for the third year of operations (stabilized operations) each gaming facility could expect an incremental $54.3 million in GGR from having 1,000 hotel rooms (or $54,317 in GGR annually per hotel room).
The following table shows our projected statewide total GGR, the combination of GGR from adults within a two‐hour drive‐time of each proposed gaming facility coupled with the incremental destination total GGR.
Figure 48: Grand total GGR projections, statewide, moderate case:
Total State Moderate Case Year 1 Year 2 Year 3 GGR $1,349,272,659 $1,517,792,667 $1,694,132,221 Slot Win per Unit per Day $280 $315 $351 Table Win per Unit per Day $3,684 $4,144 $4,626 Poker Win per Unit per Day $616 $693 $774 Calculated Gaming Tax @.27 $364,303,618 $409,804,020 $457,415,700 Estimated Gaming Tax Paid $382,646,486 $415,186,504 $457,415,700 Source: Spectrum Gaming Group.
As illustrated, in our moderate case scenario, we believe that three gaming facilities located throughout Massachusetts (having supply attributes and characteristics to effectively capture existing demand) have the potential to generate $1.69 billion in GGR in their third year, and beyond.
This $1.69 billion GGR projection for 2016, discounted for estimated inflation, translates into approximately $1.56 billion in 2010/current dollars. Our 2008 report projected GGR to be $1.5 billion in the third year of operations, after applying inflation rates this figure translates to approximately $1.54 billion in 2010/current dollars.
In summary, at our moderate case scenario for the third year of operations (in both reports), our overall statewide GGR projection in this updated report varies favorably by 1.5 percent (or by $23.2 million) from our 2008 report.
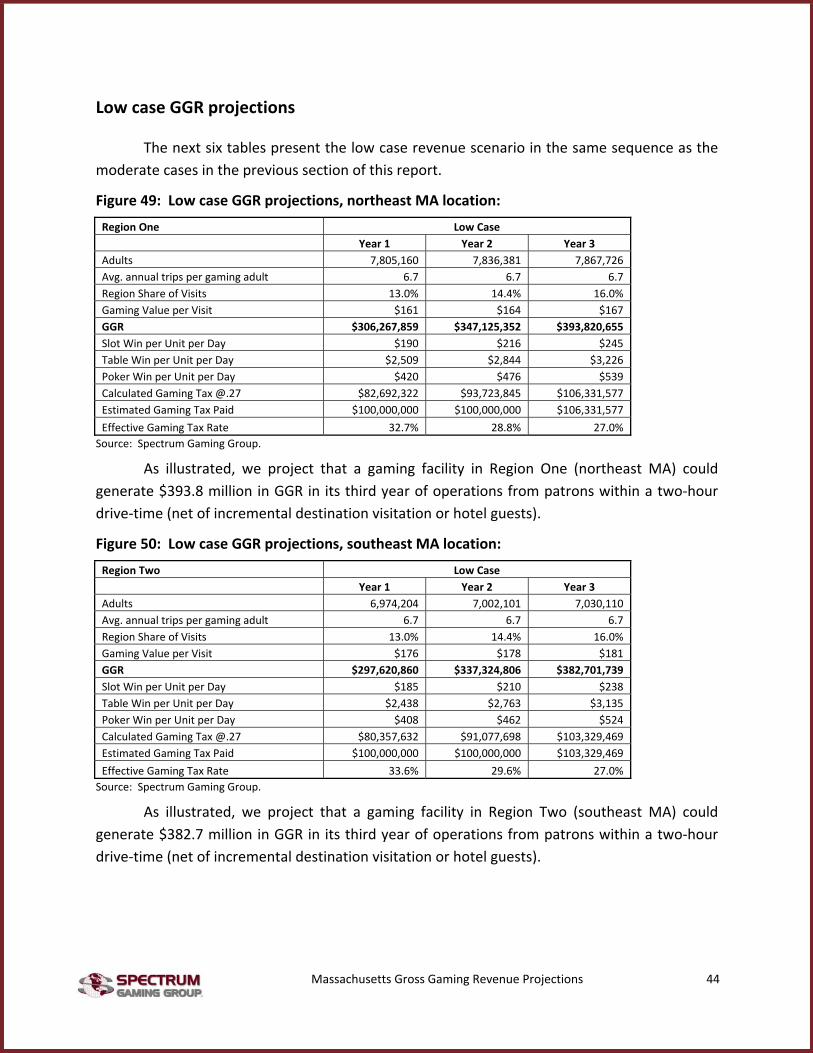
Massachusetts Gross Gaming Revenue Projections 44
Low case GGR projections
The next six tables present the low case revenue scenario in the same sequence as the moderate cases in the previous section of this report.
Figure 49: Low case GGR projections, northeast MA location:
Region One Low Case Year 1 Year 2 Year 3 Adults 7,805,160 7,836,381 7,867,726 Avg. annual trips per gaming adult 6.7 6.7 6.7 Region Share of Visits 13.0% 14.4% 16.0% Gaming Value per Visit $161 $164 $167 GGR $306,267,859 $347,125,352 $393,820,655 Slot Win per Unit per Day $190 $216 $245 Table Win per Unit per Day $2,509 $2,844 $3,226 Poker Win per Unit per Day $420 $476 $539 Calculated Gaming Tax @.27 $82,692,322 $93,723,845 $106,331,577 Estimated Gaming Tax Paid $100,000,000 $100,000,000 $106,331,577 Effective Gaming Tax Rate 32.7% 28.8% 27.0% Source: Spectrum Gaming Group.
As illustrated, we project that a gaming facility in Region One (northeast MA) could generate $393.8 million in GGR in its third year of operations from patrons within a two‐hour drive‐time (net of incremental destination visitation or hotel guests).
Figure 50: Low case GGR projections, southeast MA location:
Region Two Low Case Year 1 Year 2 Year 3 Adults 6,974,204 7,002,101 7,030,110 Avg. annual trips per gaming adult 6.7 6.7 6.7 Region Share of Visits 13.0% 14.4% 16.0% Gaming Value per Visit $176 $178 $181 GGR $297,620,860 $337,324,806 $382,701,739 Slot Win per Unit per Day $185 $210 $238 Table Win per Unit per Day $2,438 $2,763 $3,135 Poker Win per Unit per Day $408 $462 $524 Calculated Gaming Tax @.27 $80,357,632 $91,077,698 $103,329,469 Estimated Gaming Tax Paid $100,000,000 $100,000,000 $103,329,469 Effective Gaming Tax Rate 33.6% 29.6% 27.0% Source: Spectrum Gaming Group.
As illustrated, we project that a gaming facility in Region Two (southeast MA) could generate $382.7 million in GGR in its third year of operations from patrons within a two‐hour drive‐time (net of incremental destination visitation or hotel guests).

Massachusetts Gross Gaming Revenue Projections 45
Figure 51: Low case GGR projections, central/western MA location:
Region Three Low Case Year 1 Year 2 Year 3 Adults 7,707,317 7,738,147 7,769,099 Avg. annual trips per gaming adult 6.7 6.7 6.7 Region Share of Visits 13.0% 14.4% 16.0% Gaming Value per Visit $132 $134 $136 GGR $247,350,535 $280,348,195 $318,060,635 Slot Win per Unit per Day $154 $174 $198 Table Win per Unit per Day $2,026 $2,297 $2,605 Poker Win per Unit per Day $339 $384 $436 Calculated Gaming Tax @.27 $66,784,644 $75,694,013 $85,876,371 Estimated Gaming Tax Paid $100,000,000 $100,000,000 $100,000,000 Effective Gaming Tax Rate 40.4% 35.7% 31.4% Source: Spectrum Gaming Group.
As illustrated, we project that a gaming facility in Region Three (central/western MA) could generate $318 million in GGR in its third year of operations from patrons within a two‐hour drive‐time (net of incremental destination visitation or hotel guests).
Figure 52: Low case GGR projections, statewide total:
Total State Low Case Year 1 Year 2 Year 3 Adults 9,351,484 9,388,890 9,426,446 Avg. annual trips per gaming adult 6.7 6.7 6.7 MA Share of MA feeder Visits 31.2% 34.6% 38.5% Gaming Value per Visit $156 $158 $161 GGR $851,239,254 $964,798,354 $1,094,583,028 Slot Win per Unit per Day $176 $200 $227 Table Win per Unit per Day $2,324 $2,634 $2,989 Poker Win per Unit per Day $389 $441 $500 Calculated Gaming Tax @.27 $229,834,599 $260,495,555 $295,537,418 Estimated Gaming Tax Paid $300,000,000 $300,000,000 $309,661,046 Effective Gaming Tax Rate 35.2% 31.1% 28.3% Source: Spectrum Gaming Group.
As illustrated, we project that three gaming facilities located throughout varying regions of Massachusetts could collectively generate nearly $1.1 billion in GGR in their third year of operations from patrons within a two‐hour drive‐time (net of incremental destination visitation or hotel guests).
The following table shows projected GGR from incremental destination visitation (primarily hotel guests at each casino‐hotel) based upon the three Massachusetts gaming facilities having a collective 6,000 hotel rooms – at our low case scenario.

Massachusetts Gross Gaming Revenue Projections 46
Figure 53: Incremental destination visitation, low case:
Total State Low Case Year 1 Year 2 Year 3 Incremental room‐nights 689,850 709,560 729,270
Percent of available total 32% 32% 33% Gaming Value per Room‐night $389 $395 $402 GGR $268,524,000 $280,615,252 $293,313,092 Source: Spectrum Gaming Group.
As illustrated, we believe that the three potential gaming facilities in Massachusetts having 6,000 hotel rooms could reasonably generate in incremental $293.3 million in GGR, in their third year of operations, by virtue of having hotel rooms.
This implies that for the third year of operations (stabilized operations) each gaming facility could expect an incremental $48.9 million in GGR from having 1,000 hotel rooms (or $48,886 in GGR annually per hotel room).
The following table shows our projected statewide total GGR, the combination of GGR from adults within a two‐hour drive‐time of each proposed gaming facility coupled with the incremental destination total GGR.
Figure 54: Grand total GGR projections, statewide, low case:
Total State Low Case Year 1 Year 2 Year 3 GGR $1,119,763,254 $1,245,413,606 $1,387,896,120 Slot Win per Unit per Day $232 $258 $288 Table Win per Unit per Day $3,058 $3,401 $3,790 Poker Win per Unit per Day $511 $569 $634 Calculated Gaming Tax @.27 $302,336,079 $336,261,674 $374,731,952 Estimated Gaming Tax Paid $372,501,480 $375,766,118 $388,855,581 Source: Spectrum Gaming Group.
As illustrated, in our low case scenario, we believe that three gaming facilities located throughout Massachusetts (having supply attributes and characteristics to effectively capture existing demand) may generate approximately $1.39 billion in GGR in their third year, and beyond.
At our low case scenario, this $1.39 billion GGR projection for 2016, discounted for estimated inflation, translates into approximately $1.28 billion in 2010/current dollars. Our 2008 report projected GGR to be at $1.227 billion in the third year of operations, after applying inflation rates this figure translates to approximately $1.259 billion in 2010/current dollars.
In summary, at our low case scenario for the third year of operations (in both reports), our overall statewide GGR projection in this updated report varies favorably by 1.8 percent (or by $22.5 million) from our 2008 report.

Massachusetts Gross Gaming Revenue Projections 47
High case GGR projections
The next six tables present the high case revenue scenario in the same sequence as the moderate and low casino scenarios cases in the previous two sections of this report.
Figure 55: High case GGR projections, northeast MA location:
Region One High Case Year 1 Year 2 Year 3 Adults 7,805,160 7,836,381 7,867,726 Avg. annual trips per gaming adult 6.7 6.7 6.7 Region Share of Visits 19.4% 21.6% 24.0% Gaming Value per Visit $161 $164 $167 GGR $459,401,788 $520,688,028 $590,730,982 Slot Win per Unit per Day $286 $324 $367 Table Win per Unit per Day $3,763 $4,265 $4,839 Poker Win per Unit per Day $629 $713 $809 Calculated Gaming Tax @.27 $124,038,483 $140,585,768 $159,497,365 Estimated Gaming Tax Paid $124,038,483 $140,585,768 $159,497,365 Effective Gaming Tax Rate 27.0% 27.0% 27.0% Source: Spectrum Gaming Group.
As illustrated, we project that a gaming facility in Region One (northeast MA) could generate $590.7 million in GGR in its third year of operations from patrons within a two‐hour drive‐time (net of incremental destination visitation or hotel guests).
Figure 56: High case GGR projections, southeast MA location:
Region Two High Case Year 1 Year 2 Year 3 Adults 6,974,204 7,002,101 7,030,110 Avg. annual trips per gaming adult 6.7 6.7 6.7 Region Share of Visits 19.4% 21.6% 24.0% Gaming Value per Visit $176 $178 $181 GGR $446,431,291 $505,987,209 $574,052,608 Slot Win per Unit per Day $278 $315 $357 Table Win per Unit per Day $3,657 $4,145 $4,703 Poker Win per Unit per Day $612 $693 $786 Calculated Gaming Tax @.27 $120,536,448 $136,616,546 $154,994,204 Estimated Gaming Tax Paid $120,536,448 $136,616,546 $154,994,204 Effective Gaming Tax Rate 27.0% 27.0% 27.0% Source: Spectrum Gaming Group.
As illustrated, we project that a gaming facility in Region Two (southeast MA) could generate $574.1 million in GGR in its third year of operations from patrons within a two‐hour drive‐time (net of incremental destination visitation or hotel guests).

Massachusetts Gross Gaming Revenue Projections 48
Figure 57: High case GGR projections, central/western MA location:
Region Three High Case Year 1 Year 2 Year 3 Adults 7,707,317 7,738,147 7,769,099 Avg. annual trips per gaming adult 6.7 6.7 6.7 Region Share of Visits 19.4% 21.6% 24.0% Gaming Value per Visit $132 $134 $136 GGR $371,025,802 $420,522,293 $477,090,952 Slot Win per Unit per Day $231 $262 $297 Table Win per Unit per Day $3,039 $3,445 $3,908 Poker Win per Unit per Day $508 $576 $654 Calculated Gaming Tax @.27 $100,176,967 $113,541,019 $128,814,557 Estimated Gaming Tax Paid $100,176,967 $113,541,019 $128,814,557 Effective Gaming Tax Rate 27.0% 27.0% 27.0% Source: Spectrum Gaming Group.
As illustrated, we project that a gaming facility in Region Three (central/western MA) could generate $477.1 million in GGR in its third year of operations from patrons within a two‐hour drive‐time (net of incremental destination visitation or hotel guests).
Figure 58: High case GGR projections, statewide total:
Total State High Case Year 1 Year 2 Year 3 Adults 9,351,484 9,388,890 9,426,446 Avg. annual trips per gaming adult 6.7 6.7 6.7 MA Share of MA feeder Visits 46.7% 51.9% 57.7% Gaming Value per Visit $156 $158 $161 GGR $1,276,858,881 $1,447,197,531 $1,641,874,542 Slot Win per Unit per Day $265 $300 $340 Table Win per Unit per Day $3,487 $3,952 $4,483 Poker Win per Unit per Day $583 $661 $750 Calculated Gaming Tax @.27 $344,751,898 $390,743,333 $443,306,126 Estimated Gaming Tax Paid $344,751,898 $390,743,333 $443,306,126 Effective Gaming Tax Rate 27.0% 27.0% 27.0% Source: Spectrum Gaming Group.
As illustrated, we project that three gaming facilities located throughout varying regions of Massachusetts could collectively generate $1.642 billion in GGR in their third year of operations from patrons within a two‐hour drive‐time (net of incremental destination visitation or hotel guests).
The following table shows projected GGR from incremental destination visitation (primarily hotel guests at each casino‐hotel) based upon the three Massachusetts gaming facilities having a collective 6,000 hotel rooms – at our high case scenario.

Massachusetts Gross Gaming Revenue Projections 49
Figure 59: Incremental destination visitation, high case:
Total State High Case Year 1 Year 2 Year 3 Incremental room‐nights 804,825 827,820 850,815
Percent of available total 37% 38% 39% Gaming Value per Room‐night $389 $395 $402 GGR $313,278,000 $327,384,461 $342,198,607 Source: Spectrum Gaming Group.
As illustrated, we believe that the three potential gaming facilities in Massachusetts having 6,000 hotel rooms could reasonably generate in incremental $342.2 million in GGR, in their third year of operations, by virtue of having hotel rooms.
This implies that for the third year of operations (stabilized operations) each gaming facility could expect an incremental $57.0 million in GGR from having 1,000 hotel rooms (or $57,033 in GGR annually per hotel room).
The following table shows our projected statewide total GGR, the combination of GGR from adults within a two‐hour drive‐time of each proposed gaming facility coupled with the incremental destination total GGR.
Figure 60: Grand total GGR projections, statewide, high case:
Total State High Case Year 1 Year 2 Year 3 GGR $1,590,136,881 $1,774,581,991 $1,984,073,150 Slot Win per Unit per Day $330 $368 $411 Table Win per Unit per Day $4,342 $4,846 $5,418 Poker Win per Unit per Day $726 $810 $906 Calculated Gaming Tax @.27 $429,336,958 $479,137,138 $535,699,750 Estimated Gaming Tax Paid $429,336,958 $479,137,138 $535,699,750 Source: Spectrum Gaming Group.
As illustrated, in our high case scenario, we believe that three gaming facilities located throughout Massachusetts (having supply attributes and characteristics to effectively capture existing demand) could generate more than $1.984 billion in GGR in their third year, and beyond.
At our high case scenario, this $1.984 billion GGR projection for 2016, discounted for estimated inflation, translates into approximately $1.832 billion in 2010/current dollars. Our 2008 report projected GGR to be at $1.777 billion in the third year of operations, after applying inflation rates this figure translates to approximately $1.824 billion in 2010/current dollars.
In summary, at our high case scenario for the third year of operations (in both reports), our overall statewide GGR projection in this updated report varies favorably by 0.5 percent (or by $8.8 million) from our 2008 report.
Massachusetts Gross Gaming Revenue Projections 50
Gross Gaming Revenue Projections – Alternate Presentation
In this step, we adjust one of our key assumptions – the anticipated share of visitation for a casino in the relatively populous Boston area – to determine how this could impact overall revenue to the Commonwealth.
Our alternate presentation illustrates various changes in the anticipated share of revenue for a gaming resort in the three regions. However, per our modeling, the Region One facility which is located within the relatively populous Boston metropolitan area may have the ability to capture much more than our assumed 20 percent share of visits from its respective two‐hour drive‐time, as projected in our Primary and Secondary Presentations in this report.
Any uptick in visitation share would ultimately be based upon the type (i.e. size, scope, attractiveness, level of capital investment and offerings) of gaming resort facility developed at any of the proposed locations, although we believe the greatest opportunity for increased visitation share is at the Region One location. Specifically, the Region One location has excellent demographics within a one‐ and two‐hour drive‐time, and has little to no other gaming competition nearby.
However, we simply do not know what type of facility may be developed in any of the three regions, nor can we speculate as to their ultimate innate appeal to the local population, therefore we deem our 20 percent figure as conservative, but do show examples of how changes in share of revenue impact the projections. Specifically, we show the sensitivity of changes in share of visits and how this impacts the three potential gaming facilities, as well as the overall impact to projected GGR for the Commonwealth.
Share(s) of Market
Projections for the share of visits to each gaming facility in this section of report were developed through gravity modeling. The gravity model is an industry‐standard forecasting technique that uses the population totals around a specified location to project visitation. The farther away a population resides from the target, the lower the probability that adults will make a trip to patronize a gaming facilities in that location. Additionally, if given a choice between two roughly comparable products, gaming customers tend to choose a gaming facility closer to their residence as a primary outlet.
Simply put, a gravity model mathematically predicts a consumer’s purchase decision on several factors, with the primary factor being proximity.
In our 2008 report, and the primary and secondary presentations shown in this report, we assumed that each potential gaming facility in Massachusetts, regardless of proximity to other gaming facilities in the region and population, would capture an equal 20 percent of the

Massachusetts Gross Gaming Revenue Projections 51
respective adults from within a two‐hour drive‐time. However, through use of our gravity model, we can now project that 40.2 percent, 19.5 percent, and 20.7 percent of the adult population within a two‐hour drive of the Region One, Two, and Three gaming facilities, respectively, may be the a potential apportionment of expected visitation.
The 2008 models apportioned market demand shares evenly between the proposed casino projects (at about 20 percent each, irrespective of share of population surrounding each location), partly in keeping with the equal sizes of the projects, and a baseline assumption of uniform attraction within drive‐time population areas. Spectrum presents this alternate presentation to illustrate that, given the three differing locations, it may not necessarily be as realistic to assume equal sizes and equivalent business volumes for each of three potential gaming facilities12. The following presentation uses a proprietary gravity method to assign likely visitation shares of the feeder population on a distance basis from an estimated center point within each ZIP code to each casino location. This results in the weighting of visitation share to each of the three potential gaming facilities based upon distance of their respective adult populations.
The following table shows the visitation share to each gaming facility utilized in GGR projections in this section of report.
Figure 61: Massachusetts market shares from 2‐hour drive‐times: Casino Location State Region 1 Region 2 Region 3 Est. Share of Total MA share
Region 1 Massachusetts 40.2% 39.5% 29.5% 36.4%
Region 2 Massachusetts 18.3% 19.5% 11.1% 16.3%
Region 3 Massachusetts 14.1% 12.7% 20.7% 15.8% 62.3% Source: Spectrum Gaming Group, Microsoft MapPoint 2010 and US Census Bureau data.
This methodology thereby projects that the three Massachusetts casinos will attract differing levels of gaming volume based on proximity of differing population sets, and in total may attract over 60 percent of the total gaming visitation from their combined drive‐time areas (all other factors being equal).
This methodology captures and accounts for feeder population(s) by both size and distance from each existing and proposed casino site, and their relative likelihood of traveling to each based on that distance. The previous method assigned total feeder populations among the competing sites relatively evenly.
Note also that the incremental hotel visitation GGR from outside the drive‐time area has declined somewhat from 2008. This is due primarily to a reduced total room inventory from 6,000 to 5,000, in light of the newer demand findings, and is discussed further below.
12 As stated, one reason for that original assumption in the 2008 report was to help avoid any inference of suggesting favorability or preference for one region or applicant.

Massachusetts Gross Gaming Revenue Projections 52
As detailed in the revenue models to follow, Spectrum’s gravity analysis of the estimated populations did not affect the three Massachusetts sites equally. Region Two and Region Three market population shares shrank somewhat from the prior analysis, while relative share for the Region One location near Boston grew substantially. These adjustments create radically different GGR projections that may lead to additional considerations, as follow.
Sizing of the Casinos
As this methodology suggests, such differing demand would best be served with differing casino capacities, or sizes. Not doing so would result in some degree of excess capacity in one or more places (Regions Two and Three) and inadequate capacity in another (Region One). Excess capacity would represent excess capital investment and a potential challenge to the operator to effectively generate sufficient return on investment. Insufficient capacity would artificially and unnecessarily constrain revenues, and stymie potential growth. Therefore, the updated revenue projections utilize different gaming capacities between the respective regional sites. For estimating purposes, based on the general demand projections, we have sized the Region One project nearly double the capacity of the roughly equivalent Region Two and Region Three sites.
Spectrum is neither advocating nor recommending any casino facility size, or related amenities, for any purpose such as capital spending or return(s) on investment. The casino (and hotel) capacities selected for modeling here were developed in light of the projected, differing demand levels only, and sized approximately to best fit or accommodate those demand levels during both normal and peak business periods in the forecast years, if not longer.
Figure 62: Competitors (2010):
Property Casino/ Resort Type # 0f Slots # of Table
games # of Poker Tables
# of Hotel Rooms
Foxwoods Indian ‐ full‐service resort 7,305 380 104 2,241
Mohegan Sun Indian ‐ full‐service resort 6,394 325 42 1,200
Twin River Racino 4,743 n/a n/a n/aNewport Grand Racino 1,218 n/a n/a n/aSaratoga Racino 1,770 n/a n/a n/aCompetitors' average 4,286 353 73 1,721
Source: Respective casino operator websites.
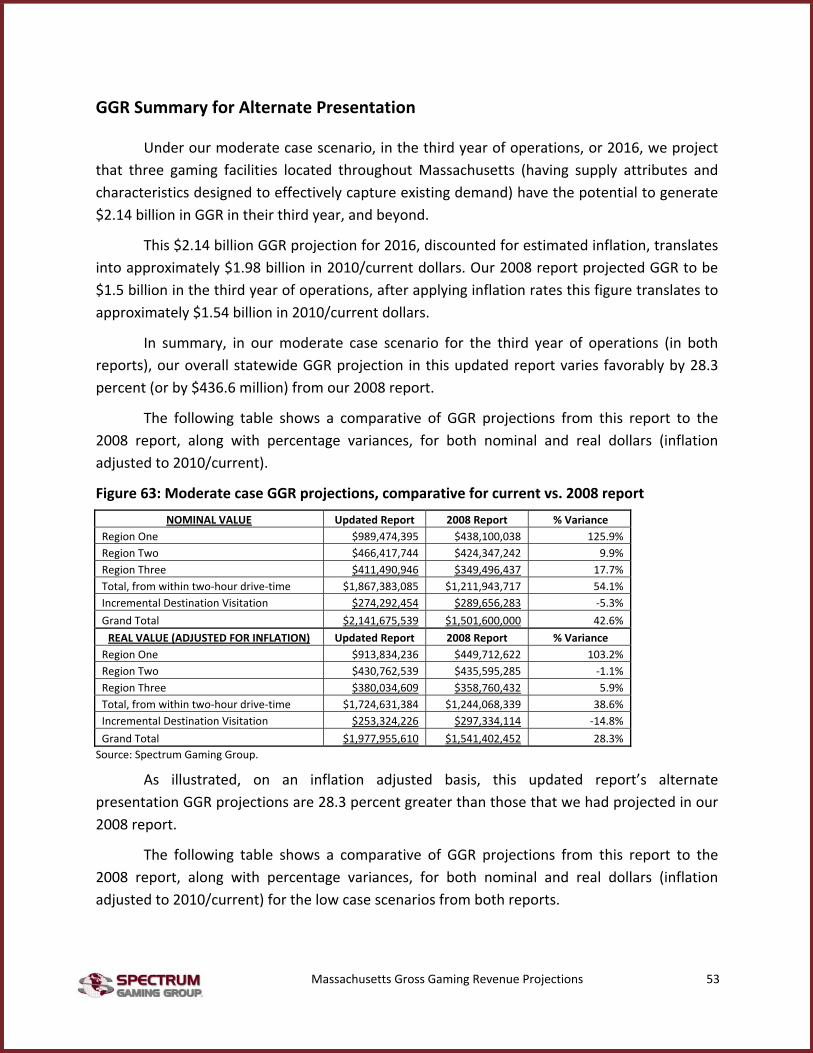
Massachusetts Gross Gaming Revenue Projections 53
GGR Summary for Alternate Presentation
Under our moderate case scenario, in the third year of operations, or 2016, we project that three gaming facilities located throughout Massachusetts (having supply attributes and characteristics designed to effectively capture existing demand) have the potential to generate $2.14 billion in GGR in their third year, and beyond.
This $2.14 billion GGR projection for 2016, discounted for estimated inflation, translates into approximately $1.98 billion in 2010/current dollars. Our 2008 report projected GGR to be $1.5 billion in the third year of operations, after applying inflation rates this figure translates to approximately $1.54 billion in 2010/current dollars.
In summary, in our moderate case scenario for the third year of operations (in both reports), our overall statewide GGR projection in this updated report varies favorably by 28.3 percent (or by $436.6 million) from our 2008 report.
The following table shows a comparative of GGR projections from this report to the 2008 report, along with percentage variances, for both nominal and real dollars (inflation adjusted to 2010/current).
Figure 63: Moderate case GGR projections, comparative for current vs. 2008 report
NOMINAL VALUE Updated Report 2008 Report % Variance Region One $989,474,395 $438,100,038 125.9% Region Two $466,417,744 $424,347,242 9.9% Region Three $411,490,946 $349,496,437 17.7% Total, from within two‐hour drive‐time $1,867,383,085 $1,211,943,717 54.1% Incremental Destination Visitation $274,292,454 $289,656,283 ‐5.3% Grand Total $2,141,675,539 $1,501,600,000 42.6% REAL VALUE (ADJUSTED FOR INFLATION) Updated Report 2008 Report % Variance
Region One $913,834,236 $449,712,622 103.2% Region Two $430,762,539 $435,595,285 ‐1.1% Region Three $380,034,609 $358,760,432 5.9% Total, from within two‐hour drive‐time $1,724,631,384 $1,244,068,339 38.6% Incremental Destination Visitation $253,324,226 $297,334,114 ‐14.8% Grand Total $1,977,955,610 $1,541,402,452 28.3% Source: Spectrum Gaming Group.
As illustrated, on an inflation adjusted basis, this updated report’s alternate presentation GGR projections are 28.3 percent greater than those that we had projected in our 2008 report.
The following table shows a comparative of GGR projections from this report to the 2008 report, along with percentage variances, for both nominal and real dollars (inflation adjusted to 2010/current) for the low case scenarios from both reports.

Massachusetts Gross Gaming Revenue Projections 54
Figure 64: Low case GGR projections, comparative for current vs. 2008 report
NOMINAL VALUE Updated Report 2008 Report % Variance Region One $890,526,955 $350,480,031 154.1% Region Two $419,775,970 $339,477,794 23.7% Region Three $370,341,852 $279,597,149 32.5% Total, from within two‐hour drive‐time $1,680,644,777 $969,554,974 73.3% Incremental Destination Visitation $246,863,209 $257,245,026 ‐4.0% Grand Total $1,927,507,985 $1,226,800,000 57.1% REAL VALUE (ADJUSTED FOR INFLATION) Updated Report 2008 Report % Variance
Region One $822,450,812 $359,770,098 128.6% Region Two $387,686,285 $348,476,228 11.3% Region Three $342,031,148 $287,008,345 19.2% Total, from within two‐hour drive‐time $1,552,168,245 $995,254,671 56.0% Incremental Destination Visitation $227,991,803 $264,063,741 ‐13.7% Grand Total $1,780,160,049 $1,259,318,413 41.4% Source: Spectrum Gaming Group.
The following table shows a comparative of GGR projections from this report to the 2008 report, along with percentage variances, for both nominal and real dollars (inflation adjusted to 2010/current) for the high case scenarios from both reports.
Figure 65: High case GGR projections, comparative for current vs. 2008 report
NOMINAL VALUE Updated Report 2008 Report % Variance Region One $1,088,421,834 $525,720,046 107.0% Region Two $513,059,519 $509,216,691 0.8% Region Three $452,640,041 $349,496,437 29.5% Total, from within two‐hour drive‐time $2,054,121,394 $1,384,433,174 48.4% Incremental Destination Visitation $288,007,077 $392,066,826 ‐26.5% Grand Total $2,342,128,471 $1,776,500,000 31.8% REAL VALUE (ADJUSTED FOR INFLATION) Updated Report 2008 Report % Variance
Region One $1,005,217,659 $539,655,147 86.3% Region Two $473,838,793 $522,714,342 ‐9.4% Region Three $418,038,069 $430,512,518 ‐2.9% Total, from within two‐hour drive‐time $1,897,094,522 $1,492,882,007 27.1% Incremental Destination Visitation $265,990,437 $330,707,136 ‐19.6% Grand Total $2,163,084,959 $1,823,589,143 18.6% Source: Spectrum Gaming Group.
Moderate case GGR projections
The following six sequential tables present the moderate scenario for years one, two, and three for each region, all three combined, hotel tourist visitation for the state, and grand totals.
The following four tables present our moderate case GGR projections for each location and statewide strictly determined by adult population within a two‐hour drive time from each location, further enhanced by expected visitation share to each location based upon proximity of this adult population to respective gaming facility and others in the region.

Massachusetts Gross Gaming Revenue Projections 55
Figure 66: Moderate case GGR projections, northeast MA location:
Region One Moderate Case Year 1 Year 2 Year 3 Adults 7,805,160 7,836,381 7,867,726 Avg. annual trips per gaming adult 6.7 6.7 6.7 Region Share of Visits 32.2% 36.2% 40.2% Gaming Value per Visit $161 $164 $167 GGR $759,998,020 $872,152,448 $989,474,395 Slot Win per Unit per Day $284 $325 $369 Table Win per Unit per Day $3,459 $3,969 $4,503 Poker Win per Unit per Day $595 $683 $775 Calculated Gaming Tax @.27 $205,199,465 $235,481,161 $267,158,087 Estimated Gaming Tax Paid $205,199,465 $235,481,161 $267,158,087 Effective Gaming Tax Rate 27.0% 27.0% 27.0% Source: Spectrum Gaming Group.
As illustrated we project that a gaming facility in Region One (northeast Massachusetts) could generate $989.5 million in GGR in its third year of operations from patrons within a two‐hour drive‐time (net of incremental destination visitation or hotel guests from farther away).
Figure 67: Moderate case GGR projections, southeast MA location:
Region Two Moderate Case Year 1 Year 2 Year 3 Adults 6,974,204 7,002,101 7,030,110 Avg. annual trips per gaming adult 6.7 6.7 6.7 Region Share of Visits 15.6% 17.6% 19.5% Gaming Value per Visit $176 $178 $181 GGR $358,247,332 $411,114,607 $466,417,744 Slot Win per Unit per Day $267 $307 $348 Table Win per Unit per Day $2,935 $3,368 $3,821 Poker Win per Unit per Day $491 $563 $639 Calculated Gaming Tax @.27 $96,726,780 $111,000,944 $125,932,791 Estimated Gaming Tax Paid $100,000,000 $111,000,944 $125,932,791 Effective Gaming Tax Rate 27.9% 27.0% 27.0% Source: Spectrum Gaming Group.
As illustrated, we project that a gaming facility in Region Two (southeastern Massachusetts) could generate $466.4 million in GGR in its third year of operations from patrons within a two‐hour drive‐time (net of incremental destination visitation or hotel guests from beyond the two‐hour drive population).

Massachusetts Gross Gaming Revenue Projections 56
Figure 68: Moderate case GGR projections, central/western MA location:
Region Three Moderate Case Year 1 Year 2 Year 3 Adults 7,707,317 7,738,147 7,769,099 Avg. annual trips per gaming adult 6.7 6.7 6.7 Region Share of Visits 16.6% 18.6% 20.7% Gaming Value per Visit $132 $134 $136 GGR $316,059,017 $362,700,478 $411,490,946 Slot Win per Unit per Day $236 $271 $307 Table Win per Unit per Day $2,589 $2,971 $3,371 Poker Win per Unit per Day $433 $497 $564 Calculated Gaming Tax @.27 $85,335,935 $97,929,129 $111,102,555 Estimated Gaming Tax Paid $100,000,000 $100,000,000 $111,102,555 Effective Gaming Tax Rate 31.6% 27.6% 27.0% Source: Spectrum Gaming Group.
As illustrated, we project that a gaming facility in Region Three (central/western Massachusetts) could generate $411.5 million in GGR in its third year of operations from patrons within a two‐hour drive‐time (net of incremental destination visitation or hotel guests from beyond two hours).
Figure 69: Moderate case GGR projections, statewide total:
Total State Moderate Case Year 1 Year 2 Year 3 Adults 9,351,484 9,388,890 9,426,446 Avg. annual trips per gaming adult 6.7 6.7 6.7 MA Share of MA feeder Visits 52.0% 58.5% 65.0% Gaming Value per Visit $157 $160 $162 GGR $1,434,304,368 $1,645,967,533 $1,867,383,085 Slot Win per Unit per Day $268 $307 $348 Table Win per Unit per Day $3,264 $3,745 $4,249 Poker Win per Unit per Day $524 $601 $682 Calculated Gaming Tax @.27 $387,262,179 $444,411,234 $504,193,433 Estimated Gaming Tax Paid $405,199,465 $446,482,105 $504,193,433 Effective Gaming Tax Rate 28.3% 27.1% 27.0% Source: Spectrum Gaming Group.
As illustrated, we project that three gaming facilities located throughout varying regions of Massachusetts could collectively generate in excess of $1.87 billion in GGR in their third year of operations from patrons within a two‐hour drive‐time (net of incremental destination visitation or hotel guests).
The next table shows projected GGR generated through incremental destination visitation, shown as a statewide total. This is primarily GGR generated due to having a gaming resort facility with hotel rooms, and other significant non‐gaming amenities. The incremental capture is from visitation beyond a two‐hour drive‐time from the three Massachusetts gaming

Massachusetts Gross Gaming Revenue Projections 57
facilities and/or from customers within a two‐hour drive‐time, albeit calculated at a higher GGR per patron worth due to longer visits at each facility via overnight stays.
To determine this incremental GGR, Spectrum utilized a GGR value per occupied room‐night at 2.5‐times the average gaming value per visit from the drive‐in customers. This is based conservatively in part on actual Atlantic City historical experience, including an average 2.0 adults per room. While the GGR worth per room night can and will vary, depending in part on each operator’s casino marketing rewards formula and operating strategies, we believe this is a reasonable and conservative starting point based on the scale of these facilities and comparable past experience.
The following table shows projected GGR from incremental destination visitation (primarily hotel guests at each casino‐hotel) based upon the three Massachusetts gaming facilities having a collective 5,000 hotel rooms.
Figure 70: Incremental destination visitation, moderate case:
Total State Moderate Case Year 1 Year 2 Year 3 Incremental room‐nights 638,750 657,000 675,250
Percent of available total 35% 36% 37% Gaming Value per Room‐night $393 $399 $406 GGR $251,110,874 $262,418,038 $274,292,454 Source: Spectrum Gaming Group.
As illustrated, we believe that the three potential gaming facilities in Massachusetts having 5,000 hotel rooms could reasonably generate in incremental $274.3 million in GGR, in their third year of operations, by virtue of having hotel rooms.
This implies that for the third year of operations (stabilized operations) each gaming facility could expect an incremental $45.7 million in GGR from having 1,000 hotel rooms (or $45,715 in GGR annually per hotel room).
The following table shows our projected statewide total GGR, the combination of GGR from adults within a two‐hour drive‐time of each proposed gaming facility coupled with the incremental destination total GGR.
Figure 71: Grand total GGR projections, statewide, moderate case:
Total State Moderate Case Year 1 Year 2 Year 3 GGR $1,685,415,242 $1,908,385,571 $2,141,675,539 Slot Win per Unit per Day $314 $356 $400 Table Win per Unit per Day $3,835 $4,343 $4,873 Poker Win per Unit per Day $616 $697 $782 Calculated Gaming Tax @.27 $455,062,115 $515,264,104 $578,252,396 Estimated Gaming Tax Paid $472,999,401 $517,334,975 $578,252,396 Source: Spectrum Gaming Group.

Massachusetts Gross Gaming Revenue Projections 58
As illustrated, in our moderate case scenario, we believe that three gaming facilities located throughout Massachusetts (having supply attributes and characteristics to effectively capture existing demand) have the potential to generate $2.14 billion in GGR in their third year, and beyond.
This $2.14 billion GGR projection for 2016, discounted for estimated inflation, translates into approximately $1.98 billion in 2010/current dollars. Our 2008 report projected GGR to be $1.5 billion in the third year of operations, after applying inflation rates this figure translates to approximately $1.54 billion in 2010/current dollars.
In summary, at our moderate case scenario for the third year of operations (in both reports), our overall statewide GGR projection in this updated report varies favorably by 28.3 percent (or by $436.6 million) from our 2008 report.
Low case GGR projections
The next six tables present the low case revenue scenario in the same sequence as the moderate cases in the previous section of this report.
Figure 72: Low case GGR projections, northeast MA location:
Region One Low Case Year 1 Year 2 Year 3 Adults 7,805,160 7,836,381 7,867,726 Avg. annual trips per gaming adult 6.7 6.7 6.7 Region Share of Visits 28.9% 32.6% 36.2% Gaming Value per Visit $161 $164 $167 GGR $683,998,218 $784,937,203 $890,526,955 Slot Win per Unit per Day $255 $293 $332 Table Win per Unit per Day $3,113 $3,572 $4,053 Poker Win per Unit per Day $535 $614 $697 Calculated Gaming Tax @.27 $184,679,519 $211,933,045 $240,442,278 Estimated Gaming Tax Paid $184,679,519 $211,933,045 $240,442,278 Effective Gaming Tax Rate 27.0% 27.0% 27.0% Source: Spectrum Gaming Group.
As illustrated, we project that a gaming facility in Region One (northeast MA) could generate $890.5 million in GGR in its third year of operations from patrons within a two‐hour drive‐time (net of incremental destination visitation or hotel guests).

Massachusetts Gross Gaming Revenue Projections 59
Figure 73: Low case GGR projections, southeast MA location:
Region Two Low Case Year 1 Year 2 Year 3 Adults 6,974,204 7,002,101 7,030,110 Avg. annual trips per gaming adult 6.7 6.7 6.7 Region Share of Visits 14.0% 15.8% 17.6% Gaming Value per Visit $176 $178 $181 GGR $322,422,599 $370,003,146 $419,775,970 Slot Win per Unit per Day $241 $276 $313 Table Win per Unit per Day $2,641 $3,031 $3,439 Poker Win per Unit per Day $442 $507 $575 Calculated Gaming Tax @.27 $87,054,102 $99,900,850 $113,339,512 Estimated Gaming Tax Paid $100,000,000 $100,000,000 $113,339,512 Effective Gaming Tax Rate 31.0% 27.0% 27.0% Source: Spectrum Gaming Group.
As illustrated, we project that a gaming facility in Region Two (southeast MA) could generate $419.8 million in GGR in its third year of operations from patrons within a two‐hour drive‐time (net of incremental destination visitation or hotel guests).
Figure 74: Low case GGR projections, central/western MA location:
Region Three Low Case Year 1 Year 2 Year 3 Adults 7,707,317 7,738,147 7,769,099 Avg. annual trips per gaming adult 6.7 6.7 6.7 Region Share of Visits 14.9% 16.8% 18.6% Gaming Value per Visit $132 $134 $136 GGR $284,453,115 $326,430,430 $370,341,852 Slot Win per Unit per Day $212 $244 $276 Table Win per Unit per Day $2,330 $2,674 $3,034 Poker Win per Unit per Day $390 $447 $507 Calculated Gaming Tax @.27 $76,802,341 $88,136,216 $99,992,300 Estimated Gaming Tax Paid $100,000,000 $100,000,000 $100,000,000 Effective Gaming Tax Rate 35.2% 30.6% 27.0% Source: Spectrum Gaming Group.
As illustrated, we project that a gaming facility in Region Three (central/western MA) could generate $370.3 million in GGR in its third year of operations from patrons within a two‐hour drive‐time (net of incremental destination visitation or hotel guests).

Massachusetts Gross Gaming Revenue Projections 60
Figure 75: Low case GGR projections, statewide total:
Total State Low Case Year 1 Year 2 Year 3 Adults 9,351,484 9,388,890 9,426,446 Avg. annual trips per gaming adult 6.7 6.7 6.7 MA Share of MA feeder Visits 46.8% 52.6% 58.5% Gaming Value per Visit $157 $160 $162 GGR $1,290,873,932 $1,481,370,779 $1,680,644,777 Slot Win per Unit per Day $241 $276 $314 Table Win per Unit per Day $2,937 $3,371 $3,824 Poker Win per Unit per Day $472 $541 $614 Calculated Gaming Tax @.27 $348,535,962 $399,970,110 $453,774,090 Estimated Gaming Tax Paid $384,679,519 $411,933,045 $453,781,790 Effective Gaming Tax Rate 29.8% 27.8% 27.0% Source: Spectrum Gaming Group.
As illustrated, we project that three gaming facilities located throughout varying regions of Massachusetts could collectively generate $1.68 billion in GGR in their third year of operations from patrons within a two‐hour drive‐time (net of incremental destination visitation or hotel guests).
The following table shows projected GGR from incremental destination visitation (primarily hotel guests at each casino‐hotel) based upon the three Massachusetts gaming facilities having a collective 5,000 hotel rooms – at our low case scenario.
Figure 76: Incremental destination visitation, low case:
Total State Low Case Year 1 Year 2 Year 3 Incremental room‐nights 574,875 591,300 607,725
Percent of available total 32% 32% 33% Gaming Value per Room‐night $393 $399 $406 GGR $225,999,787 $236,176,234 $246,863,209 Source: Spectrum Gaming Group.
As illustrated, we believe that the three potential gaming facilities in Massachusetts having 5,000 hotel rooms could reasonably generate in incremental $246.9 million in GGR, in their third year of operations, by virtue of having hotel rooms.
This implies that for the third year of operations (stabilized operations) each gaming facility could expect an incremental $41.1 million in GGR from having 1,000 hotel rooms (or $41,144 in GGR annually per hotel room).
The following table shows our projected statewide total GGR, the combination of GGR from adults within a two‐hour drive‐time of each proposed gaming facility coupled with the incremental destination total GGR.

Massachusetts Gross Gaming Revenue Projections 61
Figure 77: Grand total GGR projections, statewide, low case:
Total State Low Case Year 1 Year 2 Year 3 GGR $1,516,873,718 $1,717,547,014 $1,927,507,985 Slot Win per Unit per Day $283 $320 $360 Table Win per Unit per Day $3,452 $3,908 $4,386 Poker Win per Unit per Day $554 $627 $704 Calculated Gaming Tax @.27 $409,555,904 $463,737,694 $520,427,156 Estimated Gaming Tax Paid $445,699,461 $475,700,628 $520,434,856 Source: Spectrum Gaming Group.
As illustrated, in our low case scenario, we believe that three gaming facilities located throughout Massachusetts (having supply attributes and characteristics to effectively capture existing demand) may generate approximately $1.93 billion in GGR in their third year, and beyond.
At our low case scenario, this $1.93 billion GGR projection for 2016, discounted for estimated inflation, translates into approximately $1.78 billion in 2010/current dollars. Our 2008 report projected GGR to be at $1.227 billion in the third year of operations, after applying inflation rates this figure translates to approximately $1.259 billion in 2010/current dollars.
In summary, at our low case scenario for the third year of operations (in both reports), our overall statewide GGR projection in this updated report varies favorably by 41.4 percent (or by $520.8 million) from our 2008 report.
High case GGR projections
The next six tables present the high case revenue scenario in the same sequence as the moderate and low casino scenarios cases in the previous two sections of this report.
Figure 78: High case GGR projections, northeast MA location:
Region One High Case Year 1 Year 2 Year 3 Adults 7,805,160 7,836,381 7,867,726 Avg. annual trips per gaming adult 6.7 6.7 6.7 Region Share of Visits 35.4% 39.8% 44.2% Gaming Value per Visit $161 $164 $167 GGR $835,997,822 $959,367,692 $1,088,421,834 Slot Win per Unit per Day $312 $358 $406 Table Win per Unit per Day $3,805 $4,366 $4,953 Poker Win per Unit per Day $654 $751 $852 Calculated Gaming Tax @.27 $225,719,412 $259,029,277 $293,873,895 Estimated Gaming Tax Paid $225,719,412 $259,029,277 $293,873,895 Effective Gaming Tax Rate 27.0% 27.0% 27.0% Source: Spectrum Gaming Group.

Massachusetts Gross Gaming Revenue Projections 62
As illustrated, we project that a gaming facility in Region One (northeast MA) could generate $1.09 billion in GGR in its third year of operations from patrons within a two‐hour drive‐time (net of incremental destination visitation or hotel guests).
Figure 79: High case GGR projections, southeast MA location:
Region Two High Case Year 1 Year 2 Year 3 Adults 6,974,204 7,002,101 7,030,110 Avg. annual trips per gaming adult 6.7 6.7 6.7 Region Share of Visits 17.2% 19.3% 21.5% Gaming Value per Visit $176 $178 $181 GGR $394,072,065 $452,226,068 $513,059,519 Slot Win per Unit per Day $294 $337 $383 Table Win per Unit per Day $3,228 $3,705 $4,203 Poker Win per Unit per Day $540 $619 $703 Calculated Gaming Tax @.27 $106,399,458 $122,101,038 $138,526,070 Estimated Gaming Tax Paid $106,399,458 $122,101,038 $138,526,070 Effective Gaming Tax Rate 27.0% 27.0% 27.0% Source: Spectrum Gaming Group.
As illustrated, we project that a gaming facility in Region Two (southeast MA) could generate $513.1 million in GGR in its third year of operations from patrons within a two‐hour drive‐time (net of incremental destination visitation or hotel guests).
Figure 80: High case GGR projections, central/western MA location:
Region Three High Case Year 1 Year 2 Year 3 Adults 7,707,317 7,738,147 7,769,099 Avg. annual trips per gaming adult 6.7 6.7 6.7 Region Share of Visits 18.2% 20.5% 22.8% Gaming Value per Visit $132 $134 $136 GGR $347,664,918 $398,970,526 $452,640,041 Slot Win per Unit per Day $259 $298 $338 Table Win per Unit per Day $2,848 $3,268 $3,708 Poker Win per Unit per Day $476 $547 $620 Calculated Gaming Tax @.27 $93,869,528 $107,722,042 $122,212,811 Estimated Gaming Tax Paid $100,000,000 $107,722,042 $122,212,811 Effective Gaming Tax Rate 28.8% 27.0% 27.0%
Source: Spectrum Gaming Group.
As illustrated, we project that a gaming facility in Region Three (central/western MA) could generate $452.6 million in GGR in its third year of operations from patrons within a two‐hour drive‐time (net of incremental destination visitation or hotel guests).

Massachusetts Gross Gaming Revenue Projections 63
Figure 81: High case GGR projections, statewide total:
Total State High Case Year 1 Year 2 Year 3 Adults 9,351,484 9,388,890 9,426,446 Avg. annual trips per gaming adult 6.7 6.7 6.7 MA Share of MA feeder Visits 57.2% 64.3% 71.5% Gaming Value per Visit $157 $160 $162 GGR $1,577,734,805 $1,810,564,286 $2,054,121,394 Slot Win per Unit per Day $294 $338 $383 Table Win per Unit per Day $3,590 $4,120 $4,674 Poker Win per Unit per Day $576 $661 $750 Calculated Gaming Tax @.27 $425,988,397 $488,852,357 $554,612,776 Estimated Gaming Tax Paid $432,118,869 $488,852,357 $554,612,776 Effective Gaming Tax Rate 27.4% 27.0% 27.0% Source: Spectrum Gaming Group.
As illustrated, we project that three gaming facilities located throughout varying regions of Massachusetts could collectively generate $2.05 billion in GGR in their third year of operations from patrons within a two‐hour drive‐time (net of incremental destination visitation or hotel guests).
The following table shows projected GGR from incremental destination visitation (primarily hotel guests at each casino‐hotel) based upon the three Massachusetts gaming facilities having a collective 5,000 hotel rooms – at our high case scenario.
Figure 82: Incremental destination visitation, high case:
Total State High Case Year 1 Year 2 Year 3 Incremental room‐nights 670,688 689,850 709,013
Percent of available total 37% 38% 39% Gaming Value per Room‐night $393 $399 $406 GGR $263,666,418 $275,538,940 $288,007,077 Source: Spectrum Gaming Group.
As illustrated, we believe that the three potential gaming facilities in Massachusetts having 5,000 hotel rooms could reasonably generate in incremental $288 million in GGR, in their third year of operations, by virtue of having hotel rooms.
This implies that for the third year of operations (stabilized operations) each gaming facility could expect an incremental $48 million in GGR from having 1,000 hotel rooms (or $48,001 in GGR annually per hotel room).
The following table shows our projected statewide total GGR, the combination of GGR from adults within a two‐hour drive‐time of each proposed gaming facility coupled with the incremental destination total GGR.

Massachusetts Gross Gaming Revenue Projections 64
Figure 83: Grand total GGR projections, statewide, high case:
Total State High Case Year 1 Year 2 Year 3 GGR $1,841,401,223 $2,086,103,226 $2,342,128,471 Slot Win per Unit per Day $344 $389 $437 Table Win per Unit per Day $4,190 $4,747 $5,330 Poker Win per Unit per Day $673 $762 $856 Calculated Gaming Tax @.27 $497,178,330 $563,247,871 $632,374,687 Estimated Gaming Tax Paid $503,308,802 $563,247,871 $632,374,687 Source: Spectrum Gaming Group.
As illustrated, in our high case scenario, we believe that three gaming facilities located throughout Massachusetts (having supply attributes and characteristics to effectively capture existing demand) could generate more than $2.3 billion in GGR in their third year, and beyond.
At our high case scenario, this $2.3 billion GGR projection for 2016, discounted for estimated inflation, translates into approximately $2.16 billion in 2010/current dollars. Our 2008 report projected GGR to be at $1.777 billion in the third year of operations, after applying inflation rates this figure translates to approximately $1.824 billion in 2010/current dollars.
In summary, at our high case scenario for the third year of operations (in both reports), our overall statewide GGR projection in this updated report varies favorably by 18.6 percent (or by $339.5 million) from our 2008 report.
Sensitivity Analysis based on changes to Region One Share of Visitation
This sensitivity analysis shows projected GGR for a Region One gaming facility and total statewide results based upon various levels of share of visitation for the Region One facility, while keeping the Region Two and Region Three facilities at a constant 20 percent estimated share of visitation. Projections are shown at our moderate case scenario for year three of operations, or 2016. This effectively illustrates the bridge between our primary presentation (with Region One at 20 percent share of visitation) and our alternate projection, with Region Three capturing a 40.2 percent share of visitation.
The following table shows GGR for Region One, based upon various visitor share percentages, and GGR results for the Commonwealth based upon the Region One scenario while holding Region Two and Region Three at a constant 20 percent share of visitation (additionally, it is assumed that the Region One facility would have 2,000 hotel rooms contributing destination tourism GGR which is included in total).

Massachusetts Gross Gaming Revenue Projections 65
Figure 84: GGR sensitivity based upon Region One share of visitation
Region One ‐ visitor share Region One Total MA
20.0% $605,792,953 $1,646,321,392 25.0% $728,861,907 $1,769,390,347 30.0% $851,930,862 $1,892,459,301 35.0% $974,999,817 $2,015,528,256 40.0% $1,098,068,771 $2,138,597,211 40.2% $1,102,991,529 $2,143,519,969
Source: Spectrum Gaming Group.
As illustrated, we project that a Region One facility may have GGR ranging between $601 million and $1.1 billion conditional upon many factors (moderate case scenario). These factors include qualitative and quantitative components (i.e. – innate appeal to local adults of the facility, level of capital invested, both gaming and non‐gaming quantity and quality of offerings, etc.). We do not have the ability to accurately determine and predict what may or may not occur with respect to any potential gaming facility in the Commonwealth, specifically for a Region One facility. Therefore we show this sensitivity analysis for illustrative purposes to show the magnitude of GGR, as this output is conditional upon share of visitation.
This aforementioned range of GGR contributed by a Region One facility may then create a GGR range of $1.6 billion to over $2.1 billion for the statewide total with all three regional gaming facilities – again assuming that Region Two and Region Three are held constant at 20 percent share of visitation throughout.
Based upon an assumed 27 percent effective and direct tax on GGR, the GGR forecasted results presented in the previous table would yield the following taxes for Massachusetts.
Figure 85: GGR taxes, sensitivity based upon Region One share of visitation
Region One ‐ visitor share Region One Total MA
20.0% $163,564,097 $444,506,776 25.0% $196,792,715 $477,735,394 30.0% $230,021,333 $510,964,011 35.0% $263,249,950 $544,192,629 40.0% $296,478,568 $577,421,247 40.2% $297,807,713 $578,750,392
Source: Spectrum Gaming Group
This hypothetical scenario presented illustrates the importance of share of visitation, and to a great degree location of the gaming facilities, as when share of visitation is maximized, the effects may be profound – both for the Commonwealth and the gaming operator.

Massachusetts Gross Gaming Revenue Projections 66
Recapture of Massachusetts Gaming Dollars
Spectrum’s previous 2008 analysis estimated “that Massachusetts residents have been spending an estimated $1.1 billion annually on gaming (alone) in Connecticut and Rhode Island. This estimate is extrapolated from our existing Massachusetts gaming population model, adapted for the out‐of‐state destinations.”13 We have now updated this finding, as well as run a similar estimate based upon the more granular population by US ZIP code data, both with results highly similar to the previous estimate.
This demonstrates that three Massachusetts gaming facilities, as detailed in this report, may reasonably capture a significant share of the GGR generated by residents within two‐hour drive‐time of Foxwoods and Mohegan Sun in Connecticut. This is critically important as the two‐hour drive‐time from either Foxwoods or Mohegan Sun covers the vast majority of the Commonwealth of Massachusetts, particularly the major population areas.
Figure 86: Prior method and current cross‐check of GGR outflow from Massachusetts:
MA population (2007) by County MA population by ZIP Code
Bristol 550,385
Franklin 72,657
Hampden 463,549
Hampshire 153,717
Middlesex 1,455,021
Norfolk 654,490
Plymouth 499,528
Suffolk 640,695
Worcester 795,432
Massachusetts 2009 total 5,327,842 5,839,460
Estimated adults 3,921,292 4,297,843
Gaming Participation rate 0.28 0.28
Annual trip average 6.7 6.7
Average trip gaming spend $145 $145
Estimated annual total $1,066,507,320 $1,168,920,993 Source: Spectrum Gaming Group.
Note that the above two estimates are both based on 2009 population levels, not future projections, in order to update the approximate current gaming spend by Massachusetts adults outside of their state. The left‐side values reflect the same county population method used in 2008, only updated from 2007 population estimates to 2009, resulting in the $1.067 billion. The right‐side amounts use the more accurate, and somewhat larger, ZIP code population counts,
13 The Impacts of Expanded Gaming on the Commonwealth of Massachusetts, Spectrum Gaming, page 93, August 1, 2008.

Massachusetts Gross Gaming Revenue Projections 67
also per 2009, then apply the same participation and spending rates to reach the $1.17 billion estimate, 9.7 percent higher. (Neither population total represents all of Massachusetts, rather most of it – those areas within a two‐hour drive of the existing out‐of‐state casinos.)
To then put this estimate into context of the projected Massachusetts gaming revenues, we used the moderate case GGR projections statewide total and inserted the projected 2016 total for the in‐state population above as a subset of the total feeder population in that table, yielding the following projections:
Figure 87: Moderate case GGR with estimate of MA in‐state recapture:
Total State Moderate Case Year 1 Year 2 Year 3 Adults 9,351,484 9,388,890 9,426,446 Avg. annual trips per gaming adult 6.7 6.7 6.7 MA Share of MA feeder Visits 38.1% 42.8% 47.6% Gaming Value per Visit $156 $159 $162 GGR $1,043,874,742 $1,197,921,426 $1,359,065,816 Massachusetts‐only Adults 4,372,275 4,386,703 4,399,425 Massachusetts‐only GGR $488,062,334 $559,696,170 $634,290,796 Percent of total GGR 46.8% 46.7% 46.7% Source: Spectrum Gaming Group.
We see in the previous table that, by Year Three, Massachusetts may recapture about $634 million of gaming spend by Massachusetts adults, or 46.7 percent of total GGR. This represents about 54.3 percent of the $1.17 billion current outflow spending estimate. (Note that the $634 million represents “recapture” of future gaming revenue, while it equates to 54.3 percent of a current estimate.)
Applying the same methodology to Spectrum’s low case and high case GGR scenarios, the following broader range of projections results:
Figure 88: Low case GGR with estimate of MA in‐state recapture:
Total State Low Case Year 1 Year 2 Year 3 Adults 9,351,484 9,388,890 9,426,446 Avg. annual trips per gaming adult 6.7 6.7 6.7 MA Share of MA feeder Visits 30.8% 34.3% 38.1% Gaming Value per Visit $156 $159 $162 GGR $845,538,541 $958,337,141 $1,087,252,653 Massachusetts‐only Adults 4,372,275 4,386,703 4,399,425 Massachusetts‐only GGR $395,330,490 $447,756,936 $507,432,637 Percent of total GGR 46.8% 46.7% 46.7% Source: Spectrum Gaming Group.
The low case and high case scenarios then present a potential range, from lowest likely recaptured annual gaming revenue of about $395 million in year one, to highest likely recaptured GGR of about $761 million in year three.

Massachusetts Gross Gaming Revenue Projections 68
Figure 89: High case GGR with estimate of MA in‐state recapture:
Total State High Case Year 1 Year 2 Year 3 Adults 9,351,484 9,388,890 9,426,446 Avg. annual trips per gaming adult 6.7 6.7 6.7 MA Share of MA feeder Visits 46.2% 51.4% 57.1% Gaming Value per Visit $156 $159 $162 GGR $1,268,307,812 $1,437,505,711 $1,630,878,979 Massachusetts‐only Adults 4,372,275 4,386,703 4,399,425 Massachusetts‐only GGR $592,995,735 $671,635,403 $761,148,955 Percent of total GGR 46.8% 46.7% 46.7% Source: Spectrum Gaming Group.
The following map is the converse of the previous map of the potential Massachusetts casinos’ drive‐time areas, illustrating instead current two‐hour drive‐time perimeters for the Connecticut casinos and one‐hour drive‐time areas for the Rhode Island racinos. Note their substantial reach into most of Massachusetts.
Figure 90: CT and RI gaming drive‐time areas and casino locations:
Source: Microsoft MapPoint 2010, Spectrum Gaming Group.
We see here again that Connecticut and Rhode Island casinos are dependent on Massachusetts demand for a substantial share of their gaming volume. While the amounts above are estimates based solely on relative population proximity and locale, they provide added strength to the case that Massachusetts casinos could not only “grow the market” for

Massachusetts Gross Gaming Revenue Projections 69
gaming in the region, but may reclaim significant spending – and tax revenues – now captured by other states.
Under the alternative scenario detailed earlier, the recapture rate would increase. This is largely reflective of an assumption that a Boston‐area facility – which is less susceptible to existing out‐of‐state competition ‐ would capture a greater share of business.
Under that scenario, by Year Three, Massachusetts would recapture about $869 million of gaming spend by Massachusetts adults, or 46.5 percent of total GGR. This represents about 78 percent of the $1.17 billion current outflow spending estimate. (Note that the $869 million represents “recapture” of future gaming revenue, while it equates to 78 percent of a current estimate.)

Massachusetts Gross Gaming Revenue Projections 70
Reasonableness of Spectrum’s GGR projections/modeling
Spectrum Gaming believes its modeling to project GGR results for Massachusetts is very reasonable. We validate this statement testing our models and/or comparing our findings to other jurisdictions, or gaming facility operations, in the Northeast US.
Our modeling applied to Foxwoods and Mohegan Sun in CT
To test the reasonableness of our model, we replicated it and applied it to the Mohegan Sun and Foxwoods in Connecticut (in our moderate case). Based upon a combined two‐hour drive‐time from the two facilities and applying contribution from their hotel rooms, our modeling indicates current GGR of $1.964 billion to $2.2 billion.
Spectrum estimates that GGR for Mohegan Sun and Foxwoods combined was $2.164 billion for the 12 months ended September 2009. This actual result is well within reason with respect to our GGR projections in this updated report.
The following table shows our Connecticut GGR build‐up based upon the 2009 estimated population and our estimate of the share of the combined two‐hour drive‐time that Mohegan Sun and Foxwoods, collectively, are capturing (nearly 80%).
Figure 91: CT GGR Build‐up (2009) replicating Spectrum's Methodology for MA
Est. Contribution from 2‐Hour Drive‐time CT ‐ Mohegan Sun & Foxwoods Low Mid High 2‐hour Drive‐time Population 11,468,180 11,468,180 11,468,180 Est. Adult % 73.2% 73.2% 73.2% Adults 8,394,708 8,394,708 8,394,708 Gaming Incidence Rate 0.28 0.28 0.28 Gamers 2,350,518 2,350,518 2,350,518 Avg. annual trips per adult 6.7 6.7 6.7 Annual Gaming Visits 15,748,472 15,748,472 15,748,472 CT Share of Visits 75.0% 80.0% 85.0% Est. Gaming Visits 11,811,354 12,598,777 13,386,201 Gaming Value per Visit $150 $150 $150 GGR $1,771,703,055 $1,889,816,592 $2,007,930,129
Est. Contribution from Hotel Rooms CT ‐ Mohegan Sun & Foxwoods Low Mid High Incremental room‐nights (avg. 2.0 persons) 514,694 514,694 514,694
Percent of available total 36% 36% 36% Gaming Value per Room‐night $375 $375 $375 GGR $193,010,175 $193,010,175 $193,010,175
Combined Totals: CT ‐ Mohegan Sun & Foxwoods Low Mid High GGR $1,964,713,230 $2,082,826,767 $2,200,940,304
Source: Spectrum Gaming Group

Massachusetts Gross Gaming Revenue Projections 71
The following table shows our estimated GGR for Mohegan Sun and Foxwoods (Connecticut total) on an annual basis for 2005 through 2009.14 Gaming revenue figures for Mohegan Sun are actual amounts – slot revenue per the East Coast Slot report and table and poker revenue figures per their annual reports. Slot revenue for Foxwoods is the actual amount per the East Coast Slot Report, while table and poker revenue figures were estimated based upon actual slot market share (assumed to be same for table games).
Figure 92: Est. GGR for CT gaming facilities, FY 2005‐2009
$M Mohegan Sun Foxwoods CT Total
FY ended Slot Rev. Mkt. Share Slot Rev.
Mkt. Share Slot Rev.
2005 $860.9 51.3% $817.2 48.7% $1,678.1 2006 $905.0 52.7% $812.8 47.3% $1,717.8 2007 $921.7 52.3% $841.7 47.7% $1,763.4 2008 $883.5 51.9% $817.7 48.1% $1,701.3 2009 $807.6 52.0% $745.1 48.0% $1,552.7 Avg. $875.7 52.0% $806.9 48.0% $1,682.7
FY ended Table/Poker Rev. Mkt. Share
Est. Table/Poker Rev.
Mkt. Share
Est. Table/Poker Rev.
2005 $334.0 51.3% $317.0 48.7% $651.0 2006 $366.0 52.7% $328.7 47.3% $694.7 2007 $386.4 52.3% $352.9 47.7% $739.2 2008 $375.4 51.9% $347.4 48.1% $722.8 2009 $317.9 52.0% $293.3 48.0% $611.2 Avg. $355.9 52.1% $327.9 47.9% $683.8
FY ended GGR Mkt. Share Est. GGR
Mkt. Share Est. GGR
2005 $1,194.9 51.3% $1,134.2 48.7% $2,329.1 2006 $1,271.0 52.7% $1,141.5 47.3% $2,412.5 2007 $1,308.0 52.3% $1,194.6 47.7% $2,502.6 2008 $1,258.9 51.9% $1,165.2 48.1% $2,424.1 2009 $1,125.5 52.0% $1,038.4 48.0% $2,163.9 Avg. $1,231.7 52.0% $1,134.8 48.0% $2,366.4
Source: Mohegan Tribal Gaming Authority annual reports, Gaming Industry Observer’s East Coast Slot Report, Spectrum Gaming Group.
While this is an approximation of total GGR generated by Foxwoods and Mohegan Sun in Connecticut, we do believe their GGR consistently exceeds $2 billion annually, while our independent modeling for three potential gaming facilities in Massachusetts projects GGR nearing these results in 2010/current dollars (at $1.56 billion in our moderate case scenario in year three for our primary and secondary presentations, as well as compared to our alternate projection at $1.98 billion – all in 2010/current dollars).
14 Fiscal years shown, all ended September 30 each year.

Massachusetts Gross Gaming Revenue Projections 72
GGR projections for MA compared to eastern PA results
Interestingly, eastern Pennsylvania (basically all sections east of Harrisburg) within a three‐hour drive‐time from Atlantic City is a region that is quite similar to Massachusetts in size and population. In terms of land area, Massachusetts and eastern Pennsylvania are within 4.3 percent of each other at 8,284 square miles and 8,653 square miles, respectively.15 The following table compares the two regions in total area and population.16
Figure 93: MA compared to eastern PA, size and population
Massachusetts Eastern Pennsylvania MA vs. Eastern PA
Year ended: 2009 2009 Variance
Land Area (Sq. Miles) 8,284 8,653 (369) (4.3%)
Population (2009) 6,516,818 7,095,143 (578,325) (8.2%)
Est. Adult Population (2009) 4,770,310 5,257,501 (487,190) (9.3%) Source: US Census Bureau, Spectrum Gaming Group.
Through 2009, there were six gaming facilities operating in eastern Pennsylvania.17 These six gaming facilities, having slot product only and with a partial year of operations for Sands Bethlehem, generated $1.7 billion in GGR (slot revenue only). Our moderate projection for slot revenue from our primary presentation for Massachusetts slot revenue for year ending 2016, adjusted to 2010/current dollars is $1.06 billion – which is 37.6 percent less than the performance level of a comparable region.
Figure 94: MA 2016 projections vs. eastern PA 2009 results, GGR
Massachusetts Eastern Pennsylvania MA vs. Eastern PA
Year ending/ended: 2010/current dollars 2009 Variance
Number of Casinos 3 6 (3) (50.0%)
Slot Revenue $1,060,610,095 $1,700,714,025 ($640,103,929) (37.6%)
Table Games & Poker Revenue $496,820,294 $0 $496,820,294 n/a
Gross Gaming Revenue $1,557,430,389 $1,700,714,025 ($143,283,635) (8.4%) Source: Spectrum Gaming Group, Gaming Industry Observer’s East Coast Slot Report.
We deem this as specifically relevant to the Massachusetts potential gaming market, as presented in this report, since the eastern Pennsylvania gaming facilities opened with mature gaming markets and operators in neighboring states. For example, the Atlantic City casino‐hotels (long established) are within a two‐hour drive for a majority of the population in eastern Pennsylvania, as is Delaware Park in northern Delaware near the state‐line with Pennsylvania. This mirrors, to a great degree, the situation that potential Massachusetts casinos could
15 US Census Bureau State & County Quickfacts, http://quickfacts.census.gov/qfd/index.html (accessed March 25, 2010). 16 Ibid. 17 Per Gaming Industry Observer’s East Coast Slot Report. These were: Harrah’s Chester, Parx, Hollywood, Mohegan Sun at Pocono Downs, Mount Airy, and Sand’s Bethlehem.

Massachusetts Gross Gaming Revenue Projections 73
encounter, as Mohegan Sun and Foxwoods in Connecticut, as well as the two racinos in Rhode Island share a similar juxtaposition to Massachusetts (as eastern Pennsylvania shares with Atlantic City and Delaware).
With table game product coming online in 2010, with additional facilities opening, and as the industry continues to mature, we project that GGR for eastern Pennsylvania gaming facilities could exceed $2.1 billion in 2010.
Figure 95: MA 2016 projections vs. eastern PA 2010 projected results, GGR
Massachusetts Eastern Pennsylvania MA vs. Eastern PA
Year ending: 2010/current dollars 2010 Variance
Number of Casinos 3 7 (4) (57.1%)
Slot Revenue $1,060,610,095 $2,017,298,750 ($956,688,655) (47.4%)
Table Games & Poker Revenue $496,820,294 $88,872,000 $407,948,294 459.0%
Gross Gaming Revenue $1,557,430,389 $2,106,170,750 ($548,740,361) (26.1%) Source: Spectrum Gaming Group, Gaming Industry Observer’s East Coast Slot Report.
Our moderate projection from our primary presentation for Massachusetts GGR for year ending 2016, adjusted to 2010/current dollars is $1.56 billion. This amount would be 26.1 percent less than our projection for eastern Pennsylvania in 2010. This demonstrates that a Massachusetts gaming market generating approximately $1.5 billion to $1.6 billion in GGR (at moderate scenario in year three, from our primary and secondary presentations) is indeed reasonable with respect to recent history in eastern Pennsylvania, where a similar operating environment based upon size, population, and nearby gaming competition exists. Furthermore, this comparison shows our GGR projections for Massachusetts reasonable even at our moderate case alternative presentation with GGR at $1.98 billion in 2010/current dollars.
GGR projections for northeast MA facility compared to other regional facilities and locations
To support the estimates for a Boston area casino (with GGR ranging from $890 million to $1.09 billion annually, from customers within a two‐hour drive time, based on our three scenarios in 2016 from our alternative presentation) we examined the two combined Philadelphia area casinos (both near Philadelphia). Our 2016 GGR projection from the alternative presentation ranges between $822 million and $1.0 billion when adjusted for inflation to 2010/current dollars.
Harrah’s Chester casino, in Delaware County just south of Philadelphia, and Parx casino, in Bucks County just north of Philadelphia, generated $822 million in GGR for the 12 months ended January 2010, from more than 5,000 slot units. We underscore that this GGR figure is entirely slot revenue, as there is no live table game or live poker product currently in
Massachusetts Gross Gaming Revenue Projections 74
Pennsylvania. In addition to GGR coming from slot product only, there is no hotel and material non‐gaming amenity set at either of the two gaming facilities.
Aside from the Philadelphia area GGR results, and much closer to Massachusetts, Mohegan Sun and Foxwoods each have posted slot‐revenue only results of $800 million and $736 million, respectively, through last twelve months ended January 2010. Meanwhile, Empire City at Yonkers, with a very limited gaming product (central determinate VLT system) and limited hours (closed from 2am to 10am each day) is nearing $550 million in annual gaming revenue – again without a hotel component and with very limited non‐gaming amenities.

Massachusetts Gross Gaming Revenue Projections 75
Qualitative, capital expense considerations
As mentioned in this analysis, and discussed at length in Spectrum’s previous report,18 the Commonwealth may need to consider the selection and types of gaming facilities to be established within the context of an existing competitive marketplace. Any potential revenue projections must be made with the assumption of a level of at least parity in product offerings with those of neighboring competitors in order for such forecasts to be realistic and plausible. This, in turn, underscores the importance of levels of capital investment in this process. Destination‐type resorts offer a diversity of amenities beyond gaming, thereby attracting a broader visitor base of adults who have more discretionary income, and thus increased spending options. Such facilities are more durable economically, and create more employment than would properties with fewer offerings, such as slots‐only facilities or racinos. Given the existing Connecticut casino‐resorts in the Massachusetts market, future new facilities may have to provide competitive offerings in order to sustainably succeed. Well‐planned, well‐funded facilities, such as the aforementioned Borgata in Atlantic City, with a range of consumer options, create greater customer trial, retention, and spending levels over time, than do lesser facilities of narrower scope.
The positive correlation between capital investment and GGR results is best illustrated by looking at 30‐plus years of gaming‐centric history, specifically the historical relationship of the two metrics for the New Jersey gaming industry. With ever‐increasing gaming product supply being added in the region (and the threat of expanded, or new, gaming facilities in neighboring States), the amount and quality of new capital spending is a critical factor for the future of the market in not only generating gaming visits but also by increasing tourism attraction factors appealing to a wide audience of lifestyles.
The following chart shows the historical relationship between capital investment and GGR results for the New Jersey gaming industry, specifically the casino‐hotels located in Atlantic City.
18 The Impacts of Expanded Gaming on the Commonwealth of Massachusetts, Spectrum Gaming, August 1, 2008, pages 18‐19, 43, 76‐77, 90‐91.

Massachusetts Gross Gaming Revenue Projections 76
Figure 96: Historical capital investment and GGR for the New Jersey gaming industry
Source: New Jersey Casino Control Commission
The chart (adjusted for inflation by using the Producer Price Index) shows that, with the exception of the post‐2006 period, capital investment and GGR grew in tandem. This clearly illustrates (over a 31 year period) that capital investment and GGR performance are closely, and positively, correlated.
As a direct result of intensive capital investment, through 2009, the Atlantic City gaming industry, with 11 casino‐hotels, had estimated direct employment exceeding 38,00019. This translates into an average of more than 3,500 employees per casino‐hotel. As a comparative, gaming facilities with limited gaming and non‐gaming amenities in Pennsylvania had an average of only 886 employees per gaming facility20.
In summary, we believe that better capitalized gaming facilities benefit patrons, local communities, the State, and operators by generated relatively more GGR and consequently more employment which has many profound direct and indirect effects (i.e. creating other indirect jobs, wages and taxes, and discretionary income, among many other benefits, as a result).
19 New Jersey Casino Control Commission. 20 Pennsylvania Gaming Control Board 2008 Annual Report, http://www.pgcb.state.pa.us/files/communications/2008_PGCB_Annual_Report.pdf (accessed March 25, 2010)
$0
$1,000
$2,000
$3,000
$4,000
$5,000
$6,000
$0
$5,000
$10,000
$15,000
$20,000
$25,000
1978
1980
1982
1984
1986
1988
1990
1992
1994
1996
1998
2000
2002
2004
2006
2008
Annu
al gross gam
ing revenu
e in m
illions
Cumulate capital investm
ent in millions
Cumulative cap‐ex (inflation adjusted)
GGR

Massachusetts Gross Gaming Revenue Projections 77
About This Report
This report was prepared by Spectrum Gaming Group, an independent research and professional services firm founded in 1993 that serves government agencies and private clients worldwide. Our principals have backgrounds in operations, economic analysis, law enforcement, regulation and journalism.
Spectrum holds no beneficial interest in any casino operating companies or gaming equipment manufacturers or suppliers. We employ only senior‐level executives and associates who have earned reputations for honesty, integrity and the highest standards of professional conduct. Our work is never influenced by the interests of past or potentially future clients.
Each Spectrum project is customized to our client’s specific requirements and developed from the ground up. Our findings, conclusions and recommendations are based solely on our research, analysis and experience. Our mandate is not to tell clients what they want to hear; we tell them what they need to know. We will not accept, and have never accepted, engagements that seek a preferred result.
Recent public‐sector clients include the Massachusetts Office of Housing and Economic Development, the Connecticut Division of Special Revenue, the Delaware Lottery Commission, the Maryland Lottery Commission, Broward County (FL), the West Virginia Lottery Commission, the New Jersey Casino Reinvestment Development Authority, the Atlantic City Convention and Visitors Authority, the Singapore Ministry of Home Affairs, Rostov Oblast (Russia) and the Puerto Rico Tourism Company. Recent private‐sector clients include Harrah’s Entertainment, Morgan Stanley, Wynn Resorts, the Pokagon Band of Potawatomi Indians, and the Seneca Nation of Indians.
We maintain a network of leading experts in all disciplines relating to the gaming industry, and we do this through our offices in Atlantic City, Bangkok, Guangzhou, Harrisburg, Hong Kong, Las Vegas, Macau, Manila and Tokyo.
Disclaimer
Spectrum Gaming Group (“Spectrum,” “we” or “our”) has made every reasonable effort to ensure that the data and information contained in this study reflect the most accurate and timely information possible. The data are believed to be generally reliable. This study is based on estimates, assumptions, and other information developed by Spectrum from its independent research effort, general knowledge of the gaming industry, and consultations with the Client and its representatives. Spectrum shall not be responsible for any inaccuracies in reporting by the Client or its agents and representatives, or any other data source used in preparing or presenting this study.

Massachusetts Gross Gaming Revenue Projections 78
The data presented in this study were collected through the cover date of this report. Spectrum has not undertaken any effort to update this information since this time.
Some significant factors that are unquantifiable and unpredictable – including, but not limited to, economic, governmental, managerial and regulatory changes; and acts of nature – are qualitative by nature, and cannot be readily used in any quantitative projections.
No warranty or representation is made by Spectrum that any of the projected values or results contained in this study will actually be achieved. We shall not be responsible for any deviations in the project’s actual performance from any predictions, estimates, or conclusions contained in this study.
Possession of this study does not carry with it the right of publication thereof, or the right to use the name of Spectrum Gaming Group in any manner without first obtaining the prior written consent of Spectrum. No abstracting, excerpting, or summarizing of this study may be made without first obtaining the prior written consent of Spectrum.
This study may not be used in conjunction with any public or private offering of securities or other similar purpose where it may be relied upon to any degree by any person other than the Client, without first obtaining the prior written consent of Spectrum. This study may not be used for any purpose other than that for which it is prepared or for which prior written consent has first been obtained from Spectrum.
This study is qualified in its entirety by, and should be considered in light of, these limitations, conditions and considerations.